Charting brain growth and aging at high spatial precision
- Donders Institute for Brain, Cognition, and Behavior, Radboud University, Netherlands
- Department of Cognitive Neuroscience, Radboud University Medical Center, Netherlands
- Department of Psychiatry, University of Michigan, United States
- Department of Psychiatry, Utrecht University Medical Center, Netherlands
- Department of Psychology, University of Oslo, Norway
- Norwegian Center for Mental Disorders Research (NORMENT), University of Oslo, and Oslo University Hospital, Norway
- Department of Psychological Medicine, Institute of Psychiatry, Psychology and Neuroscience, King’s College London, United Kingdom
- Centre for Medical Image Computing, Medical Physics and Biomedical Engineering, University College London, United Kingdom
- Dementia Research Centre, UCL Queen Square Institute of Neurology, United Kingdom
- The Medical Investigation of Neurodevelopmental Disorders (MIND) Institute and Department of Psychiatry and Behavioral Sciences, UC Davis School of Medicine, University of California, Davis, United States
- Amsterdam UMC, Vrije Universiteit, Psychiatry, Amsterdam Public Health Research Institute, Netherlands
- GGZ inGeest, Amsterdam Neuroscience, Netherlands
- Centre for Youth Mental Health, University of Melbourne, Australia
- Orygen Youth Health, Australia
- National Institute for Health Research Mental Health Biomedical Research Centre, South London and Maudsley National Health Service Foundation Trust and King’s College London, United Kingdom
- Department of Psychosis Studies, Institute of Psychiatry, King’s College London, United Kingdom
- Department of Psychiatry, Amsterdam UMC, Location AMC, Netherlands
- Department of Psychiatry, Radboud University Medical Center, Netherlands
- Department of Psychology, Michigan State University, United States
- Department of Psychology, University of Michigan, United States
- KG Jebsen Centre for Neurodevelopmental Disorders Research, Institute of Clinical Medicine, University of Oslo, Norway
- Centre for Affective Disorders at the Institute of Psychiatry, King's College London, United Kingdom
- Centre for Functional MRI of the Brain (FMRIB), Nuffield Department of Clinical Neurosciences, Wellcome Centre for Integrative Neuroimaging, University of Oxford, United Kingdom
Figures
Figure 1
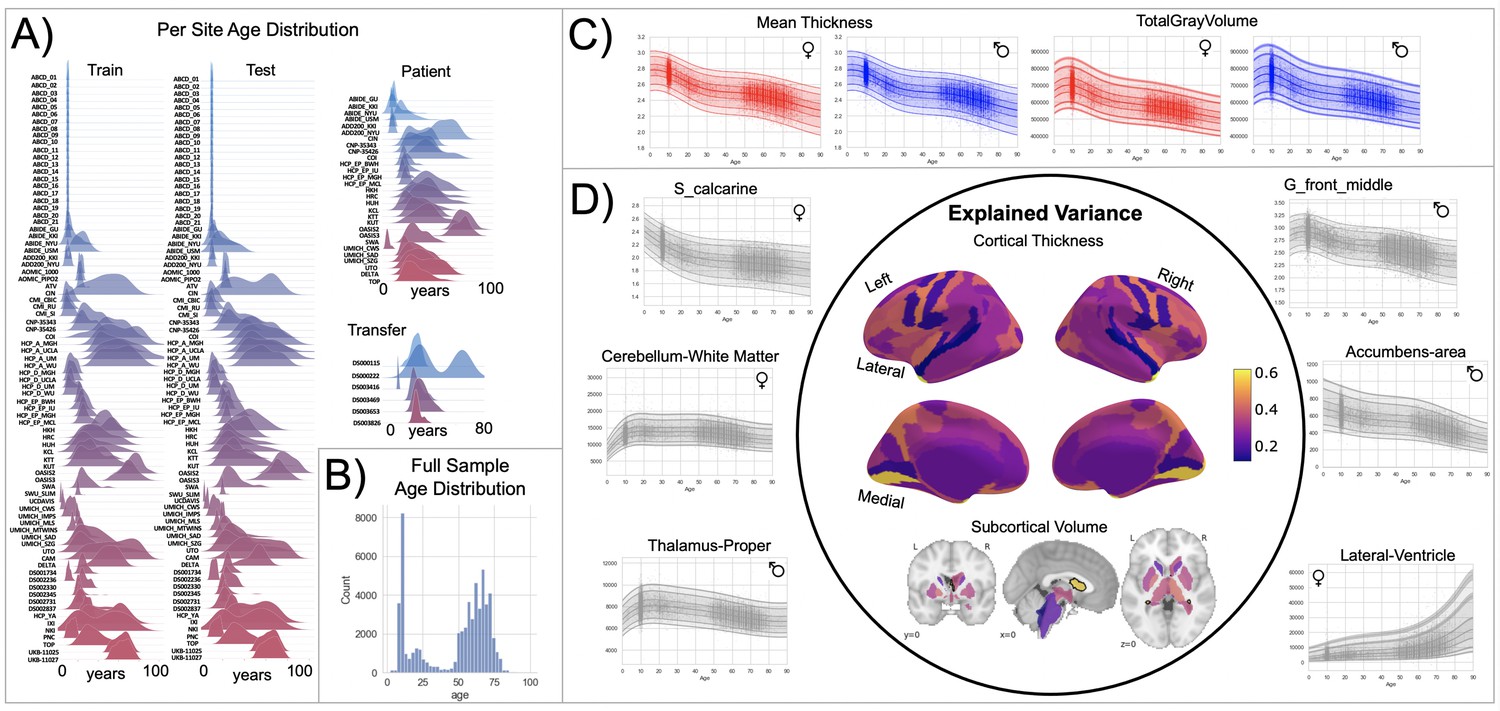
Normative model overview.
(A) Age density distribution (x-axis) of each site (y-axis) in the full model train and test, clinical, and transfer validation set. (B) Age count distribution of the full sample (N=58,836). (C, D) Examples of lifespan trajectories of brain regions. Age is shown on x-axis and predicted thickness (or volume) values are on the y-axis. Centiles of variation are plotted for each region. In (C), we show that sex differences between females (red) and males (blue) are most pronounced when modeling large-scale features such as mean cortical thickness across the entire cortex or total gray matter volume. These sex differences manifest as a shift in the mean in that the shape of these trajectories is the same for both sexes, as determined by sensitivity analyses where separate normative models were estimated for each sex. The explained variance (in the full test set) of the whole cortex and subcortex is highlighted inside the circle of (D). All plots within the circle share the same color scale. Visualizations for all ROI trajectories modeled are shared on GitHub for users that wish to explore regions not shown in this figure.
Figure 2
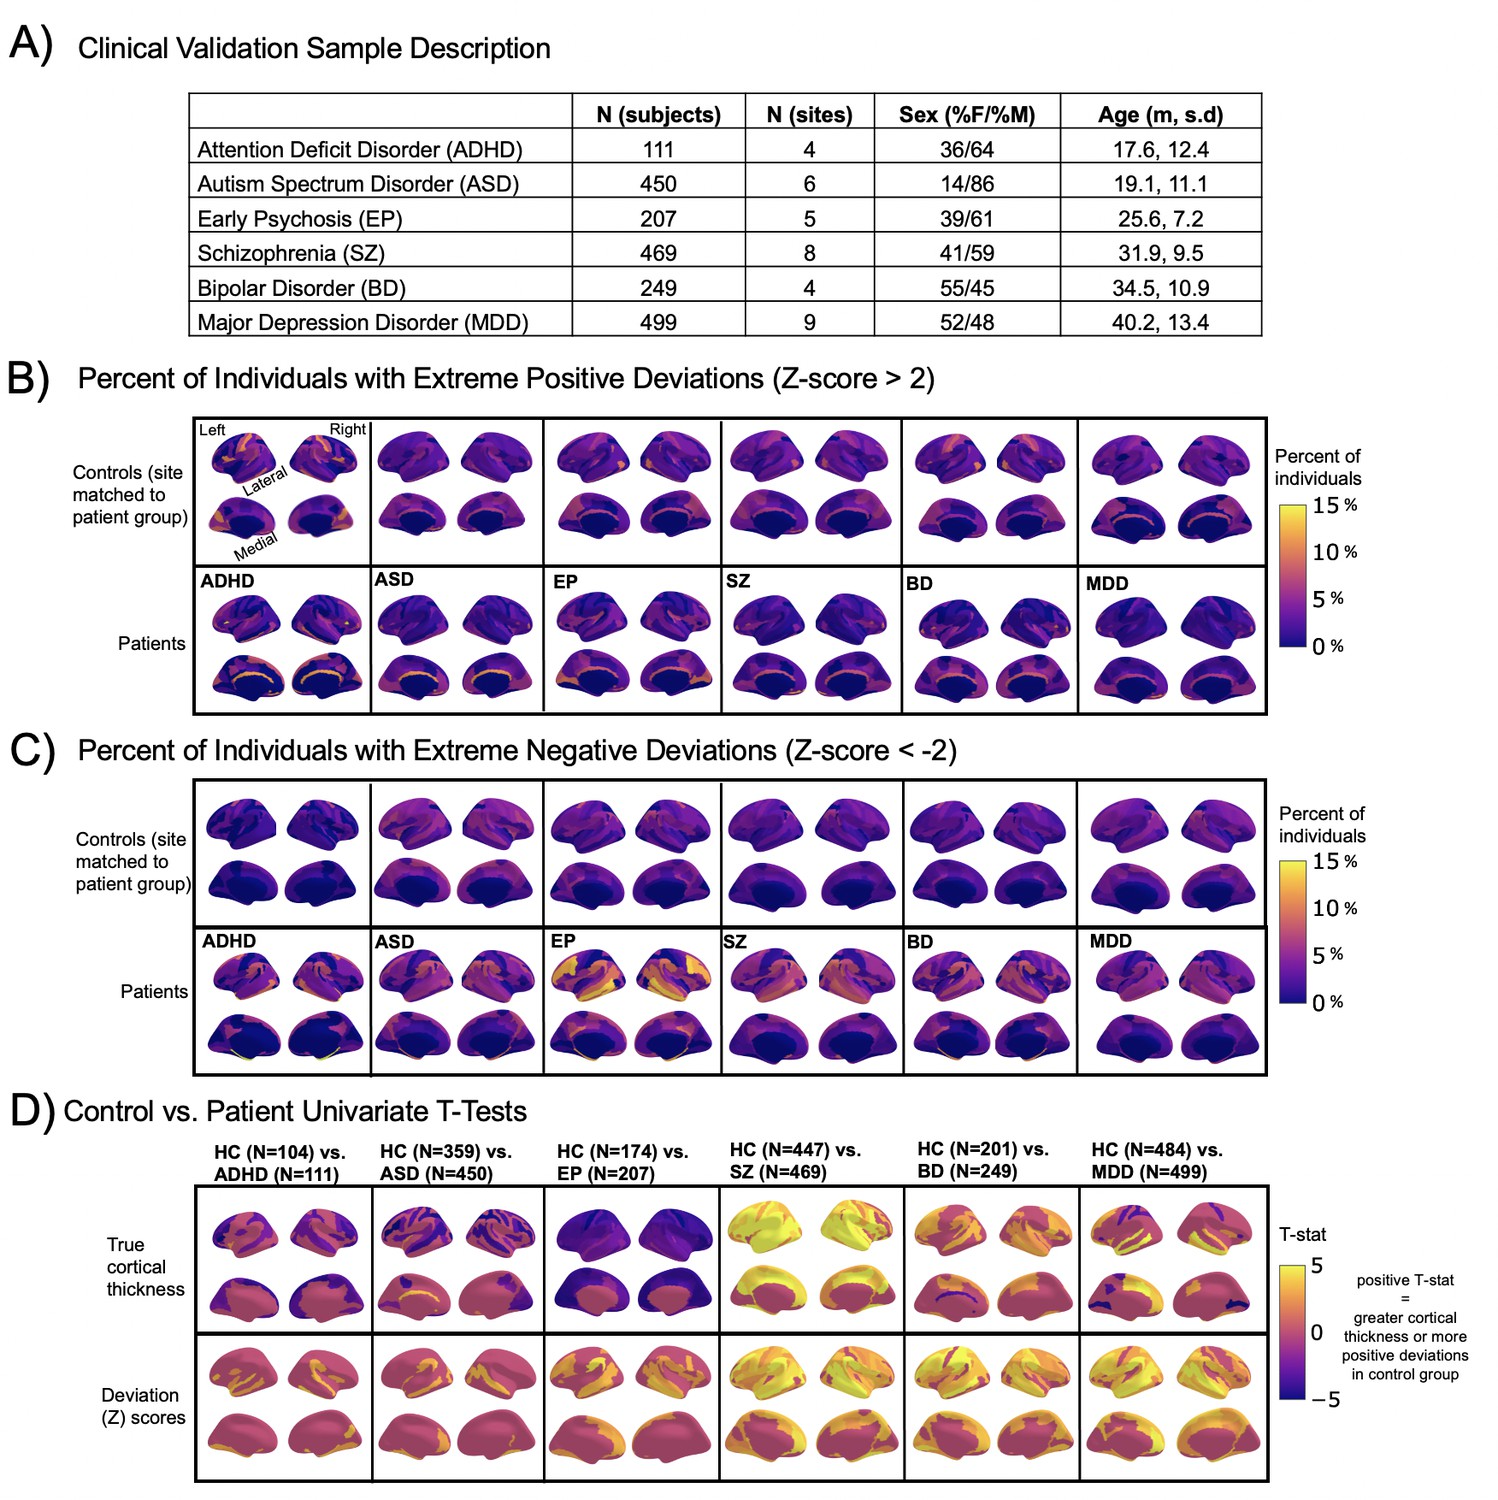
Normative modeling in clinical cohorts.
Reference brain charts were transferred to several clinical samples (described in (A)). Patterns of extreme deviations were summarized for each clinical group and compared to matched control groups (from the same sites). (B) Shows extreme positive deviations (thicker/larger than expected) and (C) shows the extreme negative deviation (thinner/smaller than expected) patterns. (D) Shows the significant (FDR corrected p<0.05) results of classical case-control methods (mass-univariate t-tests) on the true cortical thickness data (top row) and on the deviations scores (bottom row). There is unique information added by each approach which becomes evident when noticing the maps in (B–D) are not identical. ADHD, attention-deficit hyperactive disorder; ASD, autism spectrum disorder; BD, bipolar disorder; EP, early psychosis; FDR, false discovery rate; MDD, major depressive disorder; SZ, schizophrenia.
Figure 3 with 3 supplements
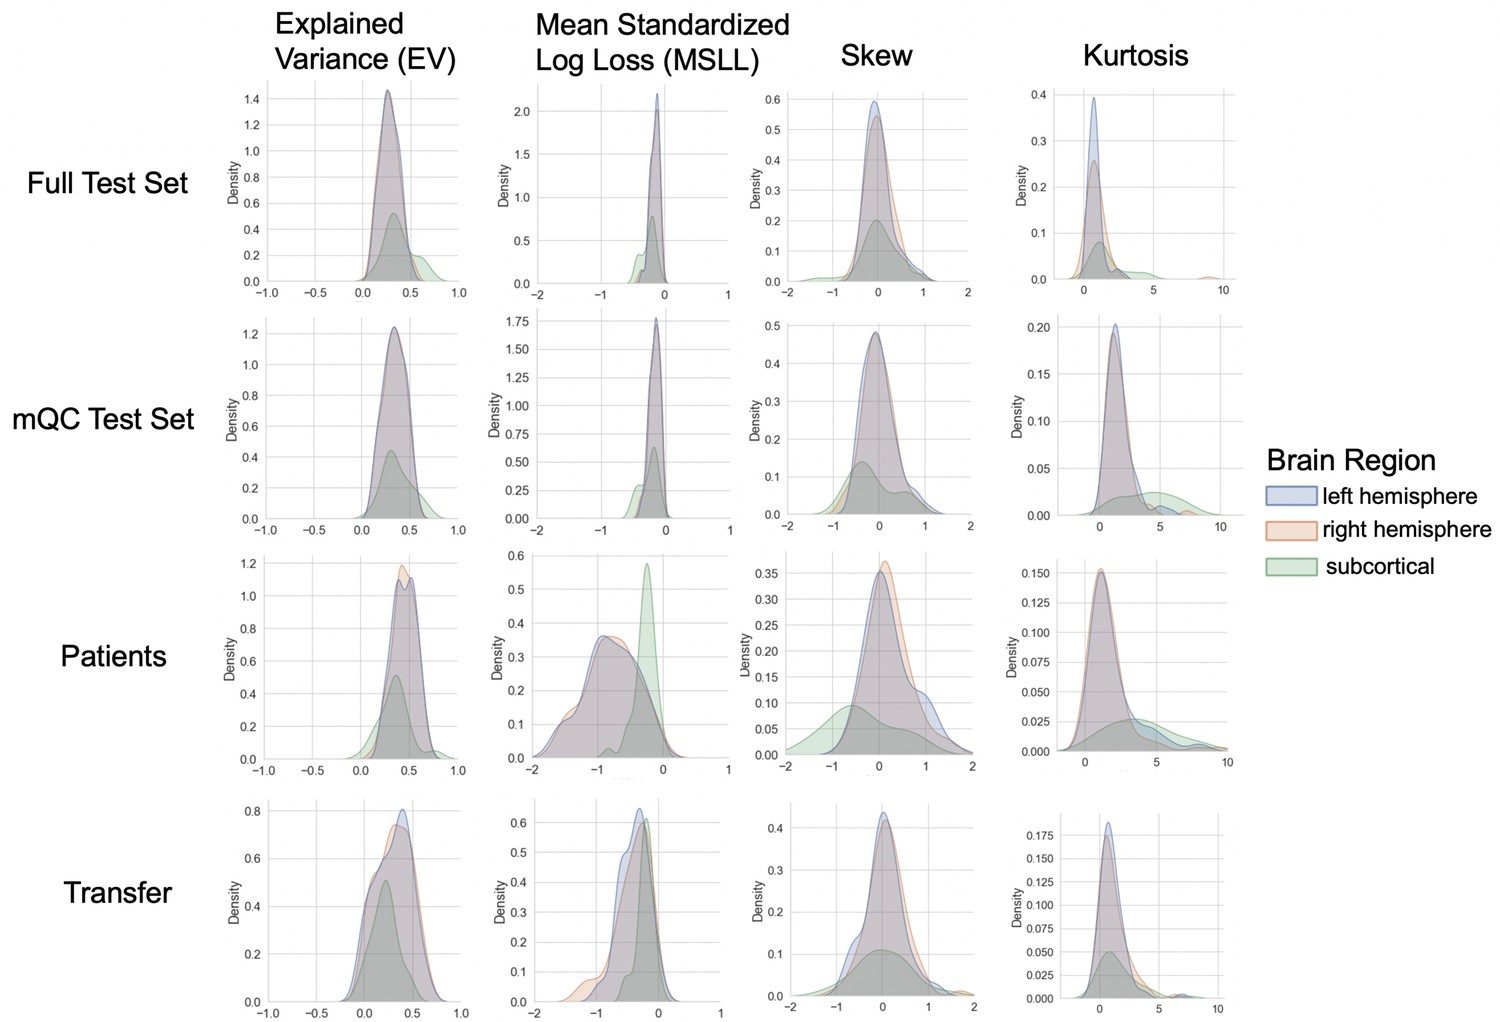
Evaluation metrics across all test sets.
The distribution of evaluation metrics in four different test sets (full, mQC, patients, and transfer, see Materials and methods) separated into left and right hemispheres and subcortical regions, with the skew and excess kurtosis being measures that depict the accuracy of the estimated shape of the model, ideally both would be around zero. Note that kurtosis is highly sensitive to outlying samples. Overall, these models show that the models fit well in term of central tendency and variance (explained variance and MSLL) and model the shape of the distribution well in most regions (skew and kurtosis). Code and sample data for transferring these models to new sites not included in training is shared.
Figure 3—figure supplement 1
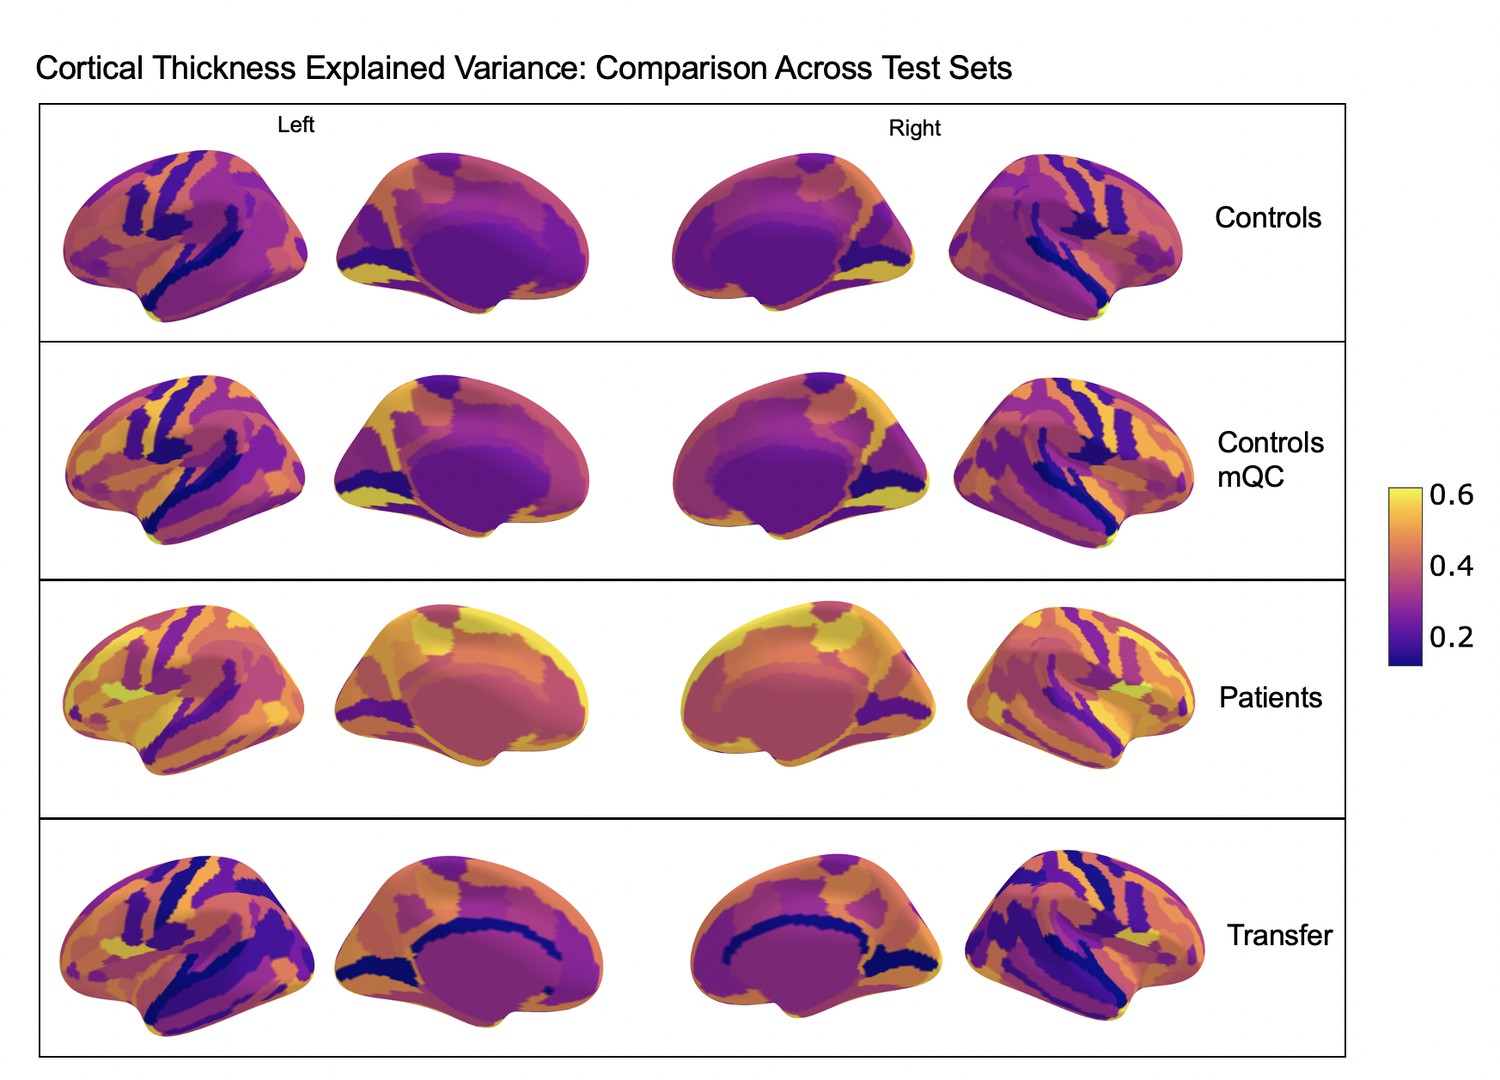
Comparison of the explained variance in cortical thickness across the different test sets.
The patterns appear to be robust and consistent across the different test sets.
Figure 3—figure supplement 2
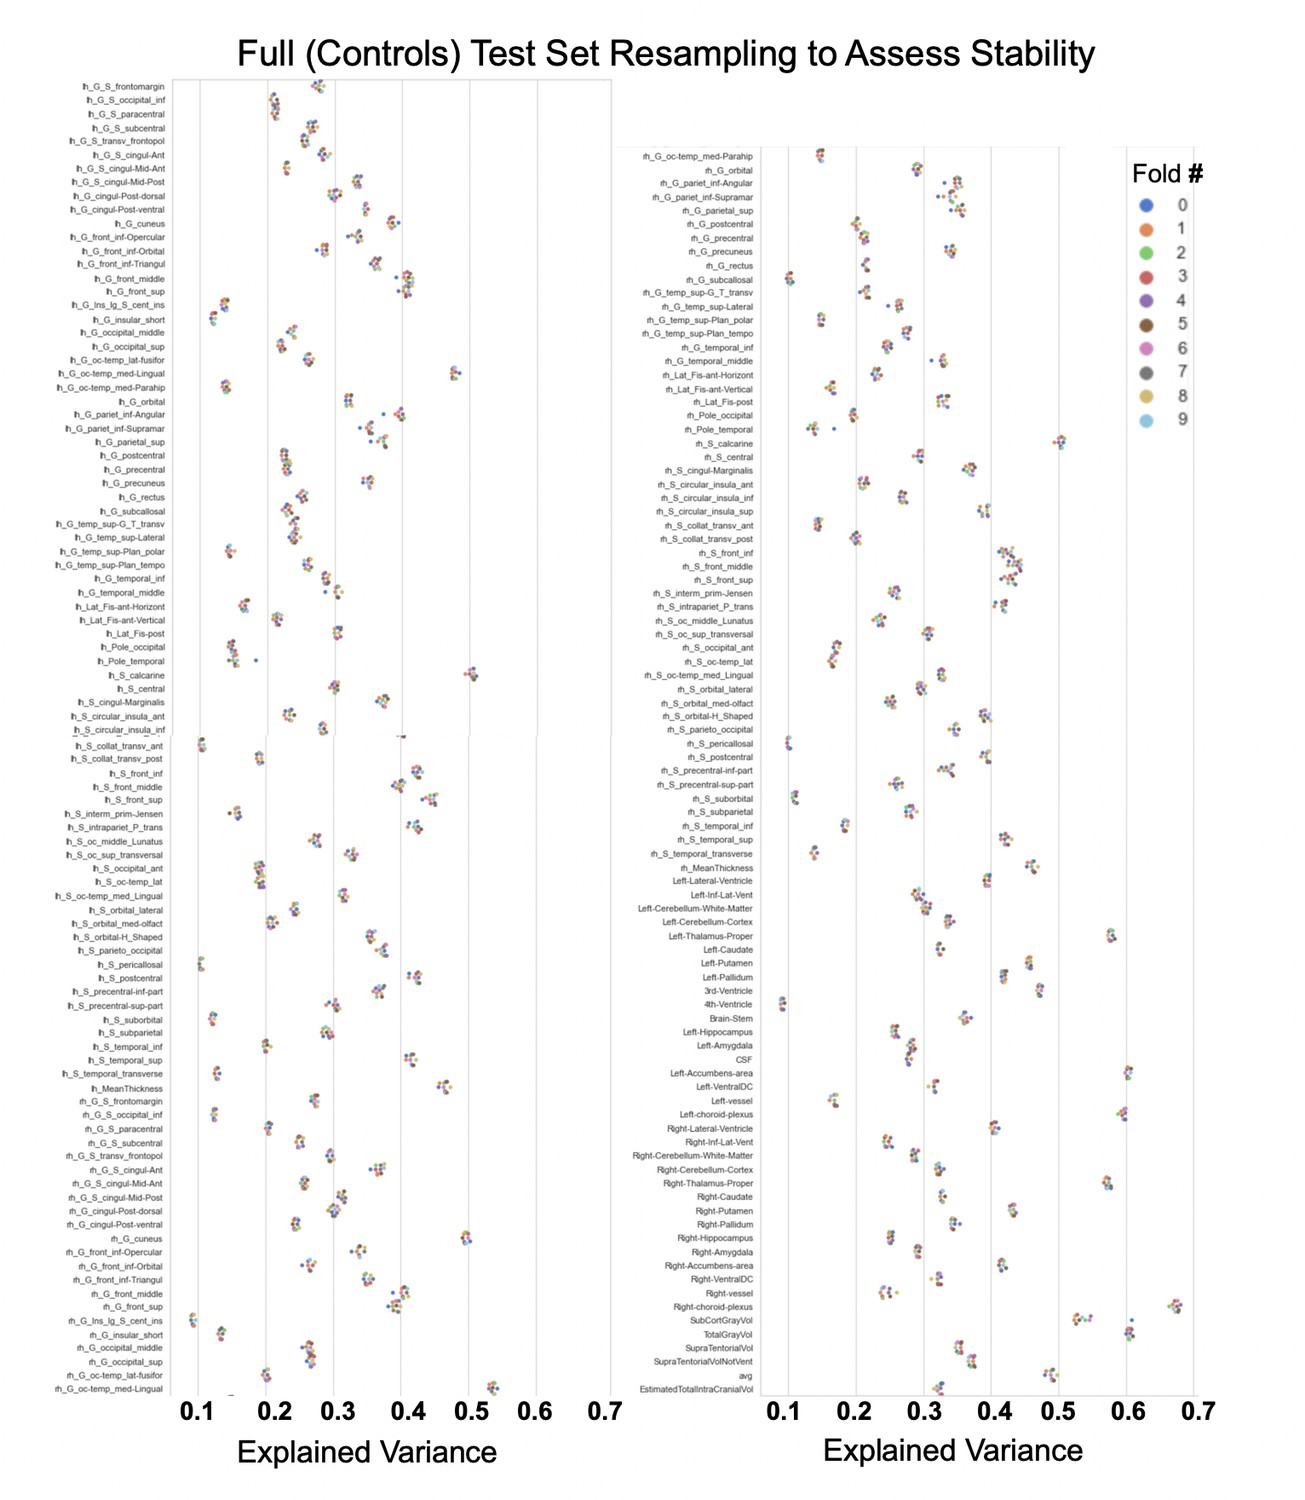
Showing the explained variance for each brain region across 10 randomized resampling of the full control test set.
Figure 3—figure supplement 3
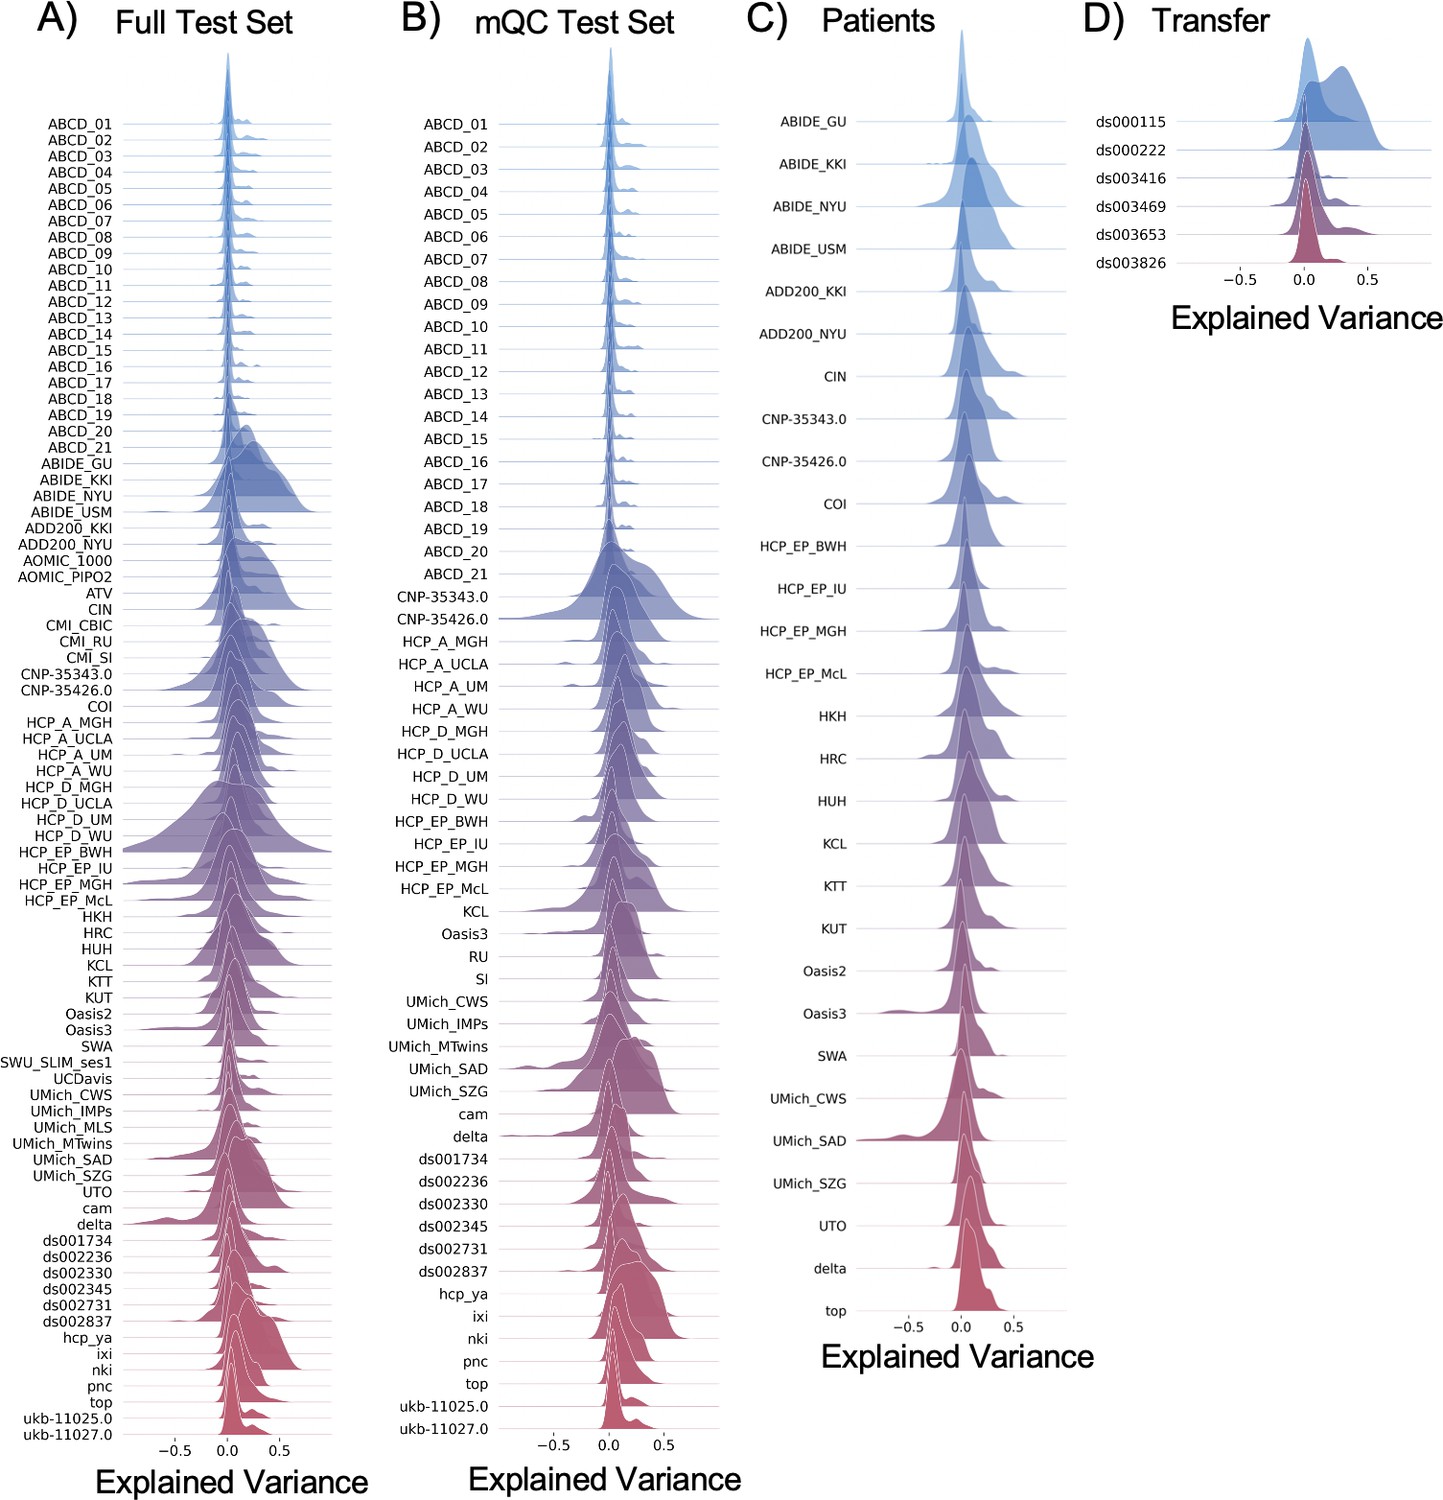
Per site explained variance across the different test sets.
Author response image 1
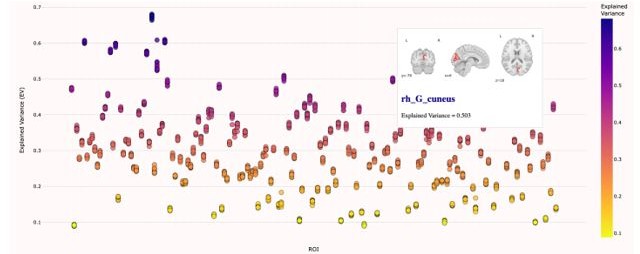
Example of the online interactive visualizations created to help interpret the evaluation metrics.
This interactive figure was created for each evaluation metric (EV, MSLL, skew, and kurtosis) and all test sets (full controls, mQC controls, clinical, and transfer).
Videos
Video 1
"Demonstation of the functionality of our interactive online visualization tool (https://brainviz-app.herokuapp.com/) that is available for all evaluation metrics across all test sets.
The code for creating this website can be found on GitHub (https://github.com/saigerutherford/brainviz-app; copy archived at swh:1:rev:021fff9a48b26f2d07bbb4b3fb92cd5202418905; Rutherford, 2022b).
Tables
Table 1
Sample description and demographics.
mQC refers to the manual quality checked subset of the full sample. ‘All’ rows=Train+Test. Clinical refers to the transdiagnostic psychiatric sample (diagnostic details in Figure 2A).
| N (subjects) | N (sites) | Sex (%F/%M) | Age (Mean, S.D) | ||
|---|---|---|---|---|---|
| Full | All | 58,836 | 82 | ||
| Training set | 29,418 | 82 | 51.1/48.9 | 46.9, 24.4 | |
| Test set | 29,418 | 82 | 50.9/49.1 | 46.9, 24.4 | |
| mQC | All | 24,354 | 59 | ||
| Training set | 12,177 | 59 | 50.2/49.8 | 30.2, 24.1 | |
| Test set | 12,177 | 59 | 50.4/49.4 | 30.1, 24.2 | |
| Clinical | Test set | 1985 | 24 | 38.9/61.1 | 30.5, 14.1 |
| Transfer | Test set | 546 | 6 | 44.5/55.5 | 24.8, 13.7 |
Additional files
-
Supplementary file 1
Full Sample Description, per site, in the train, test, and clinical validation sets.
- https://cdn.elifesciences.org/articles/72904/elife-72904-supp1-v2.docx
-
Supplementary file 2
Manual Quality Checked (mQC) Sample Description, per site, train and test sets.
- https://cdn.elifesciences.org/articles/72904/elife-72904-supp2-v2.docx
-
Supplementary file 3
Transfer Test Set Sample Descriptions, per site.
Data were downloaded from https://openneuro.org/ (Markiewicz et al., 2021) and are shared on GitHub along with code to transfer to demonstrate how to re-use models on new data.
- https://cdn.elifesciences.org/articles/72904/elife-72904-supp3-v2.docx
-
Transparent reporting form
- https://cdn.elifesciences.org/articles/72904/elife-72904-transrepform1-v2.pdf
Download links
A two-part list of links to download the article, or parts of the article, in various formats.
Downloads (link to download the article as PDF)
Open citations (links to open the citations from this article in various online reference manager services)
Cite this article (links to download the citations from this article in formats compatible with various reference manager tools)
Charting brain growth and aging at high spatial precision
eLife 11:e72904.
https://doi.org/10.7554/eLife.72904


