Experimental evidence that uniformly white sclera enhances the visibility of eye-gaze direction in humans and chimpanzees
- Centre for the Advanced Study of Collective Behaviour, University of Konstanz, Germany
- Kumamoto Sanctuary, Kyoto University, Japan
- Max Planck Institute of Animal Behavior, Germany
- Messerli Research Institute, University of Veterinary Medicine Vienna, Austria
- Japan Society for the Promotion of Science (JSPS), Japan
- Primate Research Institute, Kyoto University, Japan
Figures
Figure 1

Experimental stimuli and procedures.
(A) Experimental stimuli used in this study. Stimuli consisted of chimpanzee and human eye images with direct and averted (20°) gaze in normal and reversed contrast polarities. The stimulus levels varied according to the brightness and size of stimuli (L1–4), with L1 being the brightest and largest and L4 being the most shaded and smallest. Permission was obtained to publish the human image (this image was only for presentation purposes; not used in this study but edited following the methods used in this study; see Egger et al., 2011 for the stimuli used in the study). (B) Schematics for the tests with human and chimpanzee participants. Participants of both species were presented with the stimuli of both species. In each trial, human participants indicated the gaze direction of each stimulus face by a keypress (left/front/right), and chimpanzee participants indicated the averted gaze face among the two direct gaze faces by a touch response. (C) Experimental setup for chimpanzees.
Figure 2
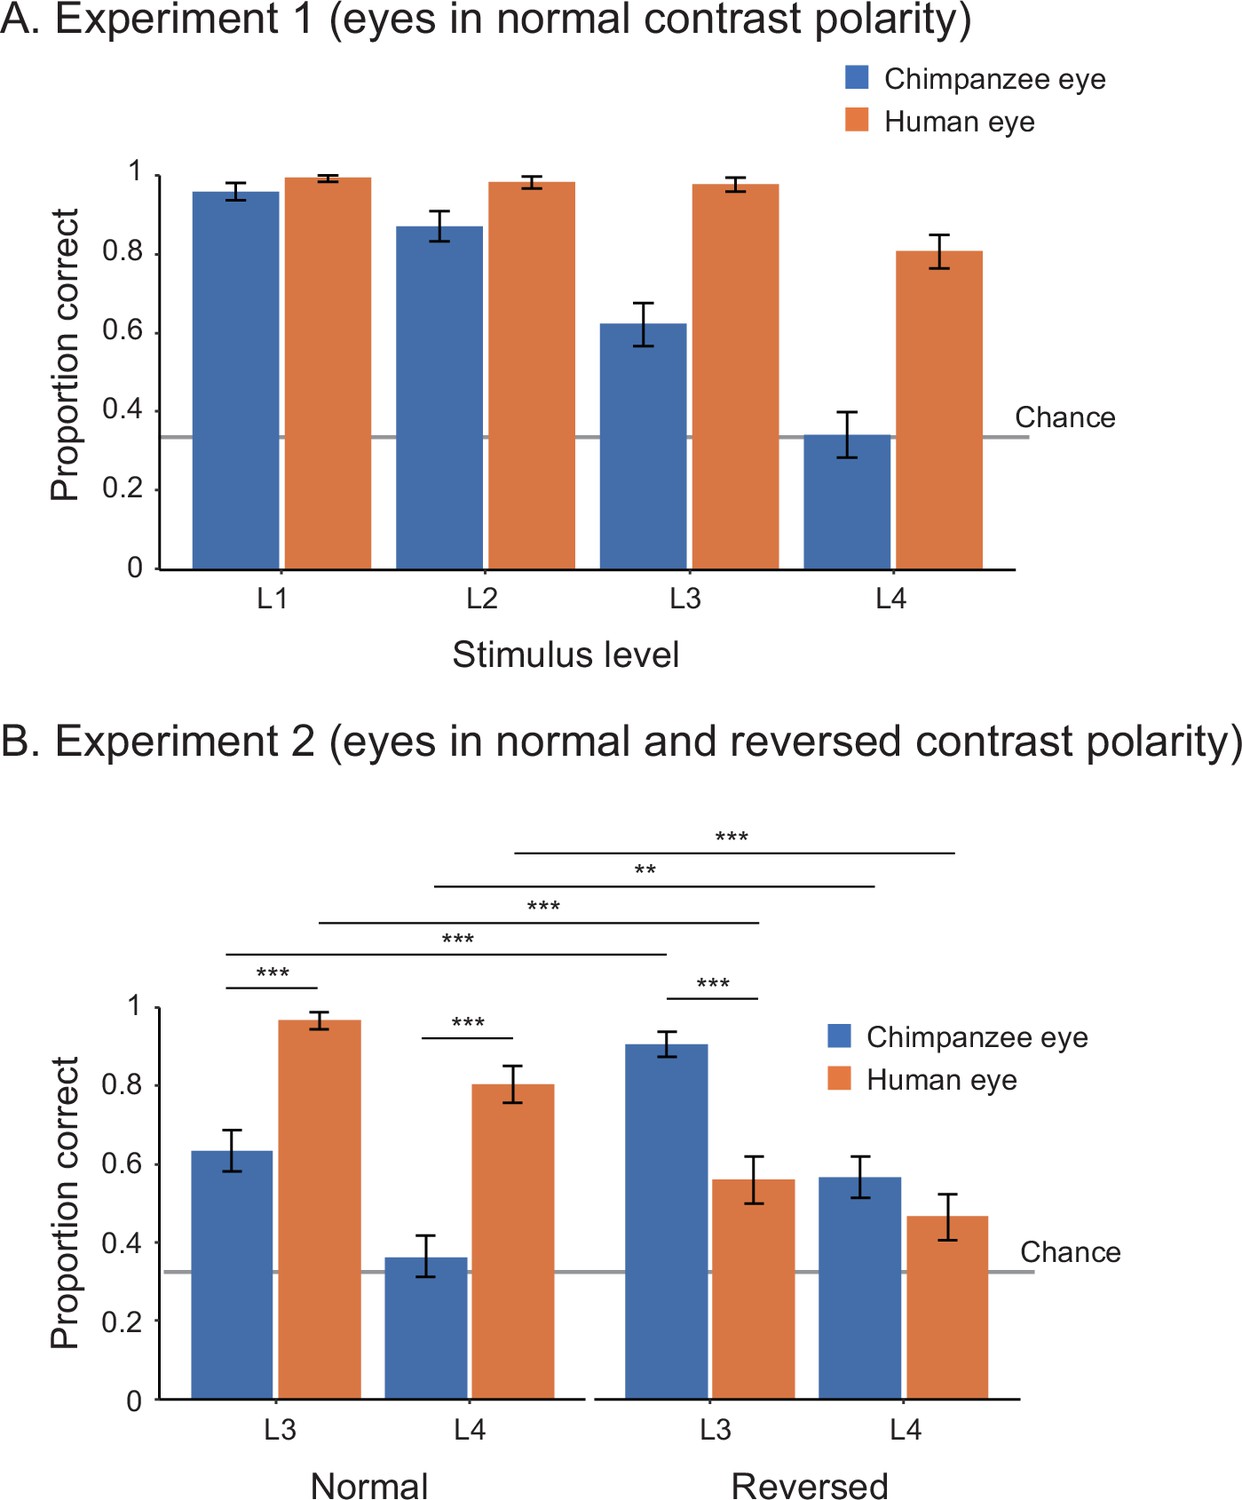
Performance of human participants in Study 1, represented as mean proportion correct in experiments 1 (A) and 2 (B).
L1–4 indicate the stimulus level, with L1 being the brightest and largest and L4 being the most shaded and smallest. Error bars are 95% confidence intervals based on a nonparametric bootstrap. Asterisks indicate significance in the post-hoc models ran for Experiment 2 (***p<0.001, **p<0.01).
Figure 3
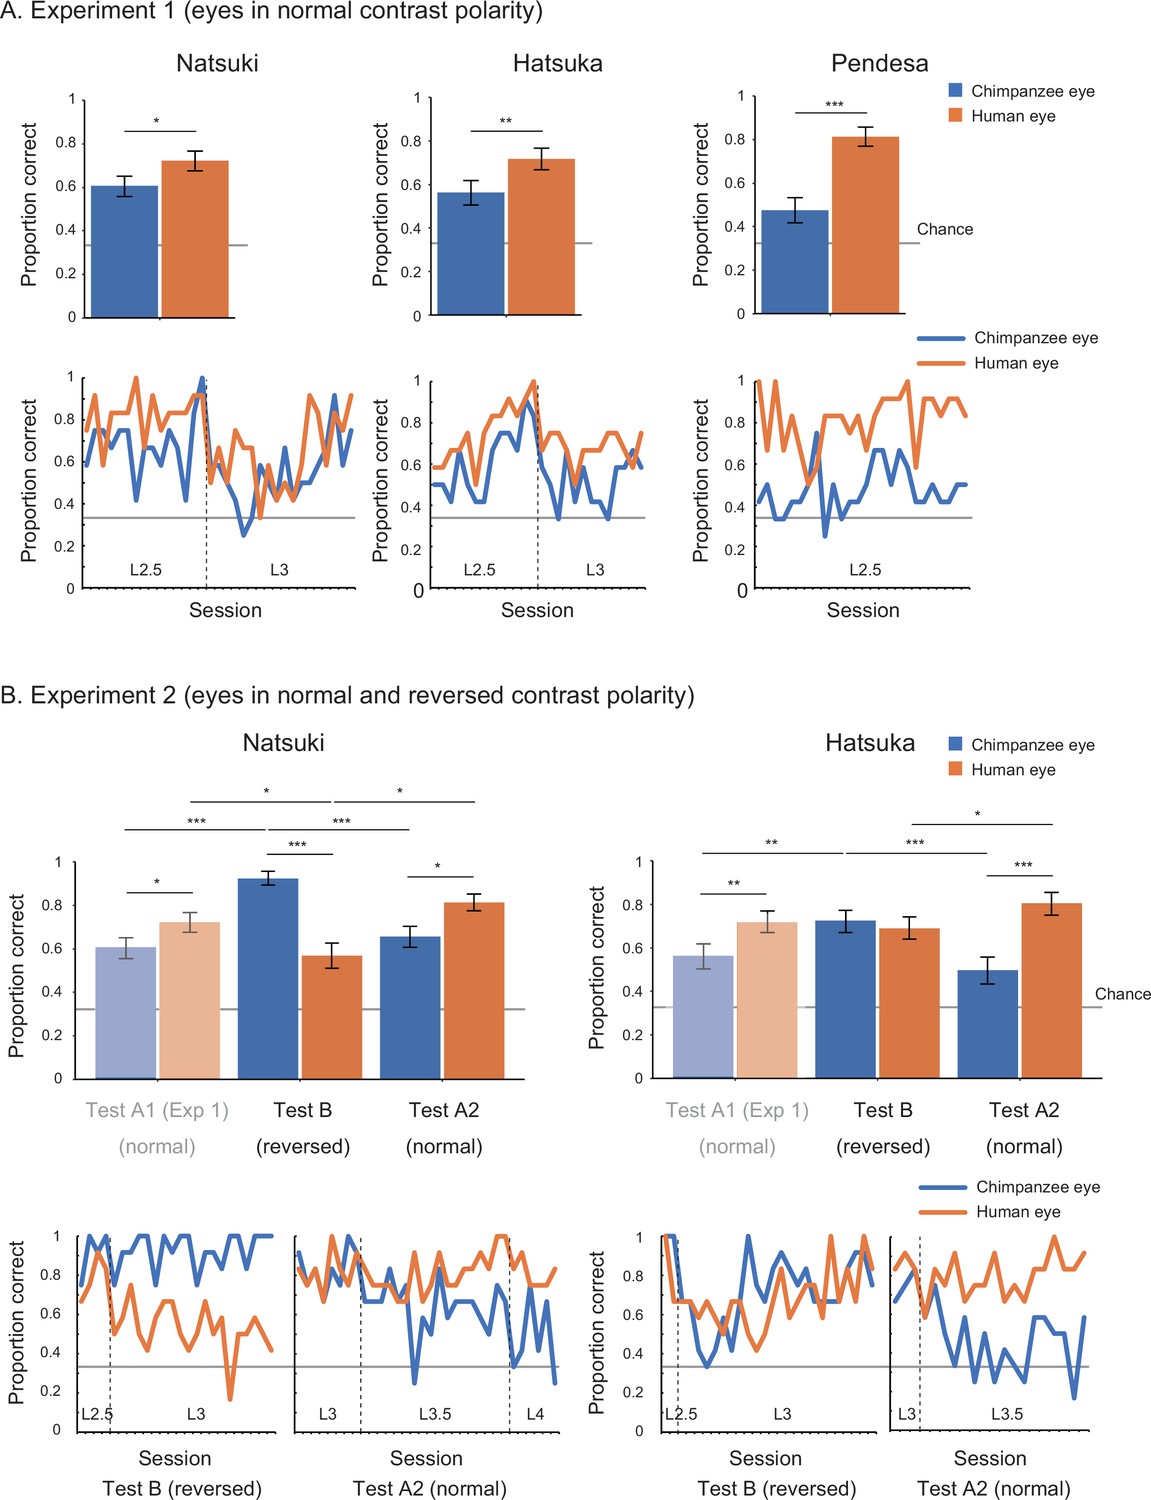
Performance of chimpanzee participants (Natsuki, Hatsuka, and Pendesa) in Study 2, represented as mean proportion correct calculated from all sessions (bar graphs) and each session (line graphs).
Participants were tested in the ABA design. Specifically, Experiment 1 (A) presented eye images with normal contrast polarity (also termed Test A1), and Experiment 2 (B) presented eye images with reversed contrast polarity (Test B) and then those having normal contrast polarity (Test A2). The bar graphs of Experiment 2 repeat the same bar graphs of Experiment 1 (with their colors toned down) to aid comparisons in the ABA design. Dotted lines in line graphs denote the increment of stimulus level. Recall that the stimulus level varied between L1 and 4 in our stimuli, with L1 being the brightest and largest and L4 being the most shaded and smallest. Error bars in bar graphs are 95% confidence intervals based on a nonparametric bootstrap. Asterisks indicate significance in Experiment 1 and the post-hoc models ran for Experiment 2 (***p<0.001, **p<0.01, *p<0.05; these significance levels were corrected for the number of individuals in each experiment).
Appendix 3—figure 1
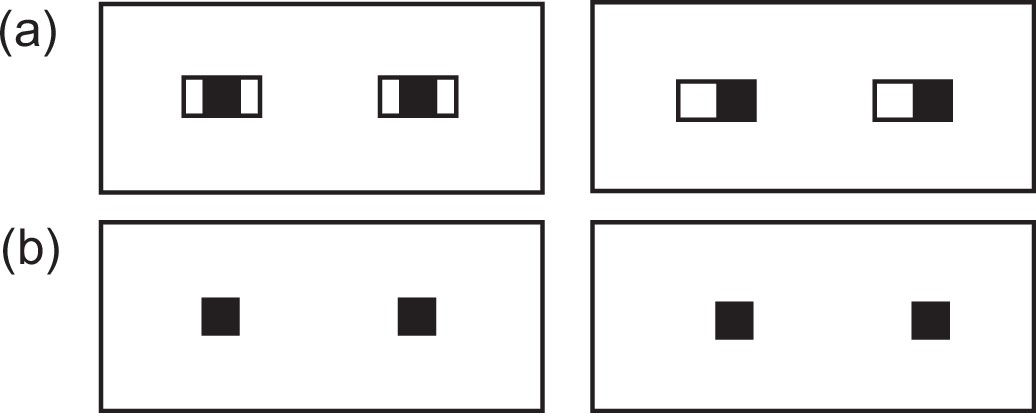
Schematic illustration of eyes when both iris and eye-outline edges are visible (A) and only iris is visible (B).
Note that eye-gaze direction is more clearly discernible when both features are visible compared to when only iris is visible (Kobayashi and Kohshima, 2001; Kano et al., 2021).
Appendix 3—figure 2

Quantification of eye color (A) and eye shape (B) in the stimuli.
Color difference was quantified as the Euclidean distance between the two CIELAB colors √(〖(L1-L2)〗^2+〖(a1-a2)〗^2+〖(b1-b2)〗^2 ), following a previous study (Kano et al., 2021). The colors of the iris and sclera were the means of CIELAB colors of all pixels respectively in the iris and sclera regions of interest (ROI). The iris-sclera color difference was the difference between those two means. The color brightness of the iris and sclera was the difference between the mean of each color and the black (L = 0, a = 0, b = 0). The iris-sclera color difference did not significantly differ between the stimulus species in either normal or inverted color (t-test; normal: t18 = 0.26, p=0.80, d = 0.12; inverted: t18 = 0.39, p=0.70, d = 0.17). The eye shape was evaluated using the Sclera Size Index (SSI), calculated as the longest length of eye-opening divided by the iris diameter (Kobayashi and Kohshima, 2001). The human eye was horizontally longer than the chimpanzee eye, as indicated by higher SSI (t18 = 11.34, p<10-3, d = 5.07). We also measured the area size of the sclera in the human and chimpanzee eye as the number of pixels in the sclera ROI. The area size did not significantly differ between the stimulus species (t18 = 1.08, p=0.29, d = 0.48). These statistical comparisons were performed using the full stimulus set used for Study 1 (20 images), but the same results were obtained using the stimulus set used for Study 2 (12 images).
Appendix 3—figure 3

Stimulus preparation.
To create the facial images with averted gaze, we first cropped the eyeball part of each face with a direct gaze and then shifted it 6 pixels to the side (this corresponded to the rotation of the eyeball of about 20° in both stimulus species). We then filled the blank areas in the shifted eye by copying the sclera colors of the original image. To create the facial images with reversed contrast polarity, we first cropped the eyeball part of each face (with both direct and averted gaze) and then inverted its lightness component while keeping its chromatic component unchanged. Permission was obtained to publish the human image (this image was only for presentation purposes; not used in this study but edited following the methods used in this study; see Egger et al., 2011 for the stimuli used in the study).
Appendix 3—figure 4
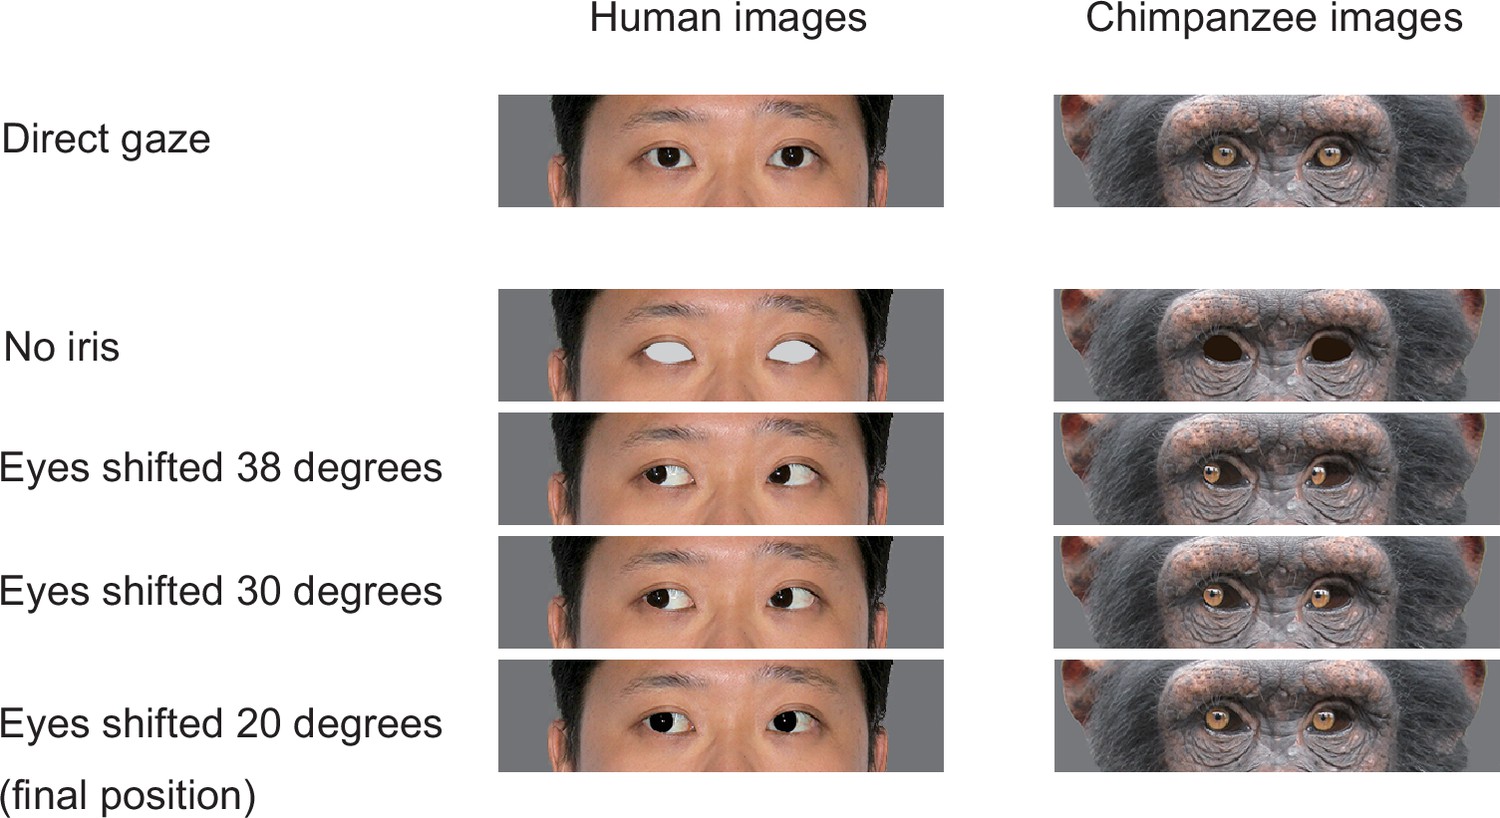
The stimuli used for training chimpanzee participants.
Chimpanzees were trained for the task in a step-by-step manner with training stage 1 presenting the target image with no iris with the distractor images with direct gaze, and training stages 2–4 presenting the target image in which the iris was positioned in 38°, 30°, and 20°, following the training procedure employed by a previous study (Tomonaga and Imura, 2010). Permission was obtained to publish the human image (this image was only for presentation purposes; not used in this study but edited following the methods used in this study; see Egger et al., 2011 for the stimuli used in the study).
Appendix 4—figure 1
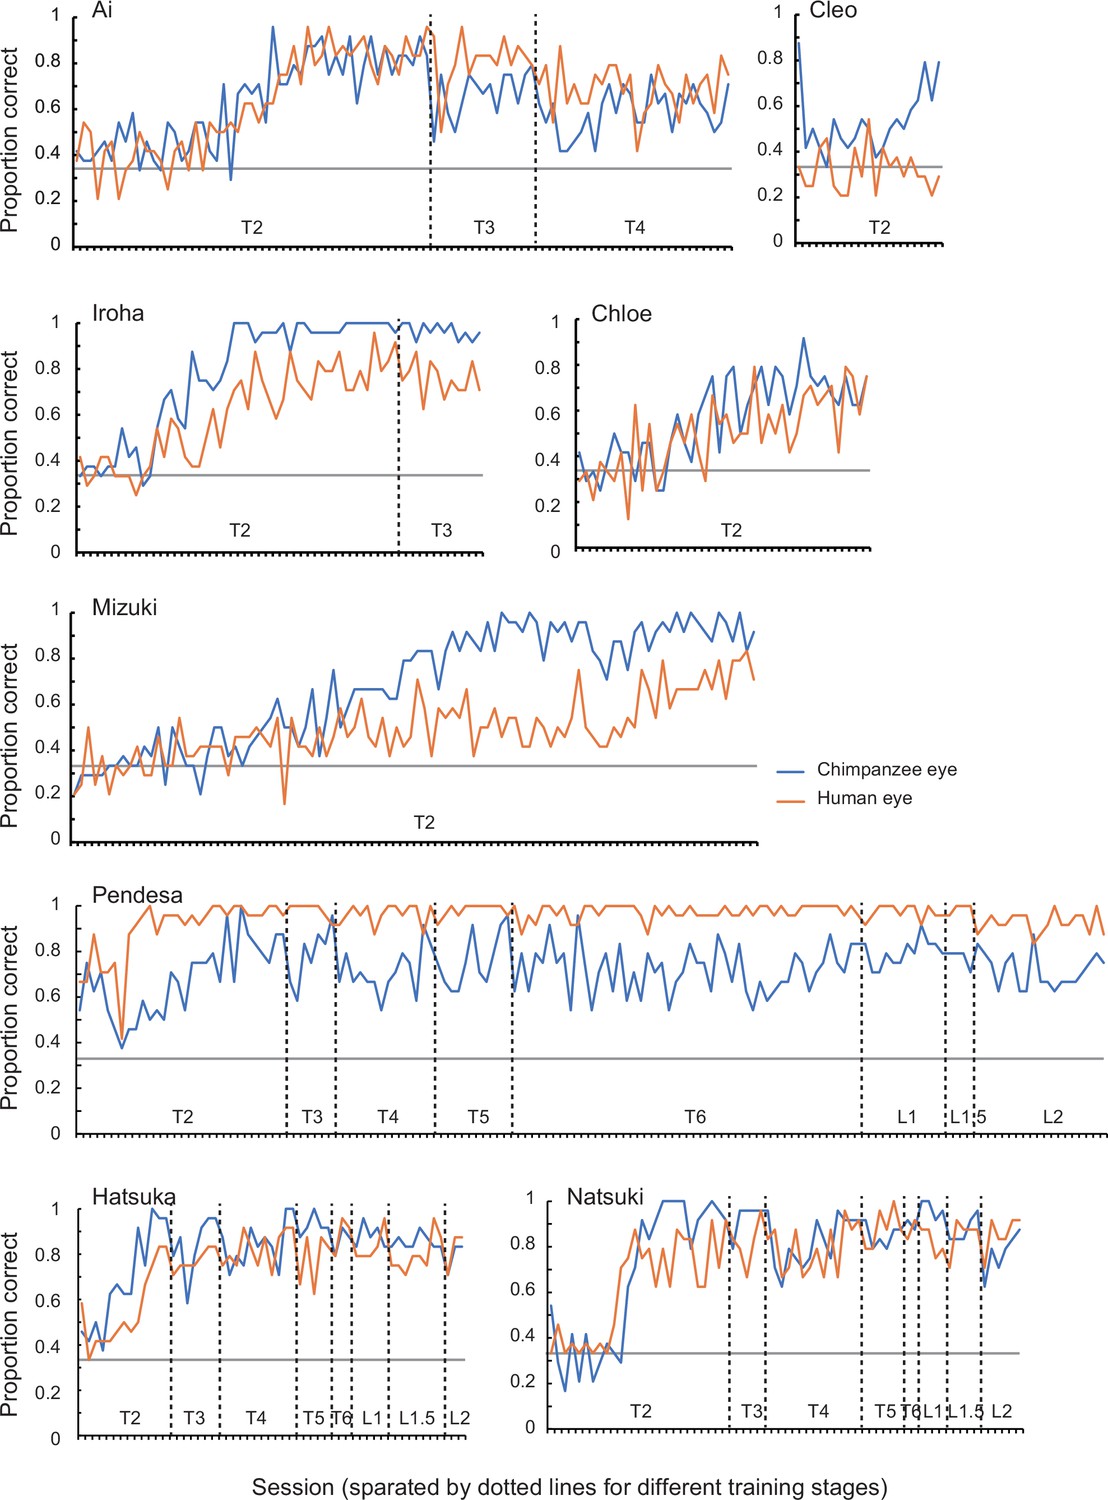
Performance of chimpanzee participants (Ai, Cleo, Chloe, Iroha, Mizuki, Natsuki, Hatsuka, and Pendesa) during training stages 2–6 (T1–6; T1 was not included in this graph because it was a pilot session presenting chimpanzees with the no-iris target stimuli) and pre-Test A1 sessions (L1–2), represented as raw proportion correct across sessions.
See Appendix 4—table 2 for the number of sessions required for each training and pre-Test A1 stage in each chimpanzee participant.
Tables
Table 1
Hypotheses predicting the effect of eye color and shape on the visibility of eye-gaze in chimpanzee and human participants.
| Hypothesis | Assumption | Participant | Eyes with normal contrast polarity | Eyes with reversed contrast polarity | ||
|---|---|---|---|---|---|---|
| Human eye | Chimpanzee eye | Human eye | Chimpanzee eye | |||
| H1 | Perceptual advantage of uniformly white sclera | Humans | + | – | – | + |
| Chimpanzees | + | – | – | + | ||
| H2 | Perceptual advantage of the iris-sclera color difference | Humans | ~ | ~ | ~ | ~ |
| Chimpanzees | ~ | ~ | ~ | ~ | ||
| H3 | Perceptual advantage of the horizontally elongated eye shape | Humans | + | – | + | – |
| Chimpanzees | + | – | + | – | ||
| H4 | Perceptual expertise in the contrast polarity of own-species eyes | Humans | + | – | – | + |
| Chimpanzees | – | +* | + | – | ||
| H5 | Perceptual expertise in the normal contrast polarity of eyes | Humans | + | + | – | – |
| Chimpanzees | + | + | – | – | ||
-
*
+ denotes a higher performance than –, and ~ denotes a similar performance in within-species (row-wise) comparisons.
Appendix 1—table 1
The R formulas for generalized linear mixed model (GLMM) in studies 1 and 2.
| Test | Participant | R formula |
|---|---|---|
| Study 1: Exp. 1 | Humans | glmer(Correct ~ Species*Level + Block/Trial + (1+ Species*Level + Block/Trial || ParticipantID) + (1+ Level + Block/Trial || StimulusID), family = binomial, data = exp1_humans) |
| Study 1: Exp. 2 | Humans | glmer(Correct ~ Species*Level*Polarity + Block/Trial + (1+ Species*Level*Polarity + Block/Trial || ParticipantID) + (1+ Level*Polarity + Block/Trial || StimulusID), family = binomial, data = exp2_humans) |
| Study 2: Exp. 1 | Chimpanzees | glmer(Correct ~ Species + Block/Trial+ (1+ Block/Trial || StimulusID) + (1+ Block/Trial || SequenceID), family = binomial, data = exp1_eachchimpparticipant) |
| Study 2: Exp. 2 | Chimpanzees | glmer(Correct ~ Species*Phase + Block/Trial + (1+ Phase + Block/Trial || StimulusID) + (1+ Block/Trial || SequenceID), family = binomial, data = exp2_eachchimpparticipant) |
-
Correct (correct response; correct/incorrect), Species (stimulus species; chimpanzee/human), Level (stimulus level; L1–4), Polarity (contrast polarity; positive/negative), Phase (test phase; A1/B/A2)
Appendix 1—table 2
The results from generalized linear mixed model (GLMM) in studies 1 and 2.
| Experiment | Participant | Effect | β | SE | χ2 | d.f. | p | α* |
|---|---|---|---|---|---|---|---|---|
| Study 1: Exp. 1 | Humans | Level × Species*† | 0.29 (L1 vs. L2) | 1.96 (L1 vs. L2) | 3.47 | 3 | 0.32 | 0.05 |
| 1.09 (L1 vs. L3) | 1.88 (L1 vs. L3) | |||||||
| –0.17 (L1 vs. L4) | 1.76 (L1 vs. L4) | |||||||
| Level | –1.04 (L1 vs. L2) | 0.52 (L1 vs. L2) | 45.85 | 3 | <10–9 | 0.05 | ||
| –2.43 (L1 vs. L3) | 0.50 (L1 vs. L3) | |||||||
| –3.76 (L1 vs. L4) | 0.56 (L1 vs. L4) | |||||||
| Species | 2.83 | 0.35 | 37.08 | 1 | <10–8 | 0.05 | ||
| Study 1: Exp. 2 | Humans | Level × Species × Polarity | 3.35 | 0.88 | 17.57 | 1 | <10–4 | 0.05 |
| Post-hoc (L3, normal) | Species | 3.47 | 0.69 | 40.00 | 1 | <10–9 | 0.05 | |
| Post-hoc (L3, inverted) | Species | 3.02 | 0.65 | 22.28 | 1 | <10–5 | 0.05 | |
| Post-hoc (L4, normal) | Species | 1.05 | 0.29 | 30.17 | 1 | <10–7 | 0.05 | |
| Post-hoc (L4, inverted) | Species | 0.47 | 0.27 | 2.91 | 1 | 0.088 | 0.05 | |
| Post-hoc (human, L3) | Polarity | 3.82 | 0.51 | 30.77 | 1 | <10–7 | 0.05 | |
| Post-hoc (chimp, L3) | Polarity | 3.27 | 0.71 | 19.74 | 1 | <10–5 | 0.05 | |
| Post-hoc (human, L4) | Polarity | 1.94 | 0.35 | 17.86 | 1 | <10–4 | 0.05 | |
| Post-hoc (chimp, L4) | Polarity | 0.92 | 0.25 | 7.89 | 1 | 0.005 | 0.05 | |
| Study 2: Exp. 1 (Test-A1) | Natsuki | Species | 0.55 | 0.16 | 8.28 | 1 | 0.004 | 0.05/3 |
| Hatsuka | Species | 0.71 | 0.19 | 9.50 | 1 | 0.002 | 0.05/3 | |
| Pendesa | Species | 1.69 | 0.24 | 21.94 | 1 | <10–5 | 0.05/3 | |
| Study 1: Exp. 1–2 (Test A1 vs. B) | Natsuki | Phase × Species | 3.40 | 0.41 | 34.61 | 1 | <10–8 | 0.05/2 |
| Hatsuka | Phase × Species | 1.62 | 0.40 | 8.39 | 1 | 0.004 | 0.05/2 | |
| Study 1: Exp. 2 (Test B vs. A2) | Natsuki | Phase × Species | 8.49 | 0.86 | 37.04 | 1 | <10–8 | 0.05/2 |
| Hatsuka | Phase × Species | 3.42 | 0.75 | 33.75 | 1 | <10–8 | 0.05/2 | |
| Post-hoc (Test B) | Natsuki | Species | 2.30 | 0.48 | 12.83 | 1 | 0.003 | 0.05/2 |
| Hatsuka | Species | 0.13 | 0.40 | 0.10 | 1 | 0.75 | 0.05/2 | |
| Post-hoc (Test A2) | Natsuki | Species | 0.92 | 0.30 | 7.24 | 1 | 0.007 | 0.05/2 |
| Hatsuka | Species | 1.46 | 0.27 | 15.11 | 1 | 0.0001 | 0.05/2 | |
| Post-hoc (human, Test A1 vs. B) | Natsuki | Species | 0.68 | 0.24 | 7.03 | 1 | 0.008 | 0.05/2 |
| Hatsuka | Species | 0.09 | 0.21 | 0.18 | 1 | 0.67 | 0.05/2 | |
| Post-hoc (human, Test B vs. A2) | Natsuki | Species | 1.25 | 0.42 | 5.33 | 1 | 0.021 | 0.05/2 |
| Hatsuka | Species | 0.60 | 0.22 | 7.22 | 1 | 0.007 | 0.05/2 | |
| Post-hoc (chimp, Test A1 vs. B) | Natsuki | Species | 2.15 | 0.29 | 24.74 | 1 | <10–6 | 0.05/2 |
| Hatsuka | Species | 0.85 | 0.26 | 9.57 | 1 | 0.002 | 0.05/2 | |
| Post-hoc (chimp, Test B vs. A2) | Natsuki | Species | 1.99 | 0.002 | 33.22 | 1 | <10–8 | 0.05/2 |
| Hatsuka | Species | 1.09 | 0.27 | 14.89 | 1 | 0.0001 | 0.05/2 |
-
Species (stimulus species; chimpanzee/human), Level (stimulus level; L1-4), Polarity (contrast polarity; positive/negative), Phase (test phase; A1/B/A2).
-
*
α level was adjusted for the number of individuals in Study 2.
-
†
These nonsignificant interaction terms were dropped to test the main effects in these models.
Appendix 2—table 1
Details about the chimpanzee participants.
| Participant | Group | Sex | Age | Rearing condition | Participated in |
|---|---|---|---|---|---|
| Ai | PRI | F | 41 | Nursery/peers** | Training |
| Ayumu | PRI | M | 20 | Mother** | Training |
| Chloe† | PRI | F | 40 | Nursery/peers | Training |
| Cleo | PRI | F | 20 | Mother | Training |
| Pal | PRI | F | 20 | Mother | Training |
| Pendesa | PRI | F | 43 | Nursery/peers | Training, experiment 1 |
| Hatsuka | KS | F | 12 | Nursery/peers | Training, experiments 1–2 |
| Iroha | KS | F | 12 | Mother | Training |
| Mizuki | KS | F | 24 | Nursery/peers | Training |
| Natsuki | KS | F | 15 | Mother | Training, experiments 1–2 |
-
Two additional chimpanzees (Zamba and Misaki) participated in a few pilot sessions but did not participate in the training sessions due to low motivation.
-
*
Nursery/peers indicates that individuals were reared by human caretakers and peer conspecifics, while mother indicates that they were reared by their biological mothers.
-
†
Chloe was involved in a related gaze-direction search task in a previous study (Tomonaga and Imura, 2010).
Appendix 4—table 1
Details about each training and test stage for the chimpanzees.
| Training/test phase | Training/test stage | Description | Number of stimulus individual | Stimulus properties | |
|---|---|---|---|---|---|
| Size (width × height in pixel) | Brightness (0–100% of the original RGB values) | ||||
| Training | Training 1 | Presenting stimuli in which the iris was removed (i.e., only sclera was visible in the eye). | 4 (two chimpanzees, two humans) | 400 × 100 | 100 |
| Training 2 | Presenting stimuli in which eyes were averted 38° (the iris was visible in the corner of the eye). | ||||
| Training 3 | Presenting stimuli in which the eyes were averted 30°. | ||||
| Training 4 | Presenting stimuli in which the eyes were averted 20° (the final position of the iris). | ||||
| Training 5 | Presenting four new stimulus individuals in half of the trials and four old stimulus individuals in the other half. | 8 (four chimpanzees, four humans) | |||
| Training 6 | 12 (six chimpanzees, six humans) | ||||
| Pre-Test A1/A2 | L1 normal | Presenting L1 stimuli (original size and brightness) in each session. Contrast polarities of eyes are normal in all stimuli. | |||
| L1.5 normal | Presenting L1 stimuli in 24 baseline trials and stimuli with a higher level (smaller and darker) in 24 test trials. Contrast polarities of eyes are normal in all stimuli. | 300 × 75 (in test trial) | 75 (in test trial) | ||
| L2 normal | 200 × 50 (in test trial) | 50 (in test trial) | |||
| Test A1/A2 | L2.5 normal | 150 × 37.5 (in test trial) | 42 (in test trial) | ||
| L3 normal | 100 × 25 (in test trial) | 33 (in test trial) | |||
| L3.5 normal | 75 × 18.75 (in test trial) | 29 (in test trial) | |||
| L4 normal | 50 × 12.5 (in test trial) | 25 (in test trial) | |||
| Pre-Test B | L1 reversed | Same as L1–4. Normal except that contrast polarities of eyes are reversed in all stimuli. | 400 × 100 | 100 | |
| L1.5 reversed | 300 × 75 (in test trial) | 75 (in test trial) | |||
| L2 reversed | 200 × 50 (in test trial) | 50 (in test trial) | |||
| Test B | L2.5 reversed | 150 × 37.5 (in test trial) | 42 (in test trial) | ||
| L3 reversed | 100 × 25 (in test trial) | 33 (in test trial) | |||
| L3.5 reversed | 75 × 18.75 (in test trial) | 29 (in test trial) | |||
| L4 reversed | 50 × 12.5 (in test trial) | 25 (in test trial) | |||
-
See Appendix 3—figure 4 for the training stimuli.
Appendix 4—table 2
The number of sessions in each training stage.
| Participant | Stage | Number of sessions |
|---|---|---|
| Ai | Training 1 | *4 |
| Training 2 | 51 | |
| Training 3 | 15 | |
| Training 4 | 28 | |
| Total | 98 | |
| Ayumu | Training 1 | 23* |
| Training 2 | 7 | |
| Total | 30 | |
| Chloe | Training 1 | 2 |
| Training 2 | 42 | |
| Total | 44 | |
| Cleo | Training 1 | 9 |
| Training 2 | 21 | |
| Total | 30 | |
| Pal | Training 1 | 26 |
| Total | 26 | |
| Pendesa† | Training 1 | 2 |
| Training 2 | 29 | |
| Training 3 | 8 | |
| Training 4 | 14 | |
| Training 5 | 11 | |
| Training 6 | 50 | |
| Total | 114 | |
| Hatsuka† | Training 1 | 15 |
| Training 2 | 13 | |
| Training 3 | 7 | |
| Training 4 | 11 | |
| Training 5 | 5 | |
| Training 6 | 3 | |
| Total | 54 | |
| Iroha | Training 1 | 33 |
| Training 2 | 46 | |
| Training 3 | 12 | |
| Total | 91 | |
| Mizuki | Training 1 | 14 |
| Training 2 | 98 | |
| Total | 112 | |
| Natsuki† | Training 1 | 4 |
| Training 2 | 26 | |
| Training 3 | 5 | |
| Training 4 | 15 | |
| Training 5 | 5 | |
| Training 6 | 2 | |
| Total | 57 |
-
*
Ai and Ayumu were mistakenly moved to training 2 after only one session scoring >80% in both chimpanzee and human trials (i.e., one additional session was necessary to pass the criteria). For Ai, we performed one additional training 1 session during training 2, confirmed that she scored >80% in both chimpanzee and human trials, and then continued her training. Ayumu performed seven training 2 sessions after training 1, but due to his low motivation to participate in this experiment, we decided to drop him from further tests (we also dropped those seven training 2 sessions from the analysis).
-
†
These three individuals passed all the training stages.
Appendix 4—table 3
The number of sessions in each pre-test and test stage.
| Participant | Test phase | Stage | Number of sessions |
|---|---|---|---|
| Pendesa | Pre-Test A1 | L1 normal | 12 |
| L1.5 normal | 4 | ||
| L2 normal | 19 | ||
| Total | 35 | ||
| Test A1 | L2.5 normal | 26 | |
| Total | 26 | ||
| Hatsuka | Pre-Test A1 | L1 normal | 5 |
| L1.5 normal | 8 | ||
| L2 normal | 3 | ||
| Total | 16 | ||
| Test A1 | L2.5 normal | 13 | |
| L3 normal | 13 | ||
| Total | 26 | ||
| Pre-Test B | L1 reversed | 10 | |
| L1.5 reversed | 2 | ||
| L2 reversed | 4 | ||
| Total | 16 | ||
| Test B | L2.5 reversed | 2 | |
| L3 reversed | 24 | ||
| Total | 26 | ||
| Pre-Test A2 | L2 normal | 1 | |
| L2.5 normal | 1* | ||
| Total | 2 | ||
| Test A2 | L3 normal | 3 | |
| L3.5 normal | 17 | ||
| Total | 20 | ||
| Natsuki | Pre-Test A1 | L1 normal | 4 |
| L1.5 normal | 5 | ||
| L2 normal | 6 | ||
| L3 normal | 2† | ||
| Total | 17 | ||
| Test A1 | L2.5 normal | 15 | |
| L3 normal | 18 | ||
| Total | 33 | ||
| Pre-Test B | L1 reversed | 10 | |
| L1.5 reversed | 10 | ||
| L2 reversed | 3 | ||
| Total | 23 | ||
| Test B | L2.5 reversed | 4 | |
| L3 reversed | 20 | ||
| Total | 24 | ||
| Pre-Test A2 | L1.5 normal | 1 | |
| L2 normal | 1 | ||
| L2.5 normal | 1* | ||
| Total | 3 | ||
| Test A2 | L3 normal | 8 | |
| L3.5 normal | 18 | ||
| L4 normal | 6 | ||
| Total | 32 |
-
*
These L2.5 sessions in the Test A2 phase were performed to confirm that the participants’ performances did not drop significantly from those in the Test A1 phase. Test A2 phase started from L3, the level that these participants reached in the Test A1 phase.
-
†
As Natsuki performed poorly on these first two L3 sessions, we leveled down the stimuli to L2.5. These initial L3 sessions were not included in the analysis (yet including or not including these two sessions did not change the results).
Additional files
Download links
A two-part list of links to download the article, or parts of the article, in various formats.
Downloads (link to download the article as PDF)
Open citations (links to open the citations from this article in various online reference manager services)
Cite this article (links to download the citations from this article in formats compatible with various reference manager tools)
Experimental evidence that uniformly white sclera enhances the visibility of eye-gaze direction in humans and chimpanzees
eLife 11:e74086.
https://doi.org/10.7554/eLife.74086


