Fluorescence activation mechanism and imaging of drug permeation with new sensors for smoking-cessation ligands
- Division of Biology and Biological Engineering, California Institute of Technology, United States
- Keck School of Medicine, University of Southern California, United States
- Division of Chemistry and Chemical Engineering, California Institute of Technology, United States
- Institute of Biology, Leiden University, Netherlands
- Janelia Research Campus, Howard Hughes Medical Institute, United States
- School of Chemistry, University of Bristol, United Kingdom
- Howard Hughes Medical Institute, California Institute of Technology, United States
Figures
Figure 1 with 2 supplements
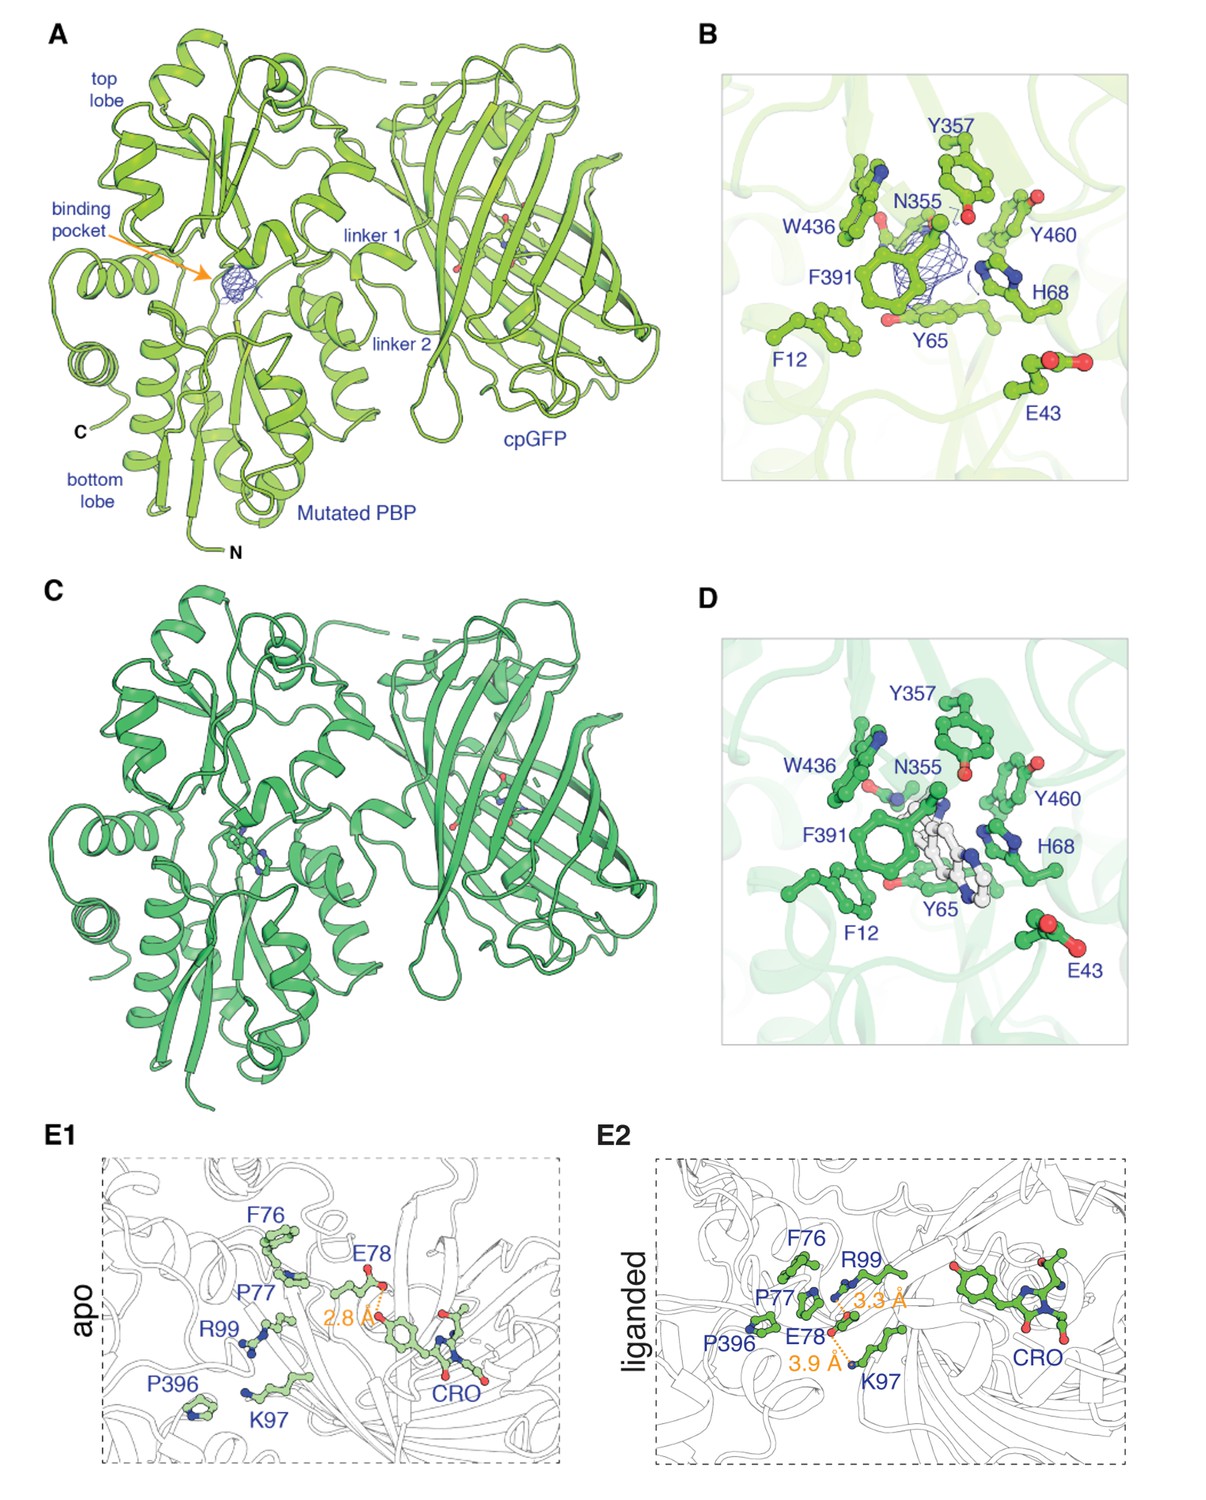
Apo and ligand-bound structures of iNicSnFR3adt (dt indicates that His6 and Myc tags have been removed to aid crystallization).
To form an intensity-based drug-sensing fluorescent reporter (iDrugSnFR), a circularly permuted GFP molecule, flanked by two 4-residue linking sequences, is inserted into a PBP at a position (77–78, in our numbering system) that changes backbone Φ-Ψ angles between the apo and liganded PBP. (A) Overall conformation of iNicSnFR3adt crystallized with nicotine; an electron density appears at the nicotine binding site (PDB 7S7U). (B) iNicSnFR3adt binding site residues. (C) Overall conformation of iNicSnFR3adt with varenicline bound (PDB 7S7T). (D) iNicSnFR3adt binding site with varenicline present. (E) Aspects of the PBP-Linker1-cpGFP interface, emphasizing contacts that change upon ligand binding. The Phe76-Pro77-Glu78 cluster (in Linker 1) lies 11–16 Å from position 43, which defines the outer rim of the ligand site (B); therefore, the cluster makes no direct contact with the ligand site. (E1) In the apo conformation, Glu78 acts as a candle snuffer that prevents fluorescence by the chromophore (PDB 7S7V). (E2) In the liganded conformation (PDB 7S7T), the Phe76-Pro77-Glu78 cluster moves Glu78 at least 14 Å away from the fluorophore. Pro77 is flanked by Phe76 and Pro396 (in the top lobe of the PBP moiety). The presumably deprotonated Glu78 forms salt bridges with Lys97 and Arg99, both facing outward on the β6 strand of the original GFP (within the original Phe165-Lys-Ile-Arg-His sequence).
Figure 1—figure supplement 1
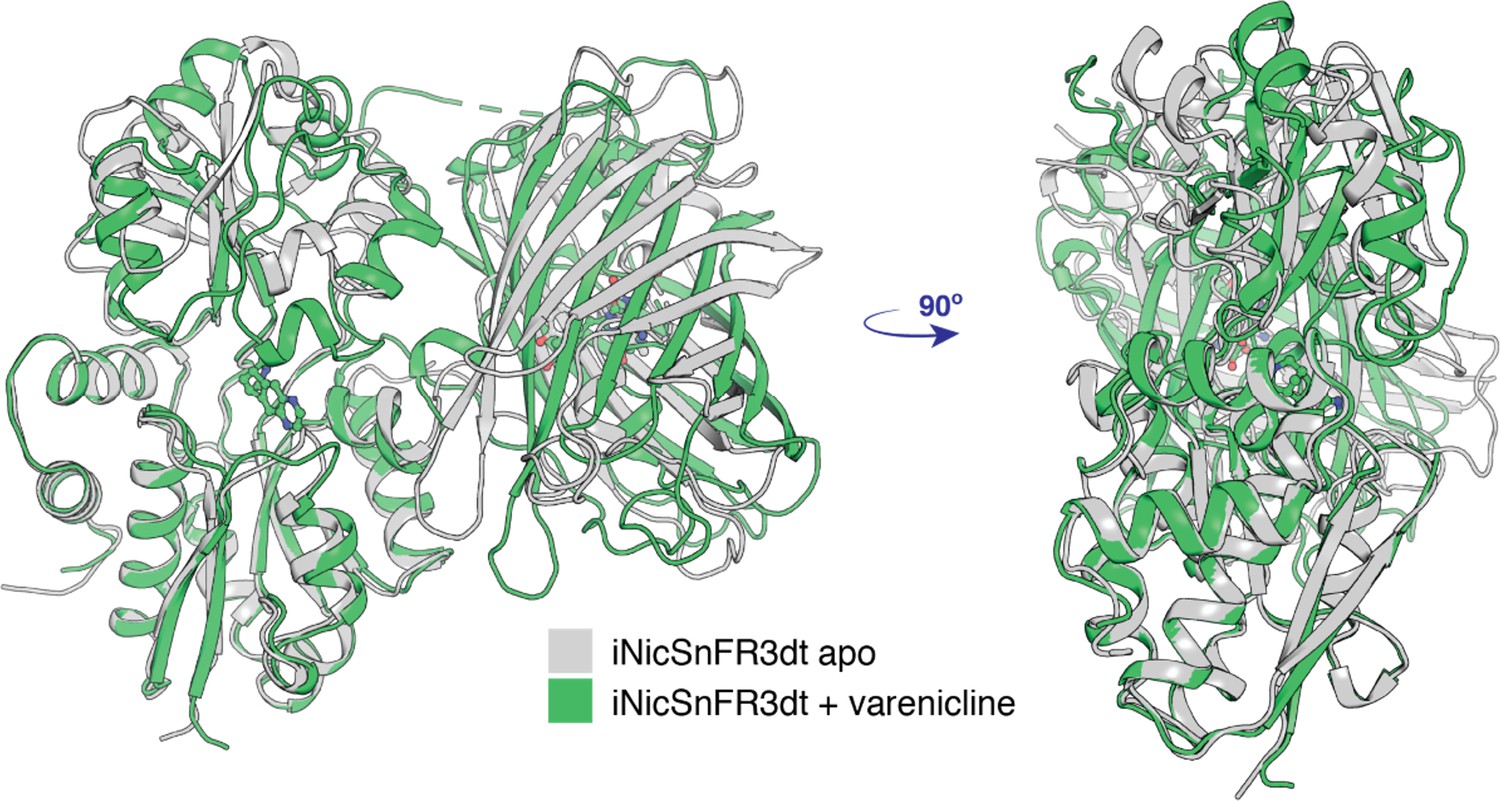
Conformational change of apo (PDB 7S7V) to the liganded, closed form (PDB 7S7T) of iNicSnFR3adt.
The bottom lobe of the PBP is superimposed in the two conformations. With respect to the bottom lobe, the ‘Venus flytrap’ conformational change tilts the top lobe of the PBP but does not change its structure (see Appendix 1). The conformational change also tilts the cpGFP moiety but does not change its structure.
Figure 1—figure supplement 2
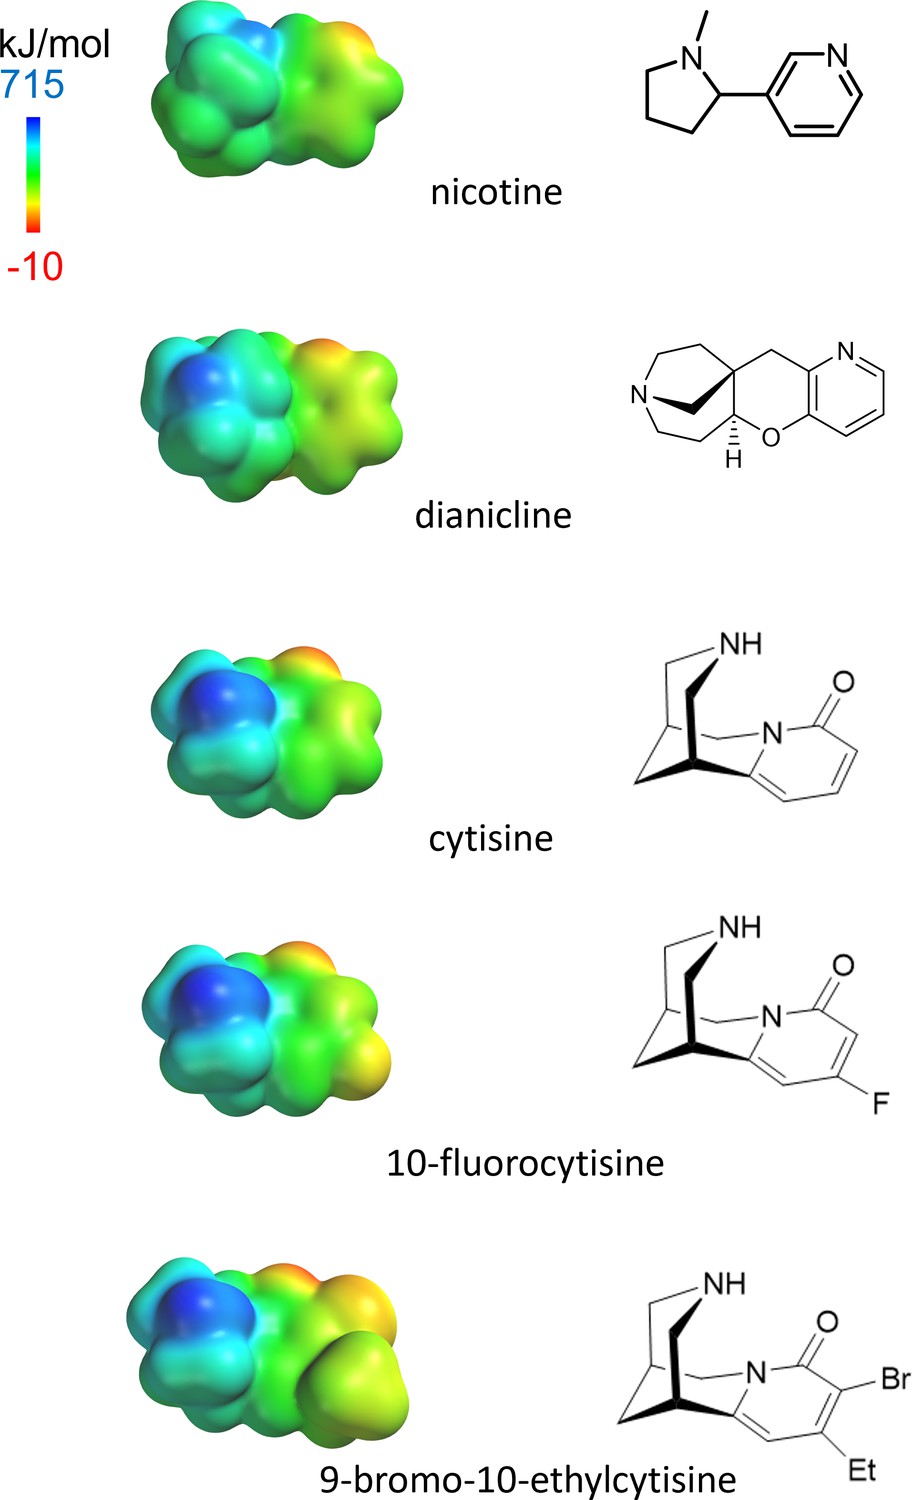
Left: electrostatic surface potential densities for protonated forms of the nicotinic agonists in this study, calculated by SPARTAN at HF/6-31G** theory level.
The display ranges from –10 to 715 kJ/mol. The molecules are shown on the same distance scale. Right: bond-line skeletal structures for the deprotonated forms.
Figure 2
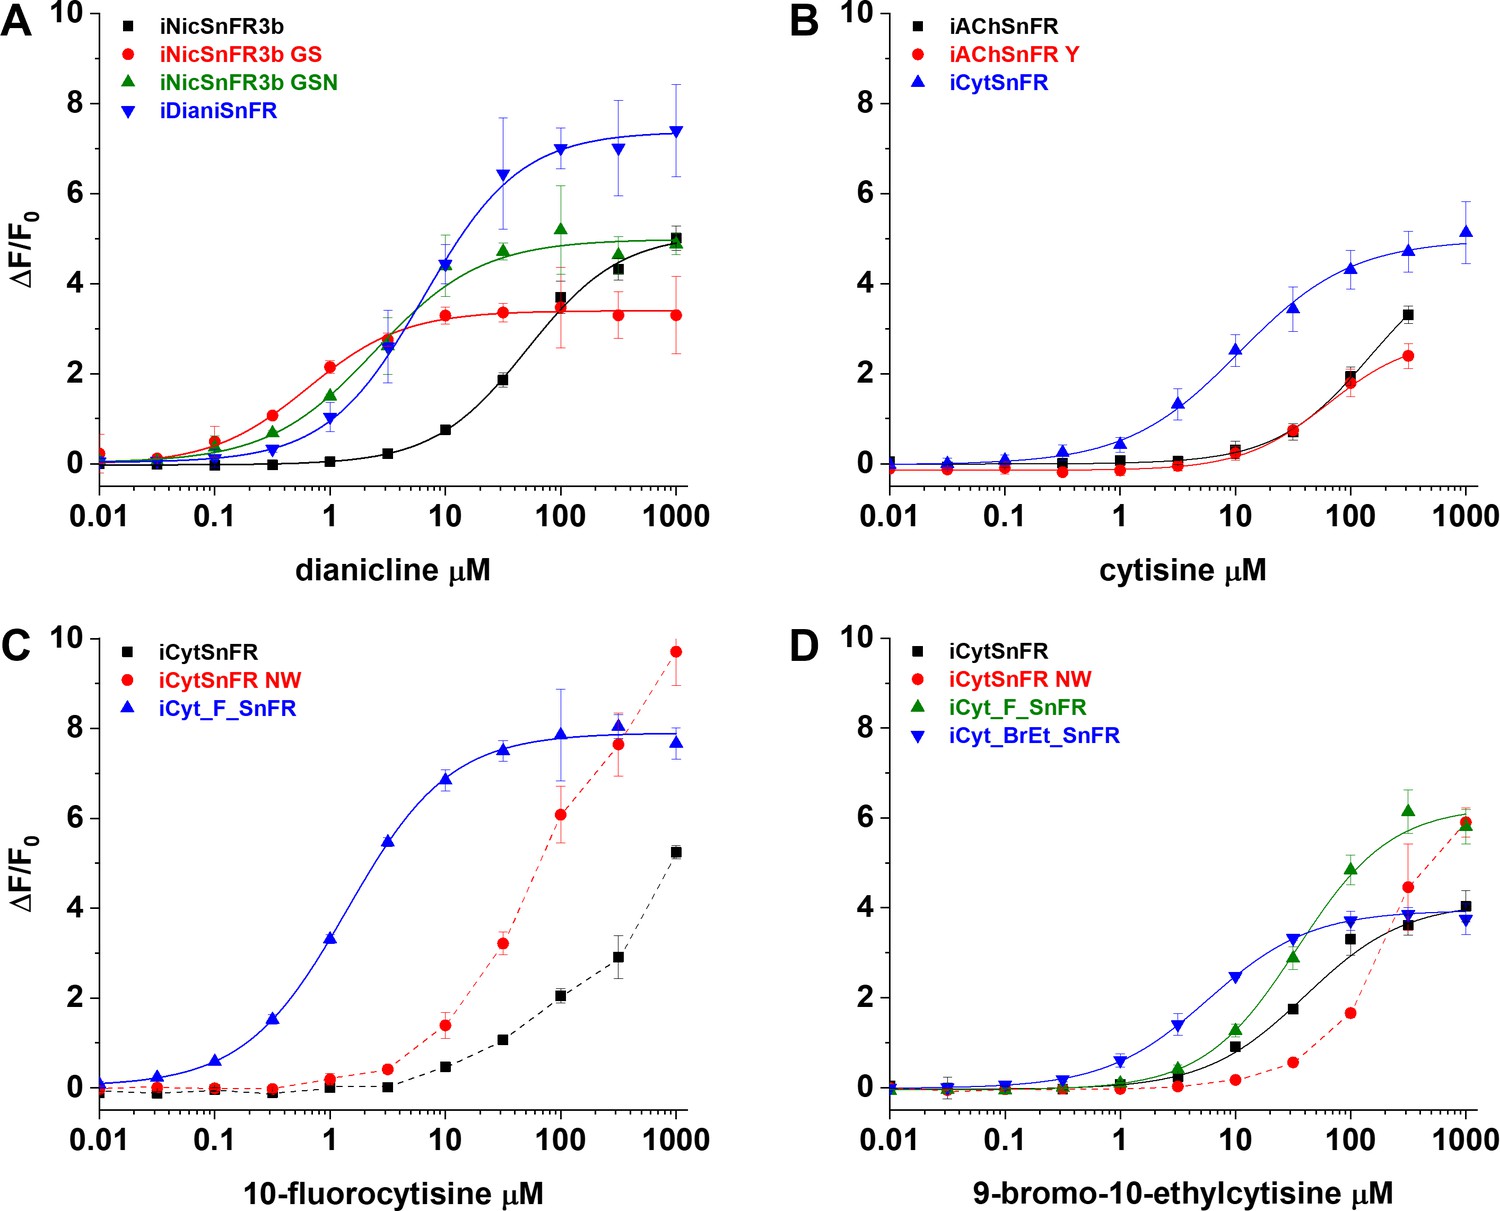
Nicotinic agonist intensity-based drug-sensing fluorescent reporter (iDrugSnFR) development.
Dose–response relations on intermediate constructs using E. coli lysate were performed with respective drug partners to identify site-saturation mutagenesis (SSM) winners. (A–D) The progenitor biosensor is listed in black. Dashed lines indicate data that did not reach saturation at the concentrations tested; therefore, EC50 and ∆Fmax/F0 could not be determined. Development of (A) iDianiSnFR, (B) iCytSnFR, (C) iCyt_F_SnFR, and (D) iCyt_BrEt_SnFR.
Figure 3 with 1 supplement
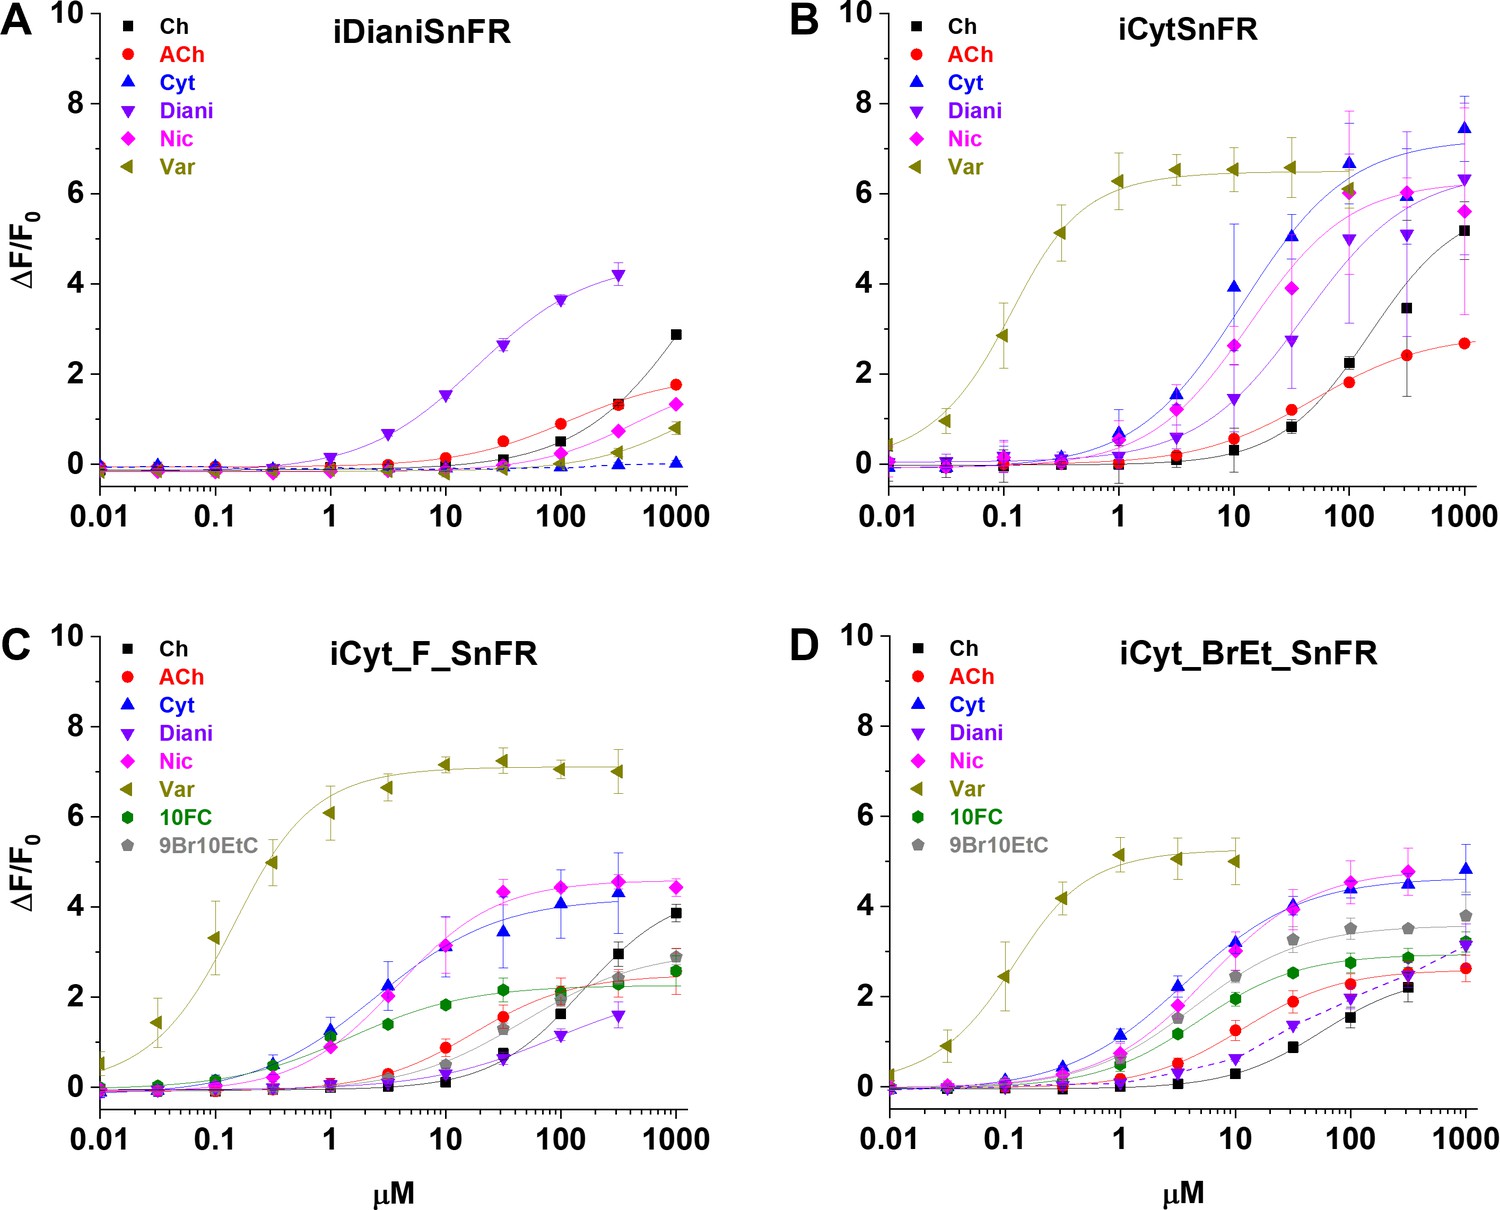
Dose–response relations of intensity-based drug-sensing fluorescent reporter (iDrugSnFR) protein versus a nicotinic agonist panel.
(A–D) Relevant EC50 values for each iDrugSnFR are listed in Table 2. Dashed lines indicate dose–response relations that did not approach saturation for the concentration ranges tested; therefore, EC50 and ∆Fmax/F0 could not be determined. (A) iDianiSnFR shows preference for dianicline, with some promiscuity for other nicotinic agonists. (B) iCytSnFR, (C) iCyt_F_SnFR, and (D) iCyt_BrEt_SnFR bind their drug partner, but also respond to other nicotinic agonists. Ch, choline; ACh, acetylcholine; Cyt, cytisine; Diani, dianicline; Nic, nicotine; Var, varenicline; 10FC, 10-fluorocytisine; 9Br10EtC, 9-bromo-10-ethylcytisine.
Figure 3—figure supplement 1
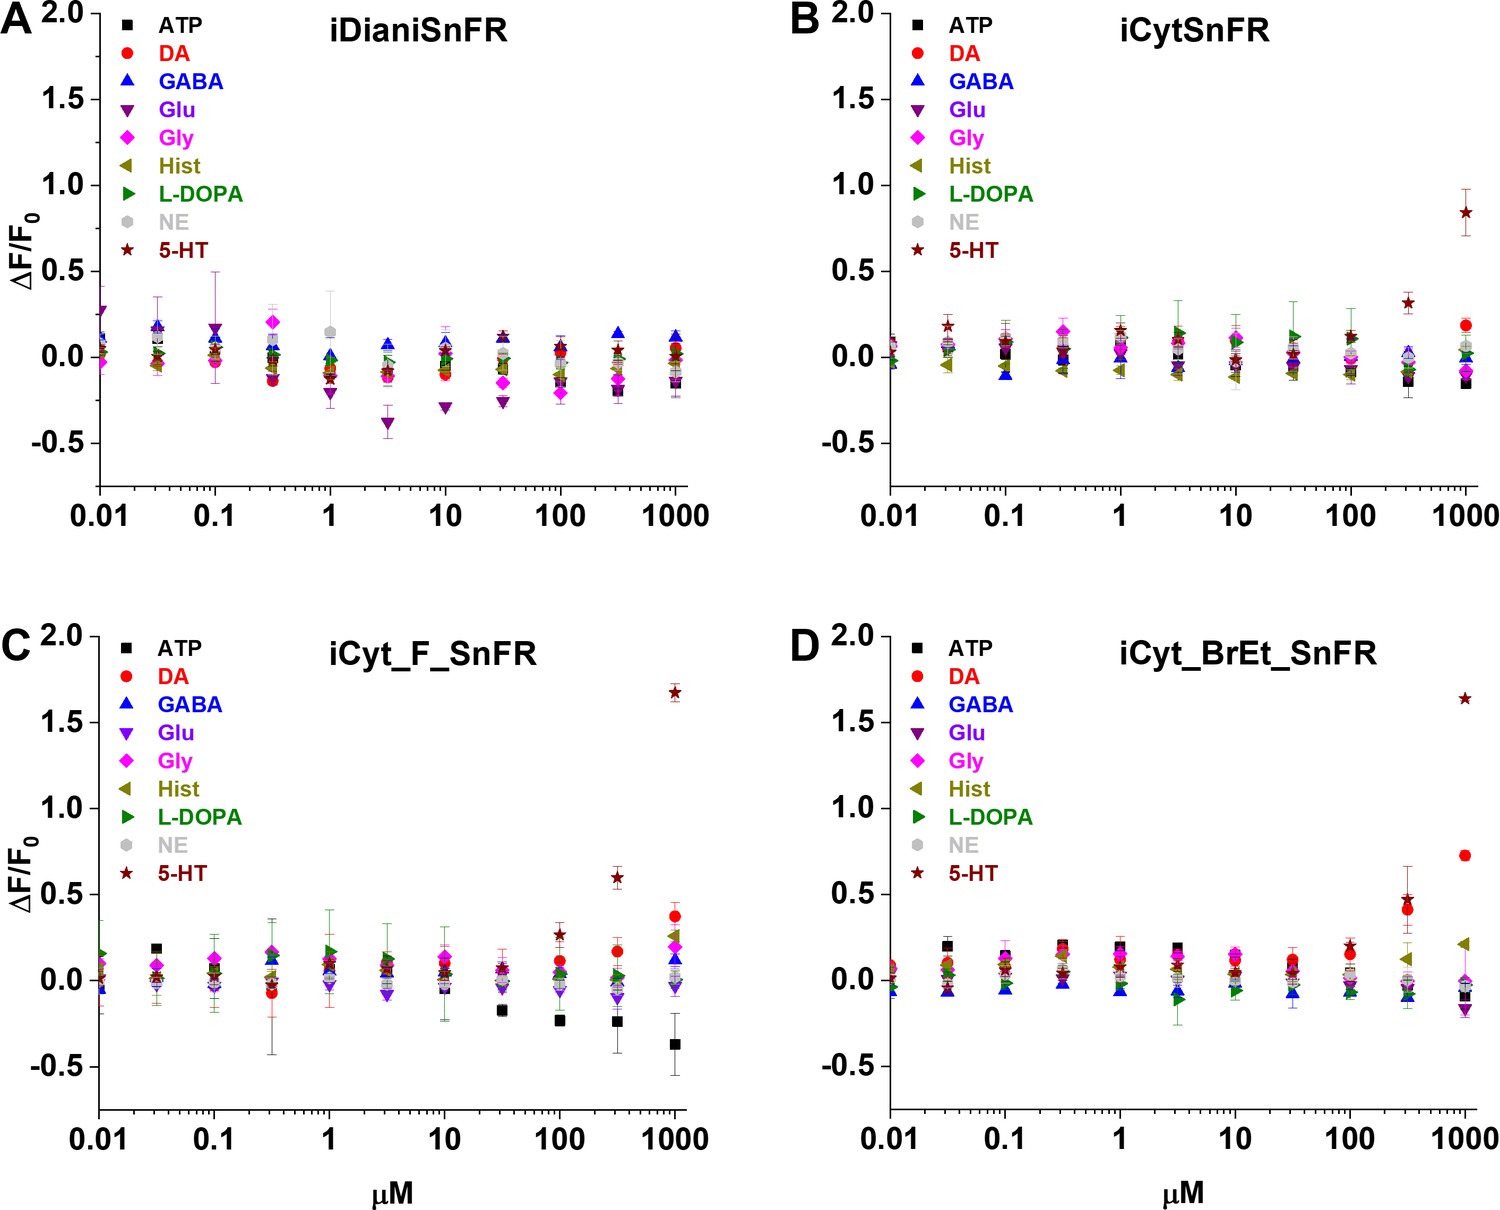
Dose–response relations of nicotinic agonist intensity-based drug-sensing fluorescent reporters (iDrugSnFRs) against select endogenous molecules.
(A) iDianiSnFR shows no fluorescent response to any of the selected endogenous molecules. (B) iCytSnFR, (C) iCyt_F_SnFR, and (D) iCyt_BrEt_SnFR show no response to any of the selected endogenous molecules except 5-HT and DA at concentrations above 100 µM. ATP, adenosine triphosphate; DA, dopamine; GABA, γ-aminobutyric acid; Glu, glutamate; Gly, glycine; Hist, histamine; L-DOPA, levodopa; NE, norepinephrine; 5-HT, serotonin.
Figure 4
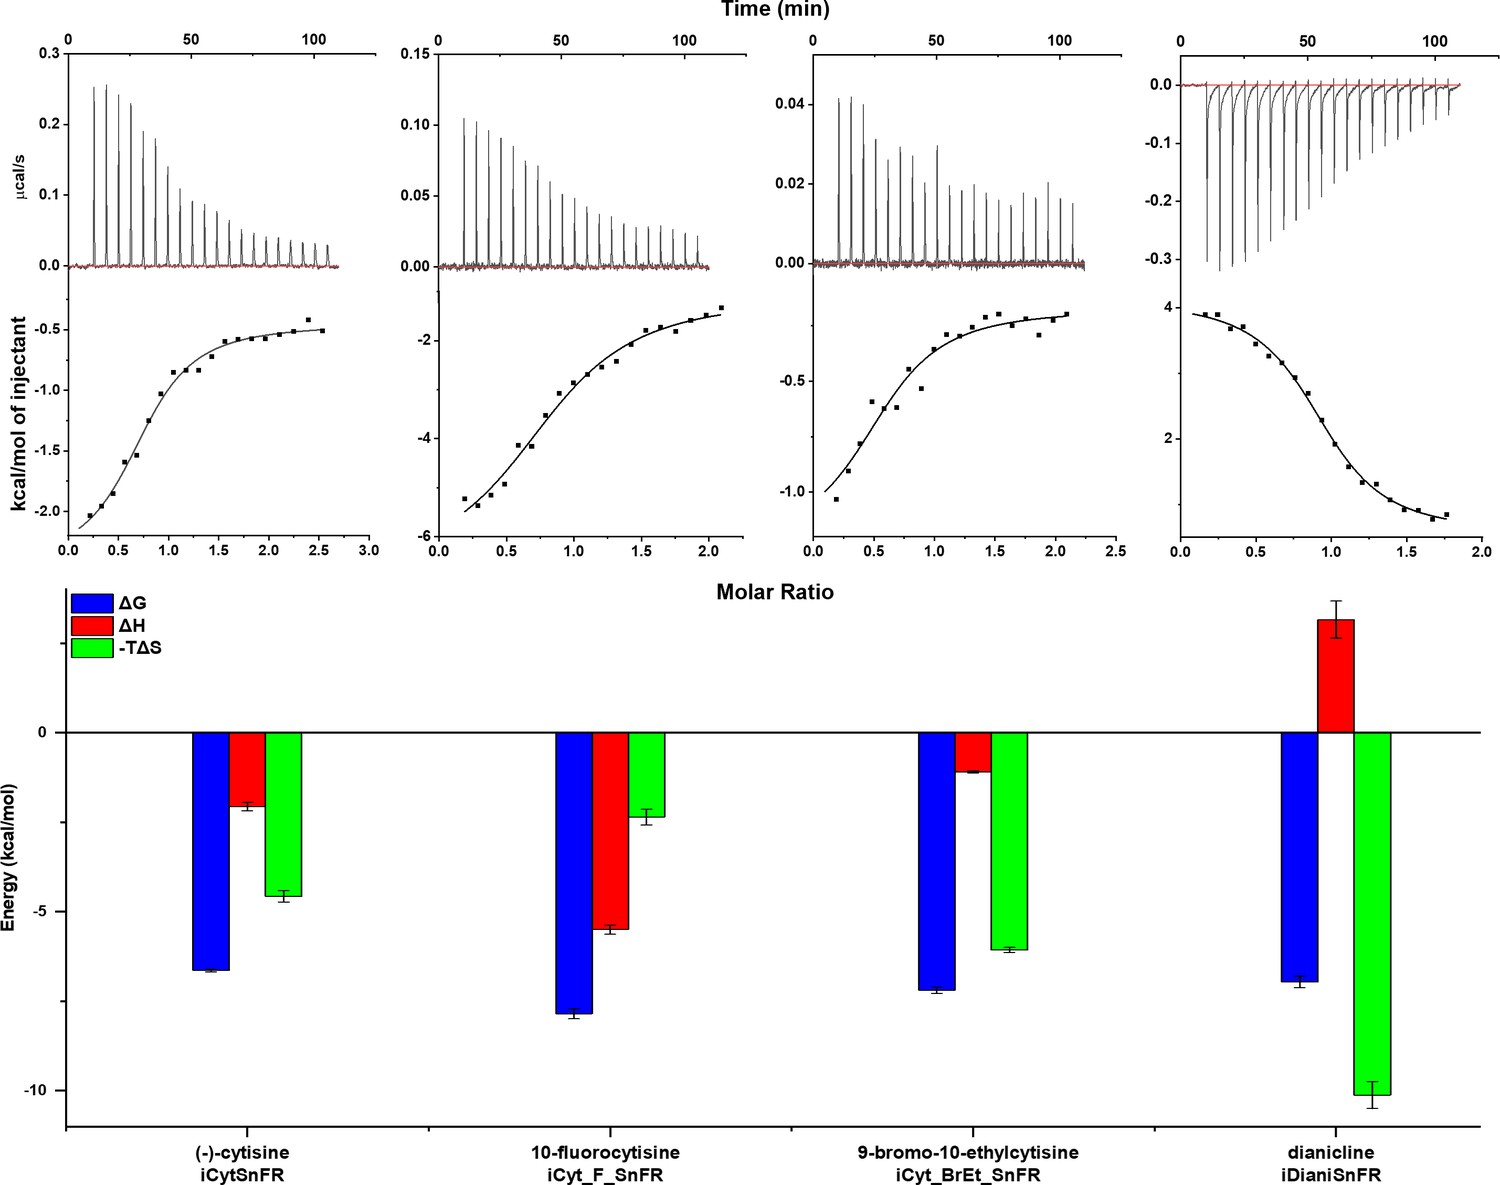
Isothermal titration calorimetry traces, fits, and thermodynamic data.
Top row: exemplar heat traces of iCytSnFR, iCyt_F_SnFR, iCyt_BrEt_SnFR, and iDianiSnFR paired with their drug partners obtained by isothermal calorimetry. The heats for iCytSnFR, iCyt_F_SnFR, and iCyt_BrEt_SnFR were exothermic, while that for iDianiSnFR was endothermic. Middle row: the resulting fits for each iDrugSnFR:drug pair from the integrated heats comprising each series of injections. Bottom row: energy calculations. All iDrugSnFRs show exergonic reactions, but the relative enthalpic and entropic contributions vary among iDrugSnFRs. Data are from three separate runs, mean ± SEM. iDrugSnFR, intensity-based drug-sensing fluorescent reporter.
Figure 5
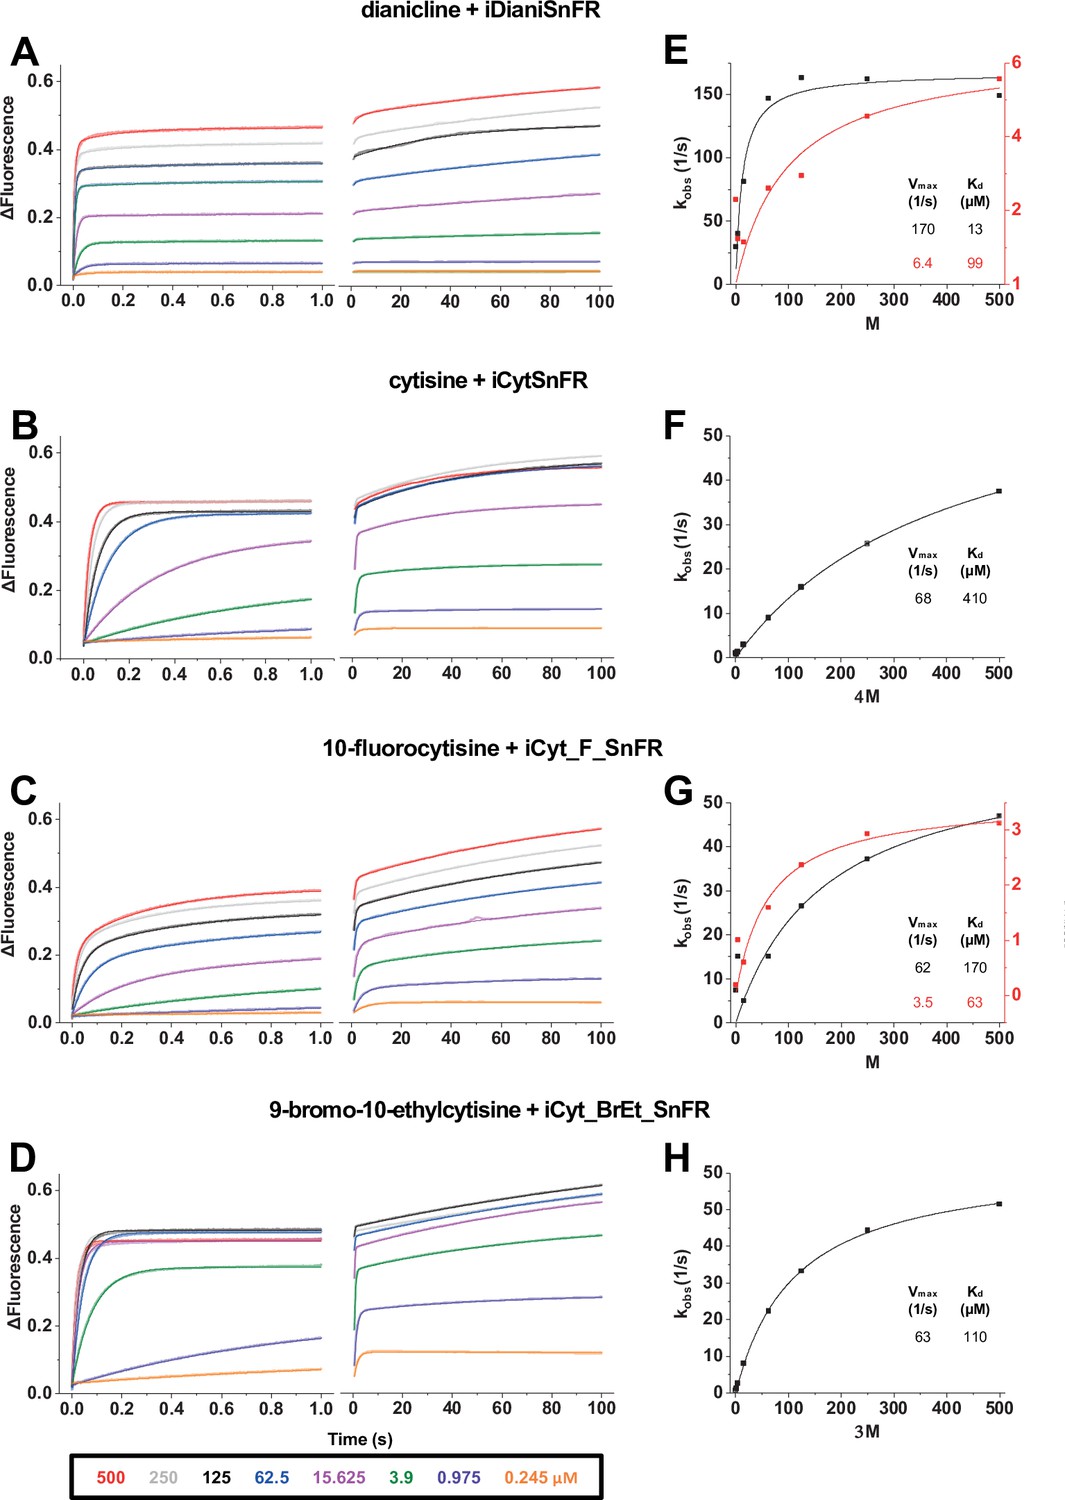
Stopped-flow fluorescence kinetic data for (A) iDianiSnFR, (B) iCytSnFR, (C) iCyt_F_SnFR, and (D) iCyt_BrEt_SnFR over 1 s and 100 s.
Fluorescence was activated by mixing with the agonists, producing the indicated final concentrations. Stopped-flow data show a departure from first-order kinetics for this set of iDrugSnFRs. iDianiSnFR and iCyt_F_SnFR are fitted to a double exponential; iCytSnFR and iCyt_BrEt_SnFR are fitted to a single exponential. (E–H) Plots of the observed apparent rate constant kobs against [agonist] for the 1 s data obtained in (A–D).
Figure 6
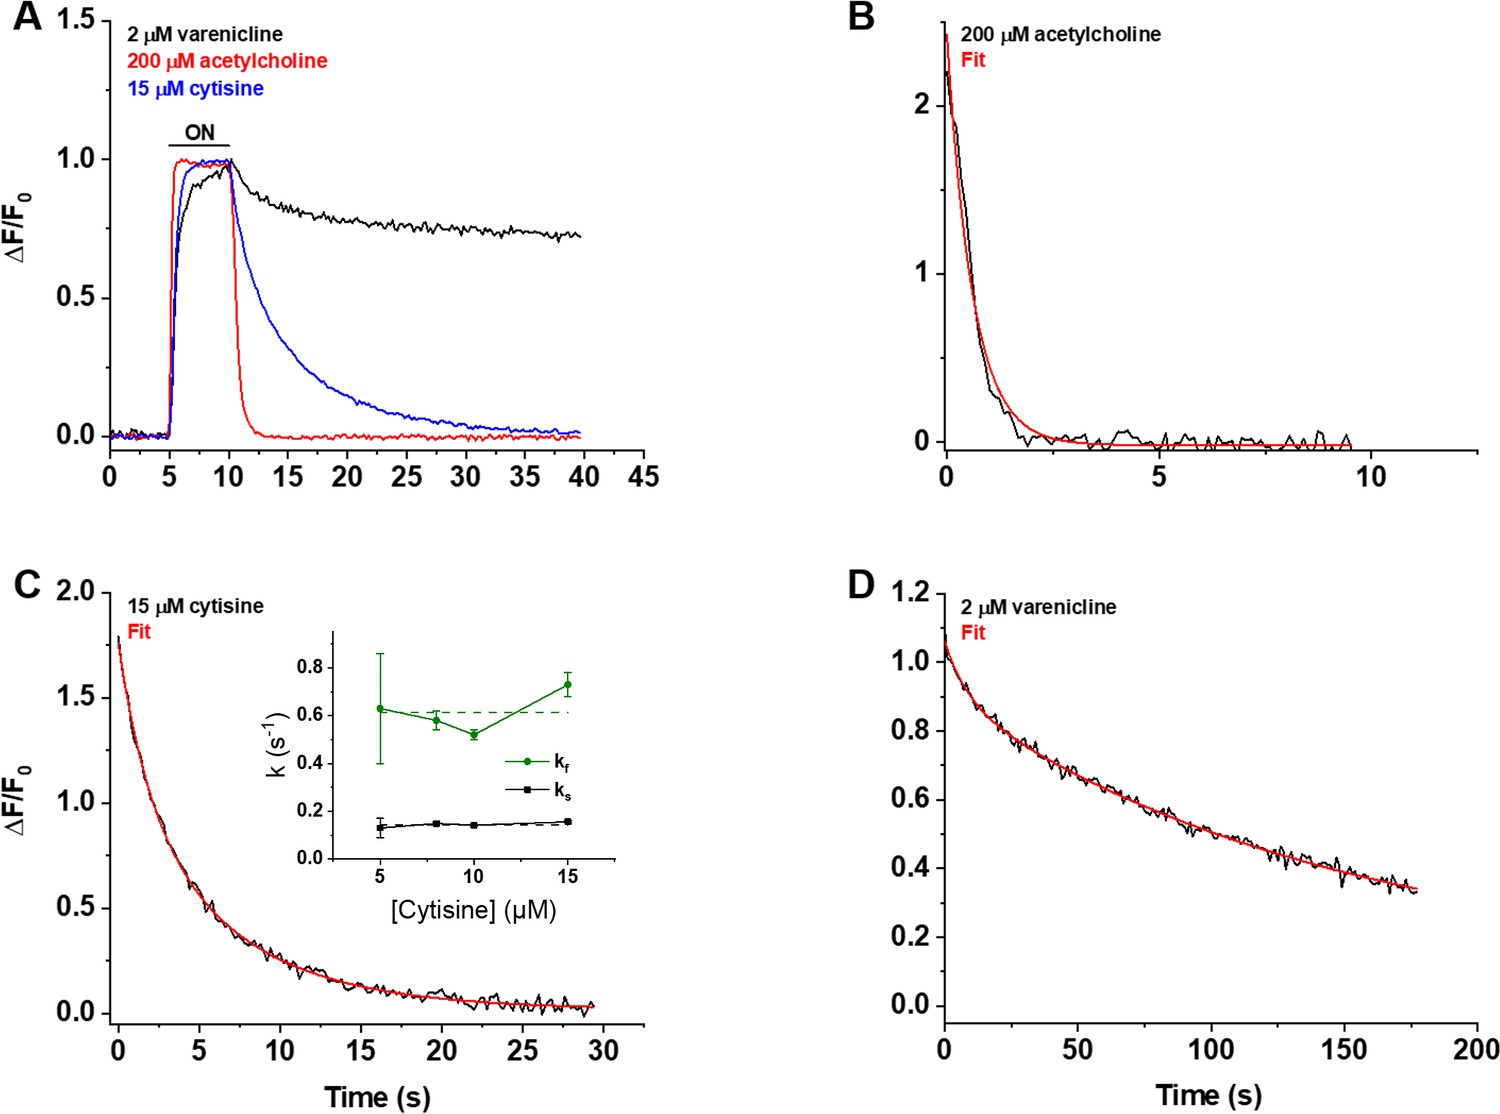
Decay of the iCytSnFR_PM responses after removal of ACh, cytisine, or varenicline.
(A) The red, blue, and black traces are mean ΔF/F0 values for the ACh (200 µM), cytisine (15 µM), and varenicline (2 µM) responses as a function of time (n = 4–10 areas per ligand). The ΔF/F0 was normalized to the peak response for each ligand. Sampling rate was 5 frames/s. Ligand was applied for 5 s, denoted by the black horizontal bar above the traces. (B–D) Examples of the decay phase of the response to ACh (200 µM), cytisine (15 µM), and varenicline (2 µM) in individual areas (black traces in each panel). Red lines are fits to the sum of one or two negative exponential terms and a constant (red lines in each panel) using nonlinear least-squares regression. (B) The decay of the ACh (200 µM) response (n = 1 area, 3 cells) was monophasic with a single time constant (τ0ff) of 0.61 ± 0.02 s (± SE, n = 86 frames, sampling rate of 9.8 frames/s). The red line is a fit to the sum of a negative exponential component (R2 of 0.98). (C) The decay of the cytisine (15 µM) response (n = 1 area, four cells) was biphasic with time constants (τfoff, τsoff) of 1.9 ± 0.2 and 6.6 ± 0.5 s (n = 149 frames, sampling rate of 5 frames/s). The red line is a fit to the sum of two negative exponential components and a constant (R2 of 0.996). It was significantly better than that of the sum of a single negative exponential term and a constant (F-test, p<0.05). The relative amplitude of the slower decay component (As/(As+ Af), where As is amplitude of the slower component of decay in units of ΔF/F0 and Af is amplitude of the faster component) was 61%. Inset: neither rate constant changed significantly over the [cytisine] range from 5 to 15 μM. Dashed lines give the average over this range. (D) The decay of the varenicline (2 µM) response (n = 1 area, three cells) was also biphasic with a τfoff and τsoff of 9 ± 1 s and 150 ± 10 s (n = 178 frames, sampling rate of 1 frame/s), respectively. The As/(As+ Af) was 83%. The red line is a fit to the sum of two negative exponential terms and a constant (R2 of 0.994), and it was significantly better than that to the sum of a single negative exponential term and a constant (F-test, p<0.05).
Figure 7 with 3 supplements
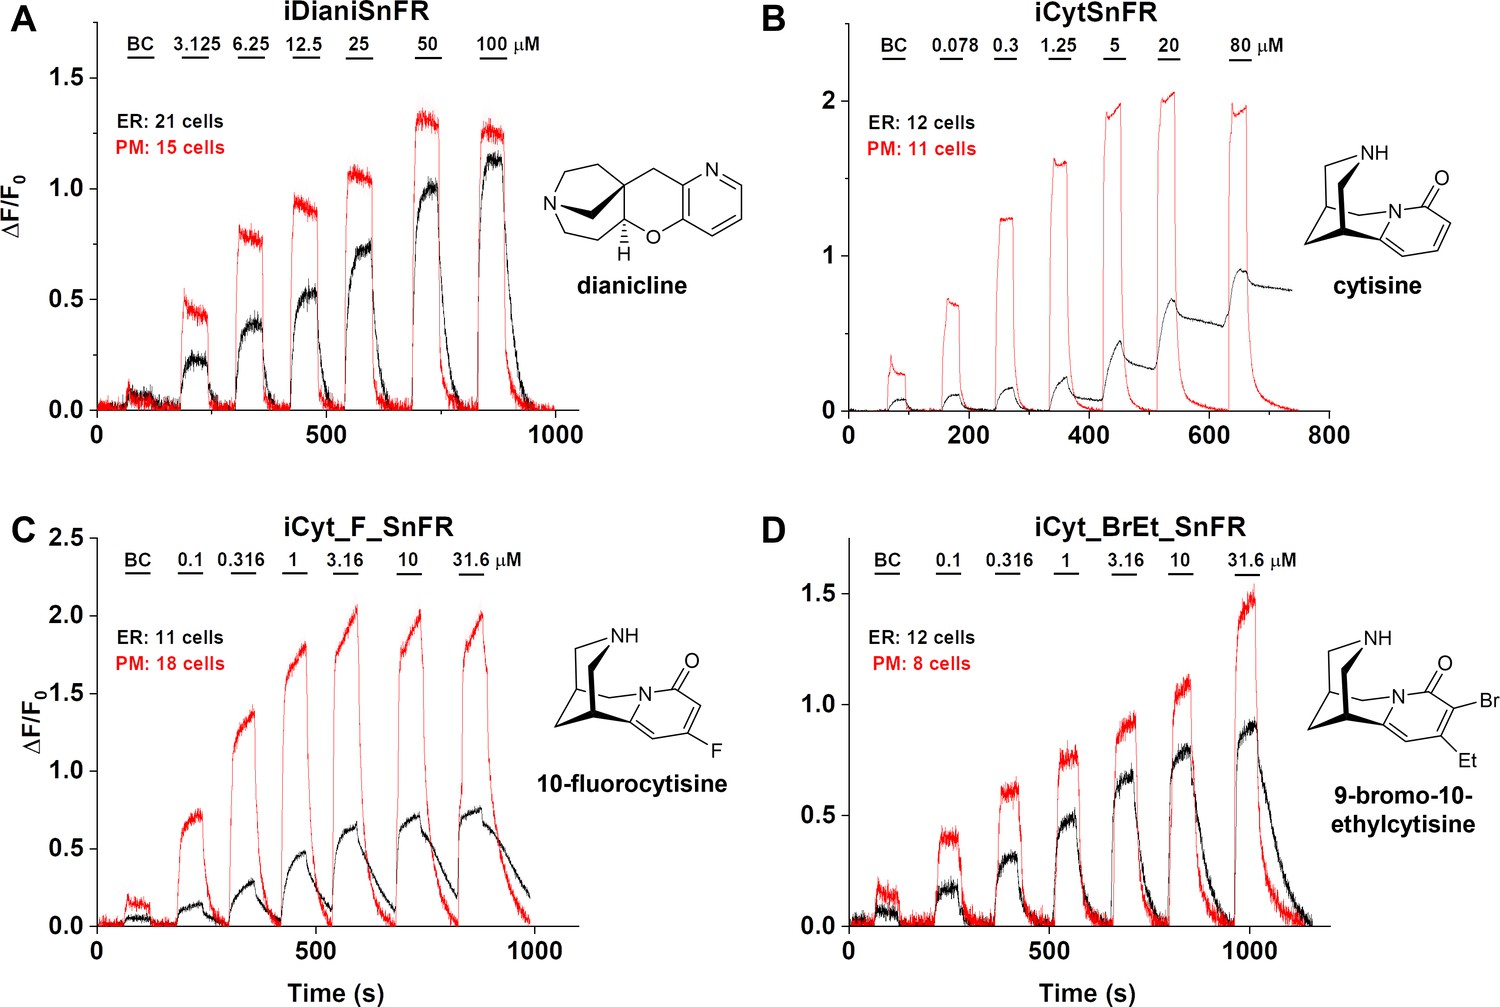
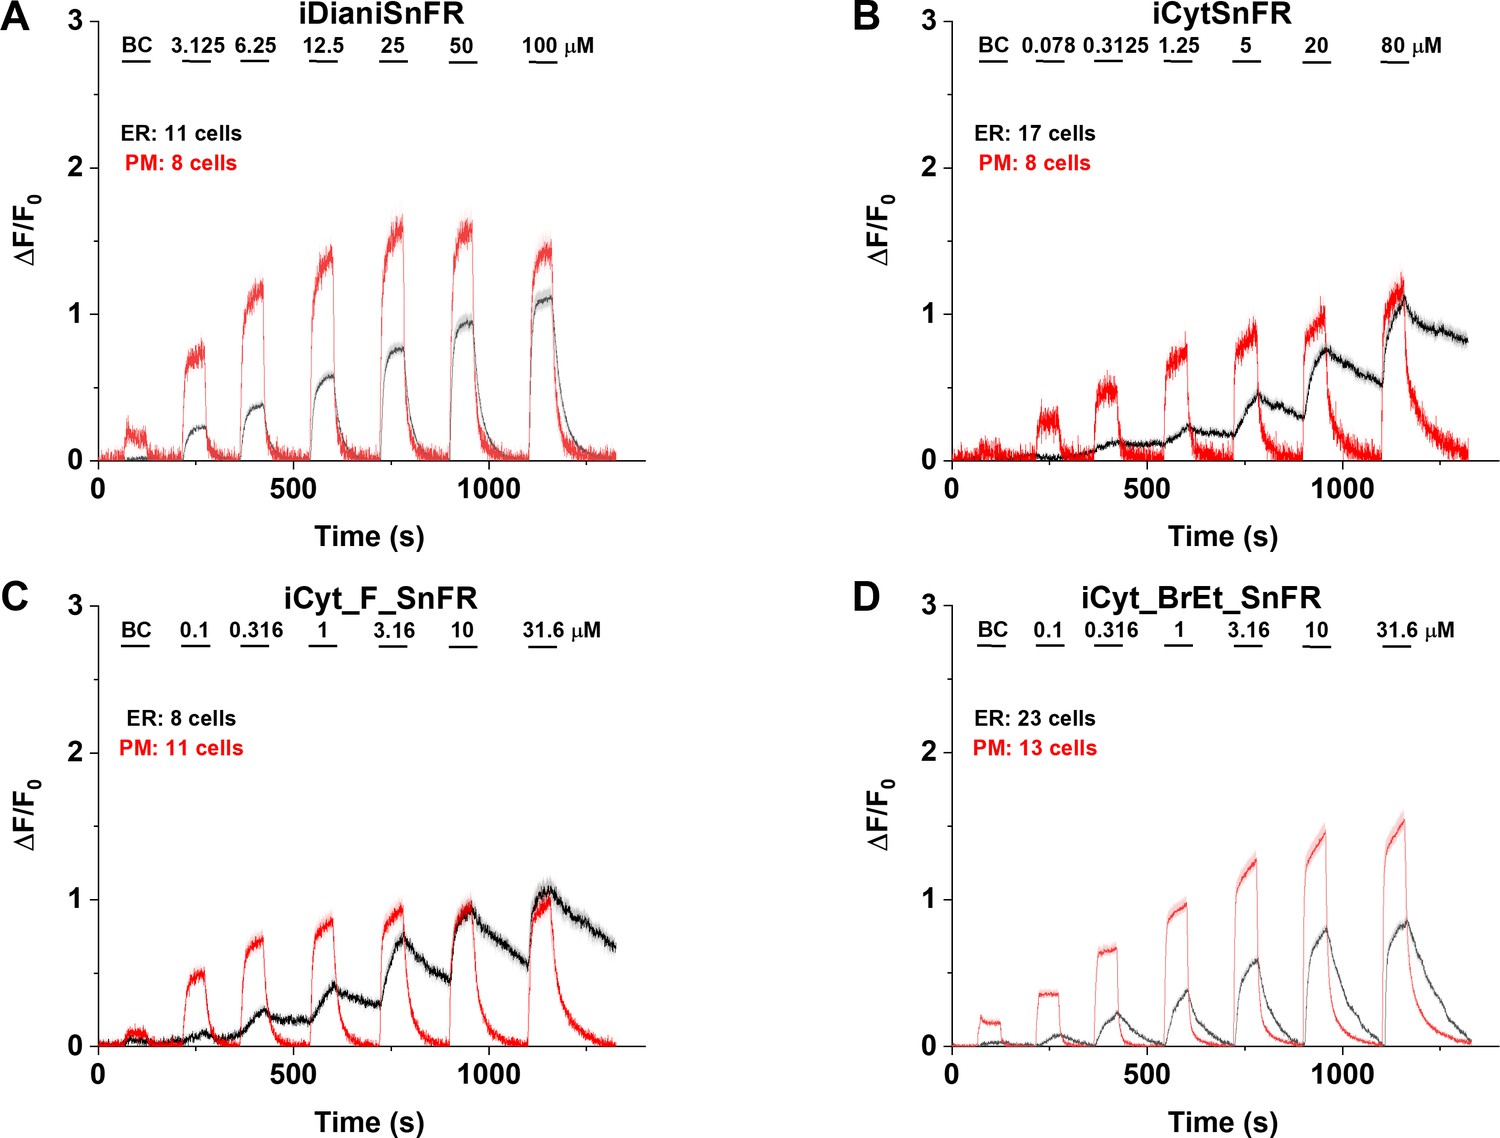
Nicotinic agonist intensity-based drug-sensing fluorescent reporter (iDrugSnFR) dose–response relations in HeLa cells.
(A–D) Each iDrugSnFR detects its drug partner at the plasma membrane (PM) and endoplasmic reticulum (ER) of HeLa cells at the concentrations sampled. BC, buffer control. SEM of data are indicated by semi-transparent shrouds around traces where trace width is exceeded. (A) iDianiSnFR detects dianicline with a return to baseline fluorescence between drug applications. (B) iCytSnFR detection at the PM returns to baseline fluorescence between applications, while detection at the ER shows incomplete wash-in and washout. (C) iCyt_F_SnFR fluorescence response to the presence of 10-fluorocytisine in the ER also shows an incomplete washout between applications. (D) iCyt_BrEt_SnFR detects 9-bromo-10-ethylcytisine with wash-in and washout fluorescence similar to the pattern seen in iDianiSnFR.
Figure 7—figure supplement 1
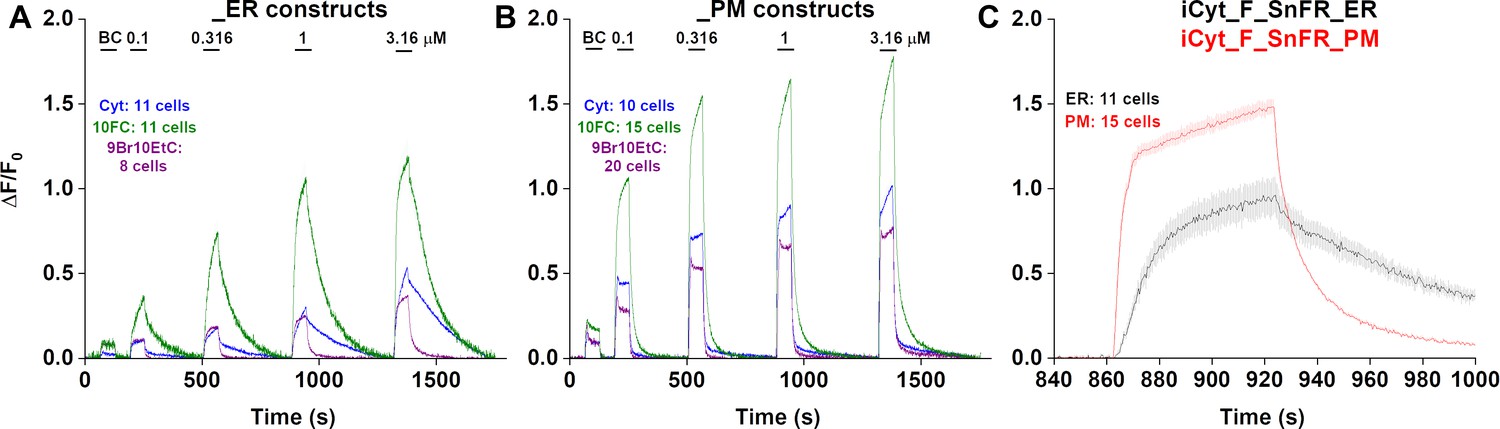
Traces of fluorescence responses during time-resolved low-concentration dose–response relations for nicotinic agonists in HeLa cells.
BC, buffer control. SEM of data are indicated by semi-transparent shrouds around traces where trace width is exceeded. Cyt (cytisine) in cells expressing iCytSnFR_ER (A) or iCytSnFR_PM (B); 10FC (10-fluorocytisine) in cells expressing iCyt_F_SnFR_ER (A) or iCyt_F_SnFR_PM (B); 9Br10EtC (9-bromo-10-ethylcytisine) in cells expressing iCyt_BrEt_SnFR_ER (A) or iCyt_BrEt_SnFR_PM (B). Relatively long (300 s) washout periods between drug applications allowed a return to baseline fluorescence for the (A) endoplasmic reticulum (ER) and (B) plasma membrane (PM). (C) A zoomed-in exemplar comparison of the ER and PM for a pulse of 1 µM 10-fluorocytisine shows a distinct lag in the decrease of the fluorescent signal in the ER as compared to the PM.
Figure 7—figure supplement 2
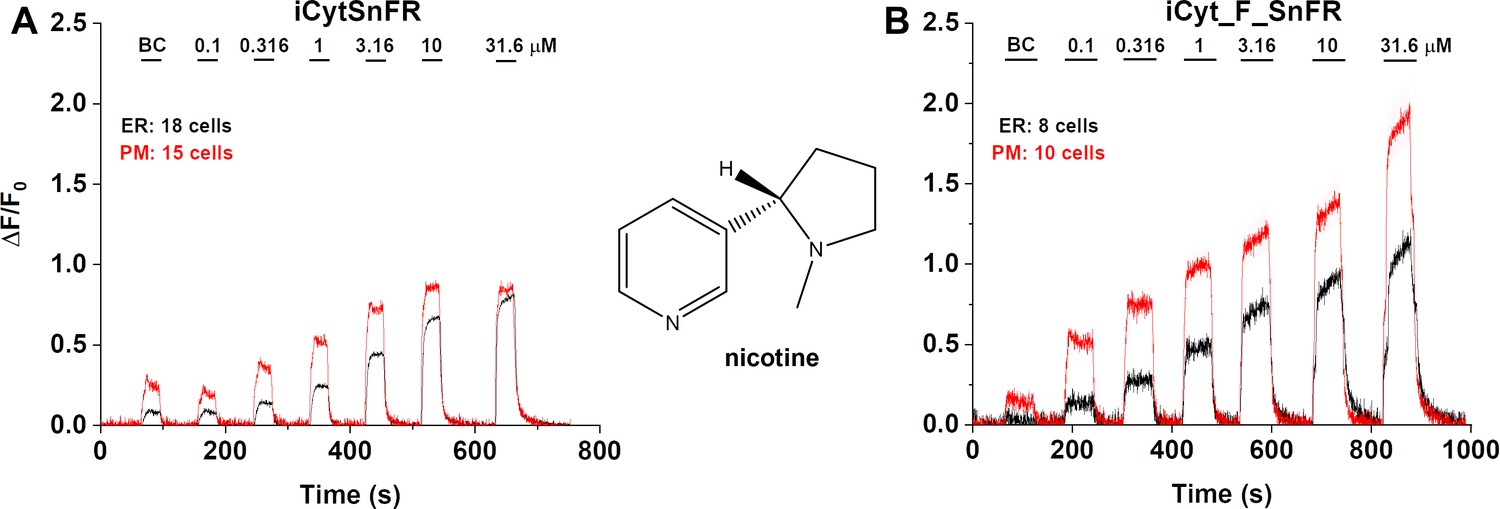
Dose–response relations for iCytSnFR and iCyt_F_SnFR against nicotine in HeLa cells.
BC, buffer control. SEM of data are indicated by semi-transparent shrouds around traces where trace width is exceeded. (A) iCytSnFR and (B) iCyt_F_SnFR detect nicotine at both the plasma membrane (PM) and endoplasmic reticulum (ER). Nicotine enters and exits the ER rapidly over seconds, a direct contrast to the behavior of cytisine and 10-fluorocytisine as detected by their intensity-based drug-sensing fluorescent reporter (iDrugSnFR) partners.
Figure 7—figure supplement 3
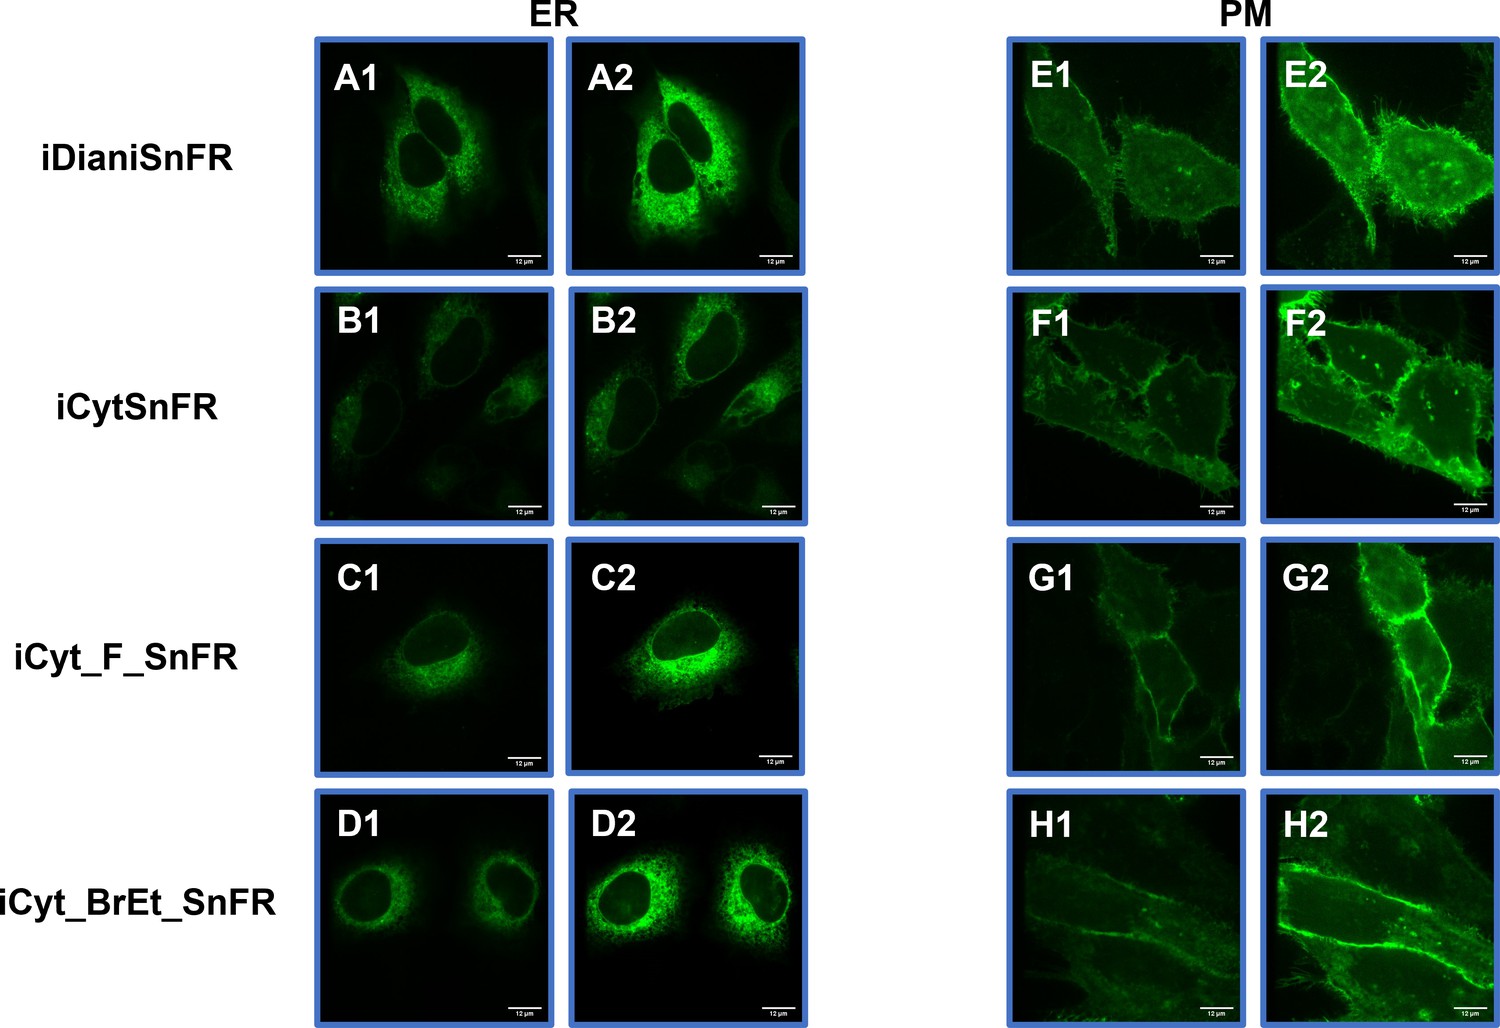
Spinning disk laser scanning confocal inverted microscope images of nicotinic agonist intensity-based drug-sensing fluorescent reporters (iDrugSnFRs) in HeLa cells.
Endoplasmic reticulum (ER)-targeted constructs of iDianiSnFR, iCytSnFR, iCyt_F_SnFR, and iCyt_BrEt_SnFR are shown before (A1–D1) and during (A2–D2) exposure to each drug partner. ER-targeted iDrugSnFRs show the reticulated ER and dark ovals corresponding to the nucleus. Plasma membrane (PM)-targeted constructs of the same iDrugSnFRs are shown before (E1–H1) and after (E2–H2) drug introduction. Localization to the PM is robust, with some minimal puncta that may represent inclusion bodies or internal transport.
Figure 8 with 1 supplement
Nicotinic agonist intensity-based drug-sensing fluorescent reporter (iDrugSnFR) dose–response experiments in mouse primary hippocampal neurons transduced with AAV9-hSyn iDrugSnFR.
Cultured primary mouse hippocampal neurons were transduced with endoplasmic reticulum (ER)- or plasma membrane (PM)-targeted constructs. BC, buffer control. SEM of data are indicated by semi-transparent shrouds around traces where trace width is exceeded. (A–D) Each iDrugSnFR detects its drug partner at the PM and ER over the concentrations sampled. (A) iDianiSnFR detects dianicline with a return to baseline fluorescence between drug applications. (B) iCytSnFR detection at the PM returns to baseline fluorescence between applications, while detection at the ER shows an incomplete washout. (C) iCyt_F_SnFR fluorescence response to the presence of 10-fluorocytisine in the ER also shows an incomplete washout between applications. (D) iCyt_BrEt_SnFR_ER detects 9-bromo-10-ethylcytisine with a wash-in and decay intermediate between iDianiSnFR and the other two cytisine derivatives.
Figure 8—figure supplement 1
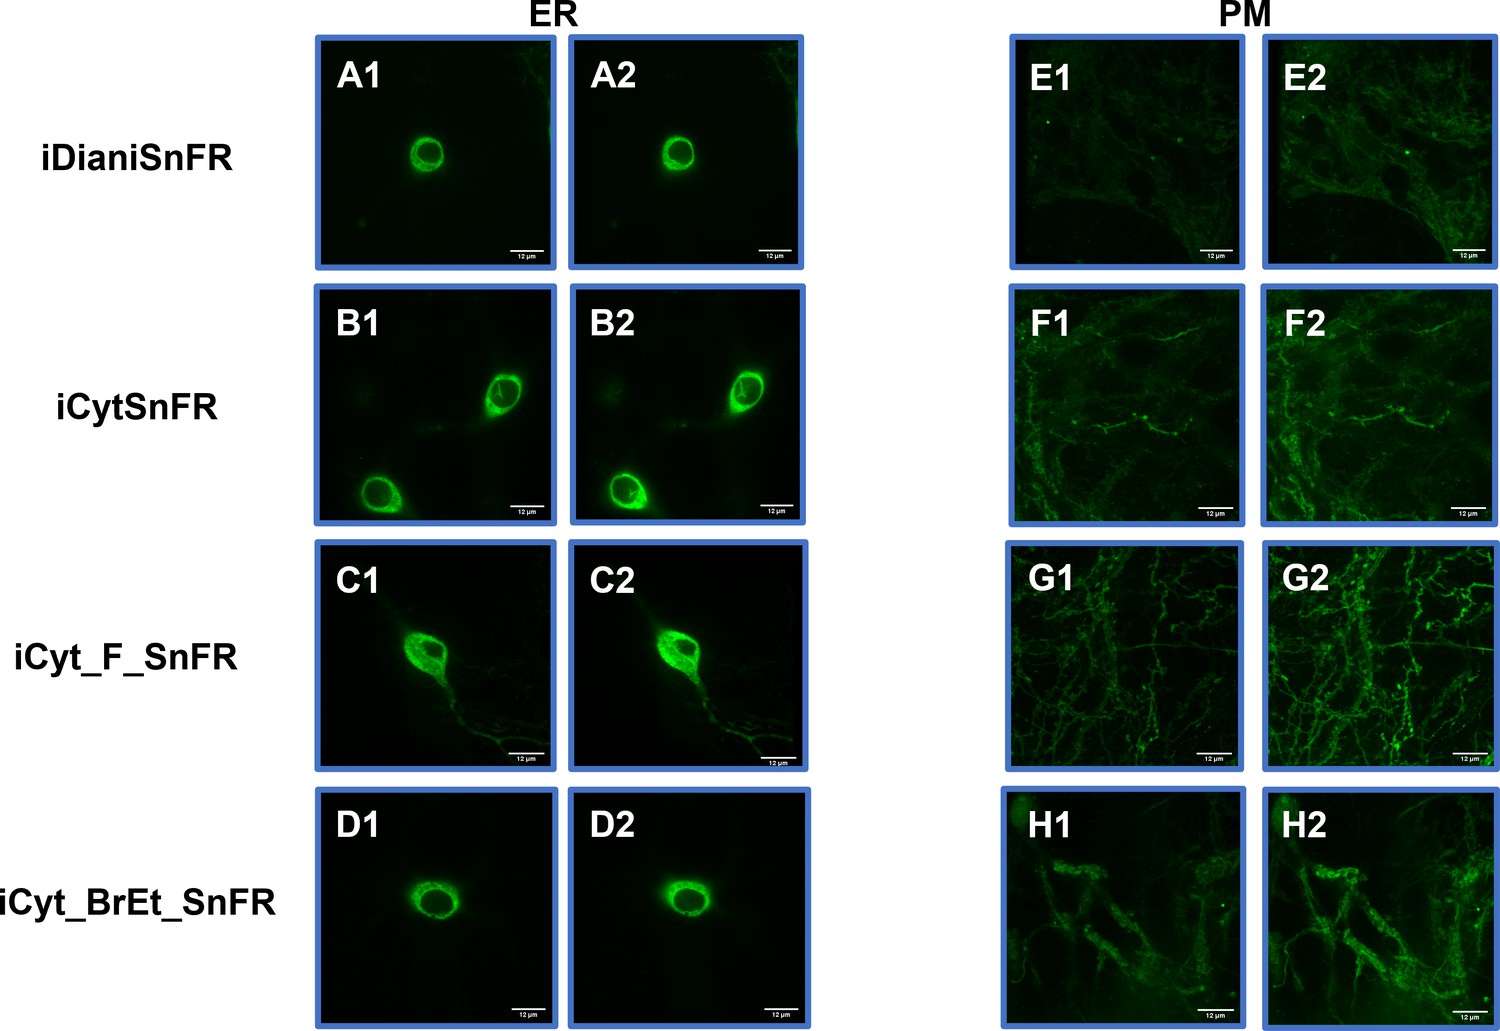
Spinning disk laser scanning confocal inverted microscope images of nicotinic agonist intensity-based drug-sensing fluorescent reporters (iDrugSnFRs) in primary mouse hippocampal neurons.
Endoplasmic reticulum (ER)-targeted constructs of iDianiSnFR, iCytSnFR, iCyt_F_SnFR, and iCyt_BrEt_SnFR are shown before (A1–D1) and during (A2–D2) exposure to each drug partner. ER-targeted iDrugSnFRs show the reticulated the ER and dark ovals corresponding to the nucleus. Plasma membrane (PM)-targeted constructs of the same iDrugSnFRs are shown before (E1–H1) and after (E2–H2) drug introduction. Localization in the PM is robust, with some minimal puncta that may represent inclusion bodies or internal transport.
Appendix 2—figure 1
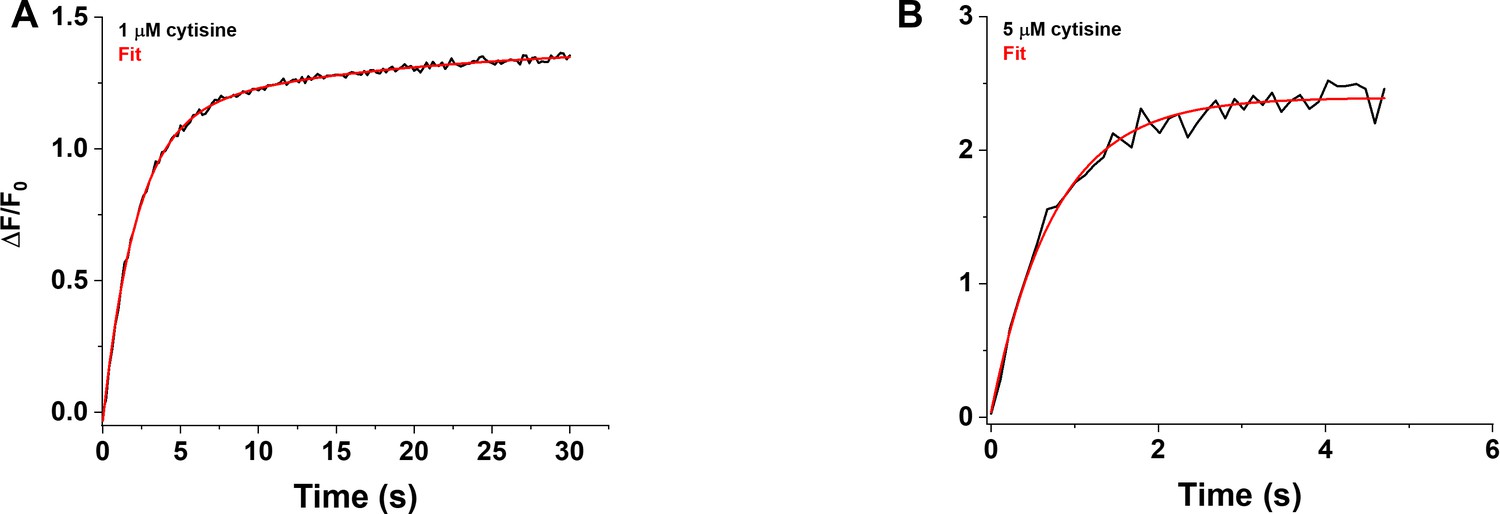
Rising phase of the iCytSnFR_PM response to cytisine in HEK293T cells.
(A) Example of the biphasic rising phase of a 1 µM cytisine response in an individual area (black trace, mean of four cells). Cytisine was applied for 30 s. The fast and slow time constants of the rising phase (τf0n, τs0n) were 2.15 ± 0.05 s and 17 ± 3 s (n = 151 frames, sampling rate of 5 frames/s), respectively. The red line is a fit to the sum of two declining exponentials (R2 of 0.998). It was significantly better than that to a single negative exponential rise to maximum component and a constant term (F-test, p<0.05). The As/(As + Af) was 20%. (B) Example of the rising phase of a response to a 5 s application of 5 µM cytisine in an individual area (mean of 10 cells, two replicates). The response appeared to be monophasic with a single time constant (τ0n) of 0.76 ± 0.04 s (n = 43 frames, sampling rate of 9.8 frames/s). The red line is a fit to the sum of a negative exponential rise to a maximum, and constant, term (R2 of 0.98).
Appendix 2—figure 2
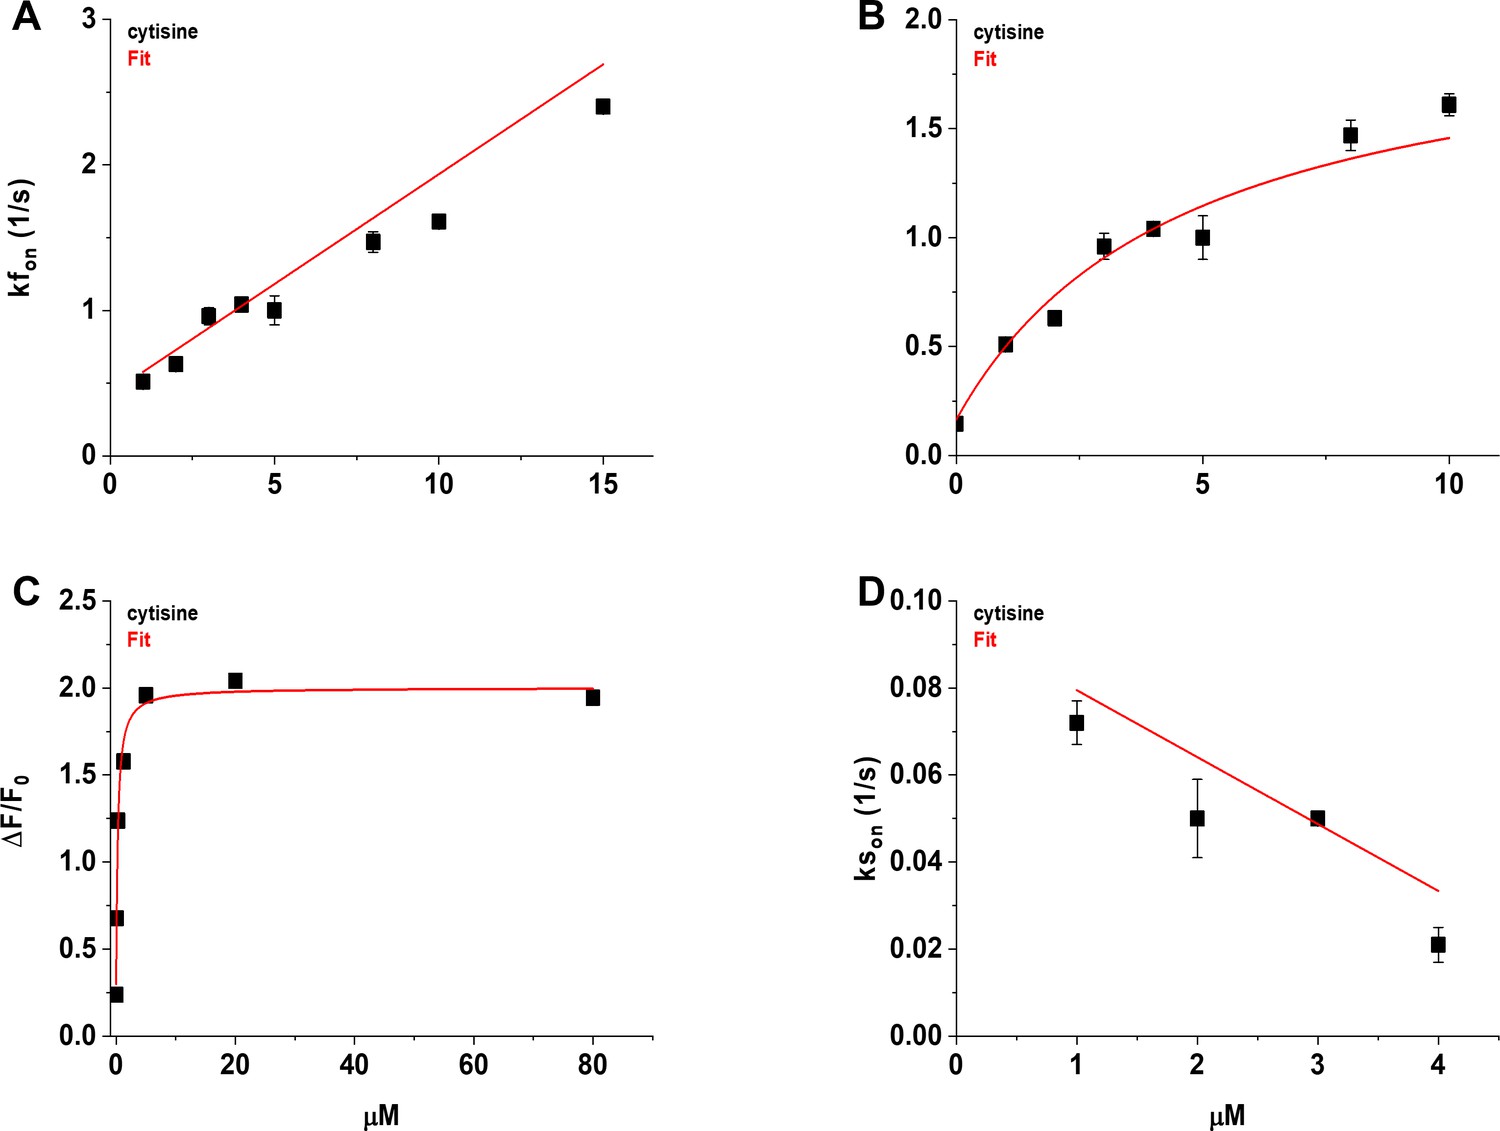
Concentration dependence of the fast (kfon) and slow rising rate constants (kson) of the cytisine response.
(A) The [Cytisine]-kfon relation was approximately linear between 1 and 15 µM cytisine. Symbols (filled squares) are the mean kfon for the individual cytisine concentrations tested (n = 7–10 areas per concentration, 29–40 cells). The red line is a regression line fit to the data using linear least-squares regression. See text for the values of the slope, intercept, and correlation coefficient. (B) The [Cytisine]-kfon relation for the kfon was more hyperbolic than linear between 0 and 10 µM cytisine. Red line is a fit to the sum of a hyperbolic, and constant, term using nonlinear least-squares regression. See text for fitted parameters. We used the mean slow decay rate constant (ksoff) of the cytisine response for the kfon at 0 µM cytisine (0.146 ± 0.006 s–1). (C) Concentration–response (CR) relation for the mean steady-state response to cytisine of iCytSnFR_PM sensors expressed in HeLa cells (n = 11 cells, see Figure 7B). Red line is the fit to the sum of a hyperbolic, and constant, terms using nonlinear least-squares regression. See text for fitted parameters. Symbols (filled squares) are the mean values for the final 10 s of the steady-state cytisine response. (D) The [Cytisine]-kson relation for 1–4 µM cytisine. Red line is a regression line fit to the data using linear least-squares regression. See text for the slope, intercept, and correlation coefficient. Symbols (filled squares) are the mean kson for the individual cytisine concentration tested (n = 8–10 areas per concentration, 31–38 cells). Error bars in panels (A–D) are ± SEM. Symbols obscure the bars at some concentrations in panels (A), (B), and (D), and all concentrations in panel (C).
Appendix 2—figure 3
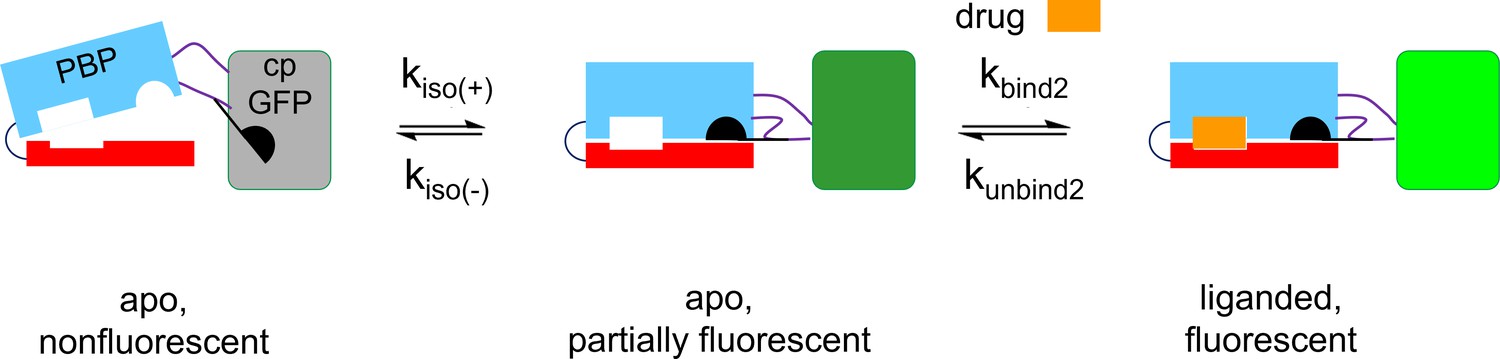
A three-state kinetic scheme for iCytSnFR.
The diagram contains cartoons of the PBP moiety (blue and red), the linkers (black lines), the Glu78 ‘candle snuffer’ attached to Linker 1 (black), and the cpGFP moiety (gray, dark green, or green). We postulate that the intensity-based drug-sensing fluorescent reporter (iDrugSnFR) exists in an apo nonfluorescent state and an apo fluorescent state; these states interconvert with time constants of tens of seconds k(iso(+), kiso(-)). Cytisine binds to the apo fluorescent state (kbind2), inducing an additional fluorescent state on a briefer time scale. The initial fluorescence increase represents the binding-induced increase, and the slower increase is governed by partial re-equilibration of the two apo states. Upon removal of cytisine after just a few seconds of perfusion (Figure 6), the fluorescence decay represents the dissociation of cytisine (kunbind2). This scheme resembles the model we and colleagues developed to account for iSeroSnFR (Unger et al., 2020). For the iDrugSnFRs reported in this paper, we conclude that the apo, fluorescent state is less bright than the bound state (shown by the different colors of the cpGFP moiety).
Videos
Video 1
Genetically encoded fluorescent biosensors show how drugs cross membranes in real time.
Video 2
Video morph of PDB 7S7V to 7S7T.
PBP at the left; cpGFP at the right; key side chains in the linkers are shown as spheres. The ligand, varenicline, is shown as sticks.
Video 3
iDianiSnFR_ER dose-response relations in HeLa cells.
The dianicline concentrations are shown. The scale bar is shown. The video is 25-fold faster than real time.
Video 4
iDianiSnFR_PM dose-response relations in HeLa cells.
The dianicline concentrations are shown. The scale bar is shown.The video is 25-fold faster than real time.
Video 5
iCytSnFR_ER dose-response relations in HeLa cells.
The cytisine concentrations are shown. The scale bar is shown. The video is 25-fold faster than real time.
Video 6
iCytSnFR_PM dose-response relations in HeLa cells.
The cytisine concentrations are shown. The scale bar is shown. The video is 25-fold faster than real time.
Tables
Table 1
Nicotinic agonist iDrugSnFR naming, dose-response relations, and residues mutated.
Parent constructs in bold. Measurements in E. coli lysates (L) or with purified protein (P). ND, not determined. Data for iAChSnFR from Borden et al., 2019; data for iNicSnFR3b from Shivange et al., 2019.
Informal name | Drug of interest | ΔFmax/F0 | EC50 (µM) | S-slope | Residues mutated vs. parent constructs | ||||||||||
|---|---|---|---|---|---|---|---|---|---|---|---|---|---|---|---|
| L | P | L | P | L | P | 11 | 43 | 44 | 68 | 324 | 360 | 391 | 395 | ||
| iNicSnFR3b | Nicotine | ND | 10 | ND | 19 | ND | 0.5 | E | E | N | H | S | T | F | G |
| iDianiSnFR | Dianicline | 7.4 ± 0.1 | 4.7 ± 0.2 | 6.7 ± 0.3 | 15 ± 1 | 1.1 | 0.3 | D | R | - | S | N | G | - | N |
| iAChSnFR | ACh | ND | 12 | ND | 1.3 | ND | 9.2 | I | V | N | H | A | T | F | G |
| iCytSnFR | Cytisine | 5.0 ± 0.2 | 7.3 ± 0.4 | 9.4 ± 0.8 | 11 ± 1 | 0.5 | 0.7 | - | Y | - | - | - | - | W | - |
| iCyt_F_SnFR | 10-Fluorocytisine | 7.9 ± 0.1 | 2.3 ± 0.1 | 1.4 ± 0.04 | 1.6 ± 0.3 | 5.6 | 1.4 | - | N | G | - | - | - | W | - |
| iCyt_BrEt_SnFR | 9-Bromo- 10-ethylcytisine | 4.0 ± 0.03 | 3.6 ± 0.04 | 5.7 ± 0.1 | 4.2 ± 0.2 | 0.7 | 0.9 | - | Q | G | - | - | - | W | - |
Table 2
Intensity-based drug-sensing fluorescent reporter (iDrugSnFR) dose–response relations versus a selected panel of nicotinic agonists.
ND, not determined. *, ** EC50 and ∆Fmax/F0 could not be determined from the data (Figure 3). Therefore, the upper limit to the S-slope is estimated from the data at the foot of the dose–response relation.
| Drug name | iDianiSnFR | iCytSnFR | iCyt_F_SnFR | iCyt_BrEt_SnFR | ||||||||
|---|---|---|---|---|---|---|---|---|---|---|---|---|
| ΔFmax/F0 | EC50 (µM) | S-slope | ΔFmax/F0 | EC50 (µM) | S-slope | ΔFmax/F0 | EC50 (µM) | S-slope | ΔFmax/F0 | EC50 (µM) | S-slope | |
| Choline | 2.0 ± 0.1 | 84 ± 20 | < 0.1 | 5.8 ± 0.2 | 240 ± 30 | < 0.1 | 2.6 ± 0.1 | 18 ± 1 | 0.1 | 2.6 ± 0.1 | 12 ± 1 | 0.2 |
| Acetylcholine | 7.4 ± 1.0 | 660 ± 80 | < 0.1 | 2.9 ± 0.1 | 35 ± 3 | < 0.1 | 4.4 ± 0.3 | 222 ± 50 | < 0.1 | 2.5 ± 0.2 | 73 ± 6 | <0.1 |
| Cytisine | - | - | <0.1* | 7.3 ± 0.4 | 11 ± 1 | 0.7 | 4.4 ± 0.1 | 2.6 ± 0.3 | 1.7 | 4.7 ± 0.1 | 3.5 ± 0.2 | 1.3 |
| Dianicline | 4.7 ± 0.2 | 15 ± 1 | 0.3 | 6.5 ± 0.4 | 34 ± 4 | 0.2 | 2.3 ± 0.3 | 43 ± 6 | < 0.1 | 4–6 | >100 | <0.1** |
| Nicotine | 2.2 ± 0.1 | 440 ± 100 | < 0.1 | 6.4 ± 0.2 | 14 ± 2 | 0.5 | 4.7 ± 0.1 | 3.8 ± 0.2 | 1.2 | 4.8 ± 0.1 | 5.5 ± 0.2 | 0.9 |
| Varenicline | 2.4 ± 2.0 | 1200 ± 500 | < 0.1 | 6.5 ± 0.1 | 0.06 ± 0.01 | 110 | 7.1 ± 0.2 | 0.09 ± 0.02 | 79 | 5.3 ± 0.1 | 0.06 ± 0.01 | 88 |
| 10-Fluorocytisine | ND | ND | ND | ND | ND | ND | 2.3 ± 0.1 | 1.6 ± 0.3 | 1.4 | 3.0 ± 0.1 | 4.7 ± 0.3 | 0.6 |
| 9-Bromo- 10-ethylcytisine | ND | ND | ND | ND | ND | ND | 3.1 ± 0.1 | 31 ± 2 | 0.1 | 3.6 ± < 0.1 | 4.2 ± 0.2 | 0.9 |
Table 3
Affinity, occupancy number, and thermodynamic data calculated from isothermal titration calorimetry.
Data are the mean ± SEM, three runs.
| Biosensor | KD (μM) | n | ΔH(kcal/mol) | -TΔS(kcal/mol) | ΔG(kcal/mol) |
|---|---|---|---|---|---|
| iCytSnFR | 13.7 ± 1.1 | 0.84 ± 0.05 | –2.1 ± 0.1 | –4.6 ± 0.2 | –6.6 ± 0.1 |
| iCyt_F_SnFR | 1.8 ± 0.5 | 0.83 ± 0.02 | –5.5 ± 0.1 | –2.4 ± 0.2 | –7.9 ± 0.1 |
| iCyt_BrEt_SnFR | 5.4 ± 0.8 | 0.69 ± 0.09 | –1.12 ± 0.03 | 6.1 ± 0.1 | –7.2 ± 0.1 |
| iDianiSnFR | 7.6 ± 1.4 | 0.92 ± 0.02 | 3.2 ± 0.5 | 10.1 ± 0.4 | –7.0 ± 0.2 |
Key resources table
| Reagent type (species) or resource | Designation | Source or reference | Identifiers | Additional information |
|---|---|---|---|---|
| Strain, strain background (Escherichia coli) | BL21(DE3) | Agilent Technologies, Santa Clara, CA | 200131 | Chemically competent |
| Cell line (Homo sapiens) | HeLa | ATCC | CCL-2; RRID:CVCL_0030 | |
| Cell line (H. sapiens) | HEK293T | ATCC | CRL-3216; RRID:CVCL_0063 | |
| Biological sample (Mus musculus) | Primary hippocampal neurons | Caltech animal facilities | RRID:IMSR_JAX:000664 | Freshly isolated from Mus musculus |
| Recombinant DNA reagent | iAChSnFR | Loren Looger | Addgene: 137955 | Obtainable through Addgene |
| Recombinant DNA reagent | iDianiSnFR | This paper | Addgene: 177741 | Obtainable through Addgene |
| Recombinant DNA reagent | iCytSnFR | This paper | Addgene: 177738 | Obtainable through Addgene |
| Recombinant DNA reagent | iCyt_F_SnFR | This paper | Addgene: 177739 | Obtainable through Addgene |
| Recombinant DNA reagent | iCyt_BrEt_SnFR | This paper | Addgene: 177740 | Obtainable through Addgene |
| Recombinant DNA reagent | pCMV(MinDis)-iDianiSnFR_PM | This paper | Addgene: 177751 | Obtainable through Addgene |
| Recombinant DNA reagent | pCMV(MinDis)-iDianiSnFR_ER | This paper | Addgene: 177750 | Obtainable through Addgene |
| Recombinant DNA reagent | pCMV(MinDis)-iCytSnFR_PM | This paper | Addgene: 177743 | Obtainable through Addgene |
| Recombinant DNA reagent | pCMV(MinDis)-iCytSnFR_ER | This paper | Addgene: 177742 | Obtainable through Addgene |
| Recombinant DNA reagent | pCMV(MinDis)-iCyt_F_SnFR_PM | This paper | Addgene: 177745 | Obtainable through Addgene |
| Recombinant DNA reagent | pCMV(MinDis)-iCyt_F_SnFR_ER | This paper | Addgene: 177744 | Obtainable through Addgene |
| Recombinant DNA reagent | pCMV(MinDis)-iCyt_BrEt_SnFR_PM | This paper | Addgene: 177747 | Obtainable through Addgene |
| Recombinant DNA reagent | pCMV(MinDis)-iCyt_BrEt_SnFR_ER | This paper | Addgene: 177746 | Obtainable through Addgene |
| Recombinant DNA reagent | pAAV9-hSyn-iDianiSnFR_PM | This paper | Addgene: 177759 | Obtainable through Addgene |
| Recombinant DNA reagent | pAAV9-hSyn-iDianiSnFR_ER | This paper | Addgene: 177758 | Obtainable through Addgene |
| Recombinant DNA reagent | pAAV9-hSyn-iCytSnFR_PM | This paper | Addgene: 177753 | Obtainable through Addgene |
| Recombinant DNA reagent | pAAV9-hSyn-iCytSnFR_ER | This paper | Addgene: 177752 | Obtainable through Addgene |
| Recombinant DNA reagent | pAAV9-hSyn-iCyt_F_SnFR_PM | This paper | Addgene: 177755 | Obtainable through Addgene |
| Recombinant DNA reagent | pAAV9-hSyn-iCyt_F_SnFR_ER | This paper | Addgene: 177754 | Obtainable through Addgene |
| Recombinant DNA reagent | pAAV9-hSyn-iCyt_BrEt_SnFR_PM | This paper | Addgene: 177757 | Obtainable through Addgene |
| Recombinant DNA reagent | pAAV9-hSyn-iCyt_BrEt_SnFR_ER | This paper | Addgene: 177756 | Obtainable through Addgene |
| Commercial assay or kit | Phusion High-Fidelity PCR Kit | New England Biolabs | E0553L | |
| Commercial assay or kit | Q5 Site-Directed Mutagenesis Kit | New England Biolabs | E0554S | |
| Commercial assay or kit | QIAprep Spin Miniprep Kit | QIAGEN SCR_008539 | 27104 | |
| Commercial assay or kit | EndoFree Plasmid Maxi Kit | QIAGEN SCR_008539 | 12362 | |
| Commercial assay or kit | QIAquick PCR Purification Kit | QIAGEN SCR_008539 | 28104 | |
| Commercial assay or kit | QIAquick Gel Extraction Kit | QIAGEN SCR_008539 | 28704 | |
| Commercial assay or kit | AAVpro Purification Kit | Takara Bio Inc. | 6666 | |
| Commercial assay or kit | PACT premier | Molecular Dimensions | MD1-29 | |
| Chemical compound, drug | 10-Fluorocytisine | Tim Gallagher | Rego Campello et al., 2018 | |
| Chemical compound, drug | 9-Bromo-10-ethylcytisine | Tim Gallagher | Rego Campello et al., 2018 | |
| Chemical compound, drug | Lipofectamine 2000 Transfection Reagent | Thermo Fisher Scientific | 11668027 | |
| Chemical compound, drug | Lipofectamine 3000 Transfection Reagent | Thermo Fisher Scientific | L3000015 | |
| Software, algorithm | Spartan’20 | Wavefunction, Inc. | RRID:SCR_014901 | |
| Software, algorithm | NanoAnalyze | TA Instruments | https://www.tainstruments.com/sw/nano_analyze.html | |
| Software, algorithm | OriginPro 2018 | OriginLab | RRID:SCR_014212 | |
| Software, algorithm | KaleidaGraph | Synergy | RRID:SCR_014980 | |
| Software, algorithm | ImageJ | NIH | RRID:SCR_003070 | |
| Software, algorithm | XDS Program Package | MPI for Medical Research, Heidelberg | RRID:SCR_015652 | |
| Software, algorithm | Phenix | Phenix | RRID: SCR_014224, SCR_016736 | Adams et al., 2010 |
| Software, algorithm | Coot | MRC Laboratory of Molecular Biology | RRID:SCR_014222 | Emsley et al., 2010 |
Additional files
-
Supplementary file 1
Data collection and refinement statistics of iNicSnFR 3a.
- https://cdn.elifesciences.org/articles/74648/elife-74648-supp1-v4.xlsx
-
Supplementary file 2
Stopped-flow model determined rate constants.
- https://cdn.elifesciences.org/articles/74648/elife-74648-supp2-v4.xlsx
-
Transparent reporting form
- https://cdn.elifesciences.org/articles/74648/elife-74648-transrepform1-v4.docx
Download links
A two-part list of links to download the article, or parts of the article, in various formats.
Downloads (link to download the article as PDF)
Open citations (links to open the citations from this article in various online reference manager services)
Cite this article (links to download the citations from this article in formats compatible with various reference manager tools)
Fluorescence activation mechanism and imaging of drug permeation with new sensors for smoking-cessation ligands
eLife 11:e74648.
https://doi.org/10.7554/eLife.74648


