Late-life fitness gains and reproductive death in Cardiocondyla obscurior ants
- Zoologie/Evolutionsbiologie, Universität Regensburg, Germany
Figures
Figure 1 with 8 supplements
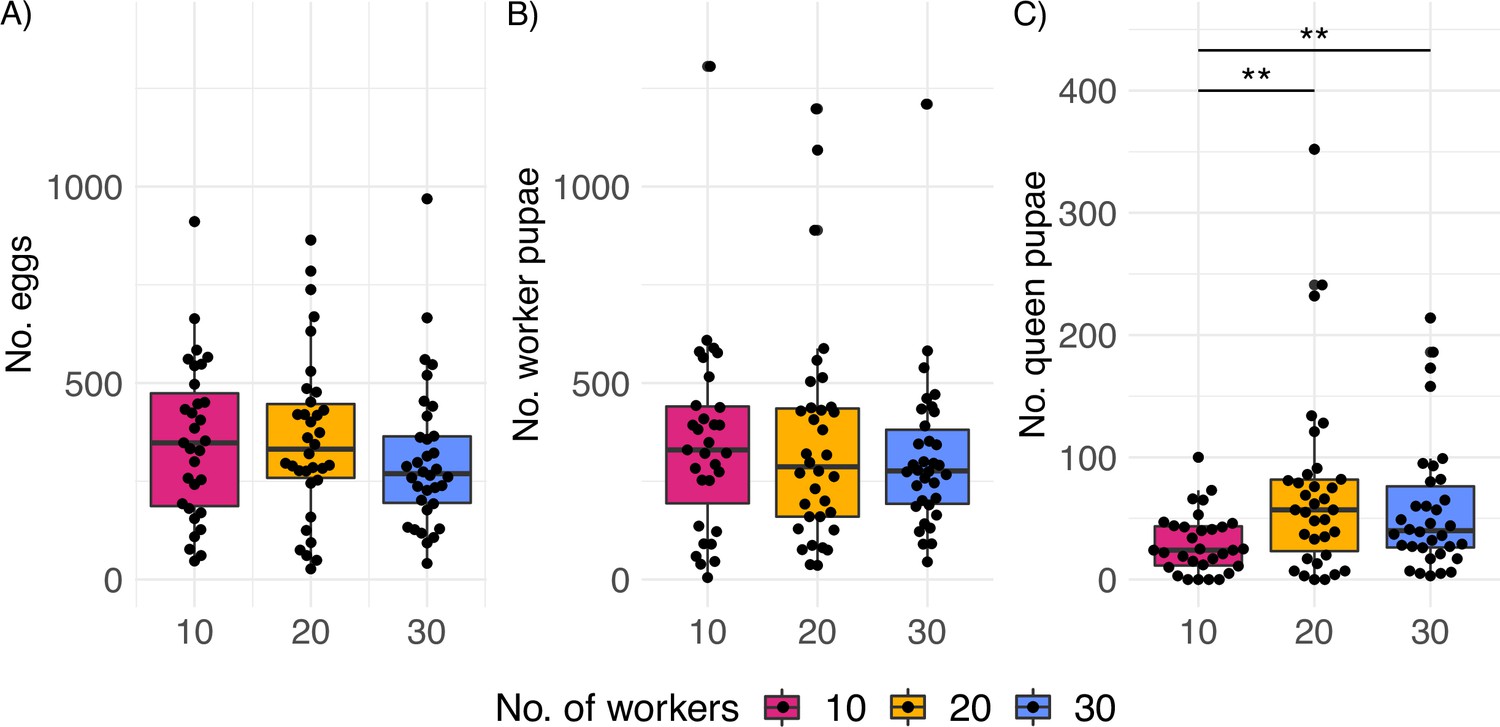
Productivity of C. obscurior colonies across treatments.
(A) Total number of eggs, (B) worker pupae, and (C) queen pupae (N = 31, 34, and 34 for 10, 20, and 30 worker colonies, respectively). Significant differences are given with **p<0.01 and ***p<0.001. Boxplots depict upper and lower quartile plus 1.5 interquartile range (IQR).
Figure 1—figure supplement 1
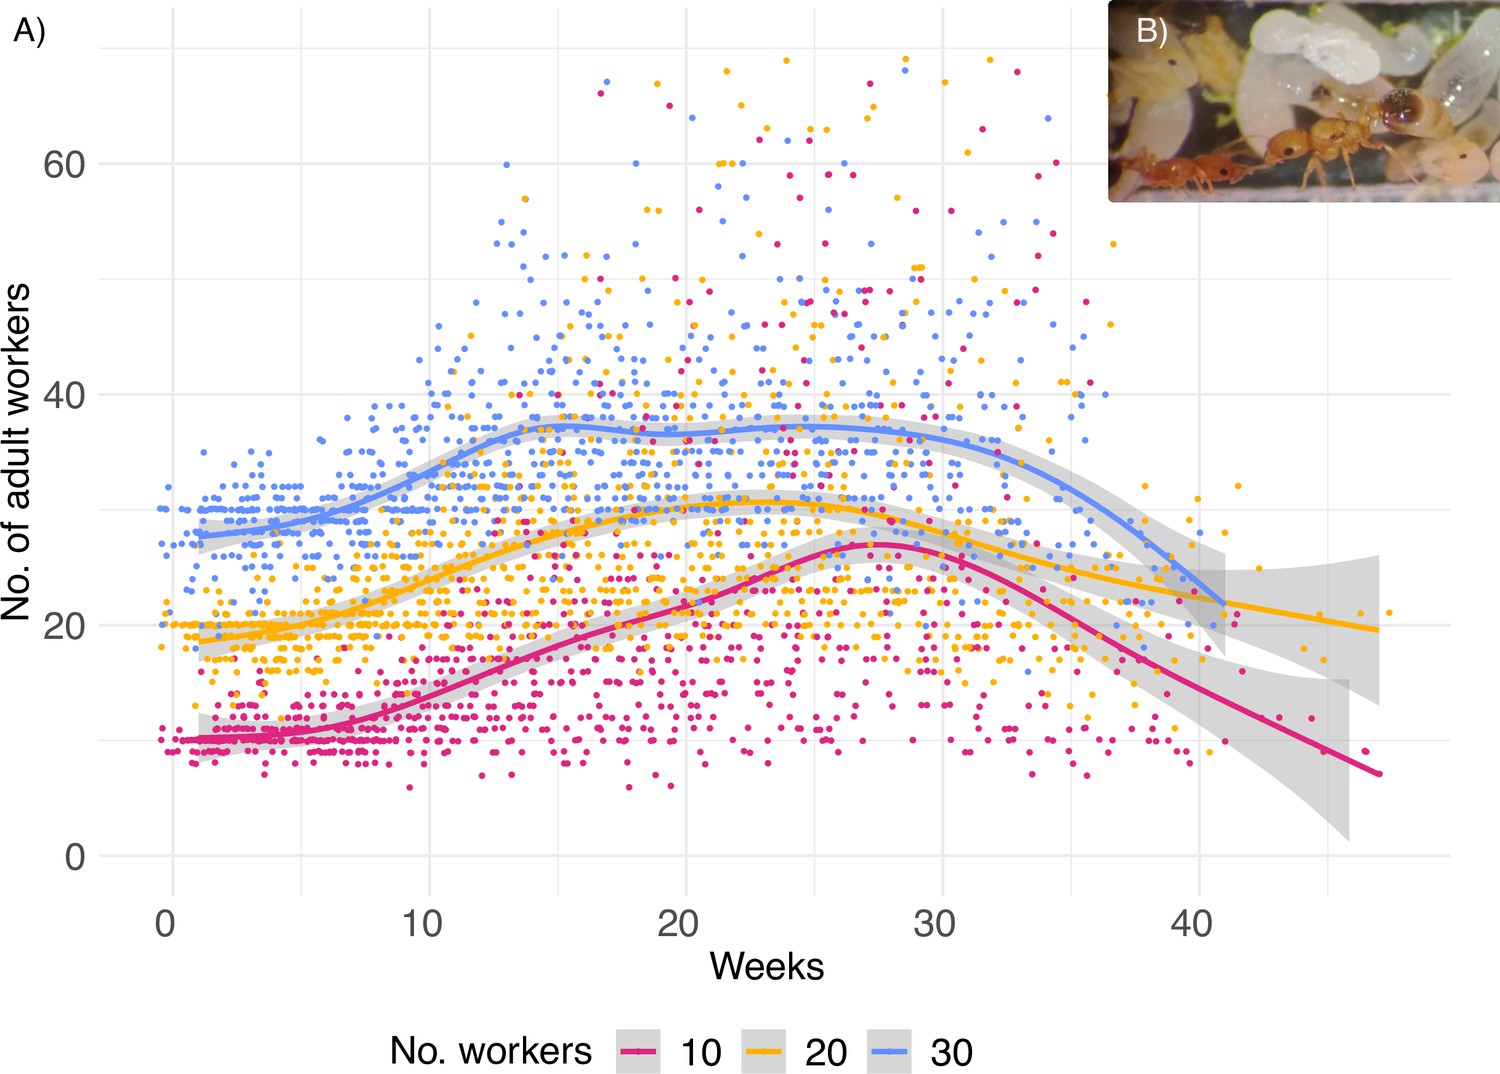
Number of workers in the experimental set-up.
(A) Adult ant workers present in the colonies over the lifetime of the queens (weekly count data), prior to standardization. (B) C. obscurior ant queens, workers, and colonies were monitored and standardized weekly.
Figure 1—figure supplement 2
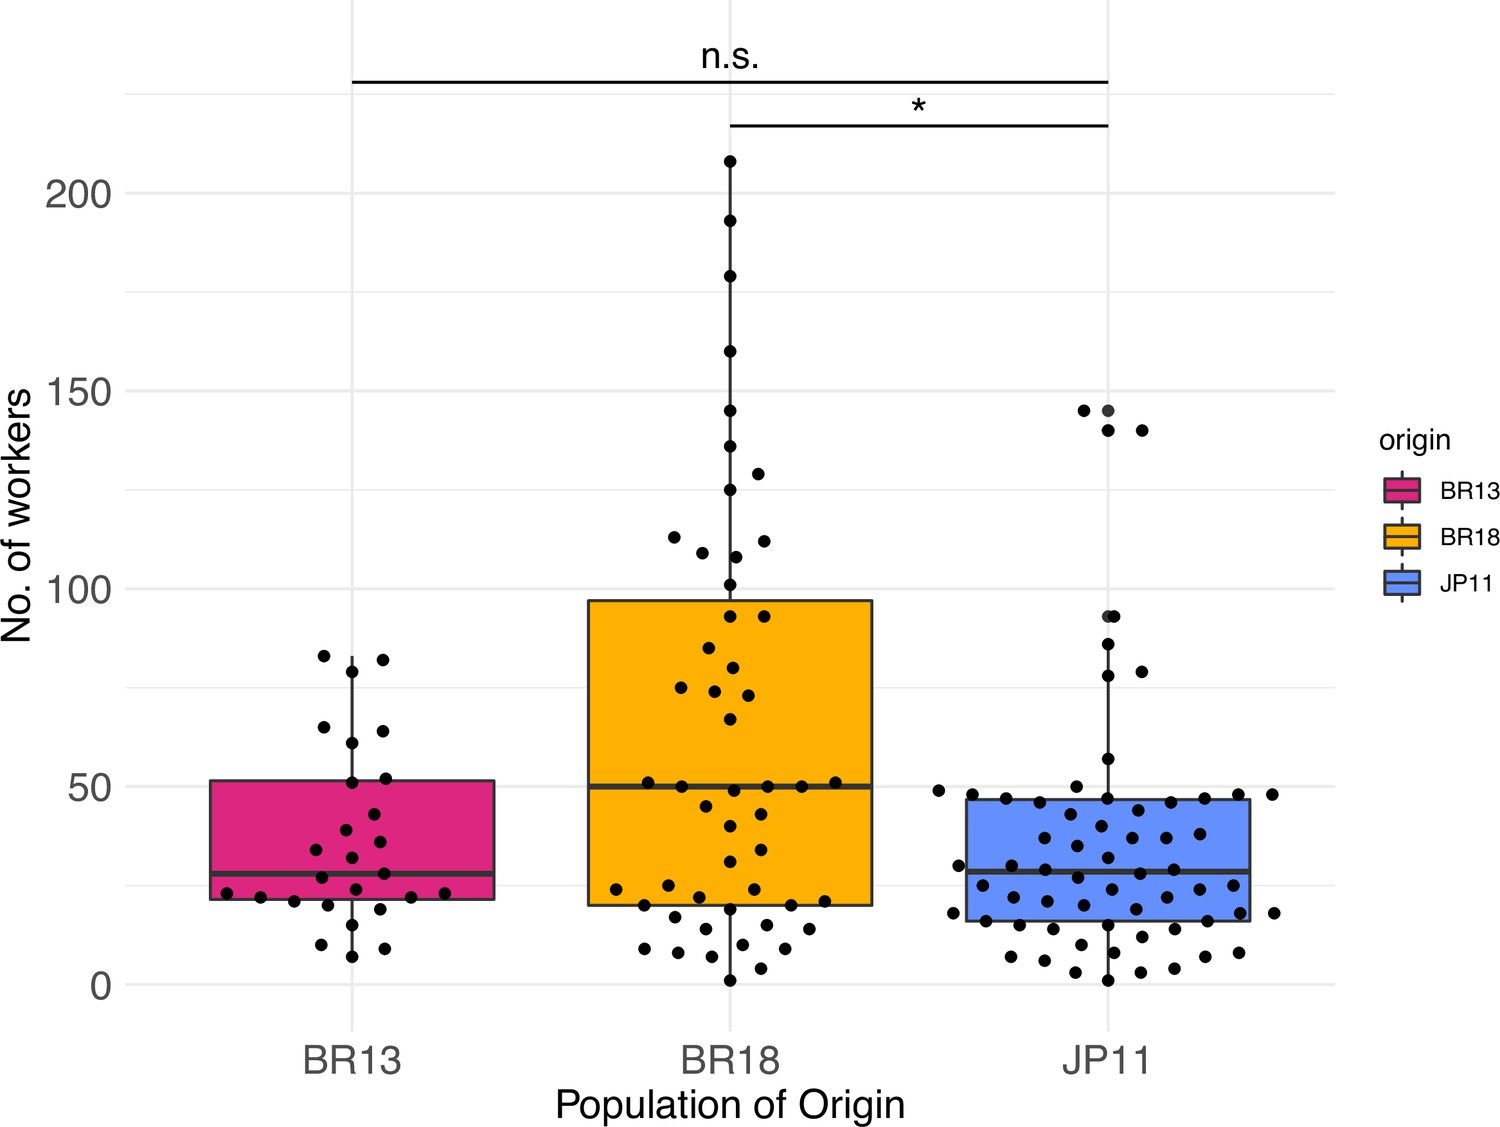
Worker numbers of colonies collected in 2013 (N = 27) and 2018 (N = 52) in Brazil and in 2011 in Japan (N = 62).
1–60 queens were produced per colony. The Brazilian populations ‘BR13’ (median = 28) and ‘BR18’ (median = 50), and the Japanese population ‘JP11’ (median = 28.5). Colony size differed between populations (Kruskal–Wallis test, X2 = 8.34, p<0.05), specifically among JP11 and BR18 (post-hoc Kruskal–Nemenyi test, p<0.05). Significant differences are given with *p<0.05. Boxplots depict upper and lower quartile plus 1.5 interquartile range (IQR).
Figure 1—figure supplement 3
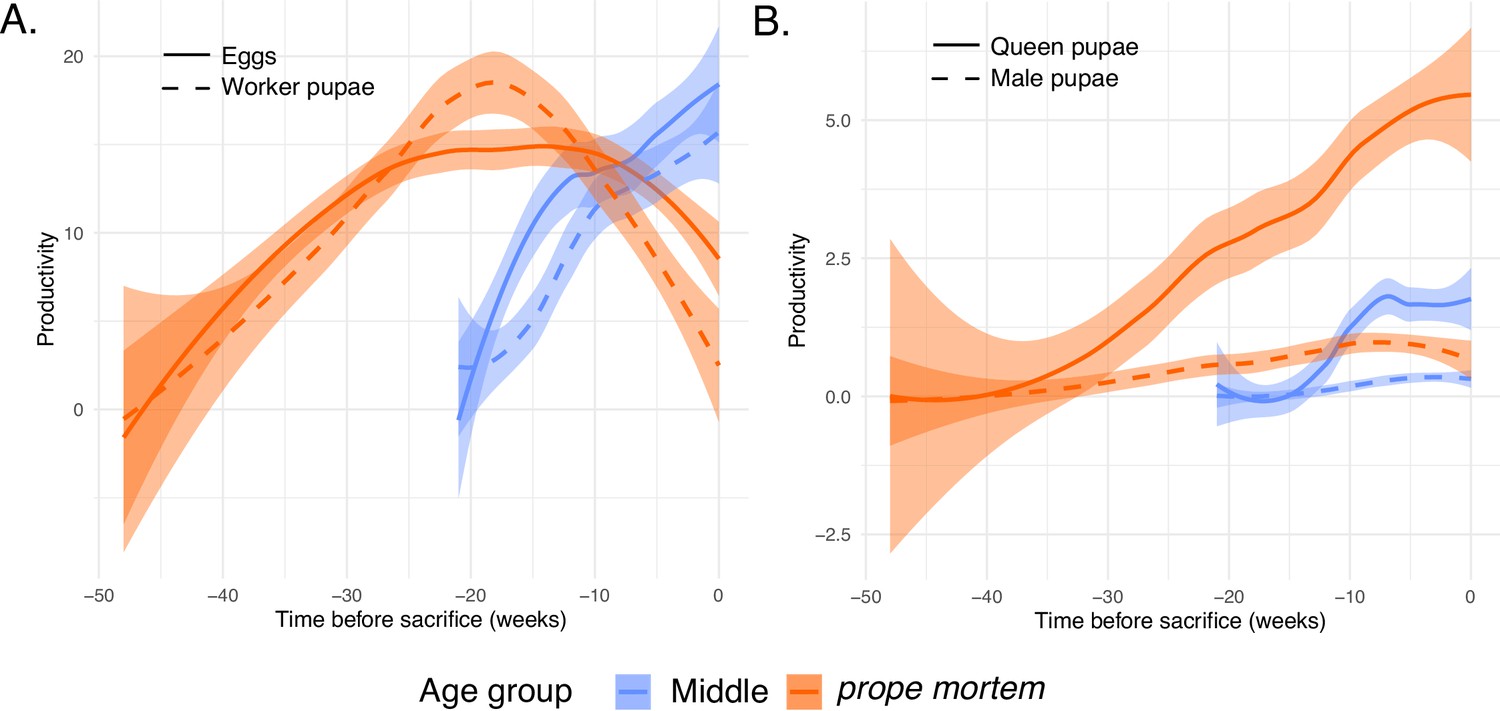
Productivity at the time of sampling of prope mortem (28–49 weeks old) and middle-aged queens (19–21 weeks old), n = 18.
(A) Egg and worker pupae production; (B) queen and male pupae production.
Figure 1—figure supplement 4
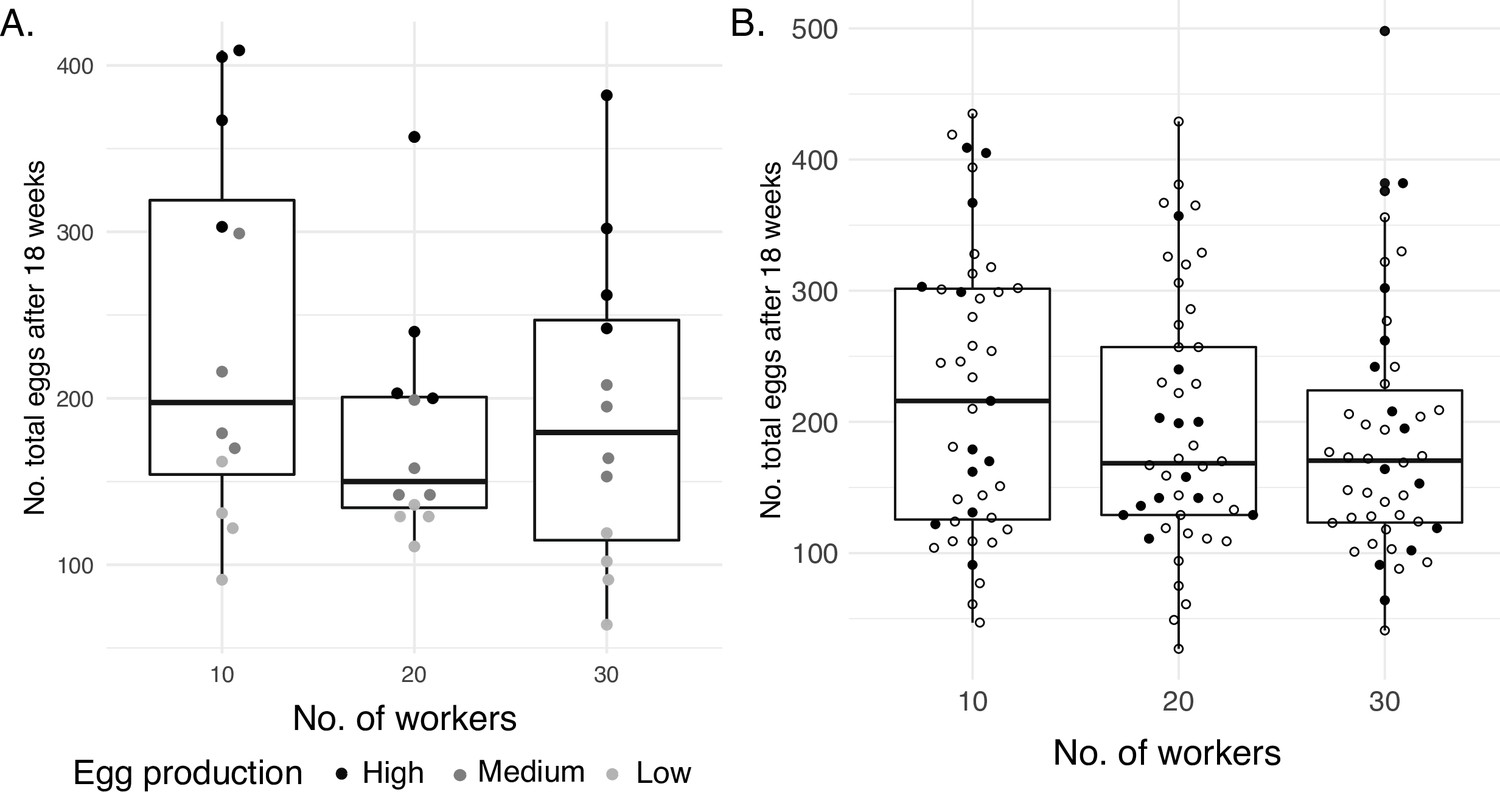
Egg productivity.
(A) Total eggs produced by the sacrificed queens after 18 weeks. The shade of gray of the closed circles represents the level of egg productivity of each queen. (B) Batch of 135 independent colonies from which the queens were selected based on their egg production, showing the broad range of productivity. Sacrificed queens are denoted with closed circles. Three colonies of the 10-worker treatment are not shown as they were accidentally killed.
Figure 1—figure supplement 5
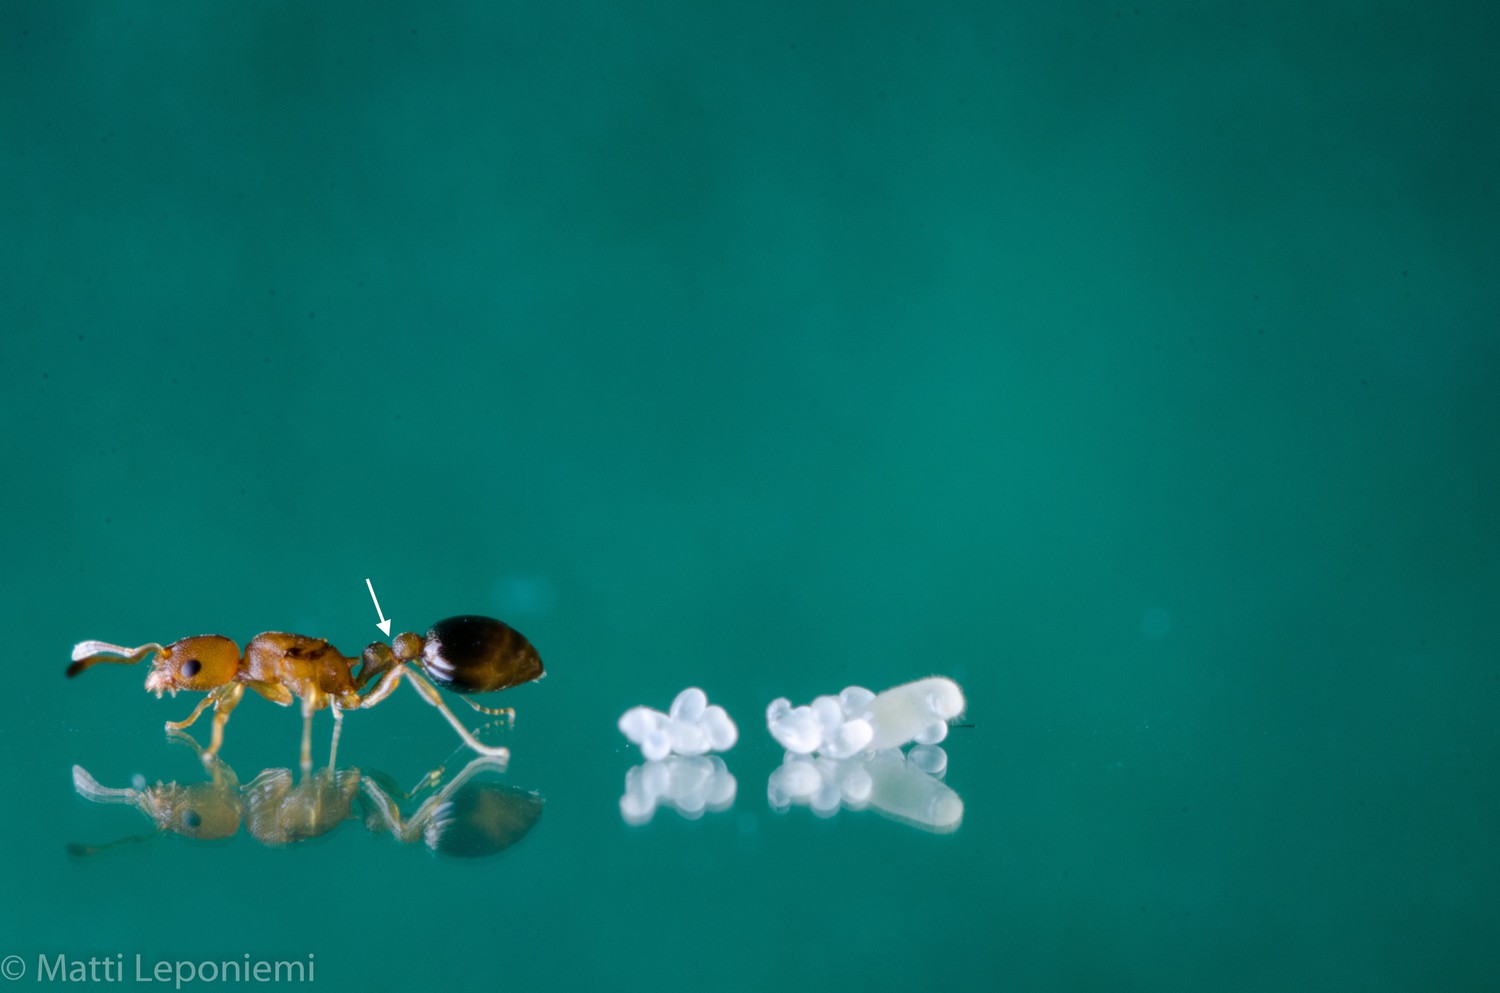
A queen of C. obscurior.
The arrow indicates where ‘head-thorax’ was separated from the ‘gaster,’ between the petiole and post-petiole for RNAseq. The ‘metasoma’ in the Hymenoptera comprises gaster, post-petiole, petiole, and the first abdominal segment, which is fused with the thorax.
Figure 1—figure supplement 6
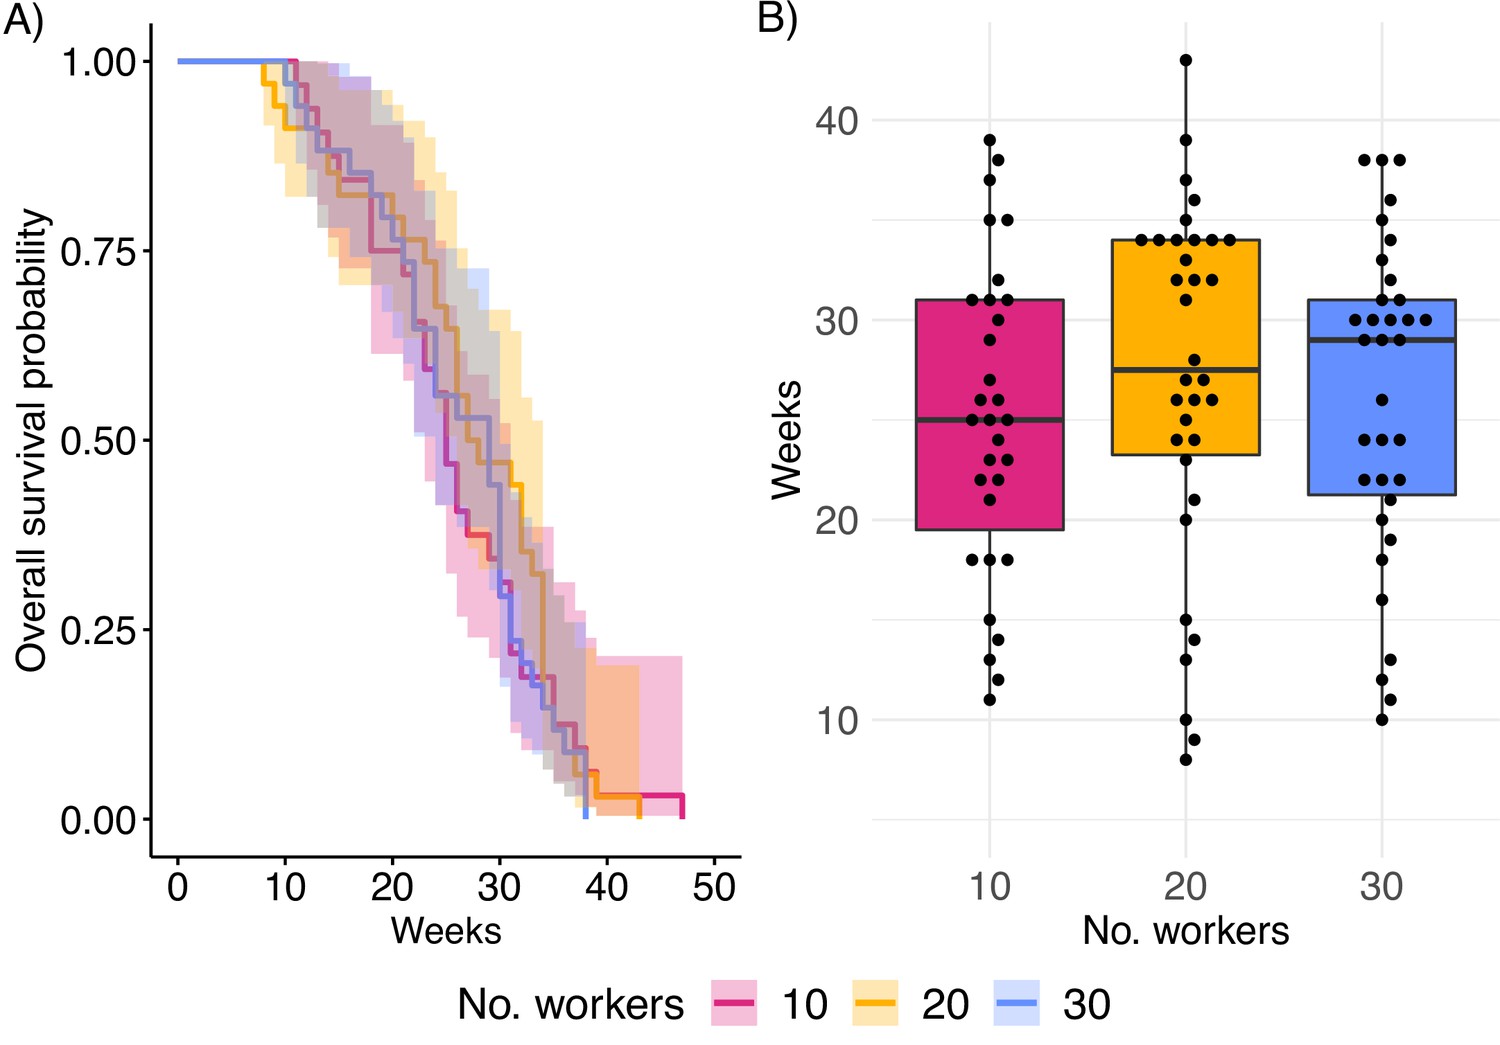
Queen longevity.
(A) Survival curve based on Cox proportional hazard regression model and (B) queen lifespan in weeks. Boxplots depict upper and lower quartile plus 1.5 interquartile range (IQR).
Figure 1—figure supplement 7
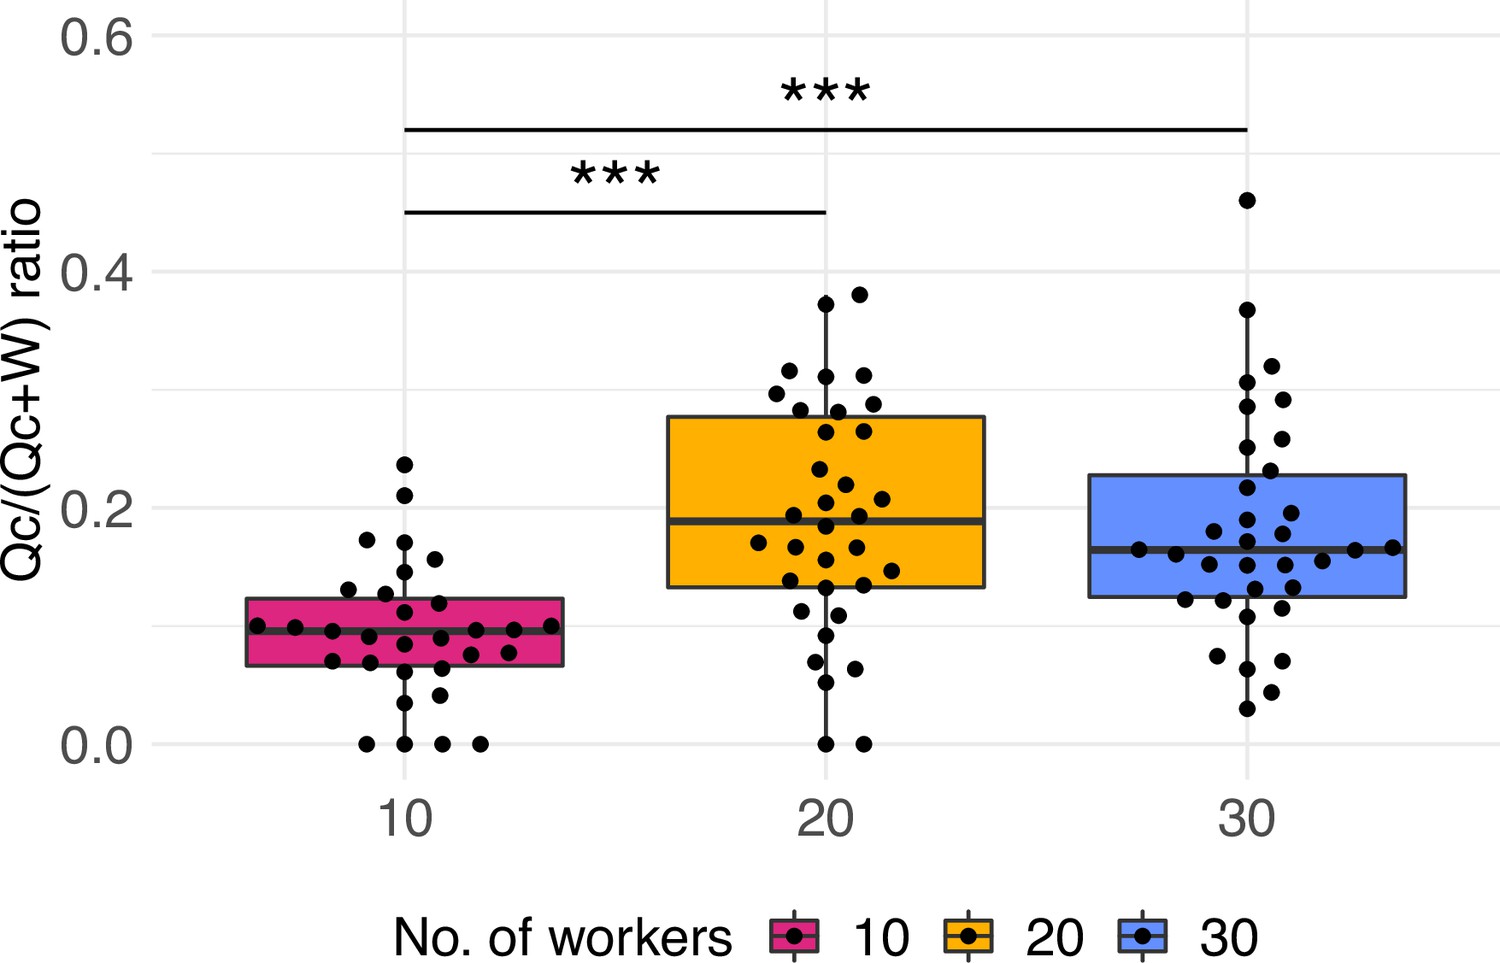
Investment caste ratio as total investment into queens over total investment into queens and workers (as Queen*c/[Queen*c + Worker]).
A coefficient or correction factor c is used as the dry average weight measurements of queen over workers to the power conversion factor of c = 0.7 (Boomsma, 1989). Results are robust to different power conversion values of 0.6–1 (Supplementary file 1A). Significant differences are given with ***p<0.001. Boxplots depict upper and lower quartile plus 1.5 interquartile range (IQR).
Figure 1—figure supplement 8
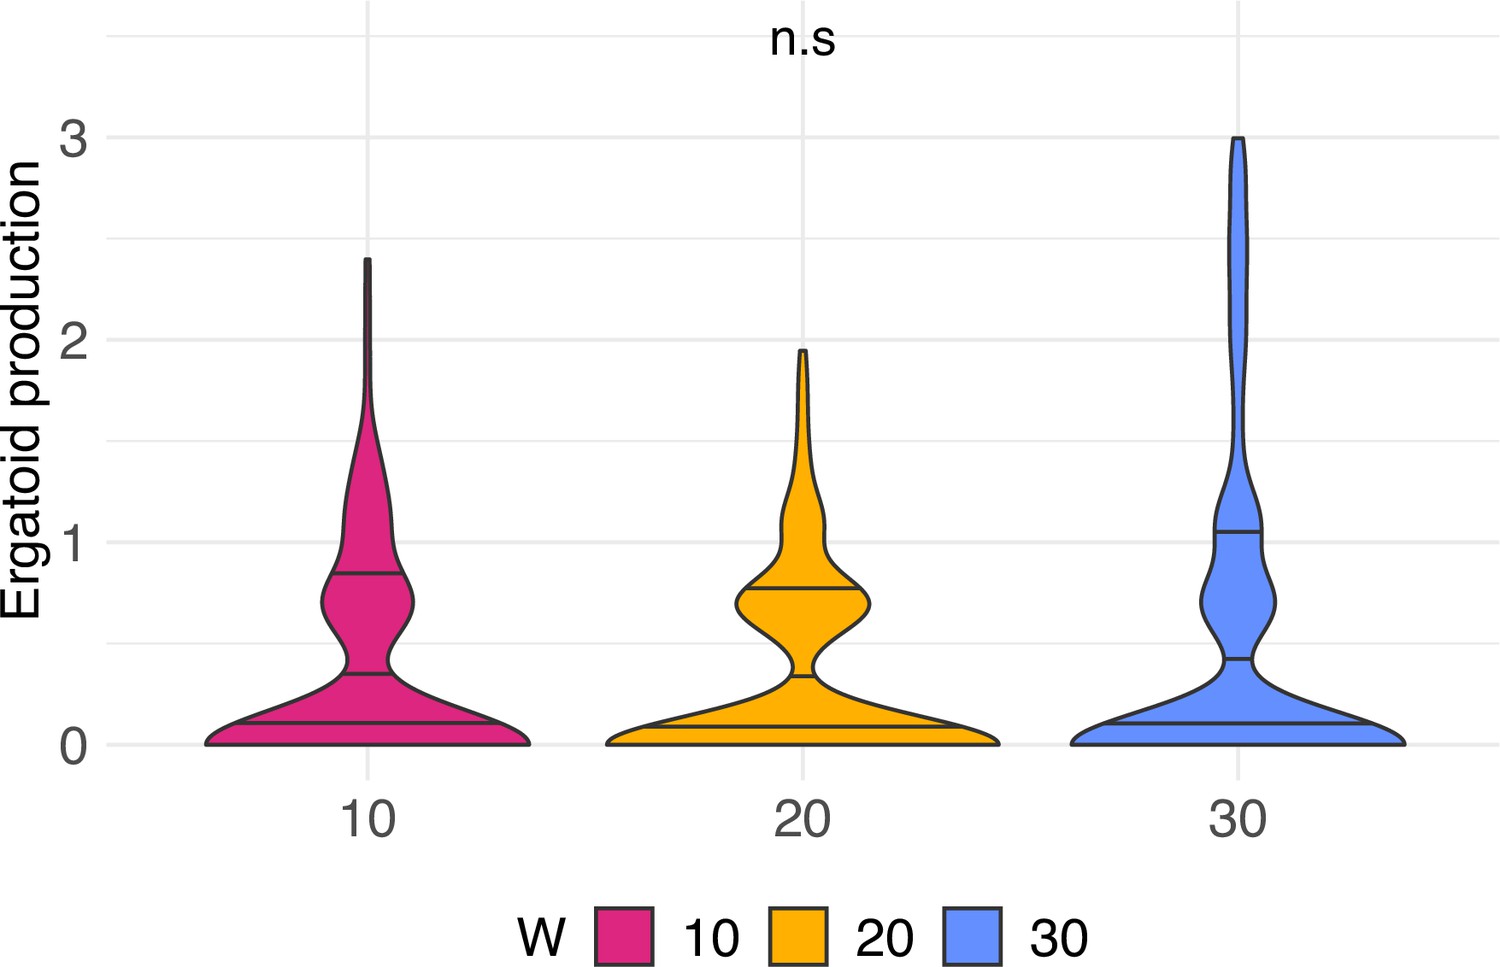
Wingless males, so-called ergatoid males, produced per week in C. obscurior colonies across treatments.
Violin density plots with horizontal lines that depict the estimated 25, 50, and 75% quantiles (n = 31, 34, and 34 for 10, 20, and 30 worker colonies, respectively).
Figure 2 with 2 supplements
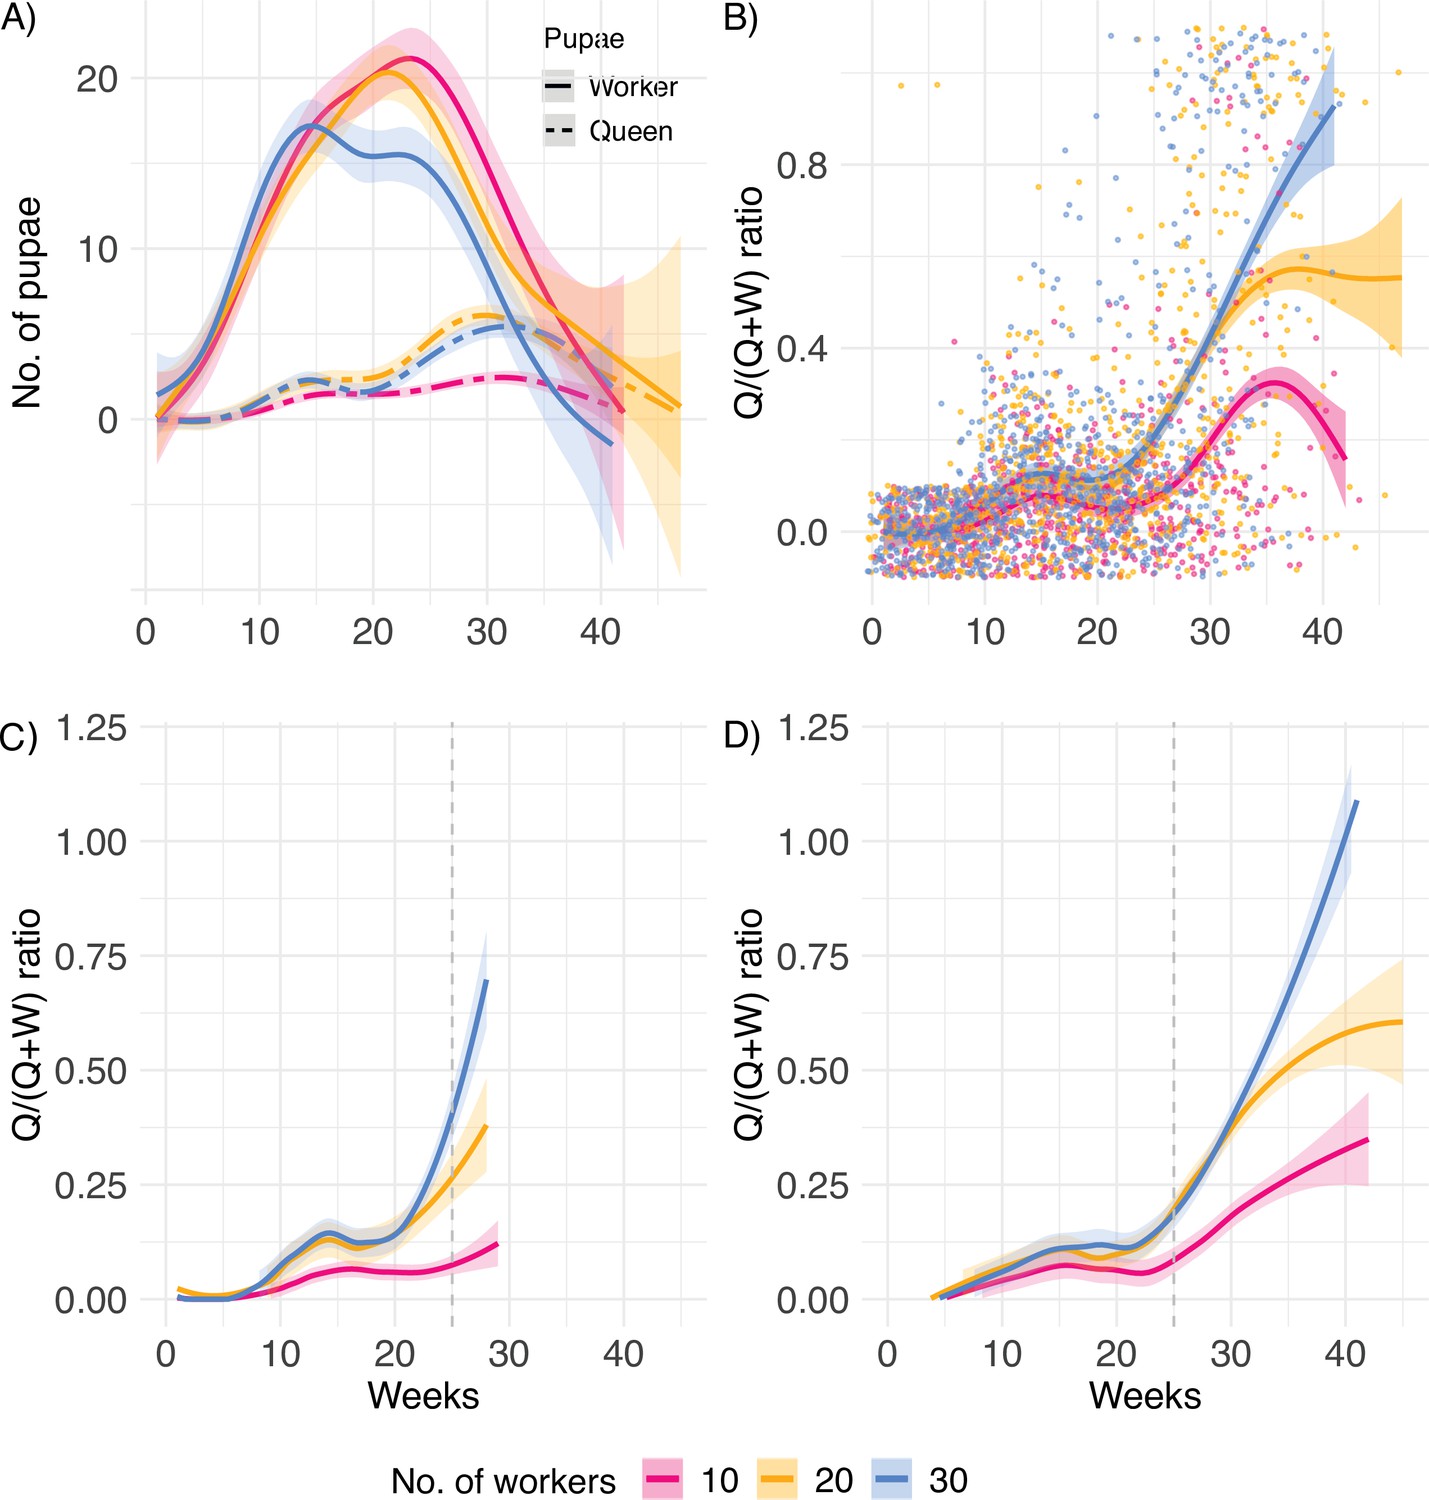
Lifetime investment.
(A) Numbers of worker and queen pupae produced over time, (B) queen/(queen + worker) pupae caste ratio produced by queens (n = 31, 34, and 34 for 10, 20, and 30 worker colonies, respectively), (C) pupae caste ratio for queens with lifespan below (n = 44), and (D) above the mean lifespan of 25 weeks, indicated by the dashed line (n = 55). After the queen’s death, eggs and larvae were allowed to develop into pupae for a final count. Therefore, smooth splines extend ca. 4 weeks after queen death.
Figure 2—figure supplement 1
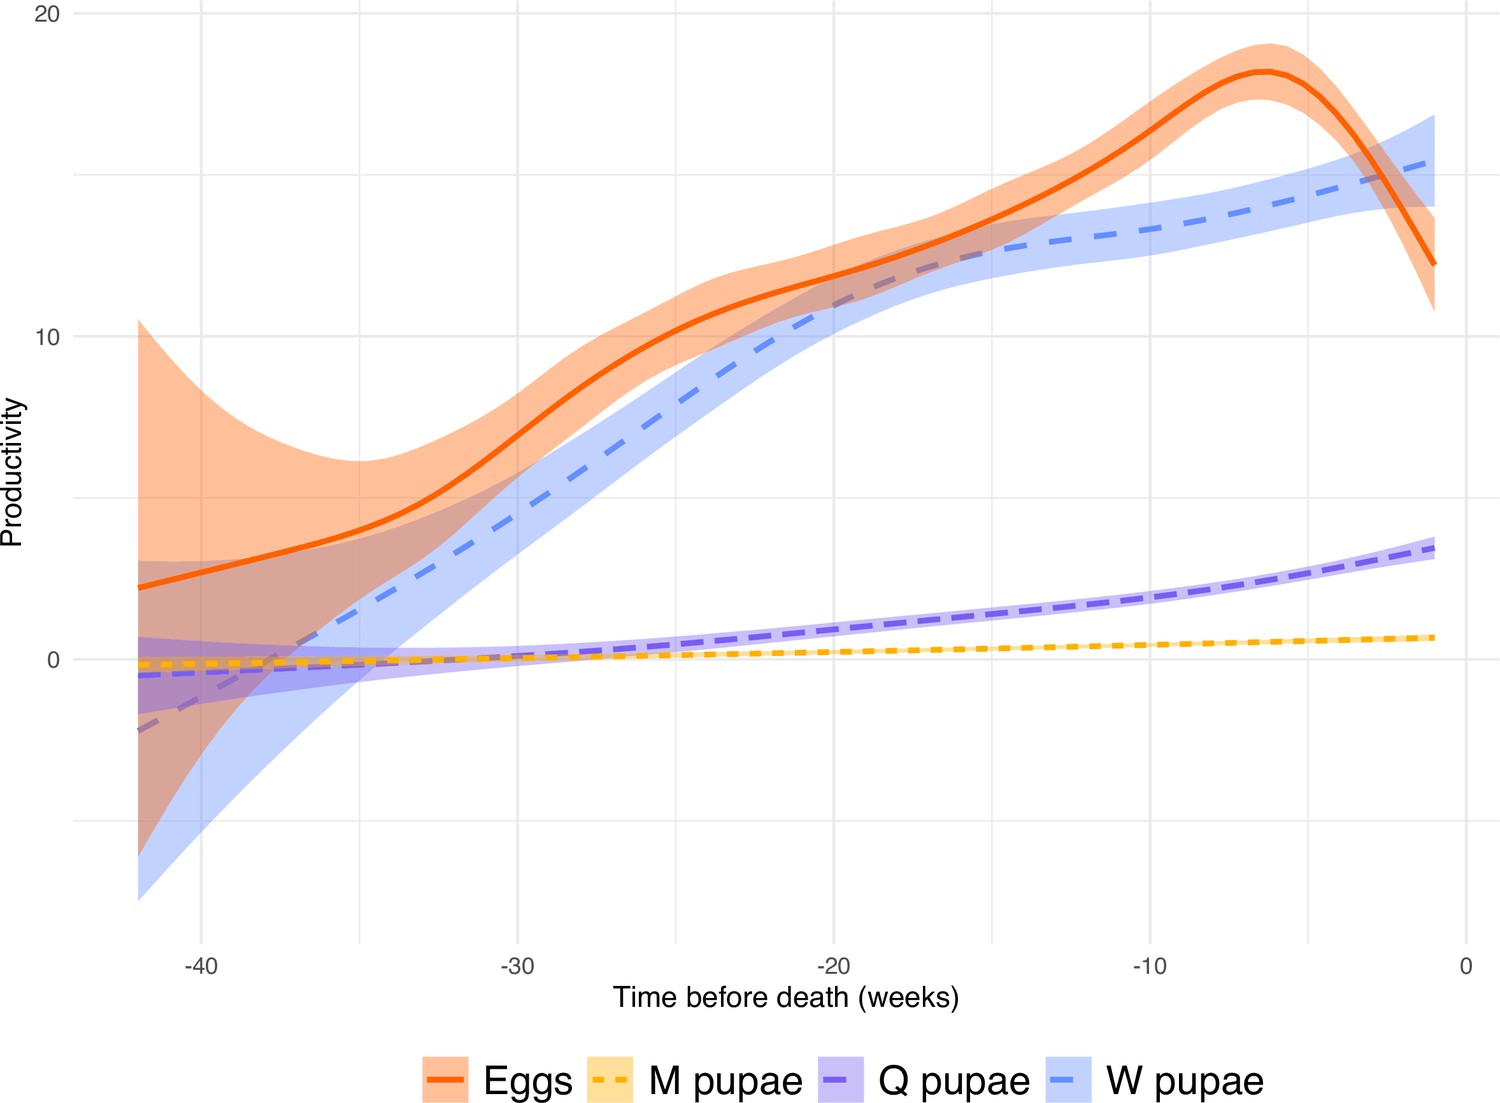
Production of pupae and eggs per queen over time before death (n = 99).
The graph uses a gam method and a confidence interval of 95%.
Figure 2—figure supplement 2
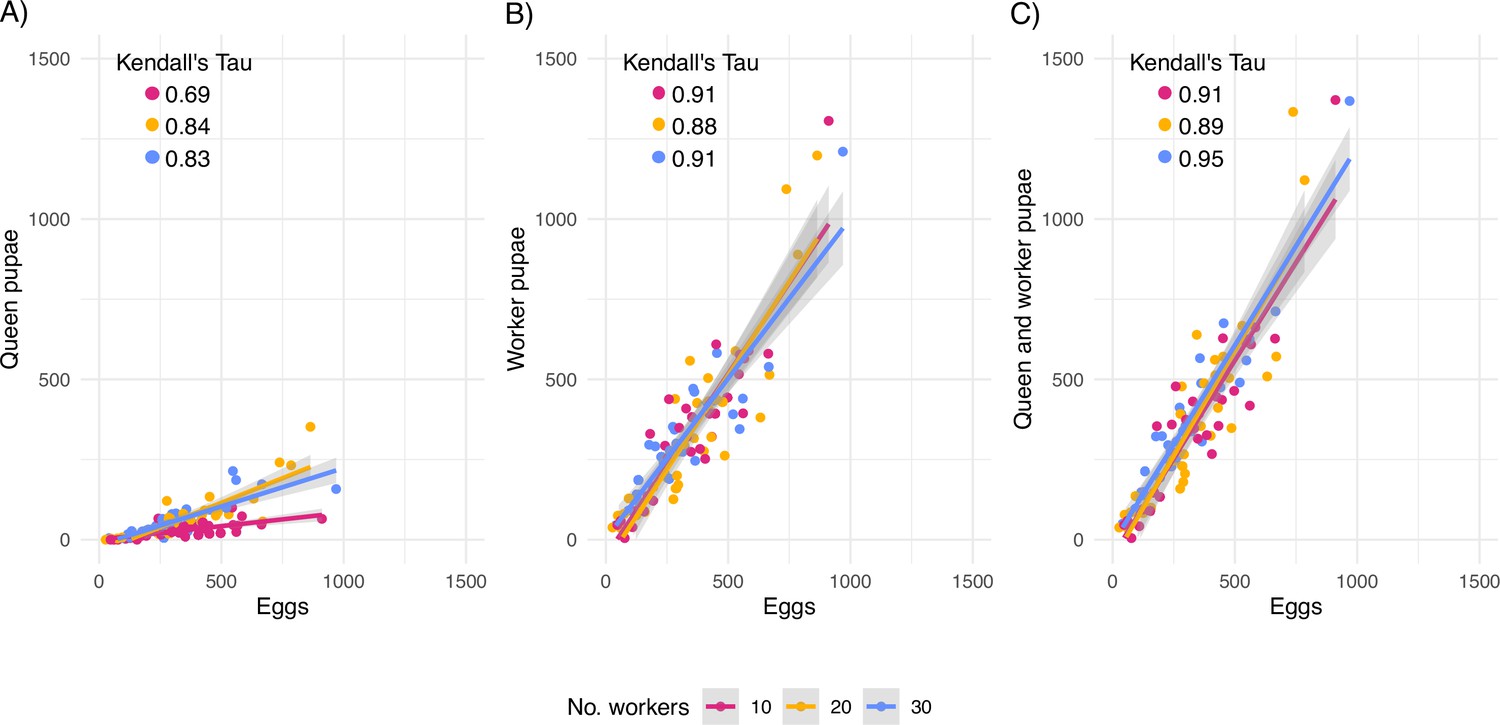
Correlation between counted eggs and developed adults.
Correlation between counted eggs and (A) queen pupae, (B) worker pupae, and (C) the sum of queen and worker pupae per queen. All correlations are statistically significant at p<0.001 (Kendall’s rank correlation test).
Figure 3
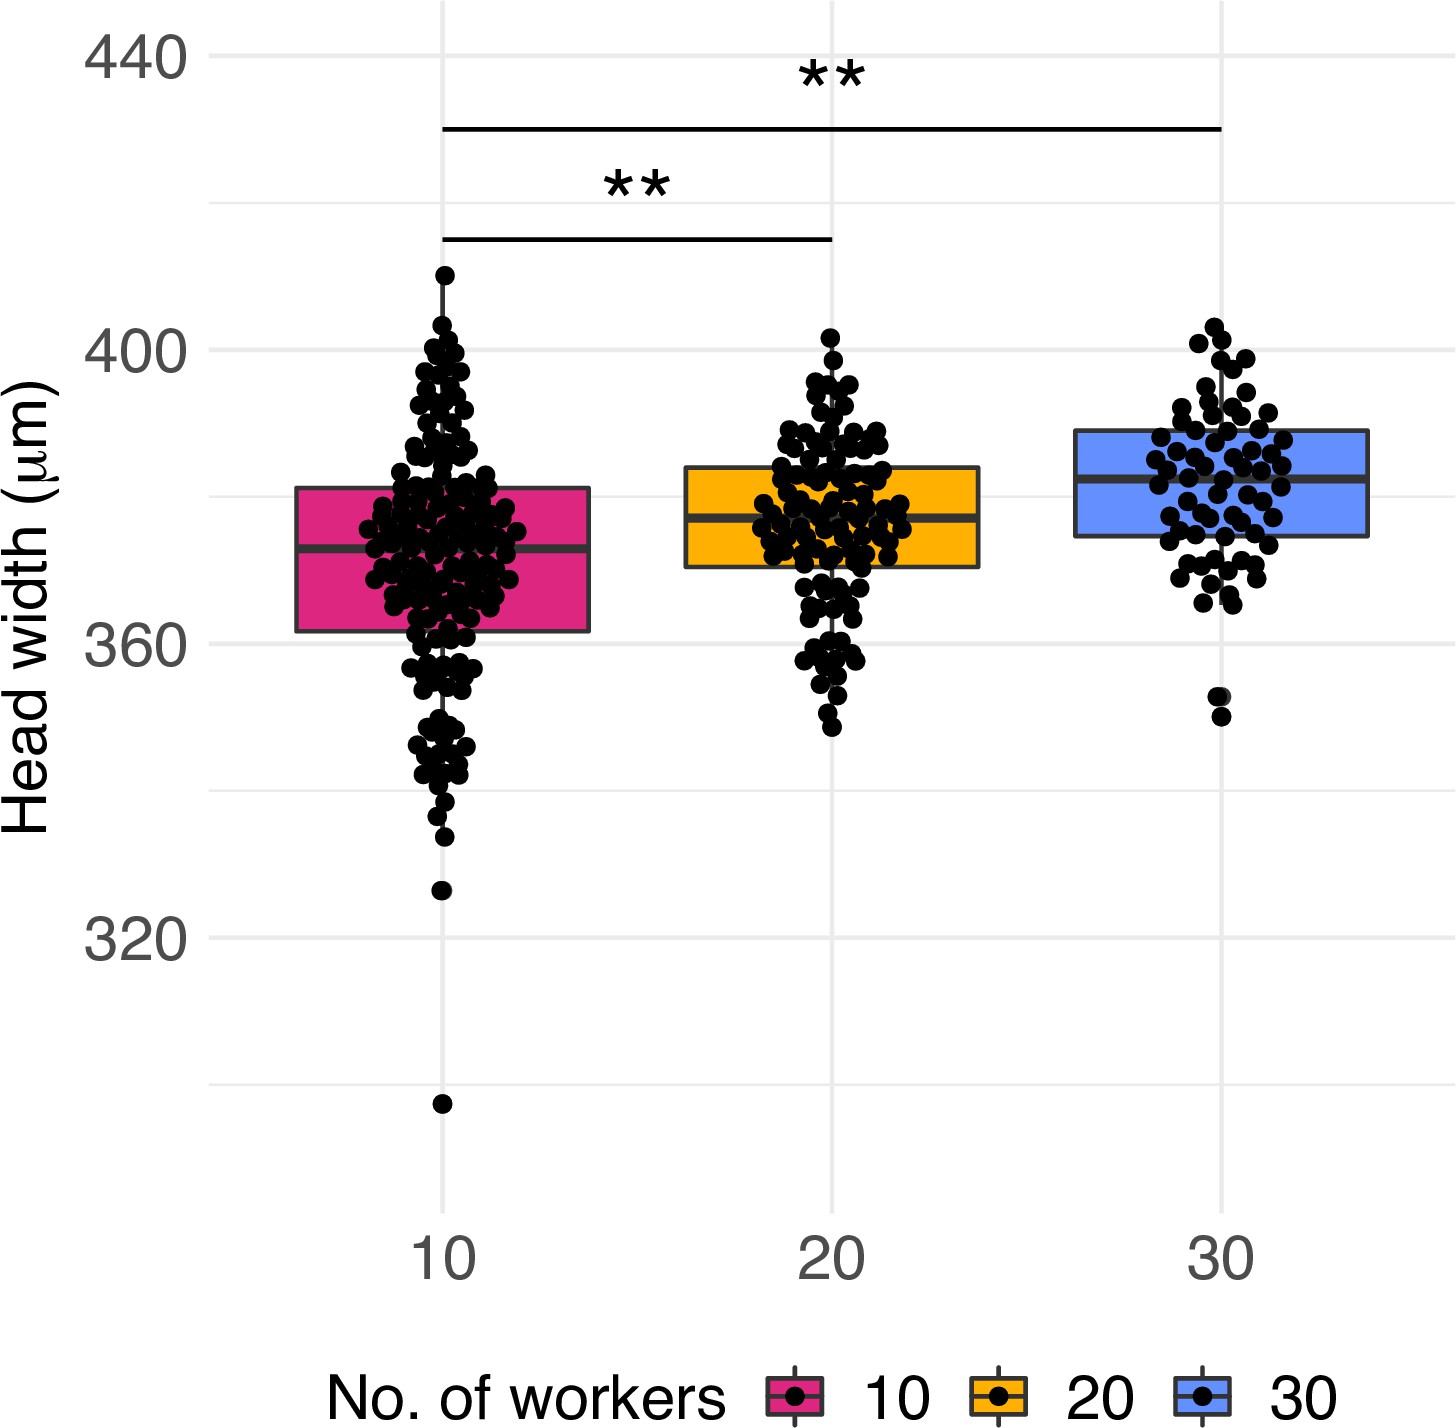
Worker quality across treatments.
Head width measurements of workers produced by queens of colonies with 10, 20, and 30 workers (n = 160, 112, and 68, respectively). Significant differences are given with * p<0.05 and **p<0.01. Boxplots depict upper and lower quartile plus 1.5 interquartile range (IQR).
Figure 4 with 2 supplements
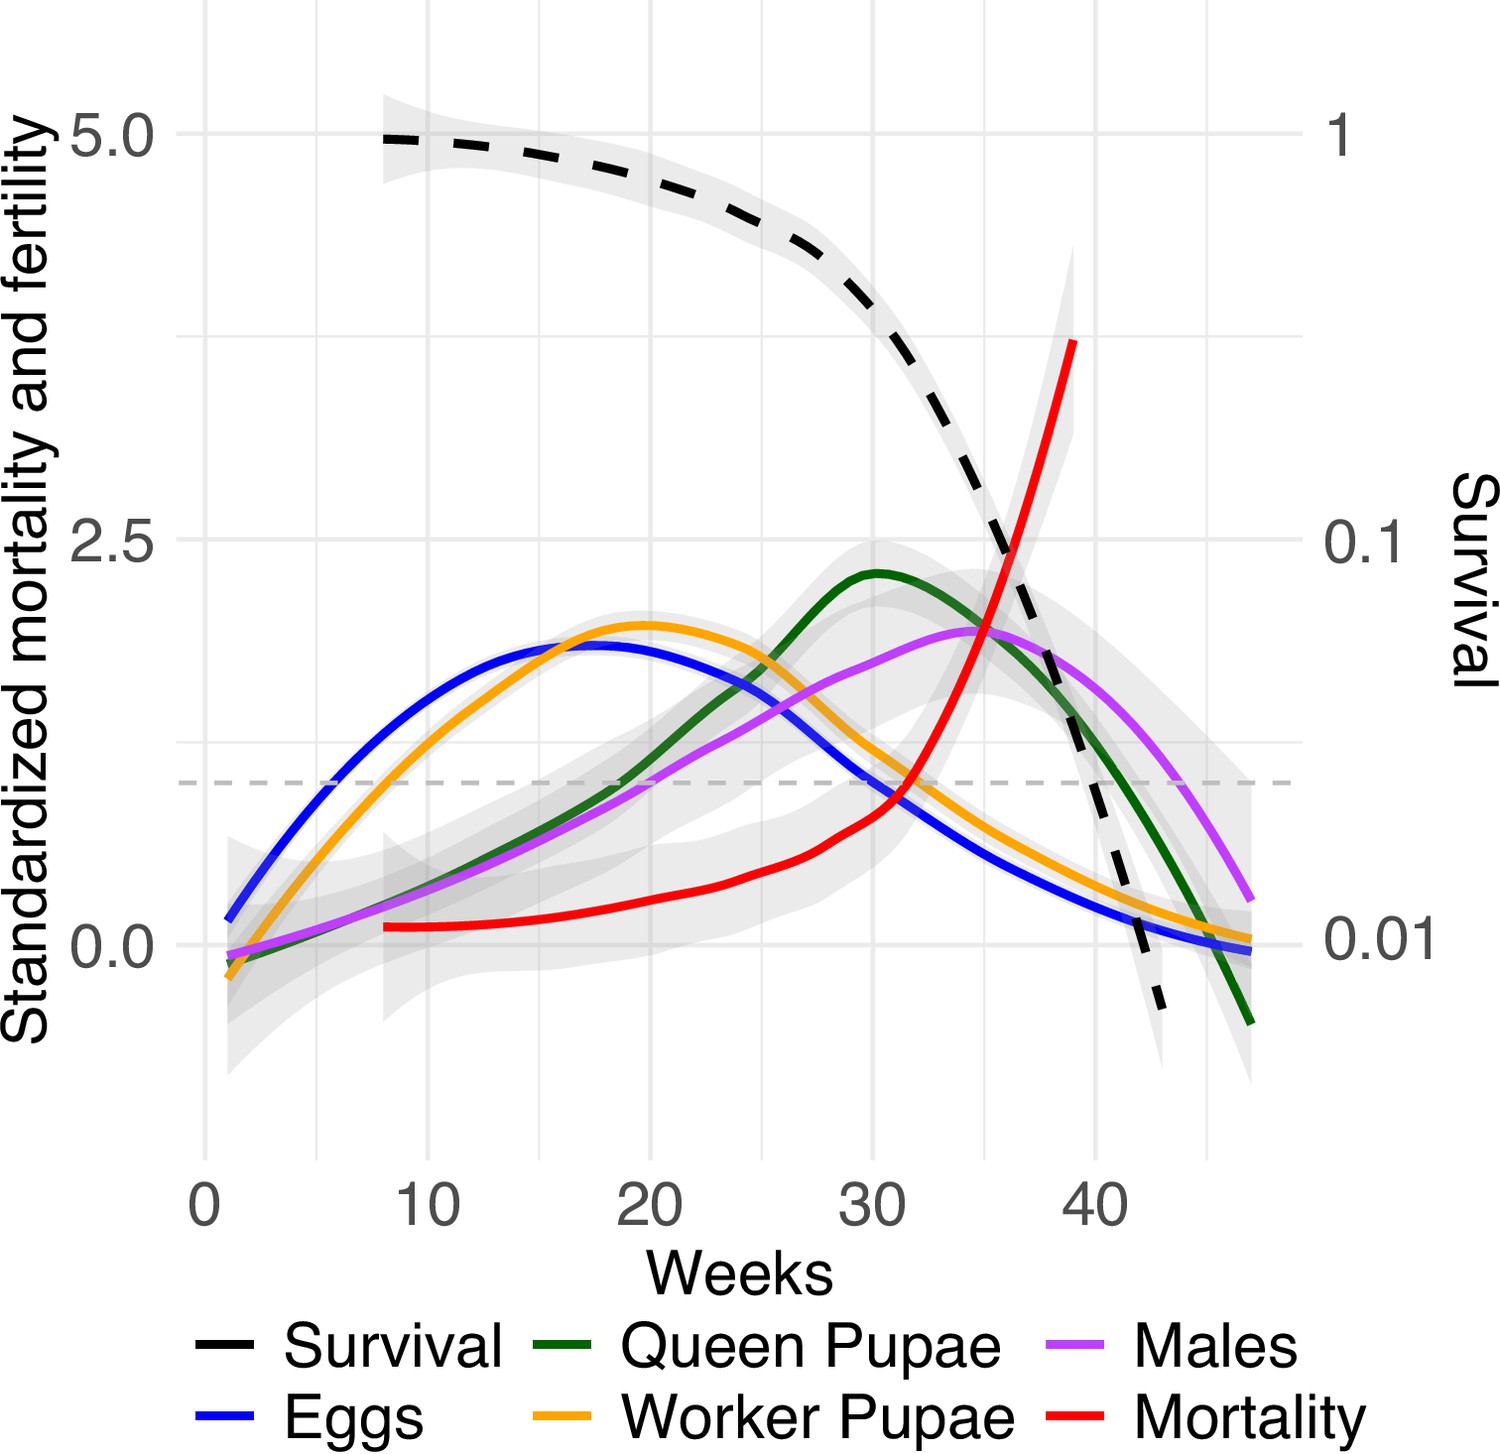
Relative mortality and fecundity as a function of age.
Mean standardization of age by dividing age-specific mortality and fecundity of queens (n = 99) by their means after maturation (Jones et al., 2014). Survivorship (black dashed line) is depicted on a log scale. The graph uses a Loess smoothing method (span = 0.75) and a confidence interval of 95%. The dashed gray line at y = 1 indicates when relative mortality and fertility are equivalent to mean mortality and fertility.
Figure 4—figure supplement 1
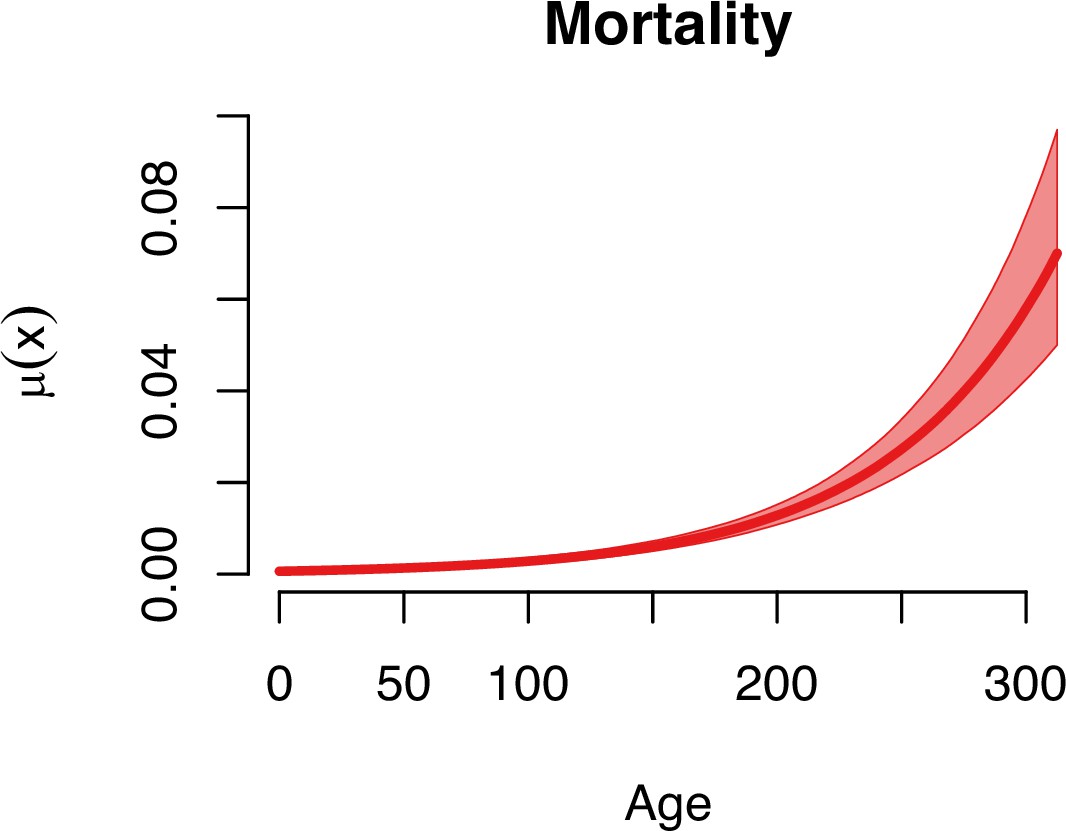
Age-specific mortality of ant queens (n = 135).
A Gompertz model was selected as best-fitted model based on the deviance information criterion (DIC) values, over the logistic and Weibull models (Supplementary file 1H) using the R package BaSTA (Survival Bayesian Trajectory Analysis, v. 1.9.5). The estimated parameters are given in Supplementary file 1I.
Figure 4—figure supplement 2
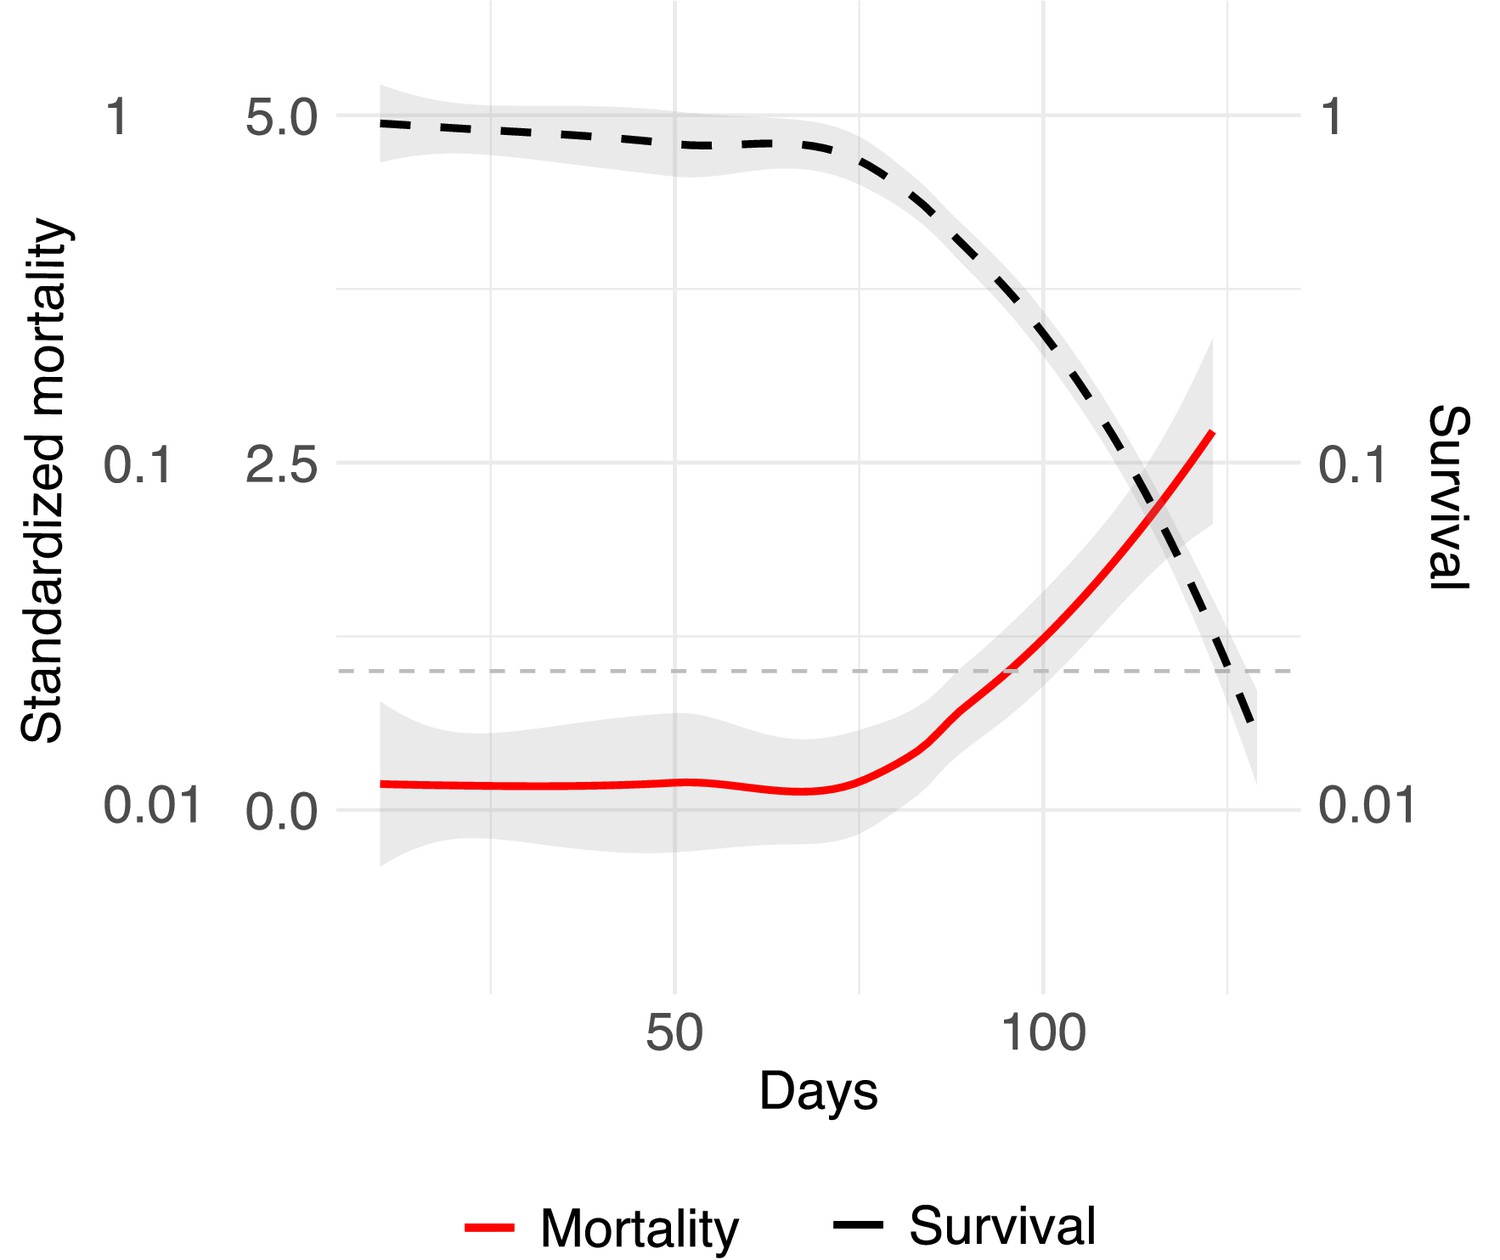
Relative mortality of worker as a function of age.
Mean standardization of age by dividing age-specific mortality by their mean after eclosion (Jones et al., 2014). Survivorship (black dashed line) is depicted on a log scale. The graph uses a Loess smoothing method (span = 0.75) and a confidence interval of 95%. The dashed gray line at y = 1 indicates when relative mortality is equivalent to mean mortality.
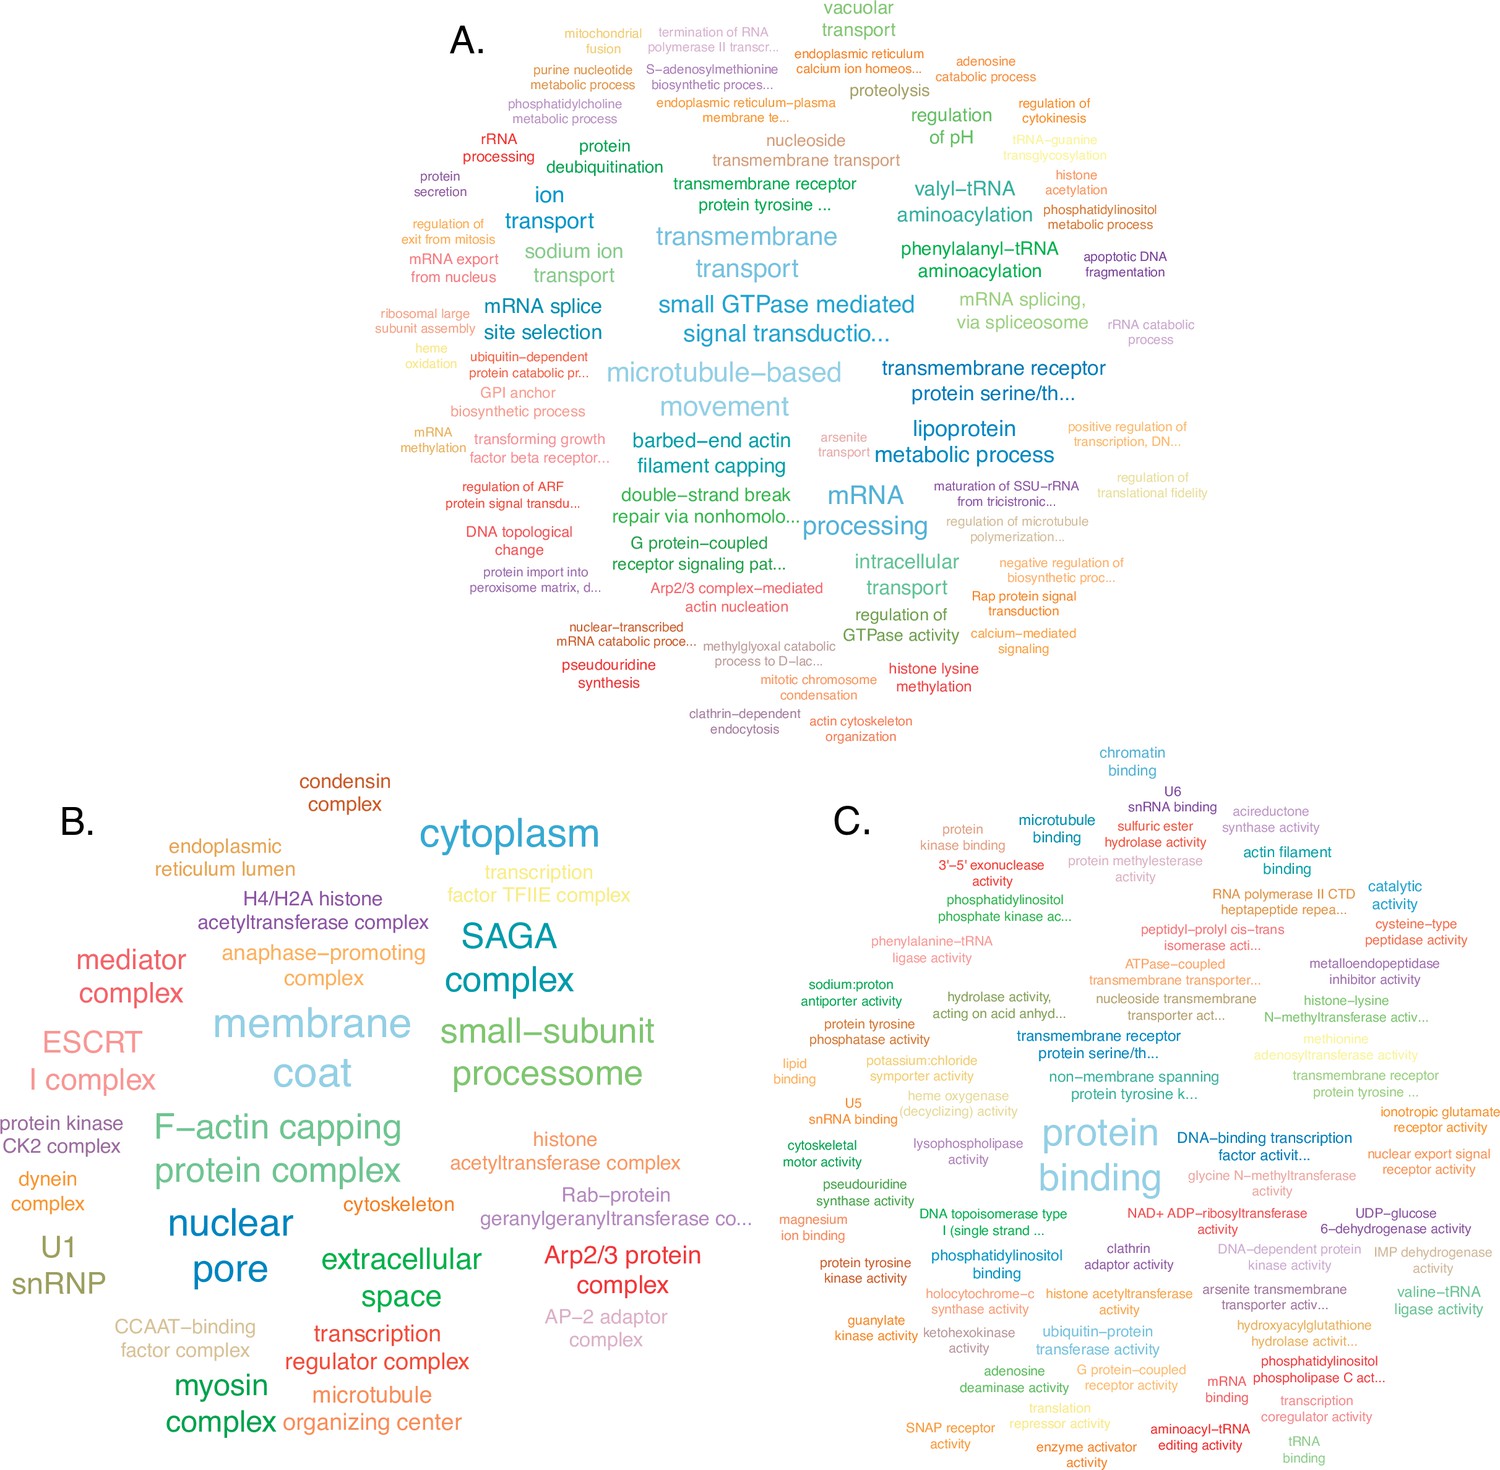
Figure 5 with 7 supplements

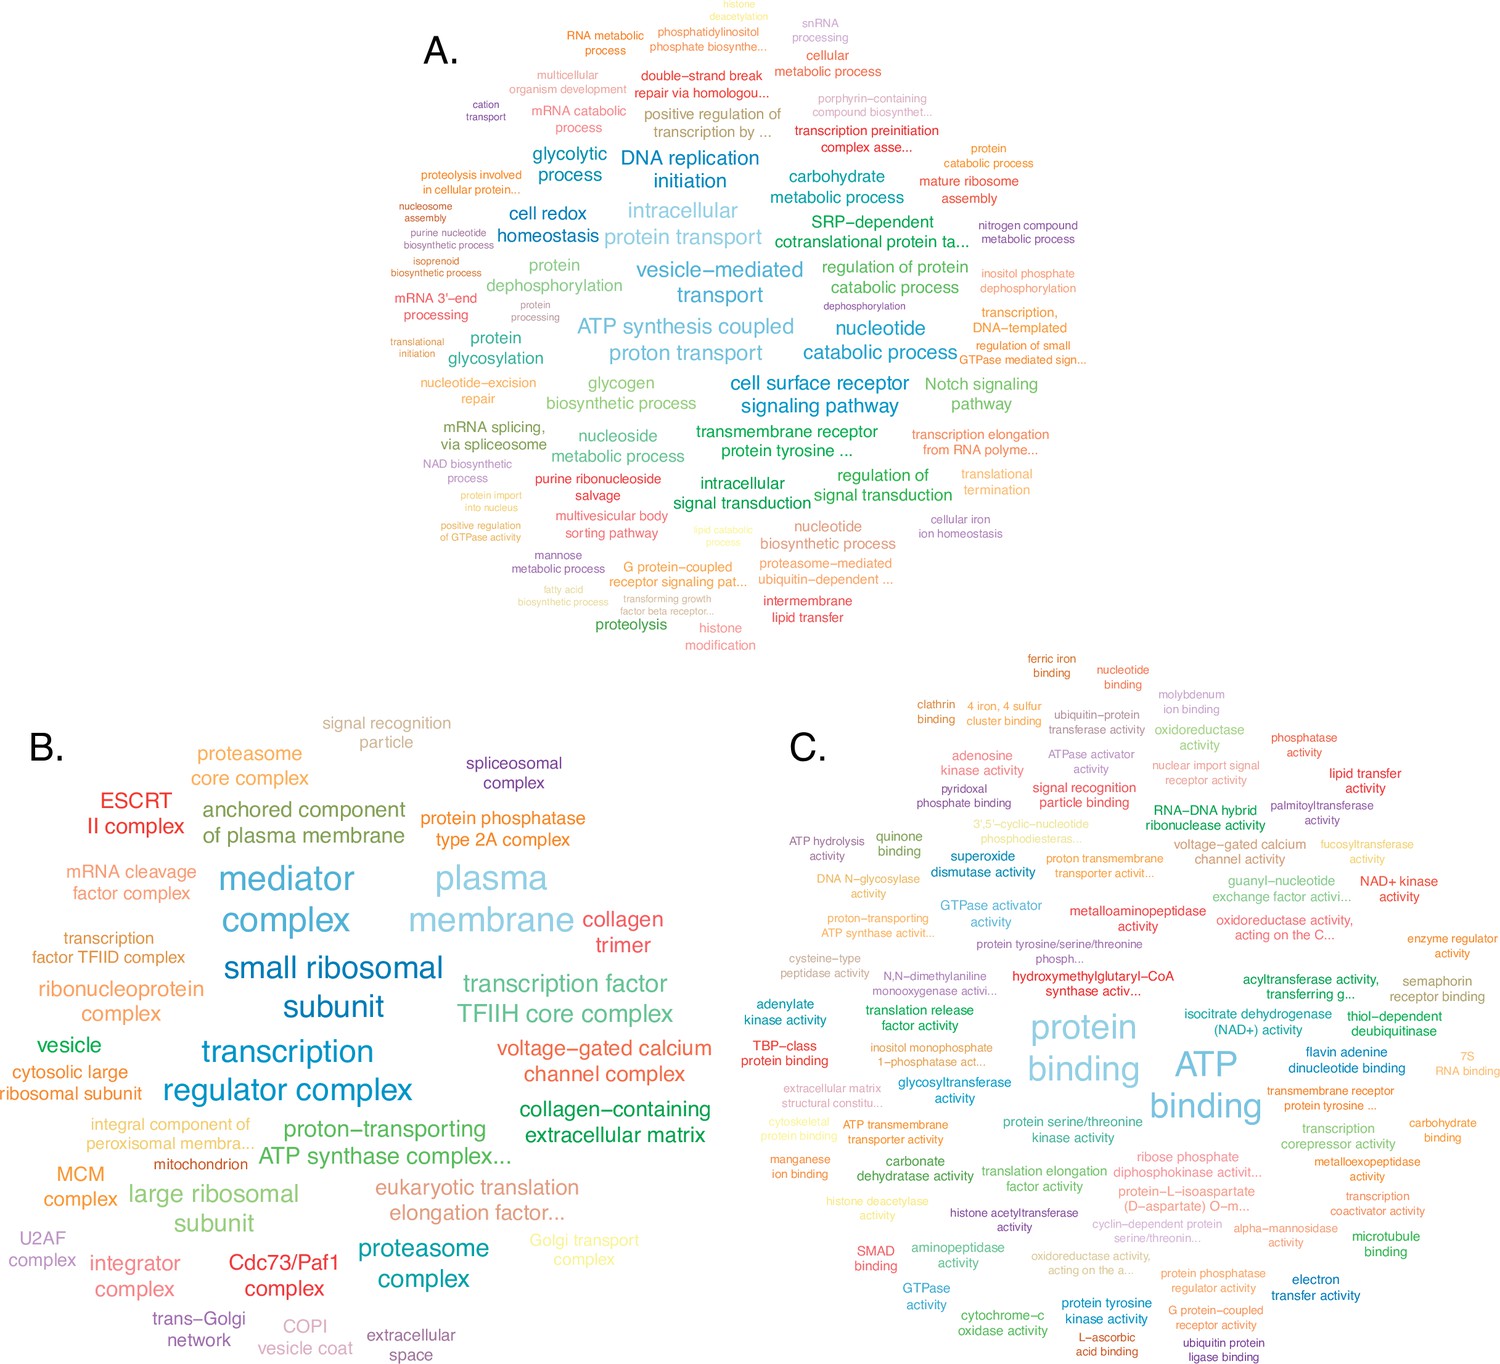
Enriched Gene Ontology (GO) terms downregulated in prope mortem queens compared to middle-aged queens in the head-thorax tissue.
Functional annotation and enrichment analysis using topGO (version 2.46.0) and the weight01 algorithm to calculate significance for (A) biological processes, (B) cellular components, and (C) molecular functions.
Figure 5—figure supplement 1
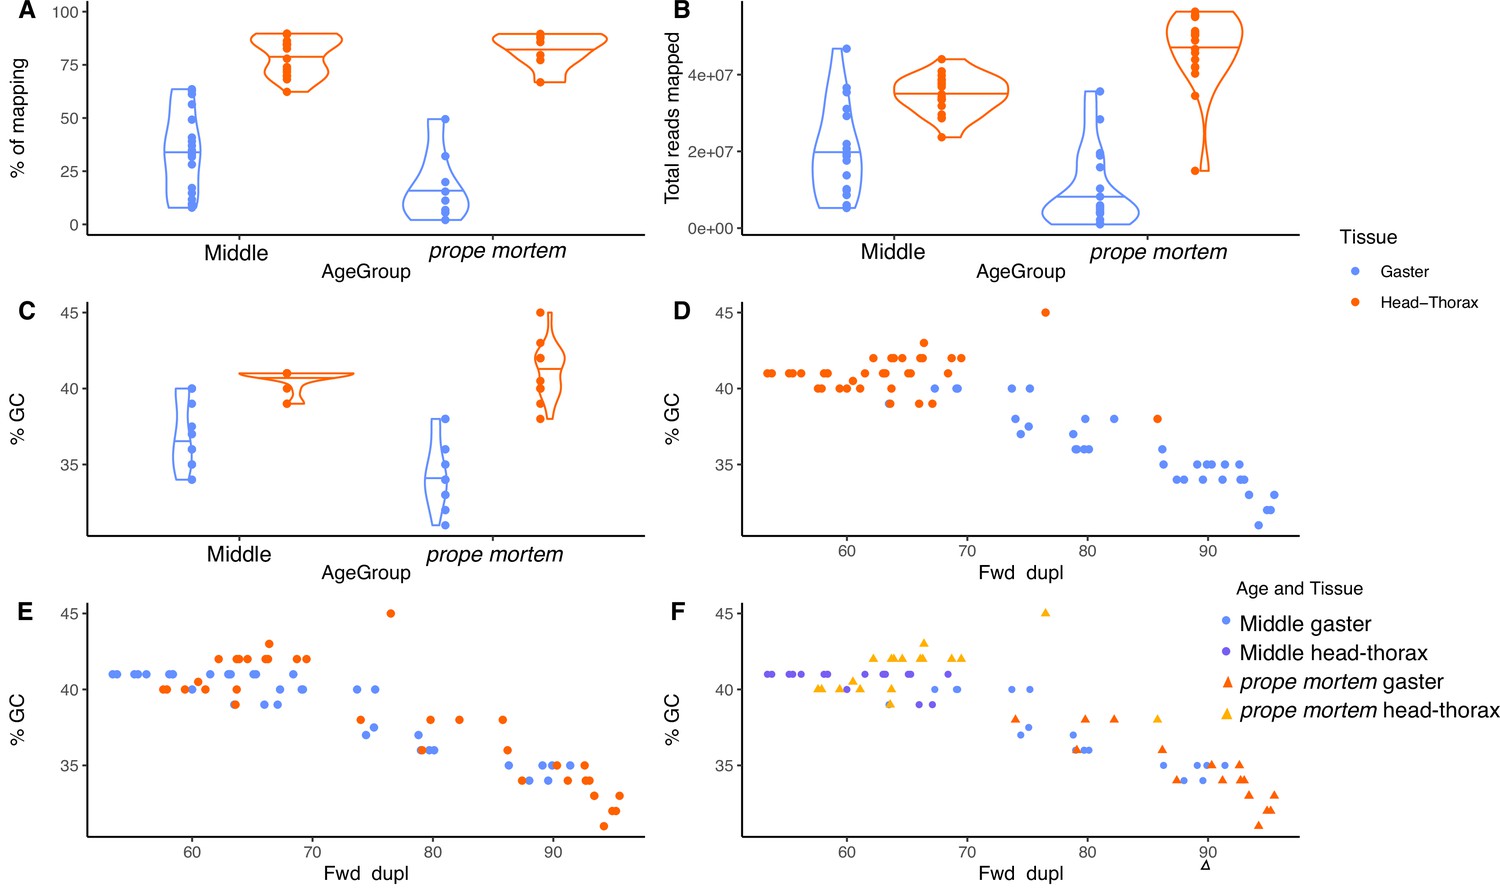
Mapping and GC content percentage.
(A) Mapping percentage per tissue, (B) number of total reads mapped per tissue, (C) percentage of GC content per tissue, (D) percentage of GC content and percentage of duplicated sequences per tissue, (E) percentage of GC content and percentage of duplicated sequences per age group (blue: middle-aged; orange: prope mortem), (F) and tissue. After trimming and sorting the reads, we obtained on average 27 Mio reads (gaster: 14 Mio; head-thorax: 40 Mio) per sample. The mapping rate from all samples ranged between 1.4 and 89.7% (total average 56.0%; gaster: 23.7%, head-thorax 79.2%).
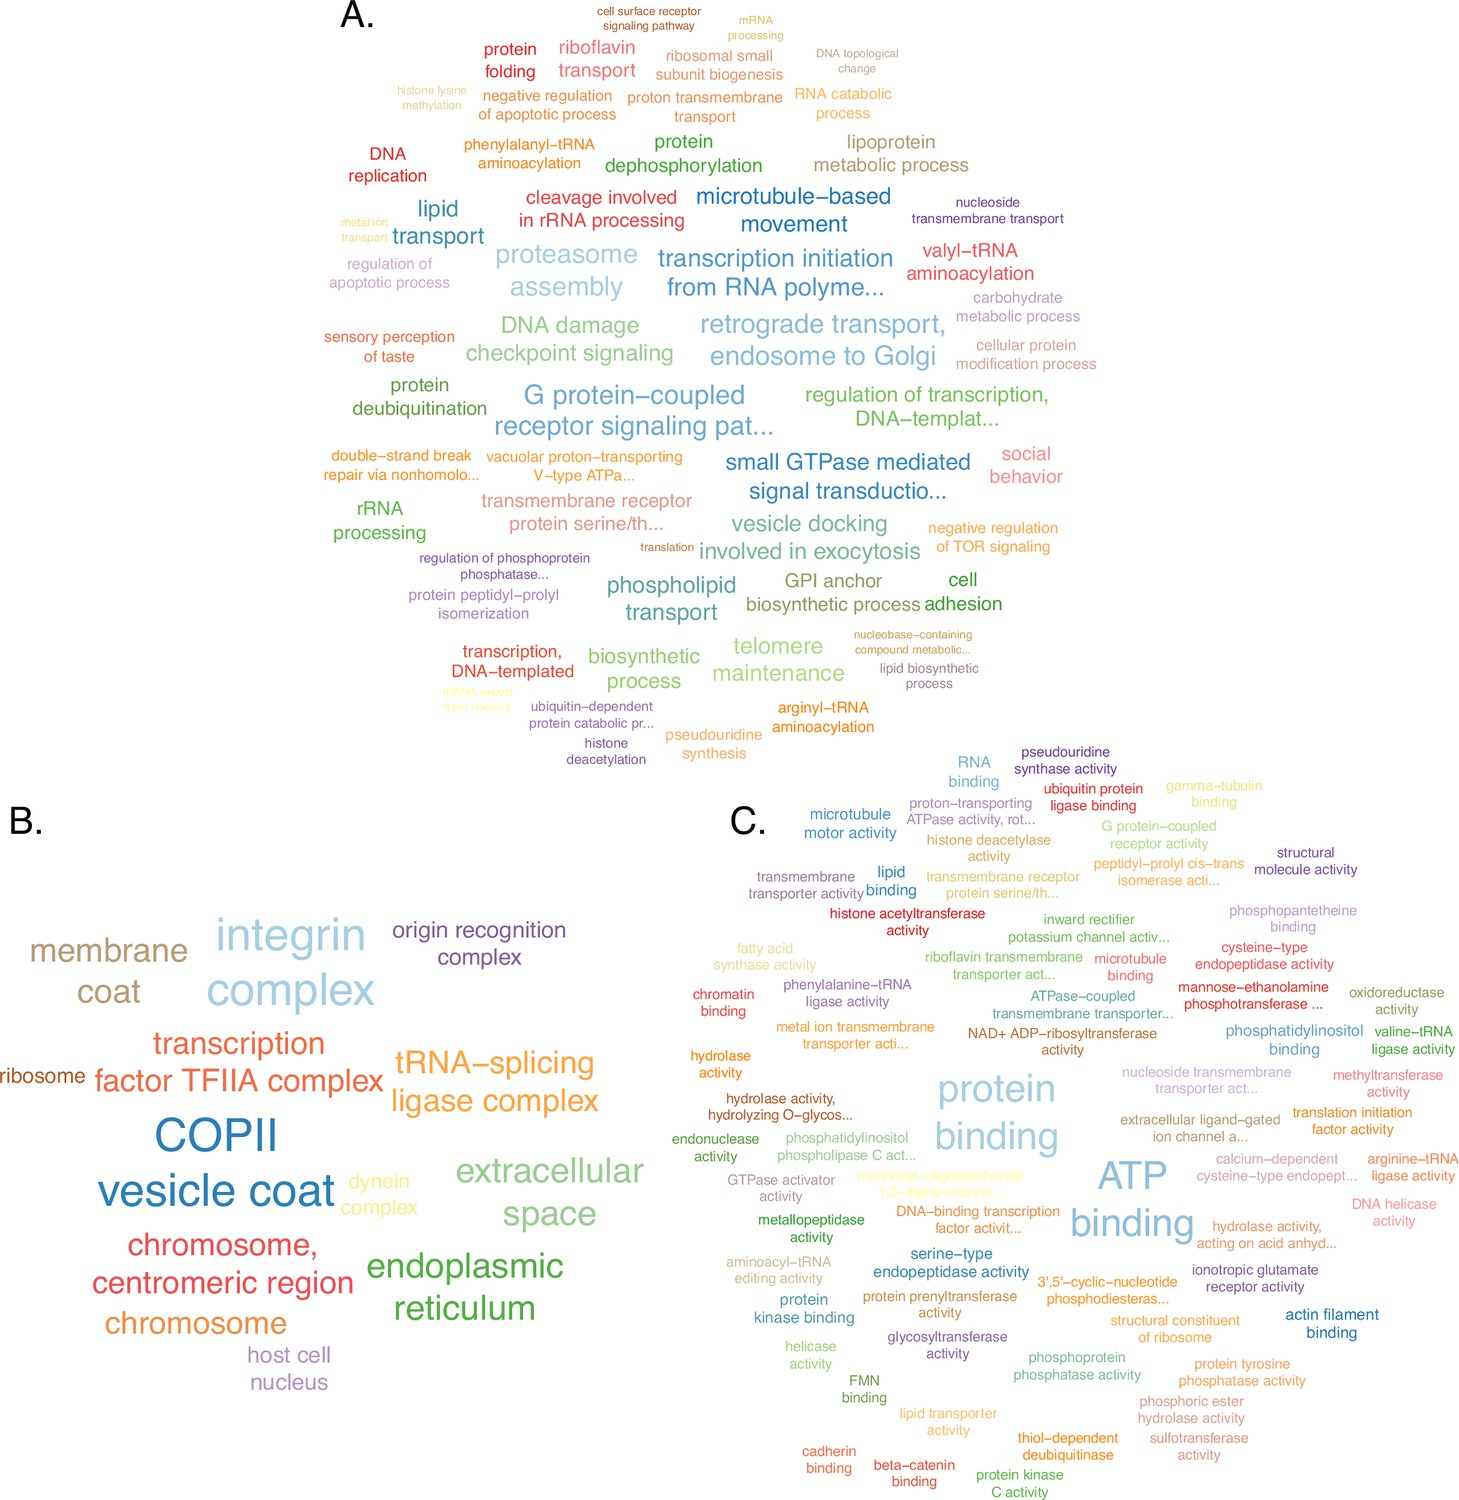
Figure 5—figure supplement 2
Enriched Gene Ontology (GO) terms upregulated in prope mortem queens compared with middle-aged queens in head-thorax tissue.
Functional annotation and enrichment analysis using topGO (version 2.46.0) and the weight01 algorithm to calculate significance for (A) biological processes, (B) cellular components, and (C) molecular functions.
Figure 5—figure supplement 3
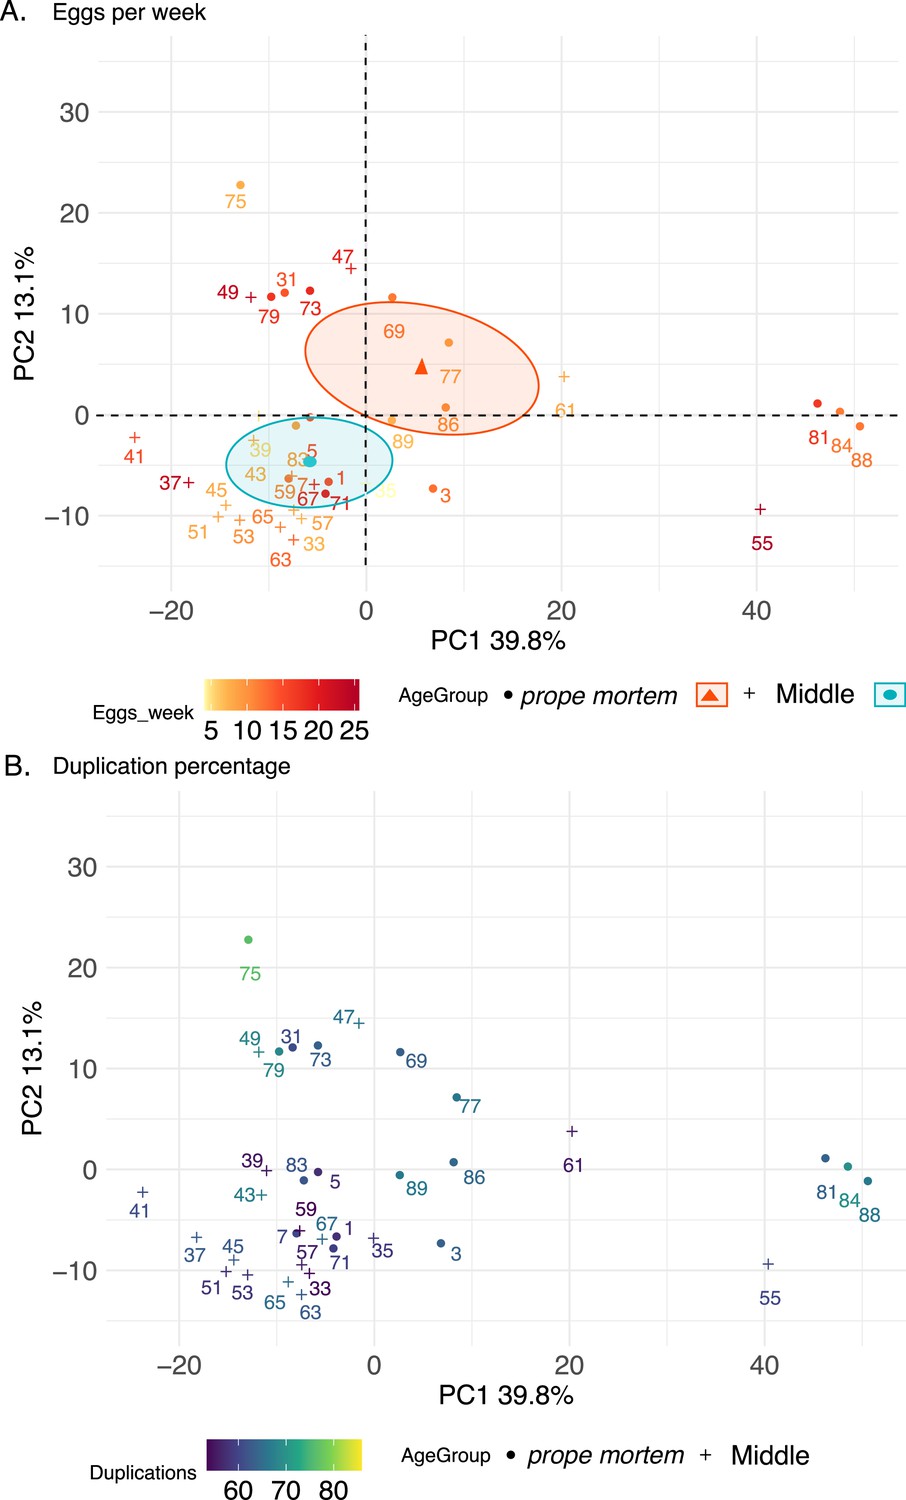
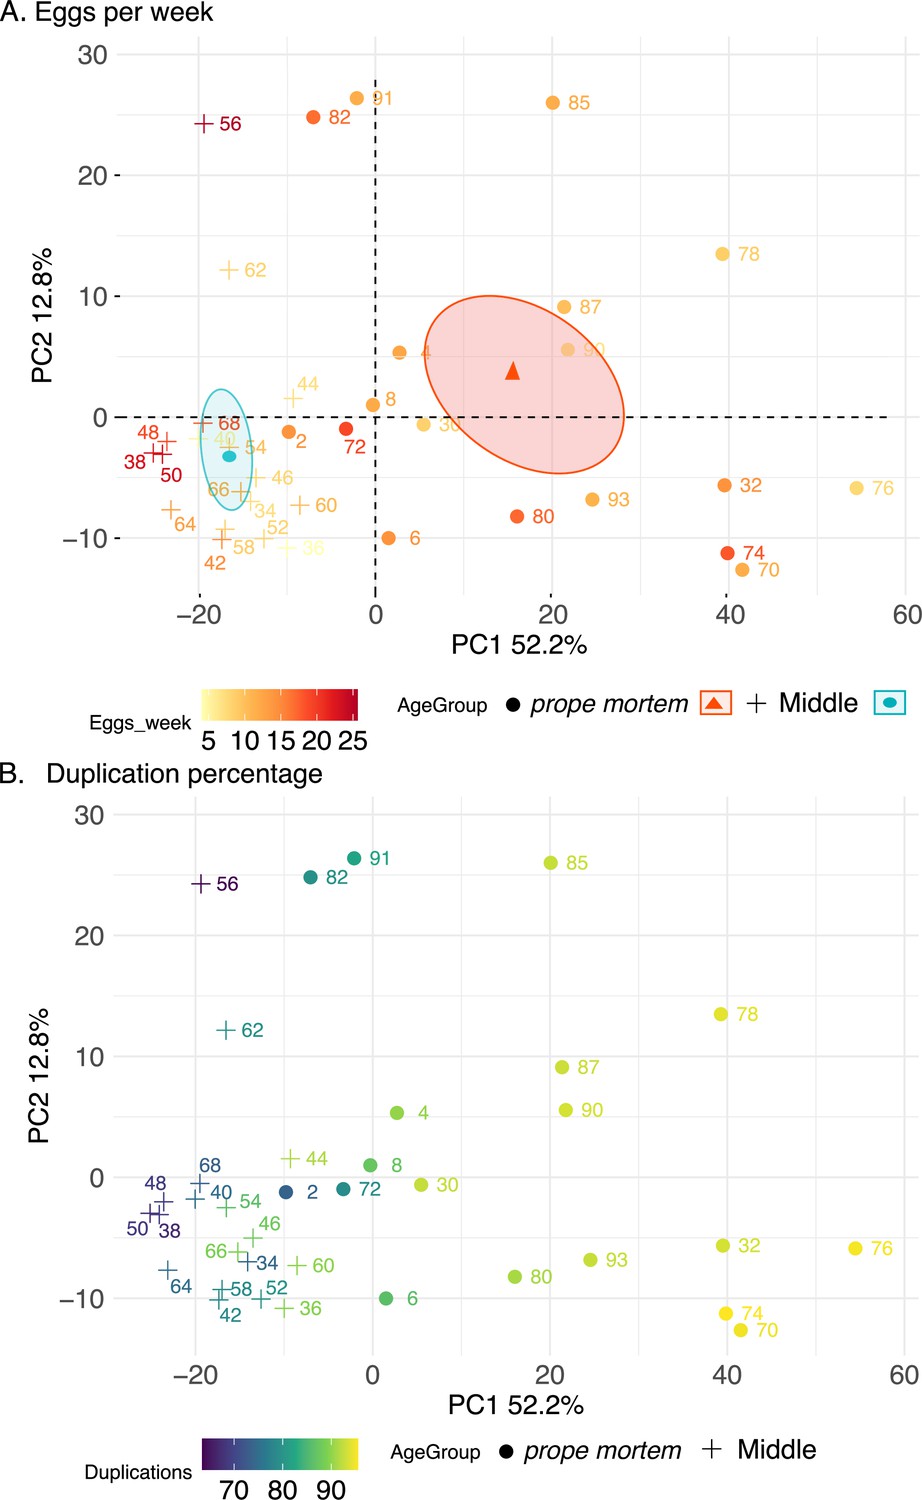
Principal component analysis (PCA) 1 and 2 of head-thorax samples using the top 500 most variable expressed genes after variance-stabilizing transformation.
The crosses depict middle-aged and the circles prope mortem queens. Middle-aged queens were sacrificed after 19–21 weeks, and old queens from age 28–49 weeks. PC1 explains 39.8% of the variability and PC2 13.1%. The two age groups exhibit no differences in terms of dispersion (distance from samples to their estimated centroid, permutest, F-value = 0.30, p=0.58), but exhibit different centroids depending on age group but not on fertility level (PERMANOVA test, F-value = 7.59, p<0.001 and F-value = 1.09, p=0.26, respectively). The colors indicate (A) the fertility of the queens and (B) the percentage of duplications found in the samples before mapping.
Figure 5—figure supplement 4
Enriched Gene Ontology (GO) terms upregulated in prope mortem queens compared with middle-aged queens in the gaster.
Functional annotation and enrichment analysis using topGO (version 2.46.0) and the weight01 algorithm to calculate significance for (A) biological processes, (B) cellular components, and (C) molecular functions. 3074 genes were differentially expressed by age: 1554 upregulated (51%) and 1520 downregulated (49%).
Figure 5—figure supplement 5
Enriched Gene Ontology (GO) terms downregulated in prope mortem queens compared with middle-aged queens in the gaster.
Functional annotation and enrichment analysis using topGO (version 2.46.0) and the weight01 algorithm to calculate significance for (A) biological processes, (B) cellular components, and (C) molecular functions. 3074 genes were differentially expressed by age: 1554 upregulated (51%) and 1520 downregulated (49%).
Figure 5—figure supplement 6
Principal component analysis (PCA) 1 and 2 of gaster samples using the top 500 most variable expressed genes after variance-stabilizing transformation.
The crosses depict middle-aged and the circles prope mortem queens. Middle-aged queens were sacrificed after 19–21 weeks and prope mortem queens from age 28–49 weeks. The colors indicate (A) the fertility of the queens and (B) the percentage of duplications found on the samples before mapping.
Figure 5—figure supplement 7
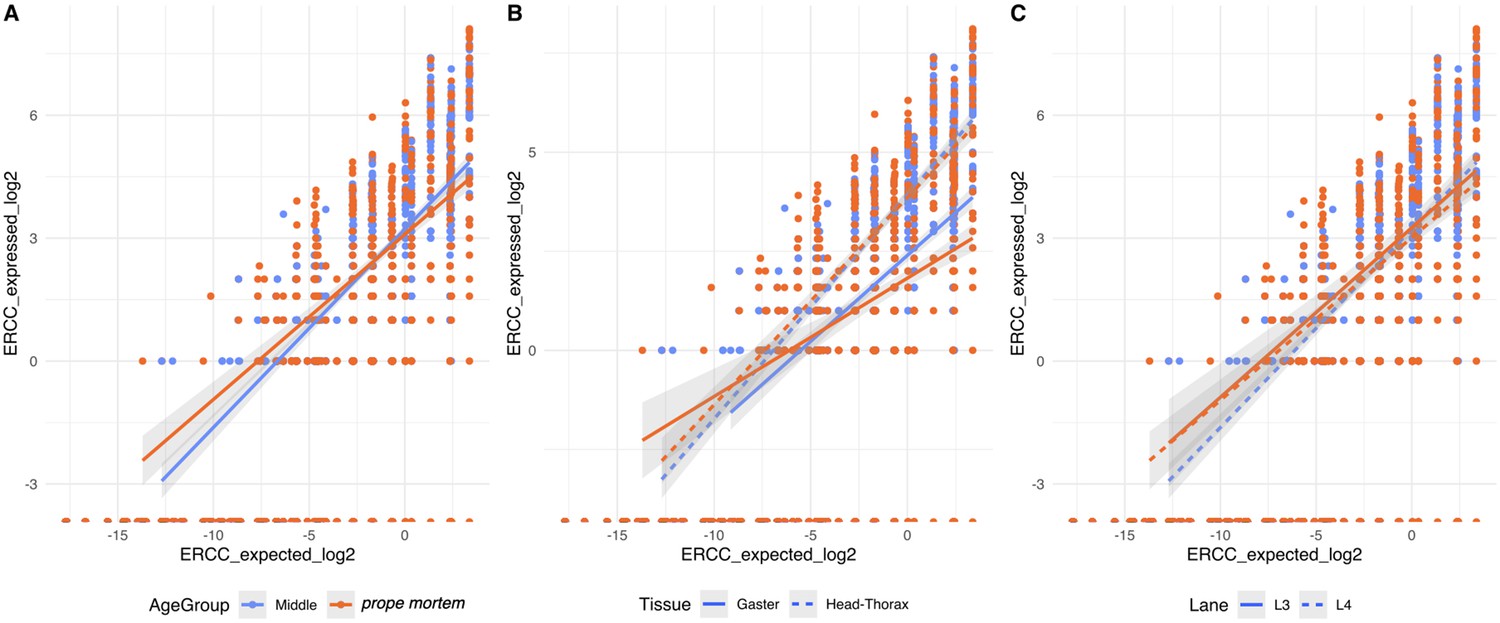
Sequencing quality check based on Spike-in reads.
Observed vs. expected log2 ratio of the ERCC expression levels for each sample dependent on (A) age group, (B) tissue, and (c) lane. The positive relationship indicates that the library construction was successful and did not vary across age group and lane, but differed between tissues.
Additional files
-
Supplementary file 1
Supplementary files A–I.
(A) Estimates calculated for 10, 20, and 30 workers using a glmmTMB model with Gaussian distribution and ‘setup date,’ ‘experimental box,’ ‘box,’ and ‘nest of origin’ as random factors for (Queen*c)/[(Queen*c) + Worker]. The coefficient c as the average dry weight of queens over workers to the power conversion factor of 0.6–1 (see text). All comparisons between 10 and 20 workers treatments are statistically significant (p<0.001), but not between 20 and 30 workers. (B) The 15 most significant enriched Gene Ontology (GO) terms per type in differentially expressed genes (DEGs) enriched in middle-aged queens in the head-thorax tissue. BP: Biological Processes; CC: cellular component; MF: molecular functions. (C) The 15 most significant enriched GO terms per type in DEGs enriched in prope mortem queens in the head-thorax tissue. (D) The 15 most significant enriched GO terms per type in DEGs enriched in prope mortem queens in the gaster tissue. (E) The 15 most significant enriched GO terms per type in DEGs enriched in middle-aged queens in the gaster tissue. (F) Shared enriched GO terms for both tissues (head-thorax and gaster) enriched in prope mortem queens. (G) Shared enriched GO terms for both tissues (head-thorax and gaster) enriched in middle-aged queens. (H) Deviance information criterion (DIC) of three tested models (logistic, Gompertz, and Weibull) for the age-specific mortality of ant queens. Using the function multibasta of the R package BaSTA (Survival Bayesian Trajectory Analysis, v. 1.9.5). The model with the lowest DIC value is assumed to provide the best fit. (I) Estimated coefficients of age-specific mortality of ant queens. Using a logistic model and the R package BaSTA (Survival Bayesian Trajectory Analysis, v. 1.9.5).
- https://cdn.elifesciences.org/articles/74695/elife-74695-supp1-v1.docx
-
Transparent reporting form
- https://cdn.elifesciences.org/articles/74695/elife-74695-transrepform1-v1.docx
-
Source data 1
Lifelong population survey of 102 queens.
W indicates the treatment (number of workers) and matches the code (A and D for 30, B and E for 20, and C and F for 10 workers). Status indicates 0 = queen alive, 1 = queen dead.
- https://cdn.elifesciences.org/articles/74695/elife-74695-data1-v1.xlsx
-
Source data 2
Weight in grams of 20 individual queens and workers.
- https://cdn.elifesciences.org/articles/74695/elife-74695-data2-v1.xlsx
-
Source data 3
Worker head width measurements (f1) and the respective code of the maternal line (f0).
- https://cdn.elifesciences.org/articles/74695/elife-74695-data3-v1.xlsx
-
Source data 4
Size of field colonies from Brazil collected in 2013 (BR13) and 2018 (BR18) and Japan in 2011 (JP11) from Schrader et al., 2014.
- https://cdn.elifesciences.org/articles/74695/elife-74695-data4-v1.xlsx
-
Source data 5
Samples for RNA sequencing and experimental design information.
- https://cdn.elifesciences.org/articles/74695/elife-74695-data5-v1.xlsx
-
Source data 6
Population survey of 36 queens.
W indicates the treatment (number of workers) and matches the code (A and D for 30, B and E for 20, and C and F for 10 workers). Status indicates 0 = queen alive, 1 = queen's sacrifice.
- https://cdn.elifesciences.org/articles/74695/elife-74695-data6-v1.xlsx
-
Source data 7
Survival probability of queens over time.
- https://cdn.elifesciences.org/articles/74695/elife-74695-data7-v1.xlsx
-
Source data 8
Lifelong survey of 40 workers in 40 independent colonies.
- https://cdn.elifesciences.org/articles/74695/elife-74695-data8-v1.xlsx
-
Source data 9
Differentially expressed genes by age in gaster.
4832 of 19,925 expressed genes were differentially expressed between age groups (after false discovery rate [FDR] adjustment p<0.001, DESeq2).
- https://cdn.elifesciences.org/articles/74695/elife-74695-data9-v1.xlsx
-
Source data 10
Differentially expressed genes by age in head-thorax.
3565 genes were differentially expressed between middle-aged and prope mortem queens (after false discovery rate [FDR] adjustment p<0.001, DESeq2) out of 20,006 expressed genes.
- https://cdn.elifesciences.org/articles/74695/elife-74695-data10-v1.xlsx
-
Source code 1
R-script used to analyze the population survey data.
- https://cdn.elifesciences.org/articles/74695/elife-74695-code1-v1.zip
Download links
A two-part list of links to download the article, or parts of the article, in various formats.
Downloads (link to download the article as PDF)
Open citations (links to open the citations from this article in various online reference manager services)
Cite this article (links to download the citations from this article in formats compatible with various reference manager tools)
Late-life fitness gains and reproductive death in Cardiocondyla obscurior ants
eLife 11:e74695.
https://doi.org/10.7554/eLife.74695


