Collective dynamics support group drumming, reduce variability, and stabilize tempo drift
- LIVELab, McMaster University, Canada
- Psychology, Neuroscience and Behaviour, McMaster University, Canada
- Department of Biomechanics, University of Nebraska Omaha, United States
- Center for the Ecological Study of Perception and Action, University of Connecticut, United States
- Department of Psychological Sciences, University of Connecticut, United States
- Department of Physics, University of Connecticut, United States
- CT Institute for Brain and Cognitive Sciences, University of Connecticut, United States
- Rotman Research Institute, Canada
Figures
Figure 1
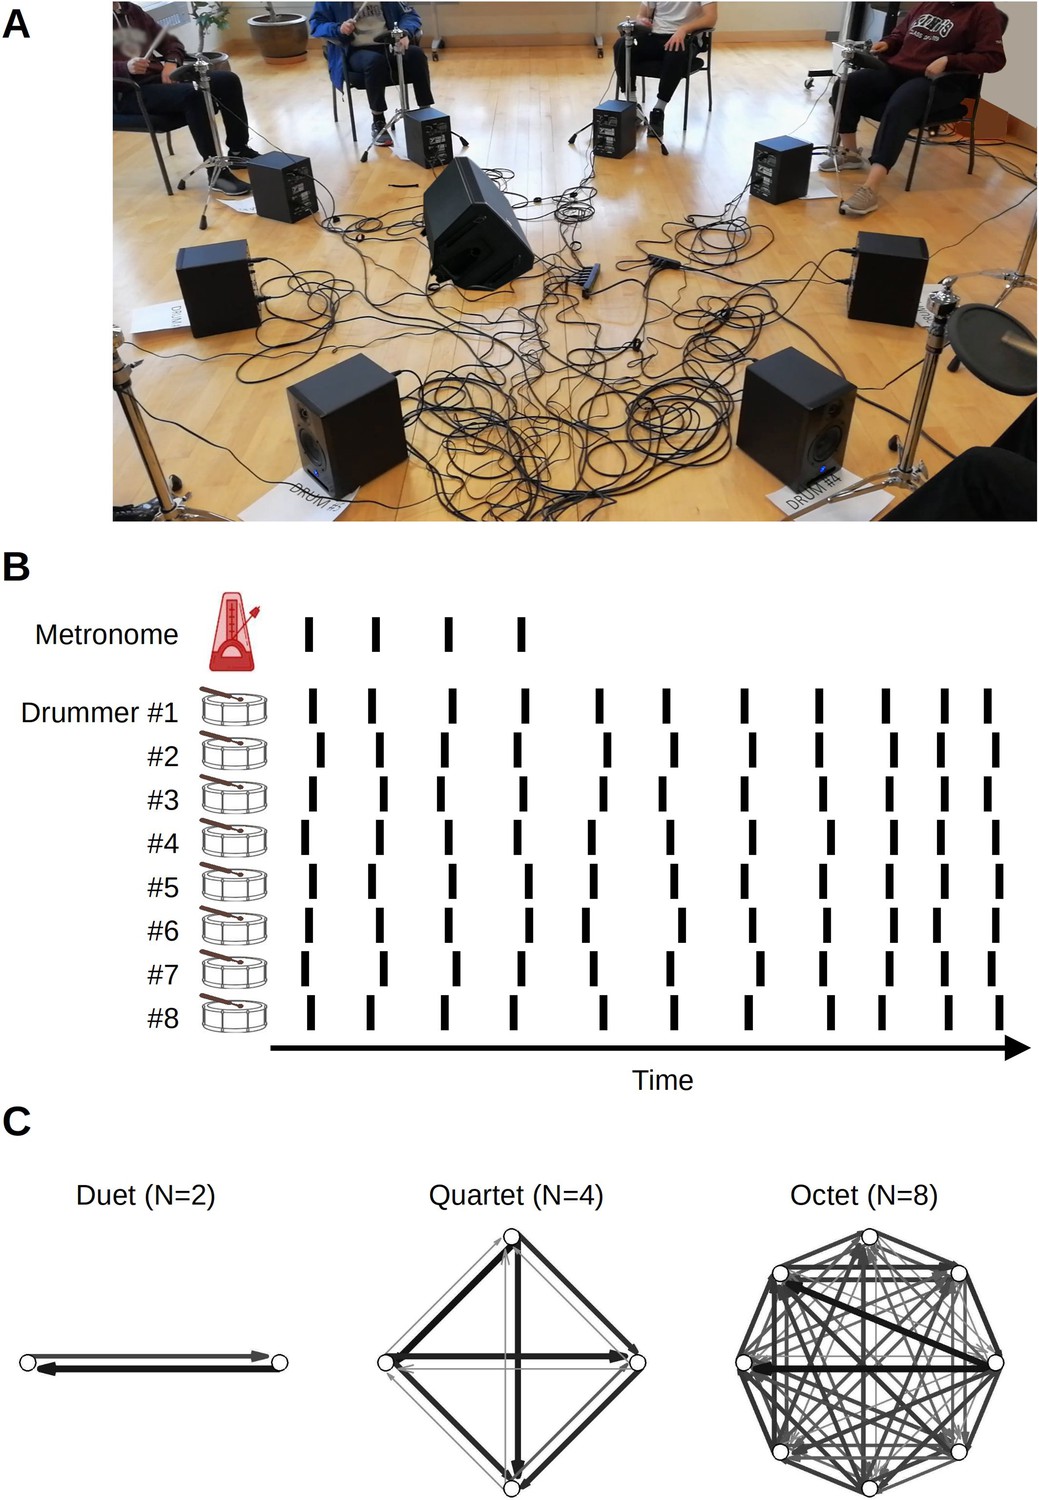
Experiment setup.
(A) In ensemble condition, drummers faced each other in a circle. (B) The main task was synchronization-continuation where participants were paced initially by an auditory stimulus and then had to maintain the rhythm, tempo, and synchronization among each other. The inter-onset intervals between drum hits, shown schematically as vertical lines, were used to obtain individual-level measures of variability and speeding up. Cross-correlation and transfer entropy were used as pair-level measures of synchronization and interaction. (C) Transfer entropies, color, and width-coded, from three sample trials from different groups. Network analysis was applied to these graphs to obtain group-level characterization.
Figure 2 with 1 supplement
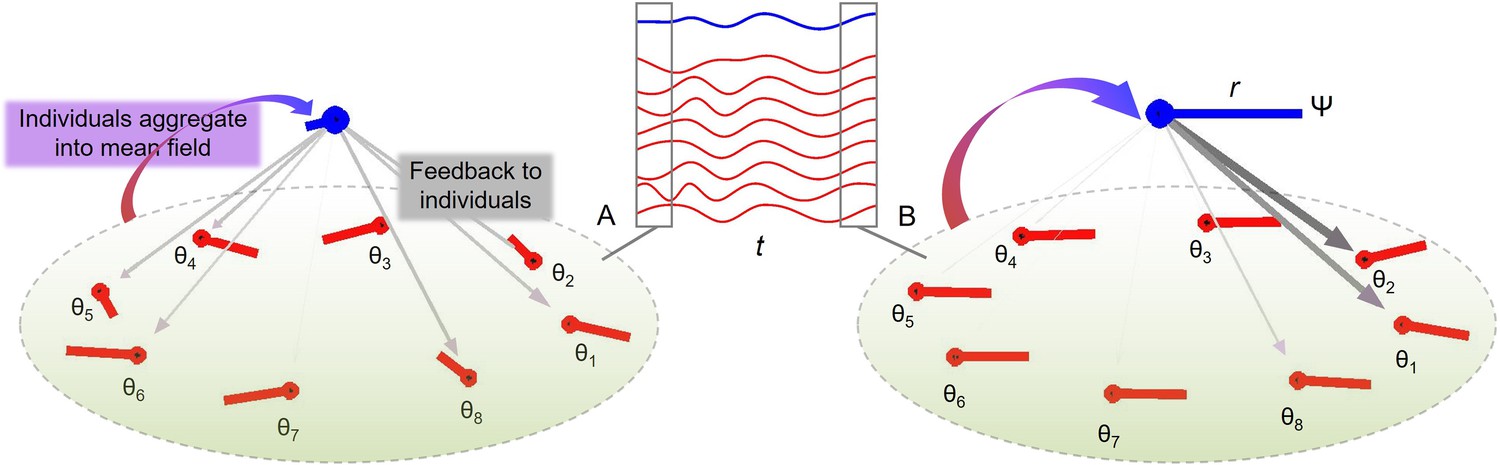
Group synchronization of eight oscillators with random initial conditions (A) and coherent phases later in the trial (B).
The middle inset shows individual trajectories (red lines) and the mean field (blue line) in time (t). Averaging the phase oscillators θ (red lines) gives a so-called mean field (blue lines) with phase Ψ and amplitude r. As the individual oscillators become more coherent from (A) to (B), r increases which leads to stronger influence from Ψ to diverging θ’s (weight of the downward vectors).
Figure 2—figure supplement 1
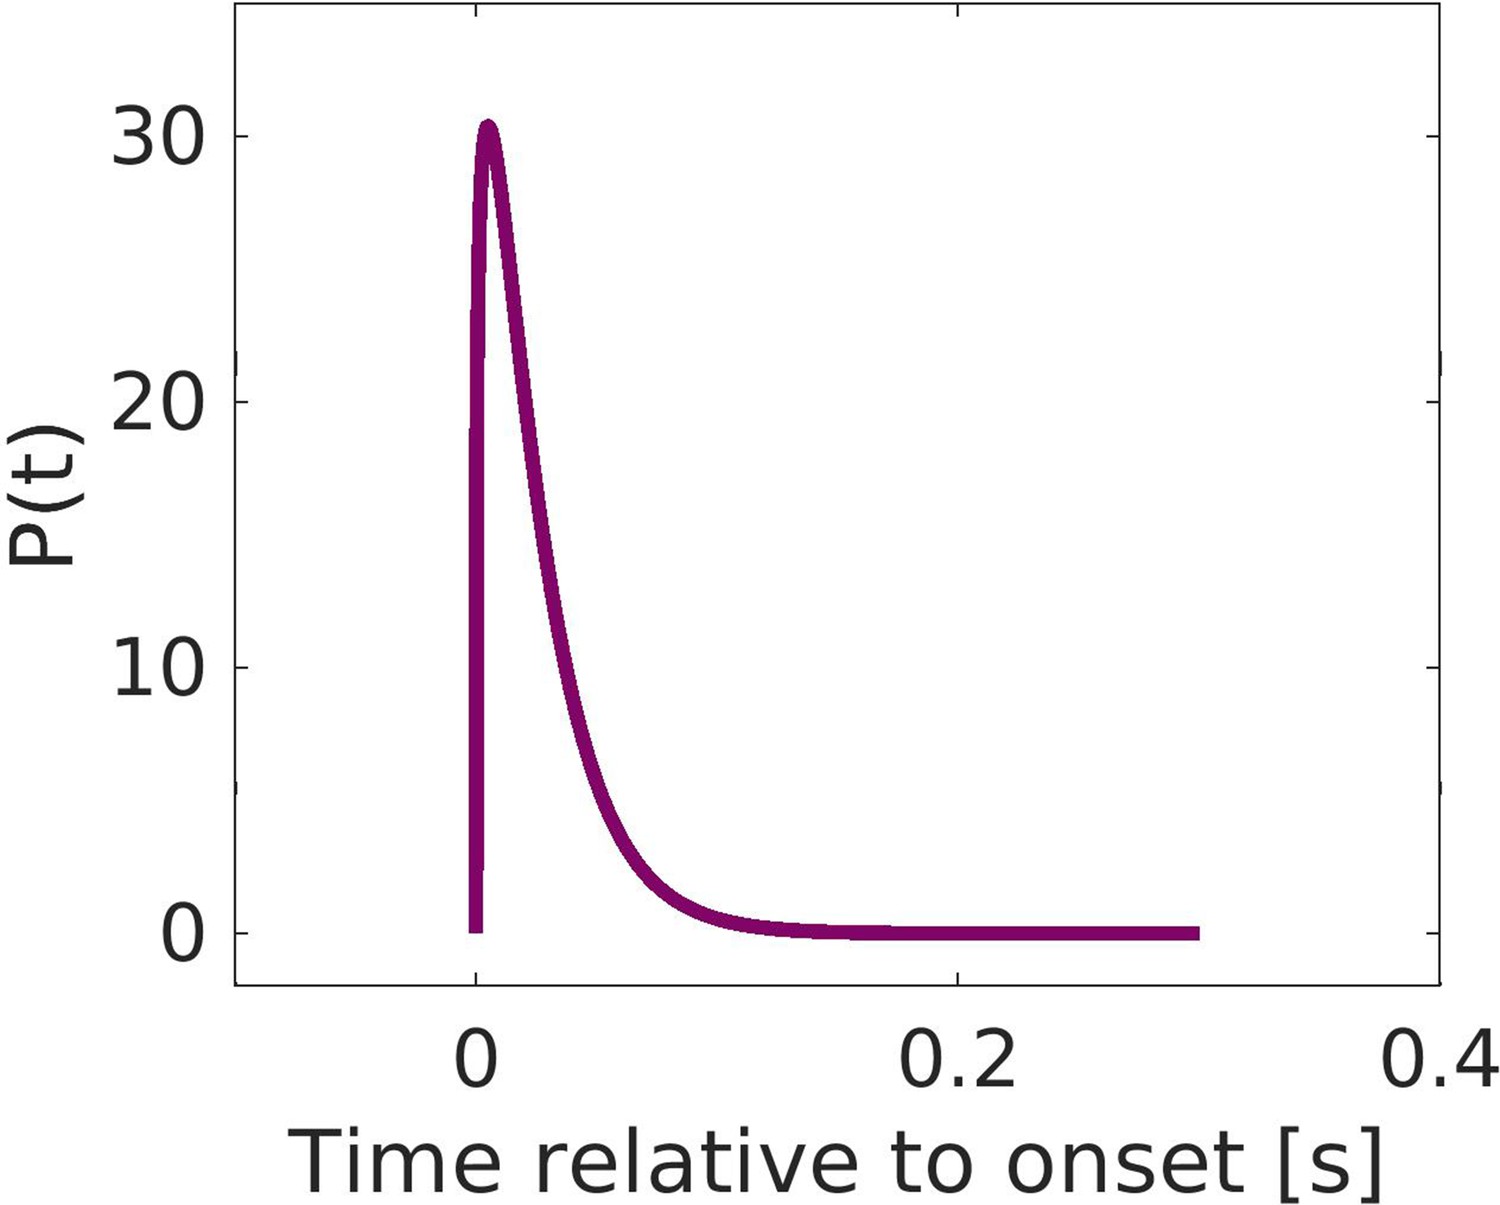
The gamma distribution (a=1.25 and b=.02) in the pulse-coupled model of group synchronization localizes the coupling in time, Equation 5.
Figure 3 with 2 supplements
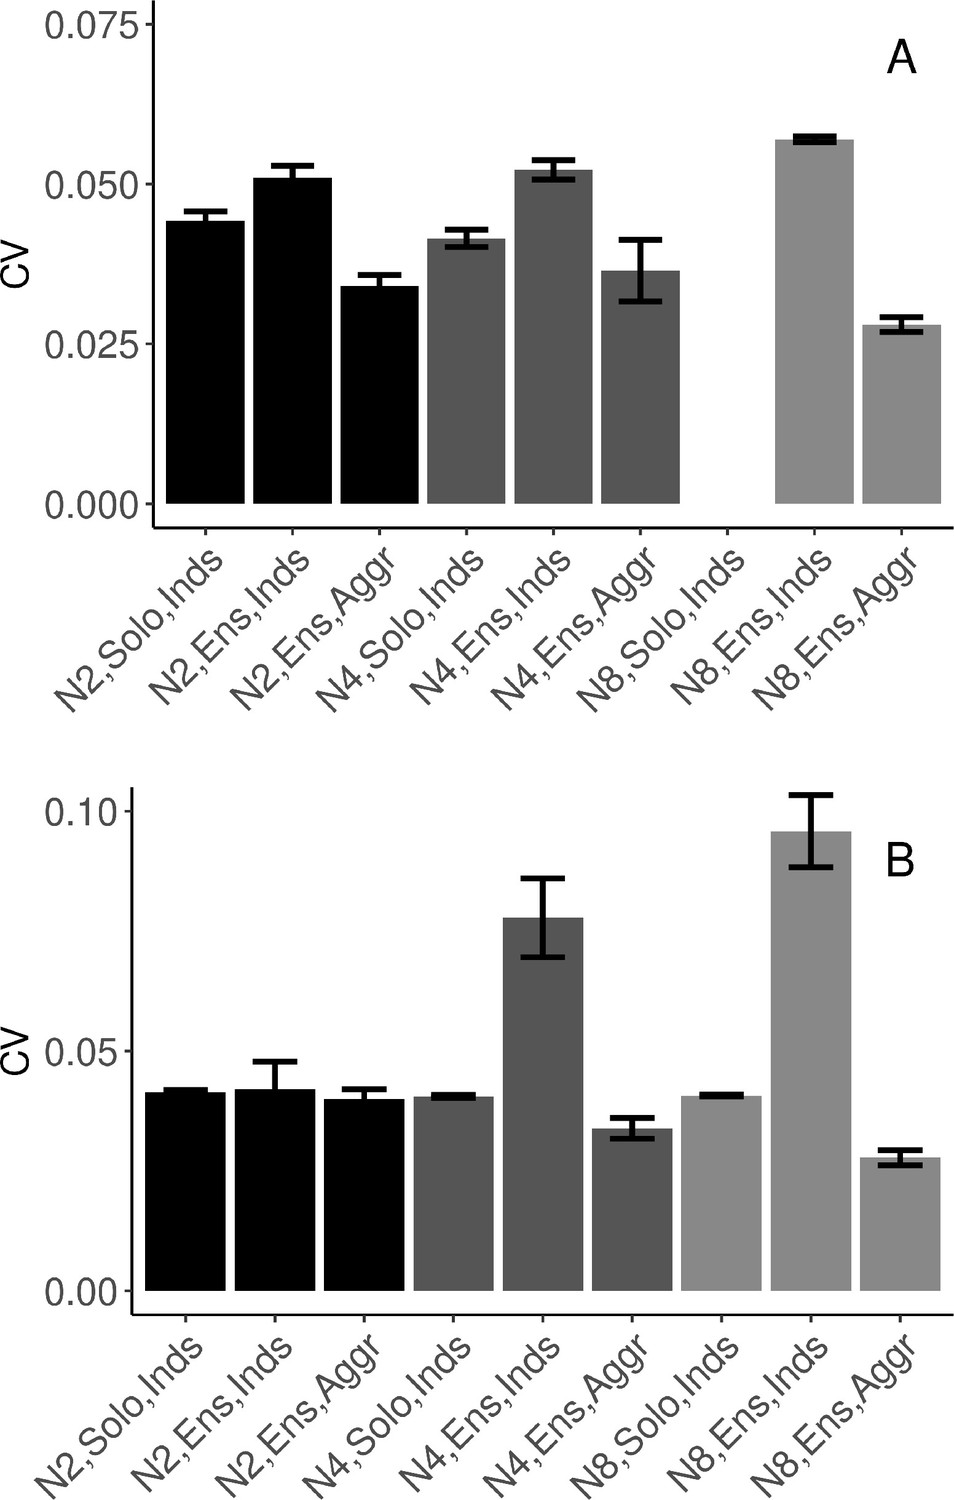
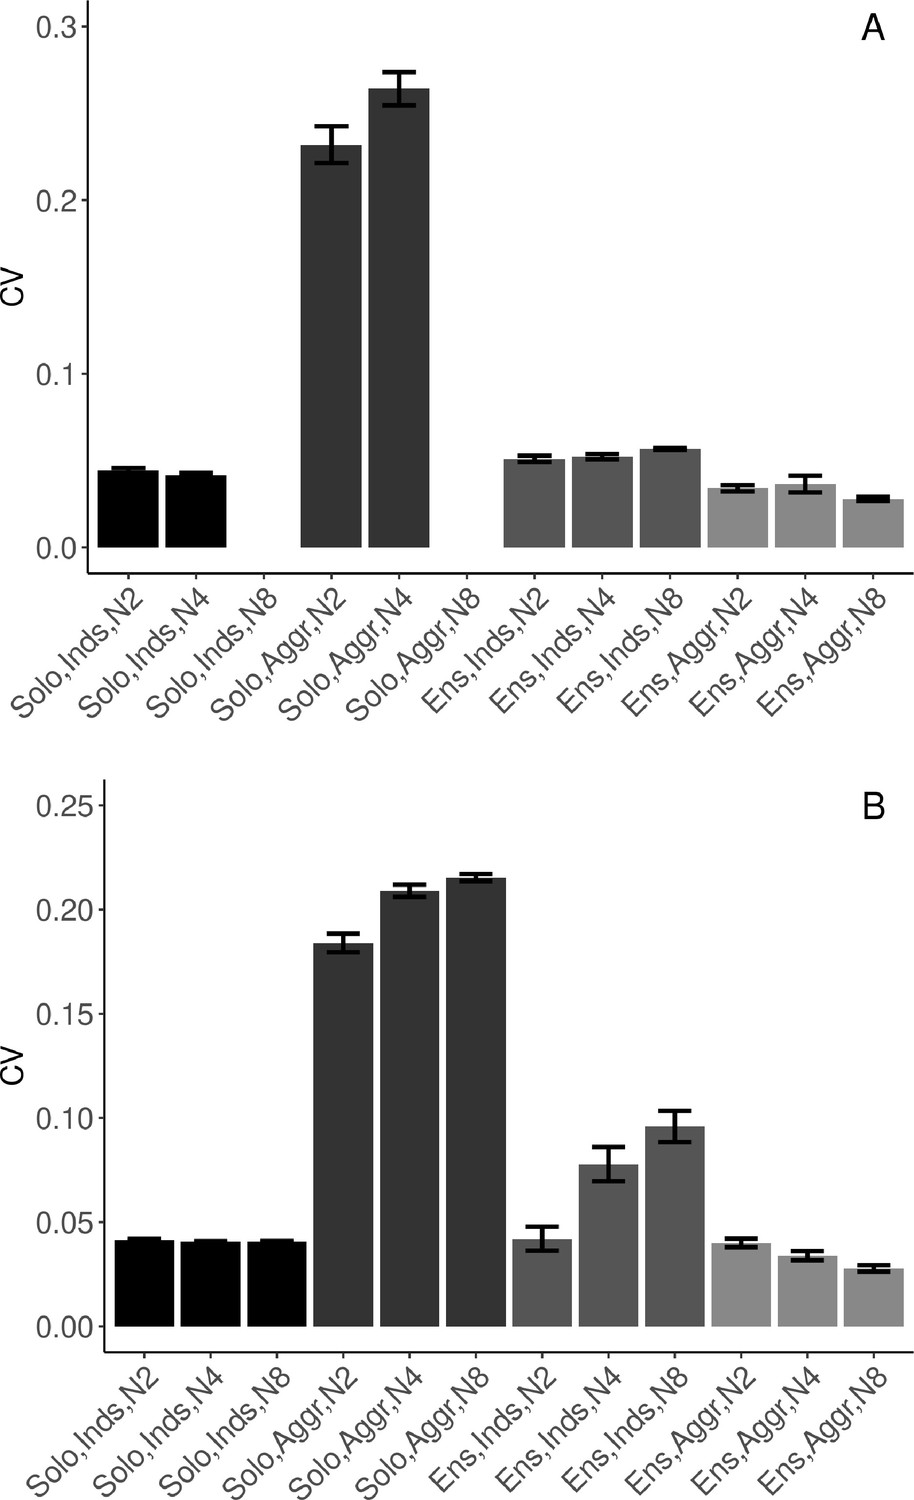
Task performance measured in terms of mean (SE) coefficient of variation of inter-onset intervals (IOIs).
(A) Synchronization-continuation task (SCT) drumming trials (no data collected in N8 solo condition). (B) Pulse-coupled Kuramoto model. N2=dyad; N4=quartet; N8=octet; Inds = individual participants; Aggr = group-aggregate; Solo = solo condition; Ensemble = ensemble condition. Error bars are standard errors. With missing trials, the number of observations in the respective conditions was n=(88, 88, 44, 111, 110, 32, ∅, 953, 133) in (A), and n=(200, 198, 99, 400, 400, 100, 800, 688, 86) in (B).
Figure 3—figure supplement 1
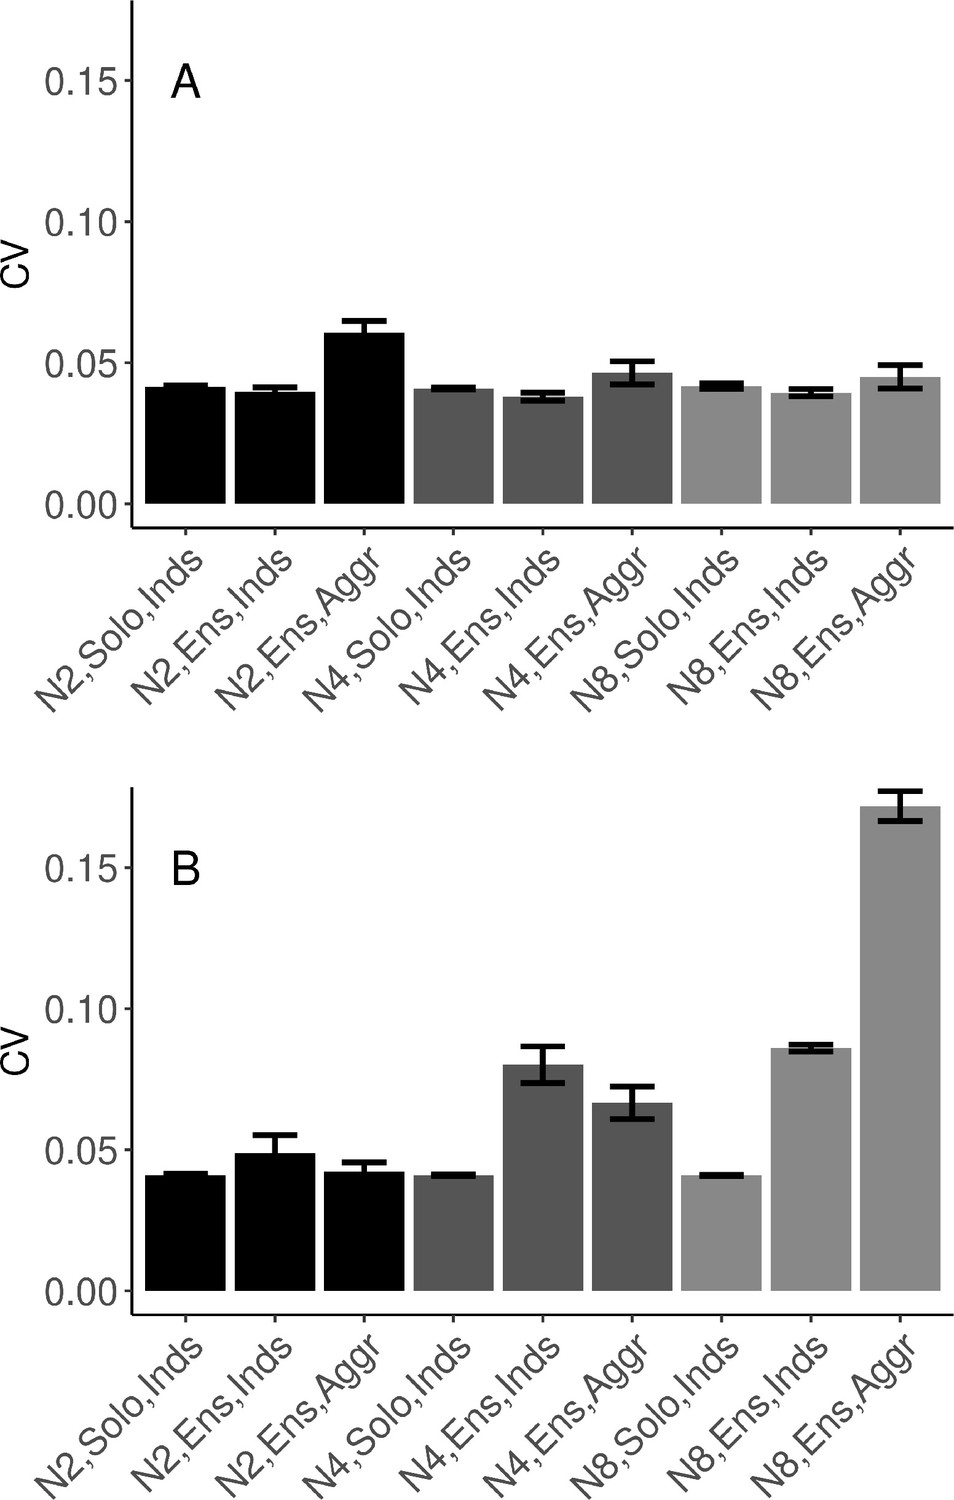
Task performance measured in terms of mean (SE) coefficient of variation of IOIs.
N2=dyad; N4=quartet; N8=octet; Inds = individual participants; Agg = group-aggregate; Solo = solo condition; Ens = ensemble condition; no data collected in N8 Solo condition. (A) Synchronization-continuation task (SCT) drumming trials. (B) Simulations. As a sanity check, group-aggregate variability of IOIs in the solo (pseudo-group-ensemble) was much higher. A linear model was fitted to duet and quartet drumming trials (N2 and N4), the groups where the participants performed both in solo and ensemble condition. The statistical model confirmed that the group-aggregate variability in ensemble condition was lower than the pseudo-group-aggregate in solo playing condition (β=−0.171, SE = 0.016, and t=−10.56). In addition, the pseudo-group-aggregate was higher than individuals’ variability in solo conditions (β=0.153, SE=0.011, and t=13.38). There was an interaction between group size and the difference between individuals and group aggregate. Pseudo-group-aggregate variability in solo trials increased as group size increased from duet to quartet (β=0.017, SE=0.004, and t=4.67), i.e., as more individual solo performances were put into calculating the mean field. In ensemble playing, group-aggregate variability decreased as group size increased from duet to quartet (β=−0.016, SE=0.005, and t=−3.22), the more individuals playing together, the lower the variability of the group average. Error bars are standard errors. With missing trials, the number of observations was n=(88, 111, ∅, 44, 32, ∅, 88, 110, 953, 44, 32, 133) in (A), and n=(200, 400, 800, 100, 100, 100, 198, 400, 688, 99, 100, 86) in (B).
Figure 3—figure supplement 2
Variability in alternative models of group synchronization.
(A) The classical Kuramoto model with constant coupling term. (B) The pulse-coupled model but with selective coupling in a ring topology, where units only interact with their immediate neighbors. In contrast to the pulse-coupled model developed in the present paper, these models do not exhibit the pattern of data across conditions found empirically, see Figure 3. Error bars are standard errors. With missing trials, the number of observations in the respective conditions was n=(200, 200, 100, 400, 400, 100, 800, 800, 100) in (A), and n=(200, 198, 99, 400, 396, 99, 800, 784, 98) in (B).
Figure 4 with 1 supplement
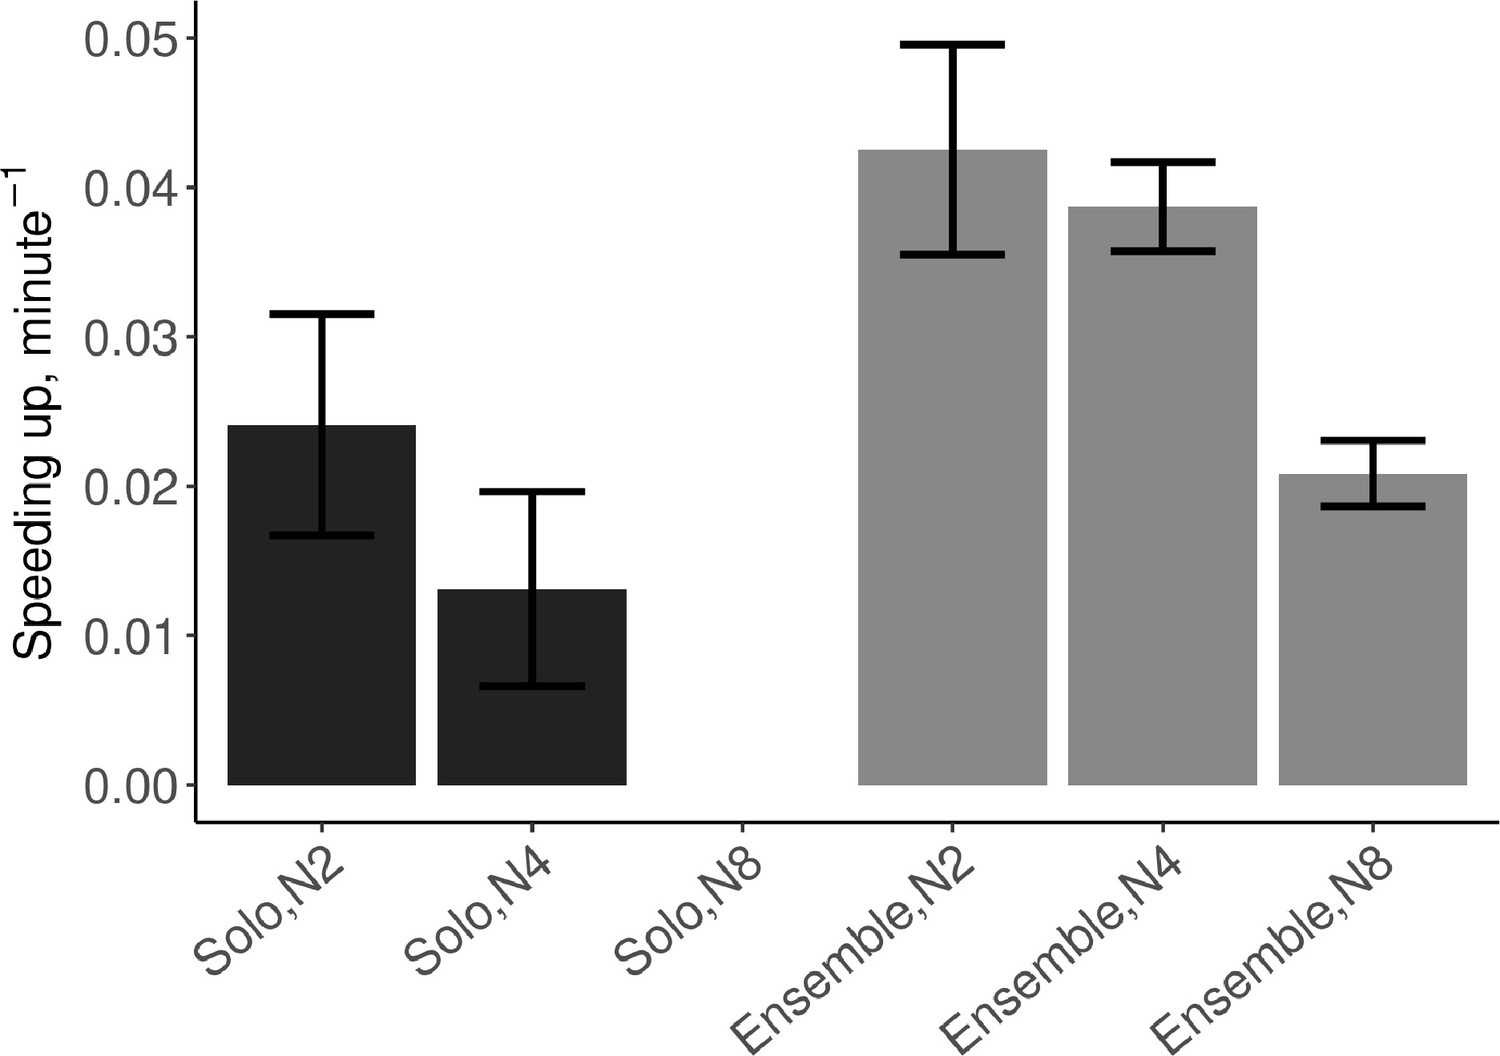
Mean (SE) speeding up defined as the linear slope of tempo over time, computed from the IOIs.
N2=dyad; N4=quartet; N8=octet (no data collected in solo N8 condition). Error bars are standard errors. With missing trials, the number of observations in the respective conditions was n=(88, 111, ∅, 88, 110, 482).
Figure 4—figure supplement 1
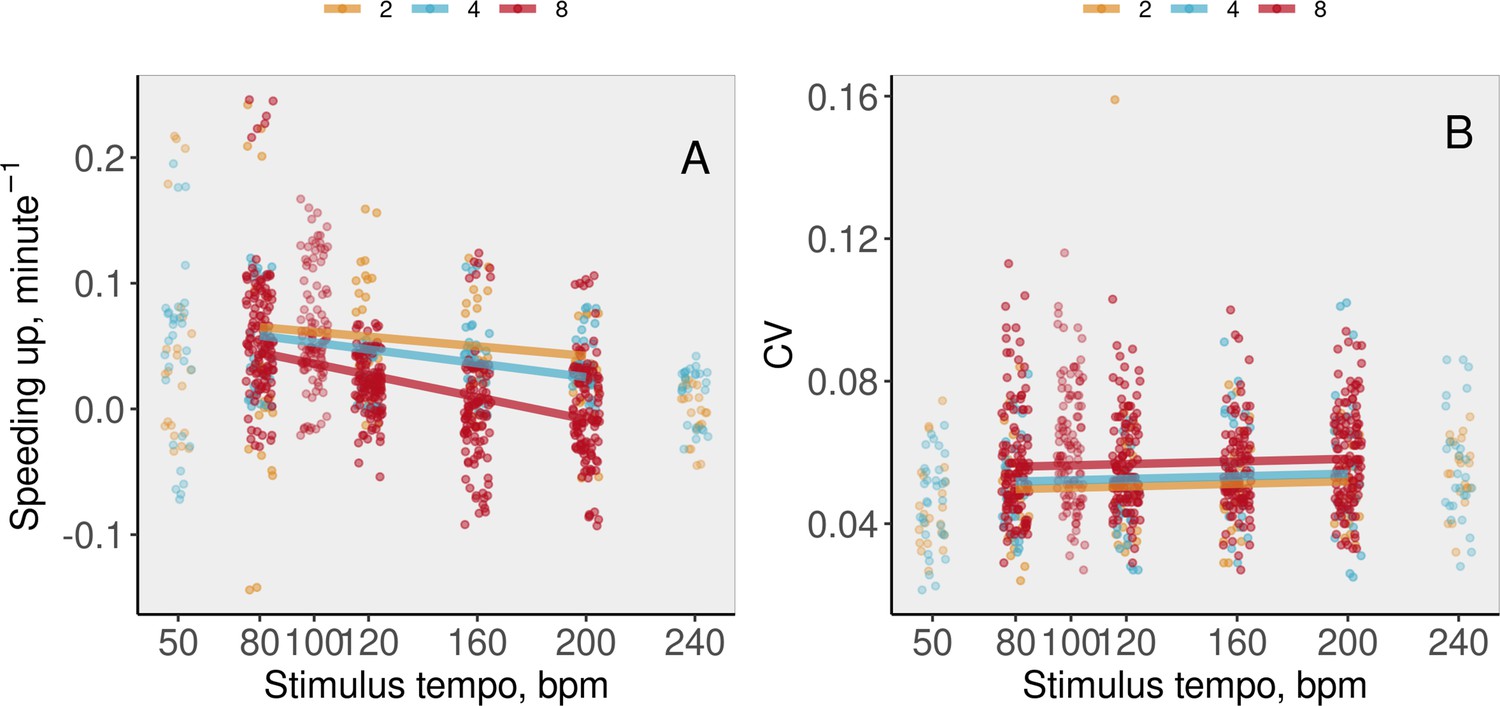
Task performance in ensemble, synchronization-continuation task (SCT) trials, measured in terms of (A) speeding up, defined as the linear slope of tempo over time, and (B) variability.
Individuals’ data across group sizes (color-coded) and tempos are shown (abscissa jittered for visibility) along with the model fit. Note that tempos 50, 100, and 240 were not included in the statistical analysis and main text.
Figure 5 with 1 supplement
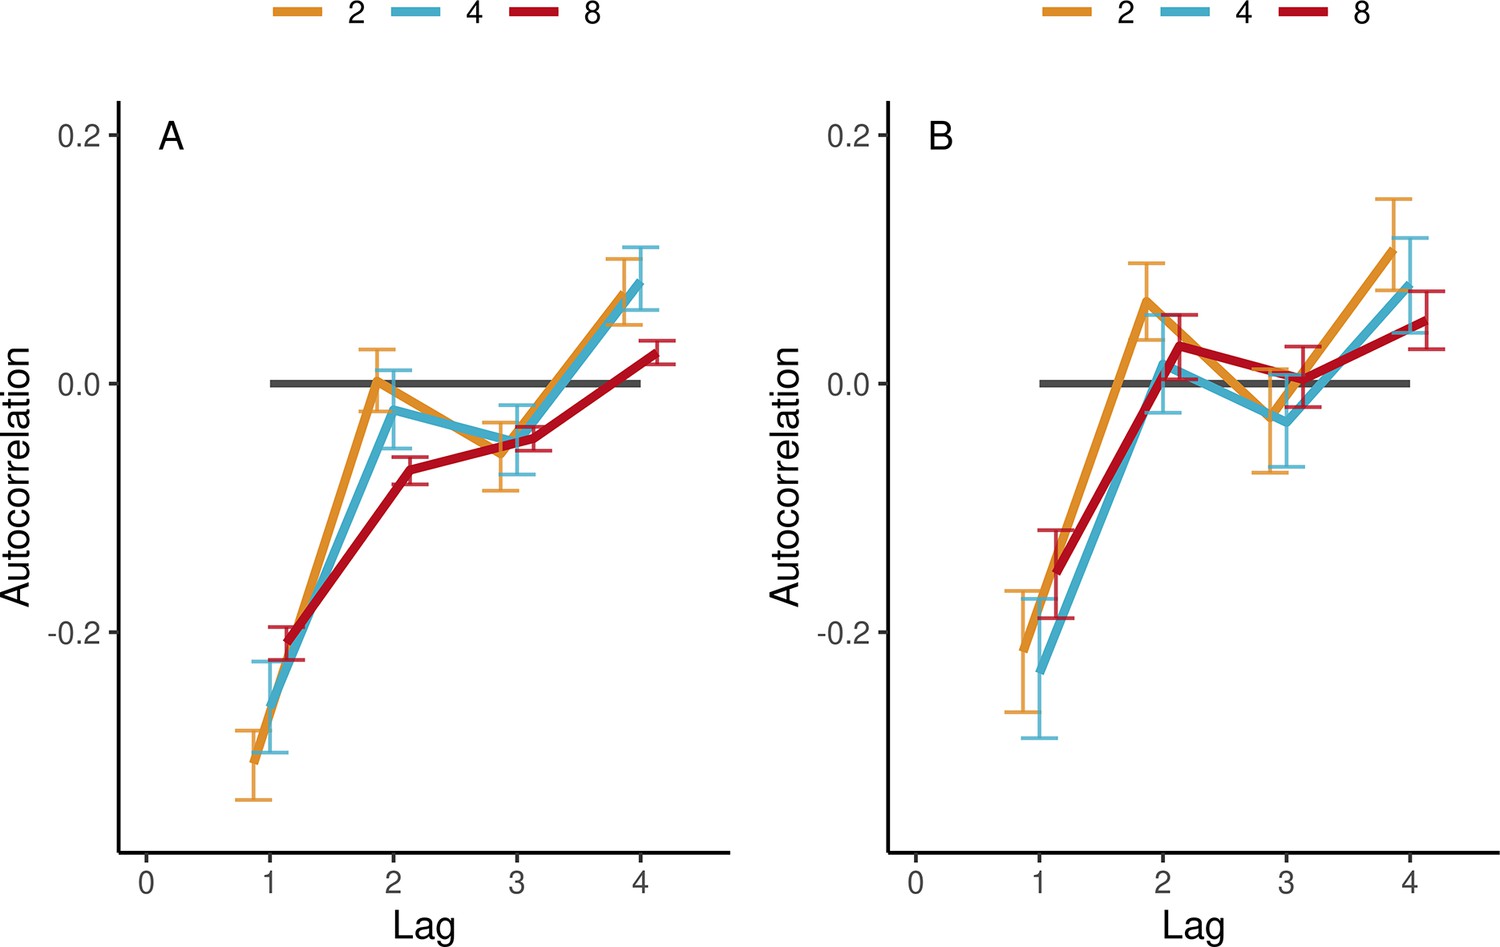
Autocorrelations in the synchronization-continuation task (SCT) in ensemble conditions.
(A) Autocorrelations of individual IOIs, averaged (SE) across participants’ trials and tempos, separately per group size (color-coded). (B) Same for group-aggregate IOIs. Error bars are bootstrap 95% confidence intervals. The number of observations in the respective group sizes was n=(88, 110, 474) in (A) and n=(44, 32, 66) in (B).
Figure 5—figure supplement 1
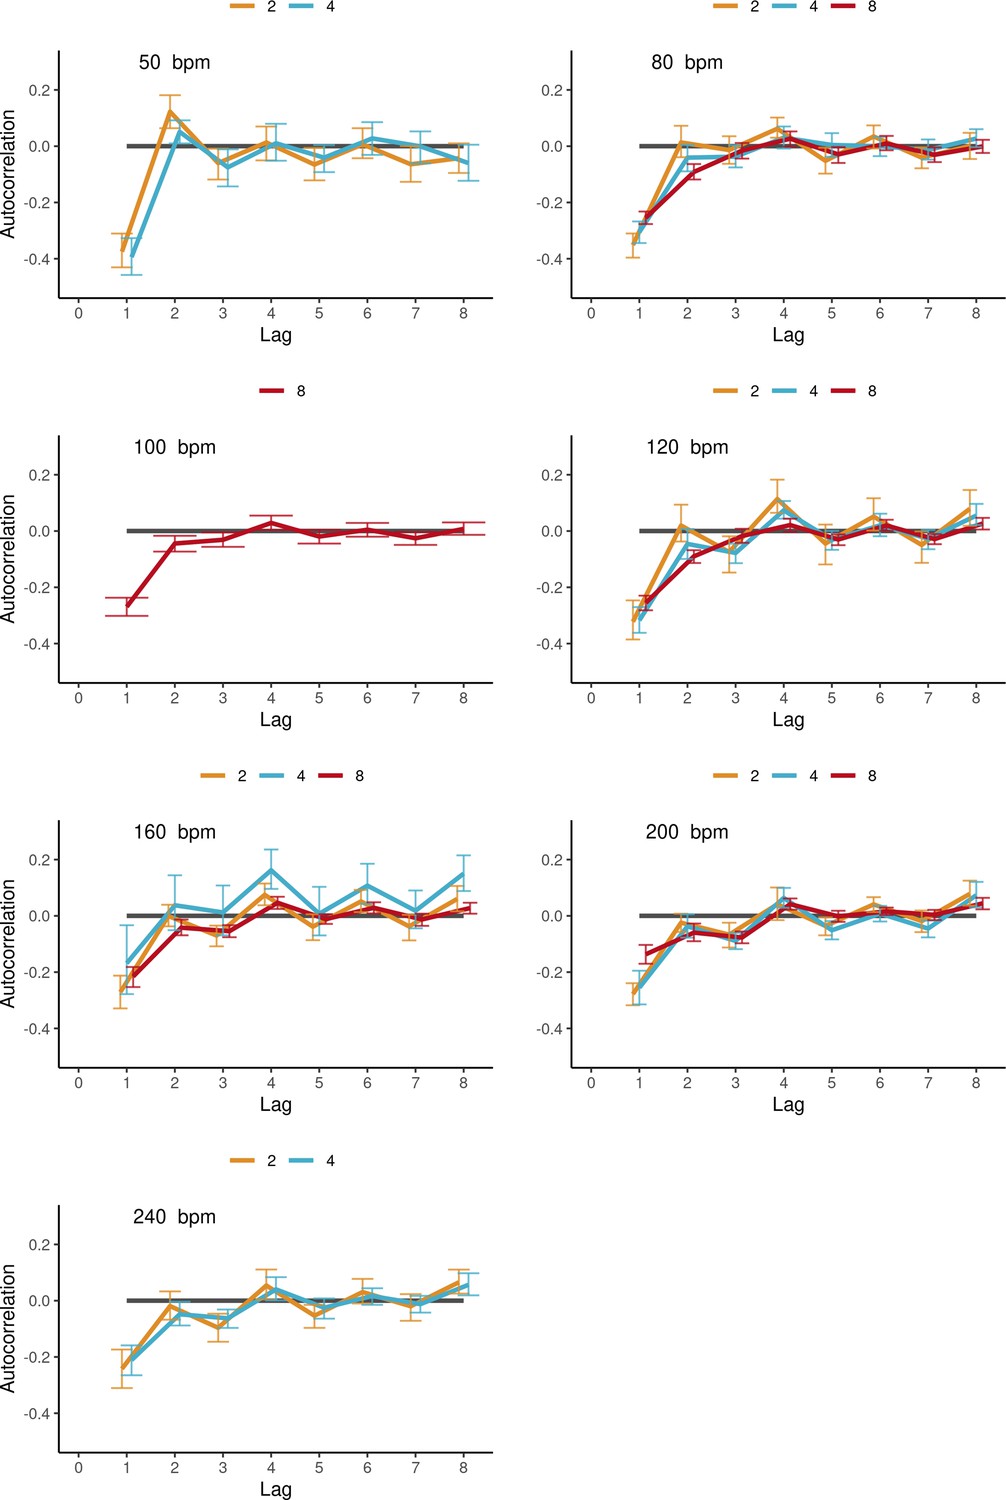
Autocorrelations of individual IOIs in ensemble synchronization-continuation task (SCT) drumming, averaged (SE) across individual participants’ trials, shown separately per tempo (panels) and group size (color-coded lines).
Tempos 50, 100, and 240 were not included in the statistical analysis in the main text. Error bars are bootstrap 95% confidence intervals. The number of observations in the respective group sizes was n=(20, 14) in bpm=50, n=(22, 28, 83) in bpm=80, n=(77) in bpm=100, n=(22, 26, 85) in bpm=120, n=(22, 28, 83) in bpm=160, n=(22, 28, 84) in bpm=200, n=(22, 27) in bpm=240.
Figure 6 with 1 supplement

Cross-correlations in the synchronization-continuation task (SCT) in ensemble conditions.
Averages (SE) across participant pairs and tempos are shown separately per group size (color-coded lines). IOIs were aligned across participants and pre-whitened by filtering with an autoregressive model. Error bars are bootstrap 95% confidence intervals. The number of observations in the respective group sizes was n=(44, 140, 1479).
Figure 6—figure supplement 1
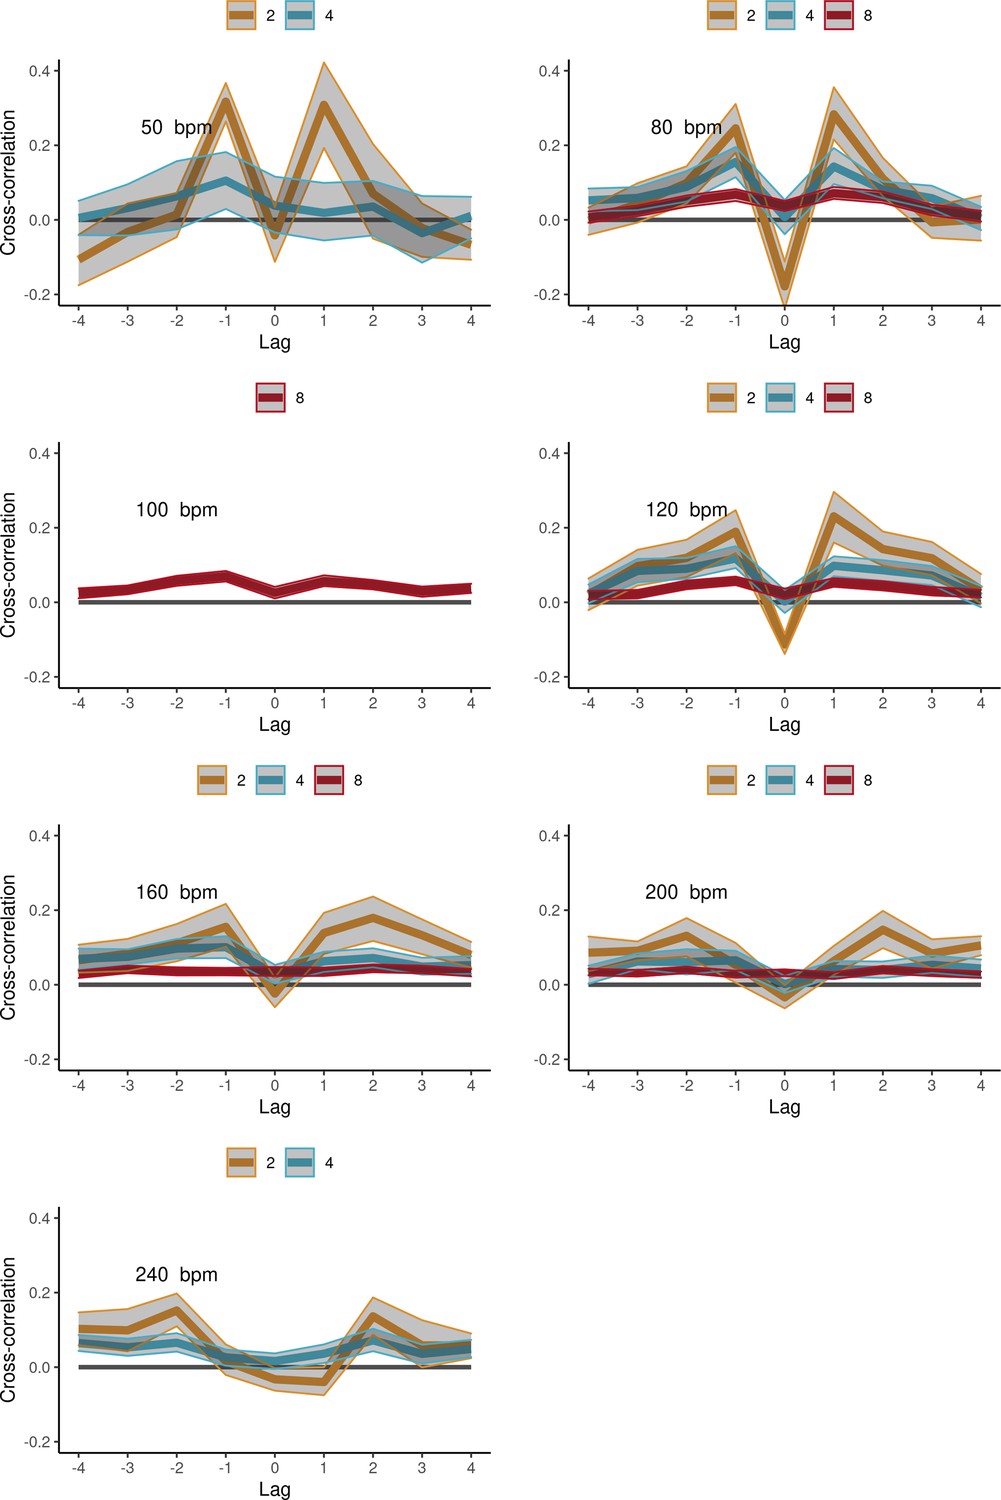
Cross-correlations in the synchronization-continuation task (SCT) task, ensemble conditions, averaged across participant pairs (±CIs), per tempo (panels) and group size (color-coded lines).
IOIs were aligned across participants and pre-whitened by filtering with an autoregressive model. Tempos 50, 100, and 240 were not included in the statistical analysis. Error bars are bootstrap 95% confidence intervals. The number of observations in the respective group sizes was n=(10, 19) in bpm=50, n=(11, 36, 248) in bpm=80, n=(232) in bpm=100, n=(11, 32, 260) in bpm=120, n=(11, 36, 248) in bpm=160, n=(11, 36, 254) in bpm=200, n=(11, 34) in bpm=240.
Figure 7 with 2 supplements
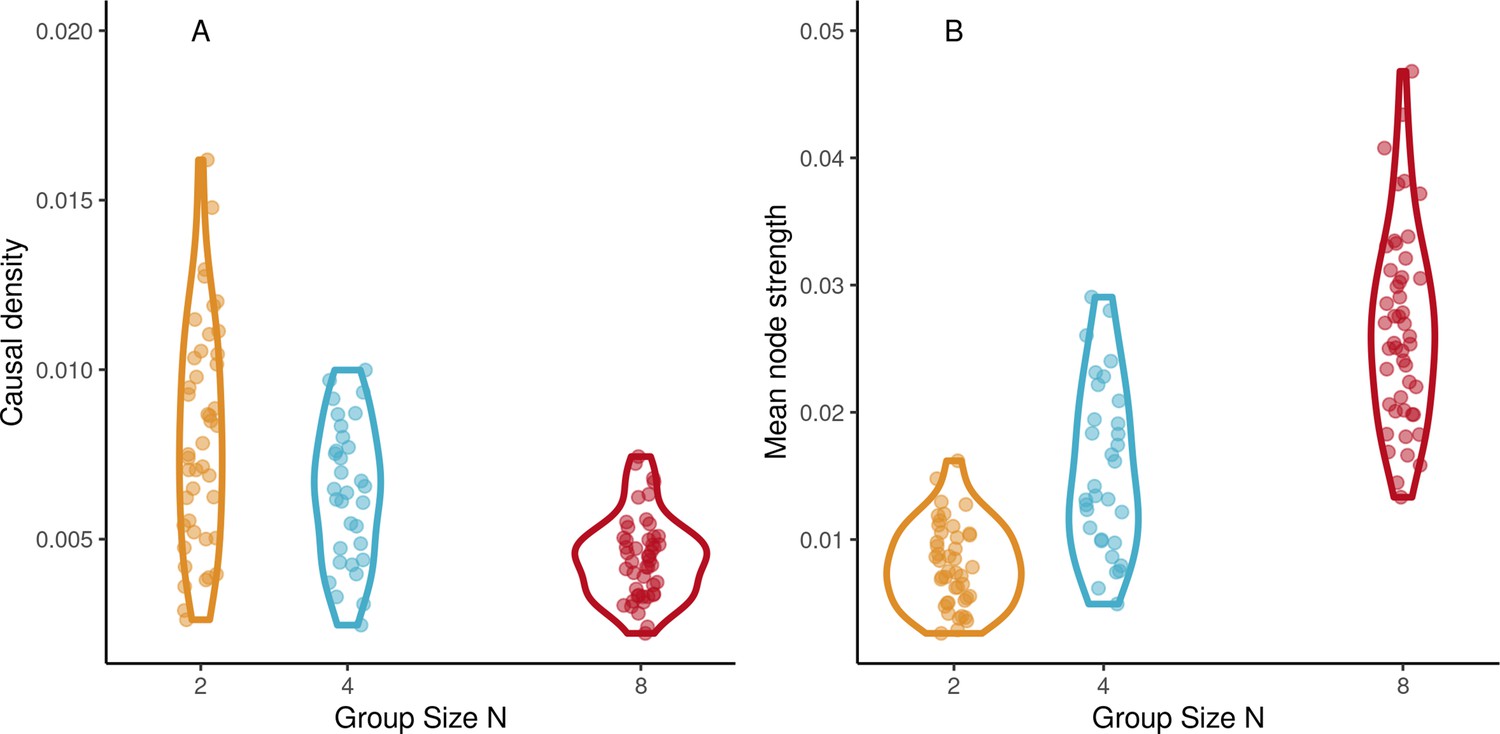
Network dynamics.
(A) Mean node strength increases with group size in the continuation phase of synchronization-continuation task (SCT) ensemble drumming trials. (B) Causal density decreases with group size (Abscissa jittered for visibility).
Figure 7—figure supplement 1
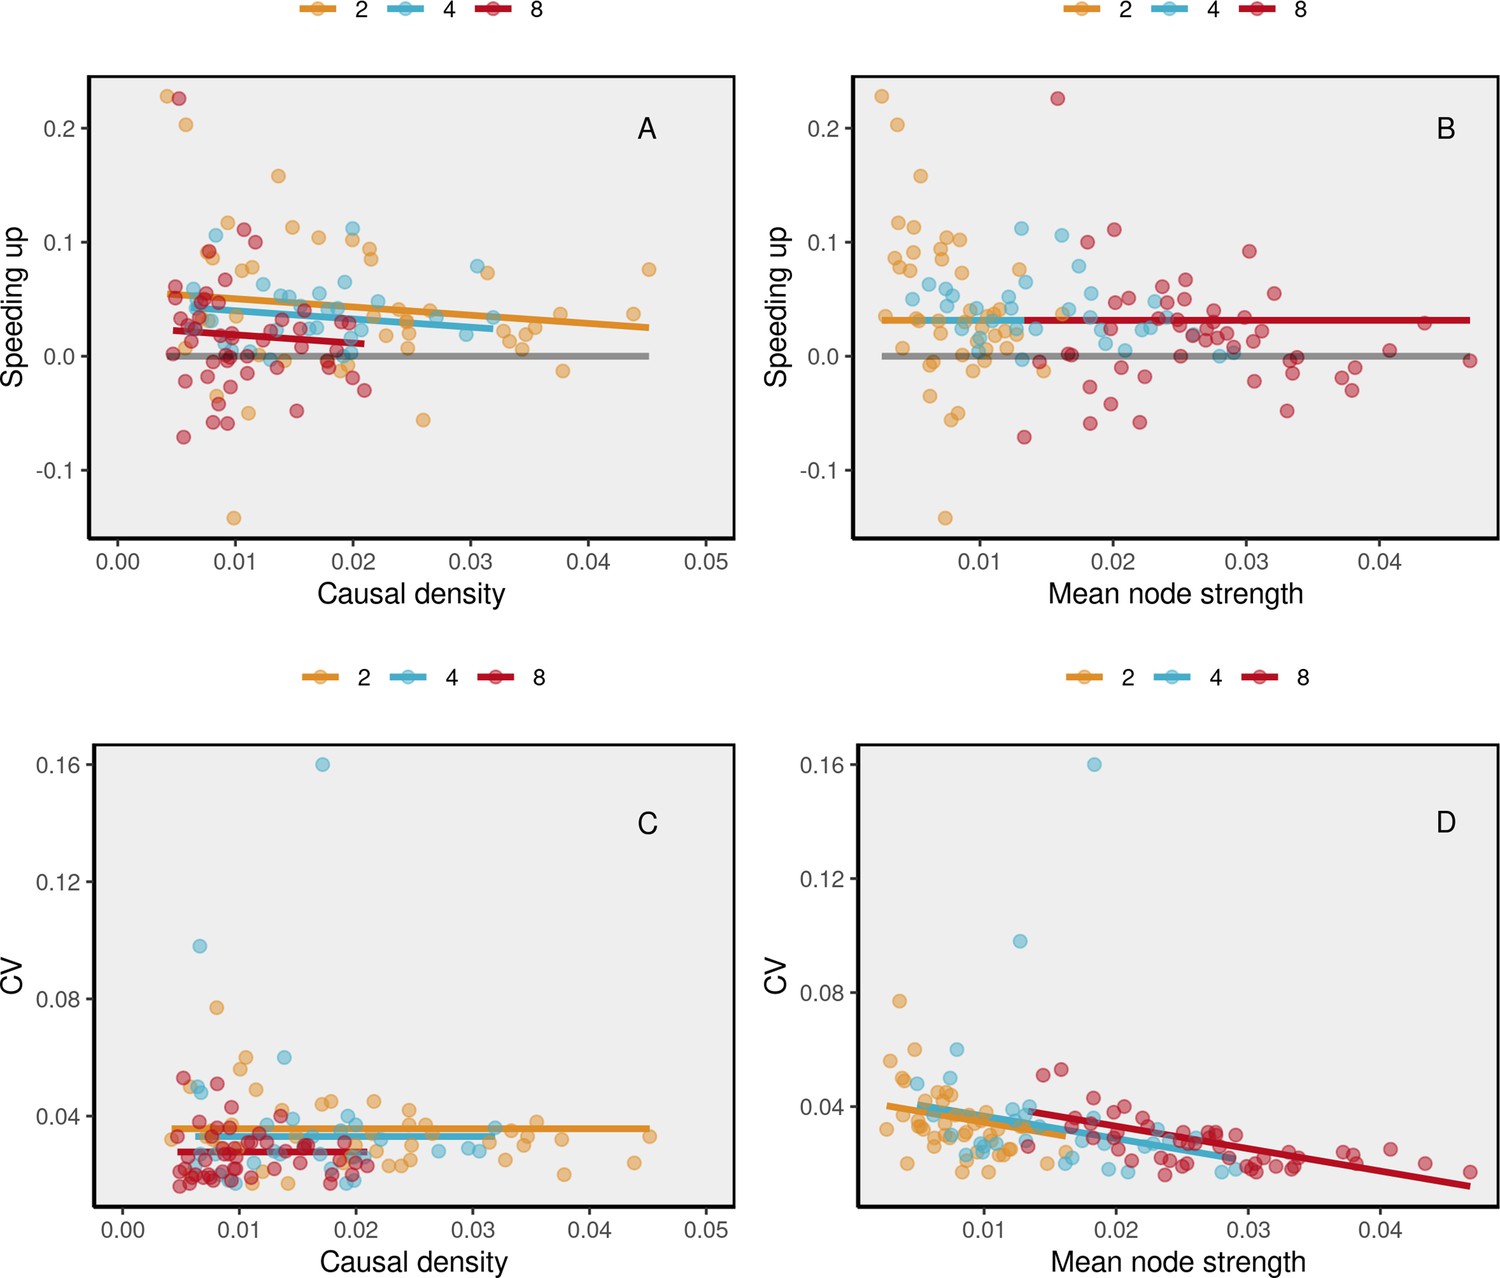
Association between drumming performance measures and network properties in synchronization-continuation task (SCT) ensemble trials.
Figure 7—figure supplement 2
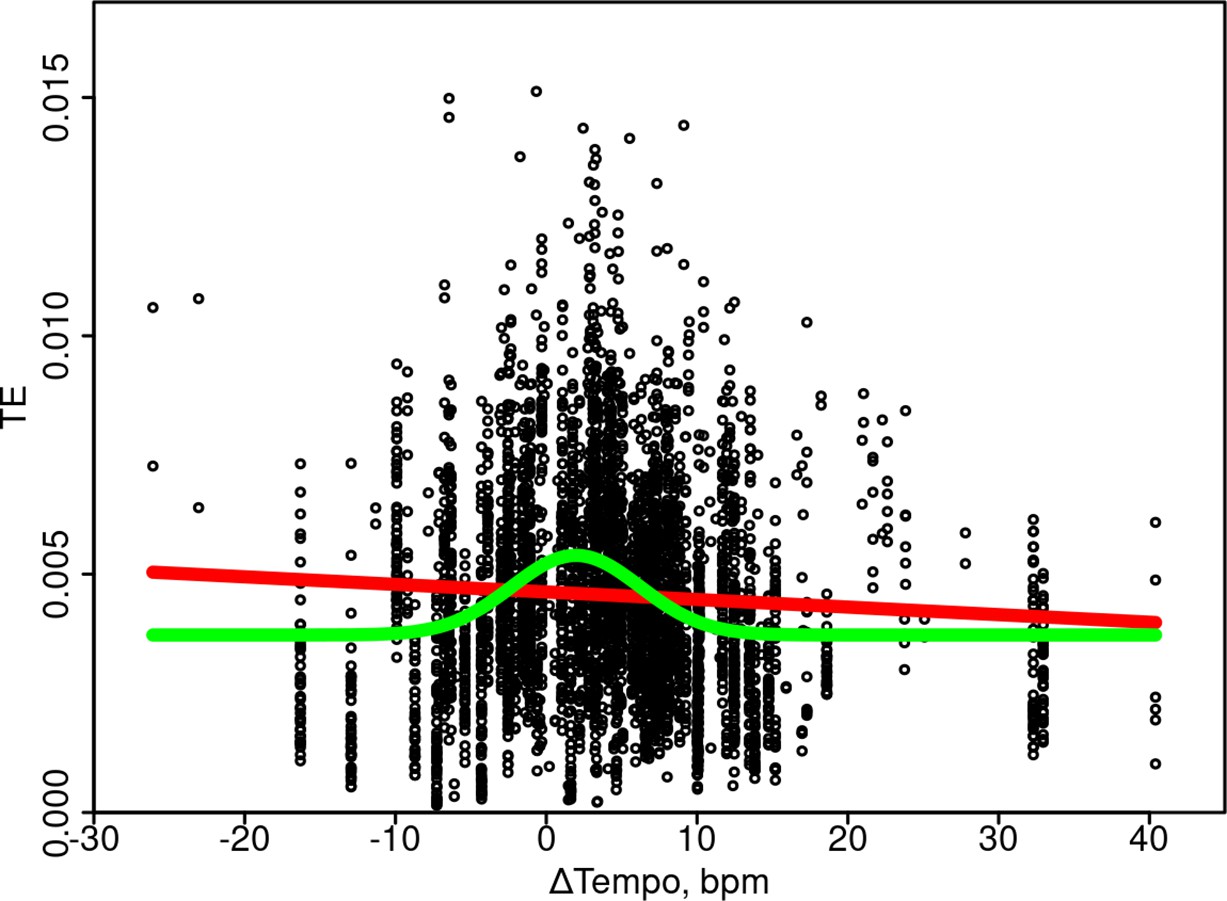
Transfer entropy (TE) is highest in synchronization-continuation task (SCT) trials with minimal tempo increase relative to the instructed tempo.
The Gaussian model (green) was selected over the linear (red) using model comparison with Akaike information criterion and Bayesian information criterion (AIC and BIC), indicating that higher TE values tended to concentrate in the center of the distribution. Specifically, we compared a Gaussian and a linear model’s ability to predict TE values from all pairs during continuation tapping (including all group sizes) from their respective changes in tempo (maximum likelihood estimation, mle in R). Indeed, the AIC method selected the Gaussian model (–39,838.89) over the linear (–39,566.81). The estimated 95% CIs of model parameters indicated that the center of the Gaussian curve was just above zero, change of 1.56–2.37 beats per minute (bpm), over the continuation phase (tempo changes in the data ranged from about –20–40 bpm), suggesting that best group coordination was achieved when participants were slowly increasing their tempo or that slowly increasing the tempo allowed for best coordination.
Figure 8

Group-aggregate onset times from convolving the drummers’ onsets with a Gaussian kernel.
Author response image 1
Author response image 2
Additional files
-
Supplementary file 1
Supplementary table.
Separate linear mixed-effects models were fitted for each of lags 1–8 of the autocorrelations of individuals (a) and group aggregates (b) in the continuation phases of synchronization-continuation task (SCT) trials, ensemble conditions. The predictors were group size (N) and Tempo (80, 120, 160, and 200 beats per minute [bpm]). For simplicity, the same full model was fitted in all cases for individuals, Yik=(β0+σ0g)+β1Nik+β2Tempoik+β3NikTempoik+σg, where i is participant, k trial, and g group. For the group aggregate (b) where there was not enough data to fit models with all predictors, Yik=(β0+σ0g)+β1Nik+β2Tempoik+σg was used. Significant coefficients (p<.05, Satterthwaite method) are in bold.
- https://cdn.elifesciences.org/articles/74816/elife-74816-supp1-v2.docx
-
Transparent reporting form
- https://cdn.elifesciences.org/articles/74816/elife-74816-transrepform1-v2.pdf
Download links
A two-part list of links to download the article, or parts of the article, in various formats.
Downloads (link to download the article as PDF)
Open citations (links to open the citations from this article in various online reference manager services)
Cite this article (links to download the citations from this article in formats compatible with various reference manager tools)
Collective dynamics support group drumming, reduce variability, and stabilize tempo drift
eLife 11:e74816.
https://doi.org/10.7554/eLife.74816


