Epithelial-to-mesenchymal transition proceeds through directional destabilization of multidimensional attractor
- Department of Computational and Systems Biology, University of Pittsburgh, United States
- Joint CMU-Pitt Ph.D. Program in Computational Biology, University of Pittsburgh, United States
- Department of Physics and Astronomy, University of Pittsburgh, United States
- UPMC-Hillman Cancer Center, University of Pittsburgh, United States
Figures
Figure 1
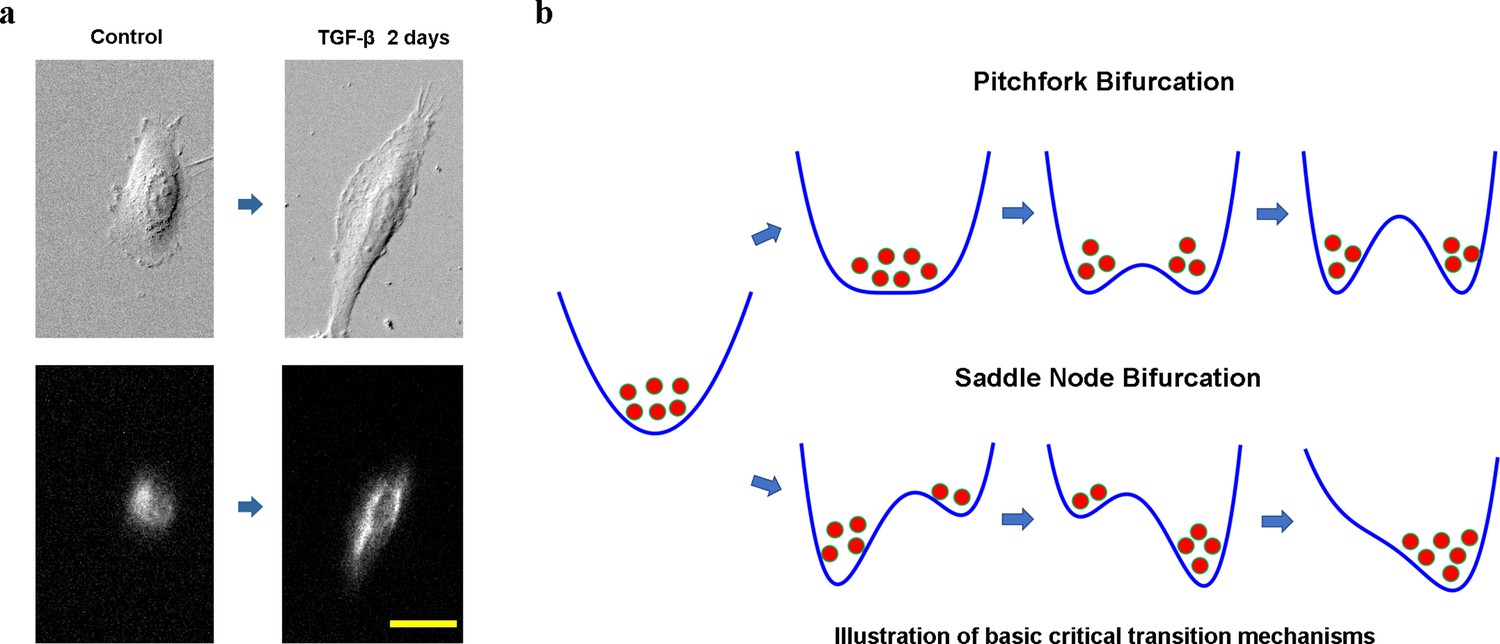
Cell phenotypic transitions as critical state transitions.
(a) Transmission light and fluorescence (Vimentin-RFP) images showing an A549/Vim-RFP cell undergoing epithelial-to-mesenchymal transition. Scale bar: 30 µm. (b) Possible critical transition mechanisms in EMT. This is an illustration of pitchfork (top) and saddle-node (bottom) bifurcations using 1-D potential systems.
Figure 2
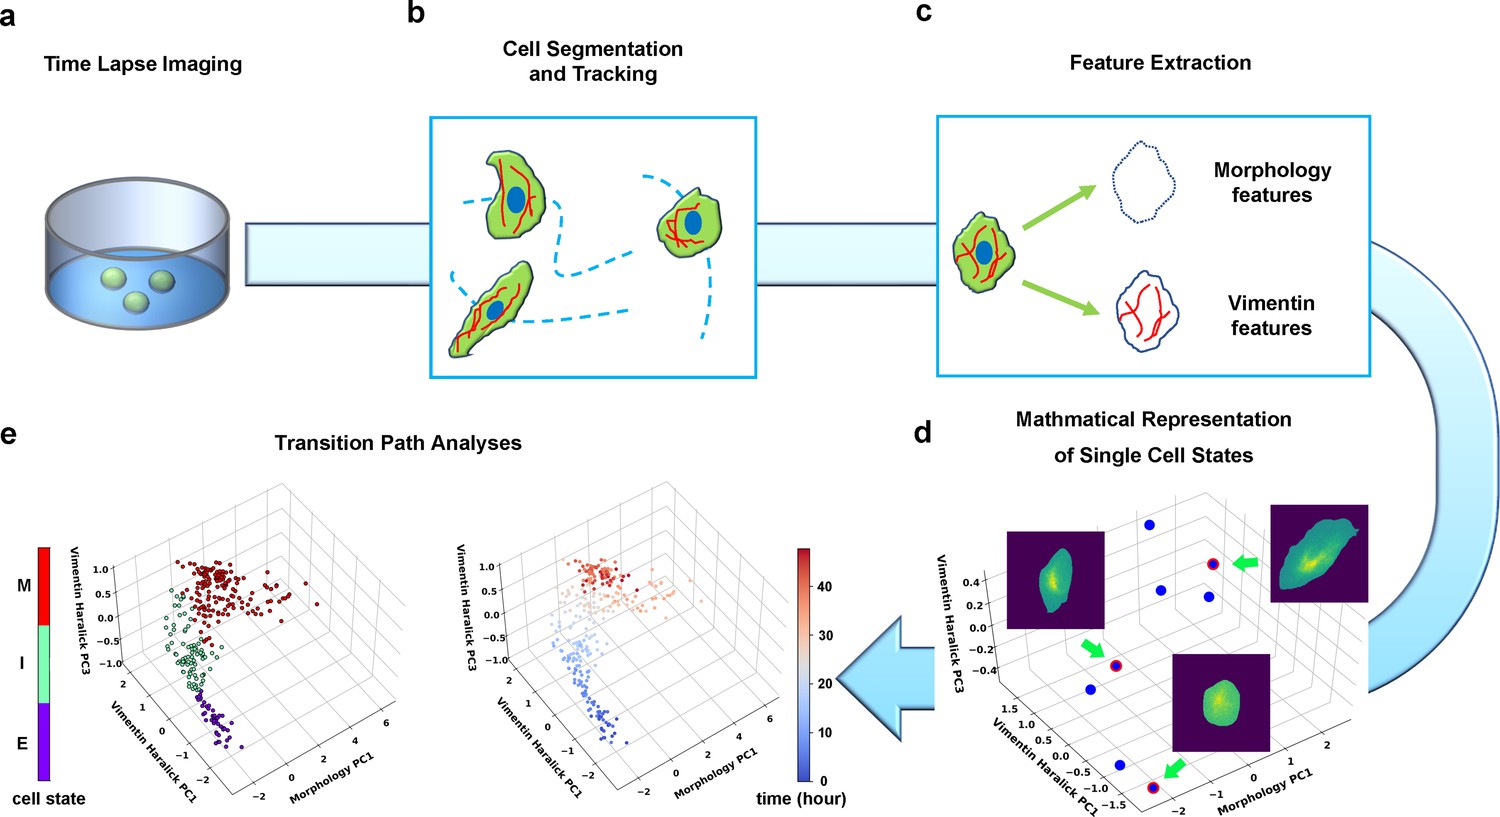
Summary of pipeline for recording and analyzing single-cell trajectories in composite multi-dimensional cell feature space.
(a) Time-lapse imaging of A549/Vim-RFP cells treated with TGF-β. (b) Deep-learning aided single-cell segmentation and tracking on the acquired time-lapse images. (c) Extraction of morphology and vimentin features of single cells. (d) Representation of single cell states in a multidimensional morphology/texture feature space. (e) Transition path analyses over recorded trajectories. Right: A representative single cell trajectory of EMT in the feature space. Color represents time (unit: hour). Left: the same trajectory colored by the regions in the feature space (E, I, and M, for epithelial, intermediate, and mesenchymal regions, respectively) each data point resides. Reduced units are used in this and all other figures.
Figure 3 with 1 supplement
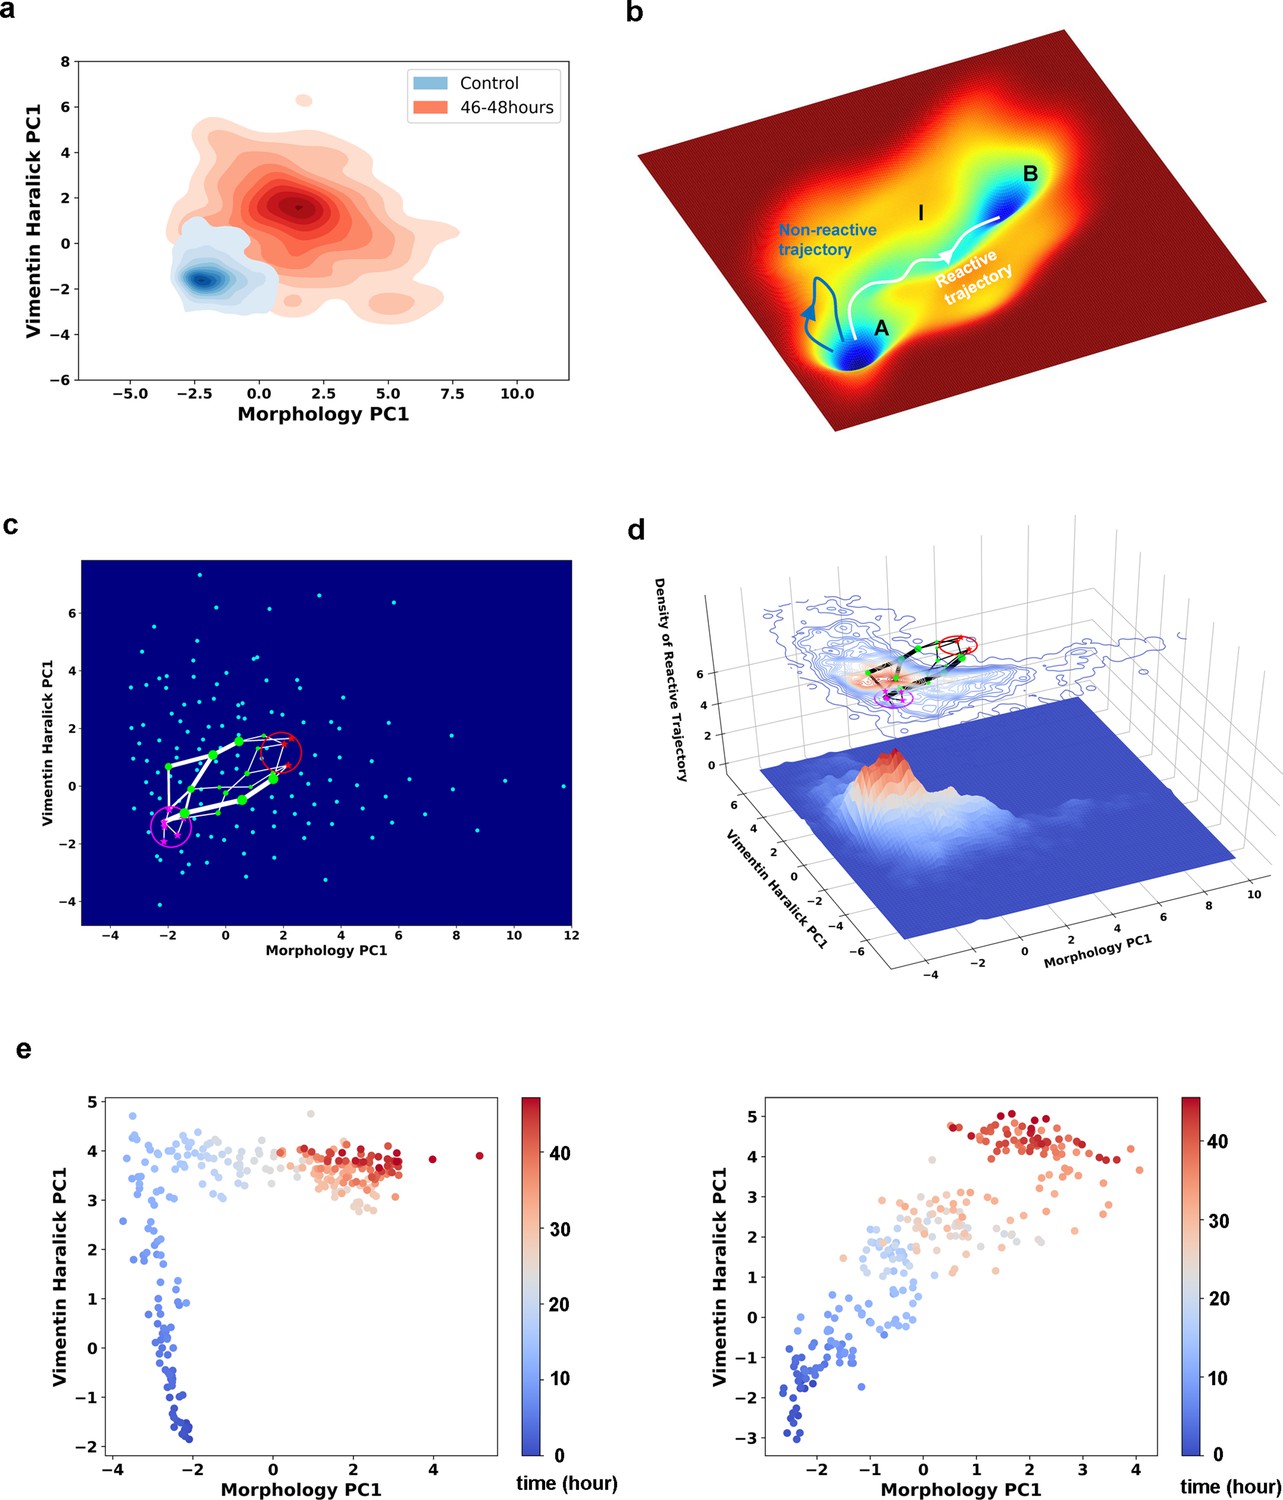
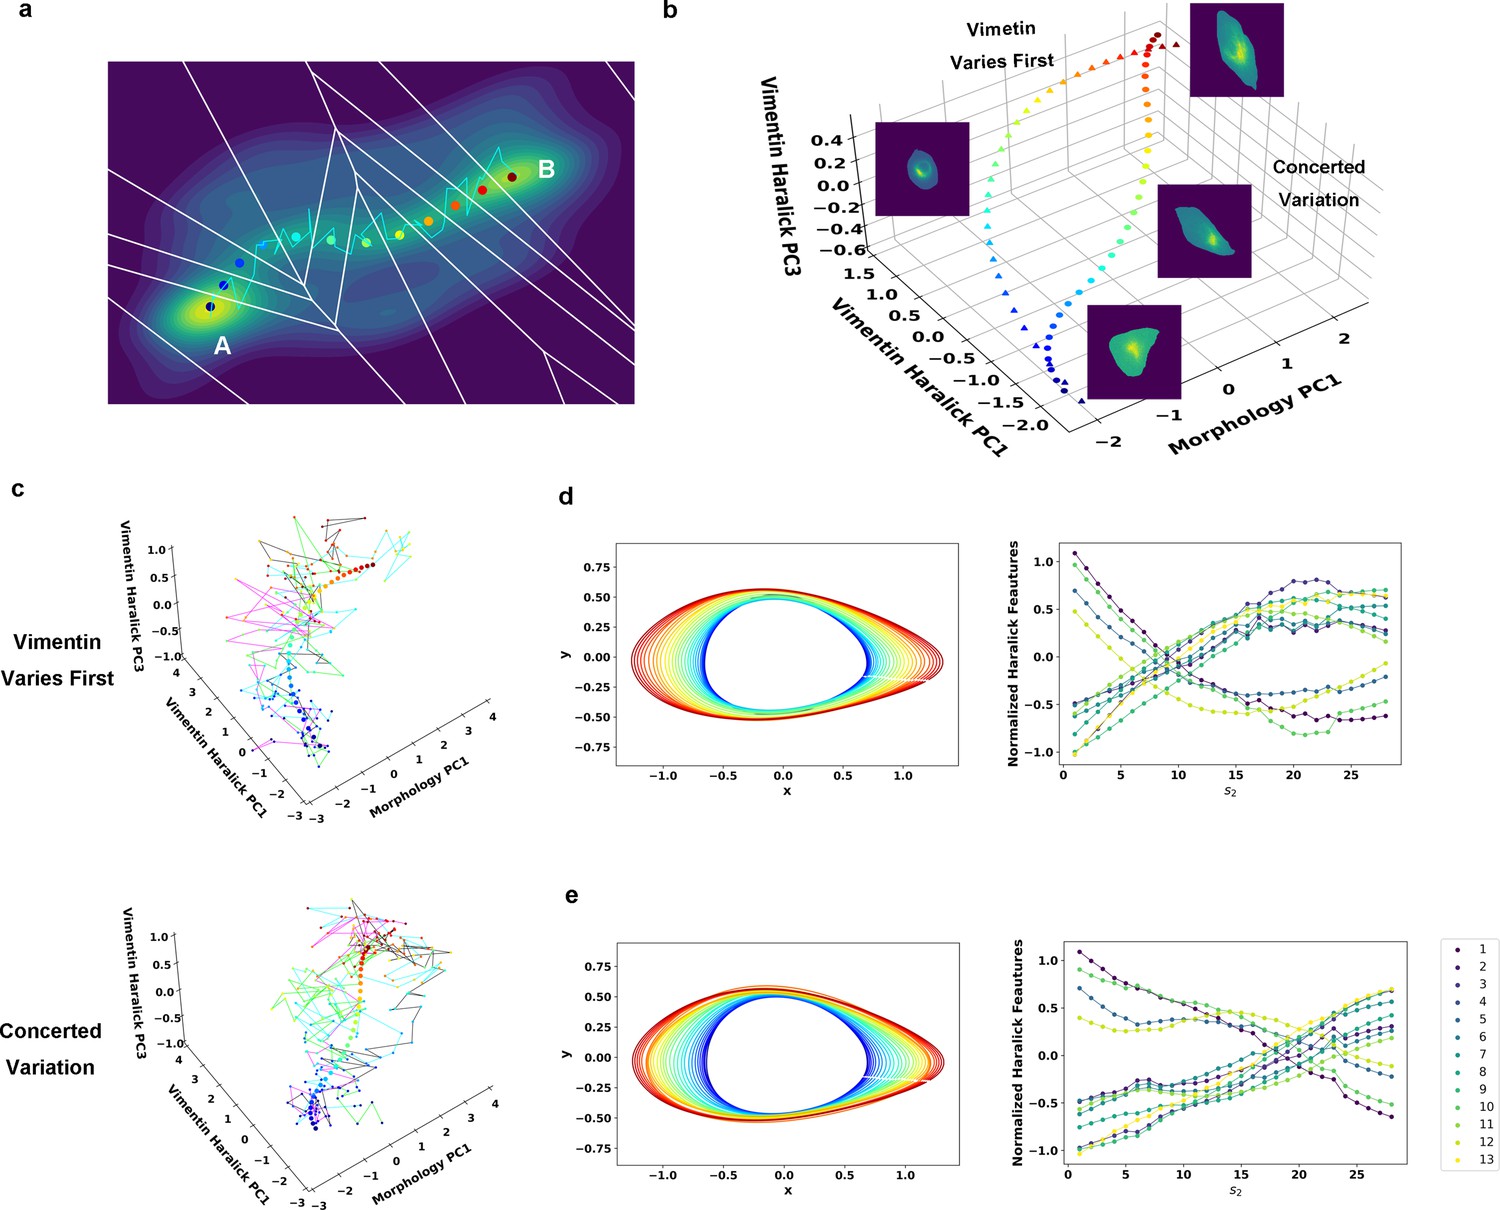
Single cell trajectories of EMT form two distinct groups.
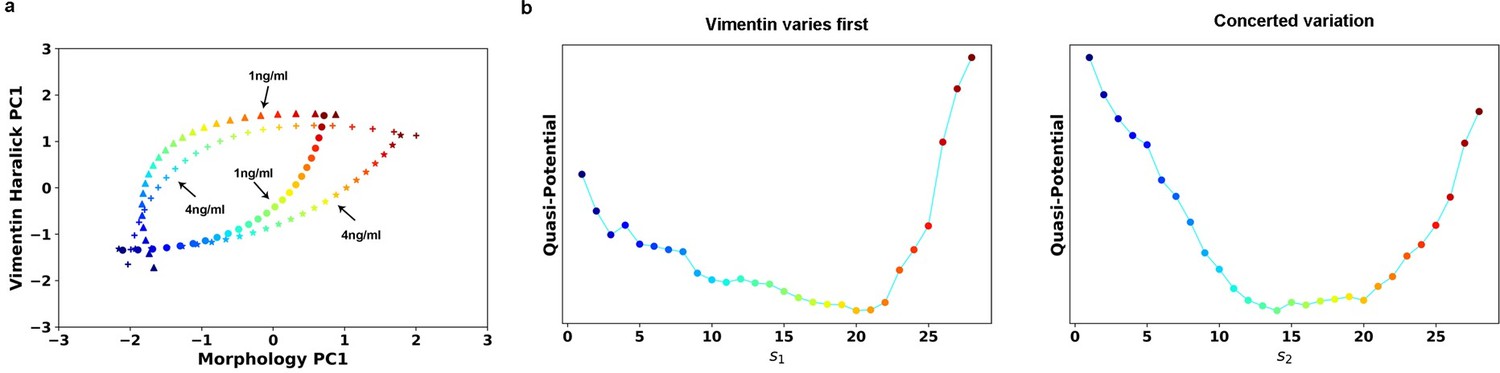
(a) Kernel density estimation of cells in control condition (Blue) and cells after being treated with 4 ng/ml TGF-β for 46–48 hours (Red). (b) Schematic example reactive and nonreactive trajectories in a potential system. Also shown is a valley connecting regions A and B that most reactive trajectories fall in and form a reaction tube. (c) Discretization of the whole single cell data set with self-organizing map into 12 × 12 discrete states (clusters) in the state space. Directed network generated base on the self-organizing map and the transitions between states. The distance between two states is defined as the negative logarithm of transition probability. White lines are shortest between epithelial states (purple stars) and mesenchymal states (red stars). Green dots are states that the shorted paths pass by. The size of a dot stands for the frequency of this dot passed by shortest paths. The width of a white line represents the frequency that these shortest paths pass by. (d) Contour map (top, superimposed with the shortest paths in panel c) and 3D surface-plot (bottom) of density of reactive trajectories in the plane of morphology PC1 and vimentin Haralick PC1. (e) Representative trajectories from the two groups. Left: Vimentin varies first. Right: Concerted variation.
Figure 3—figure supplement 1
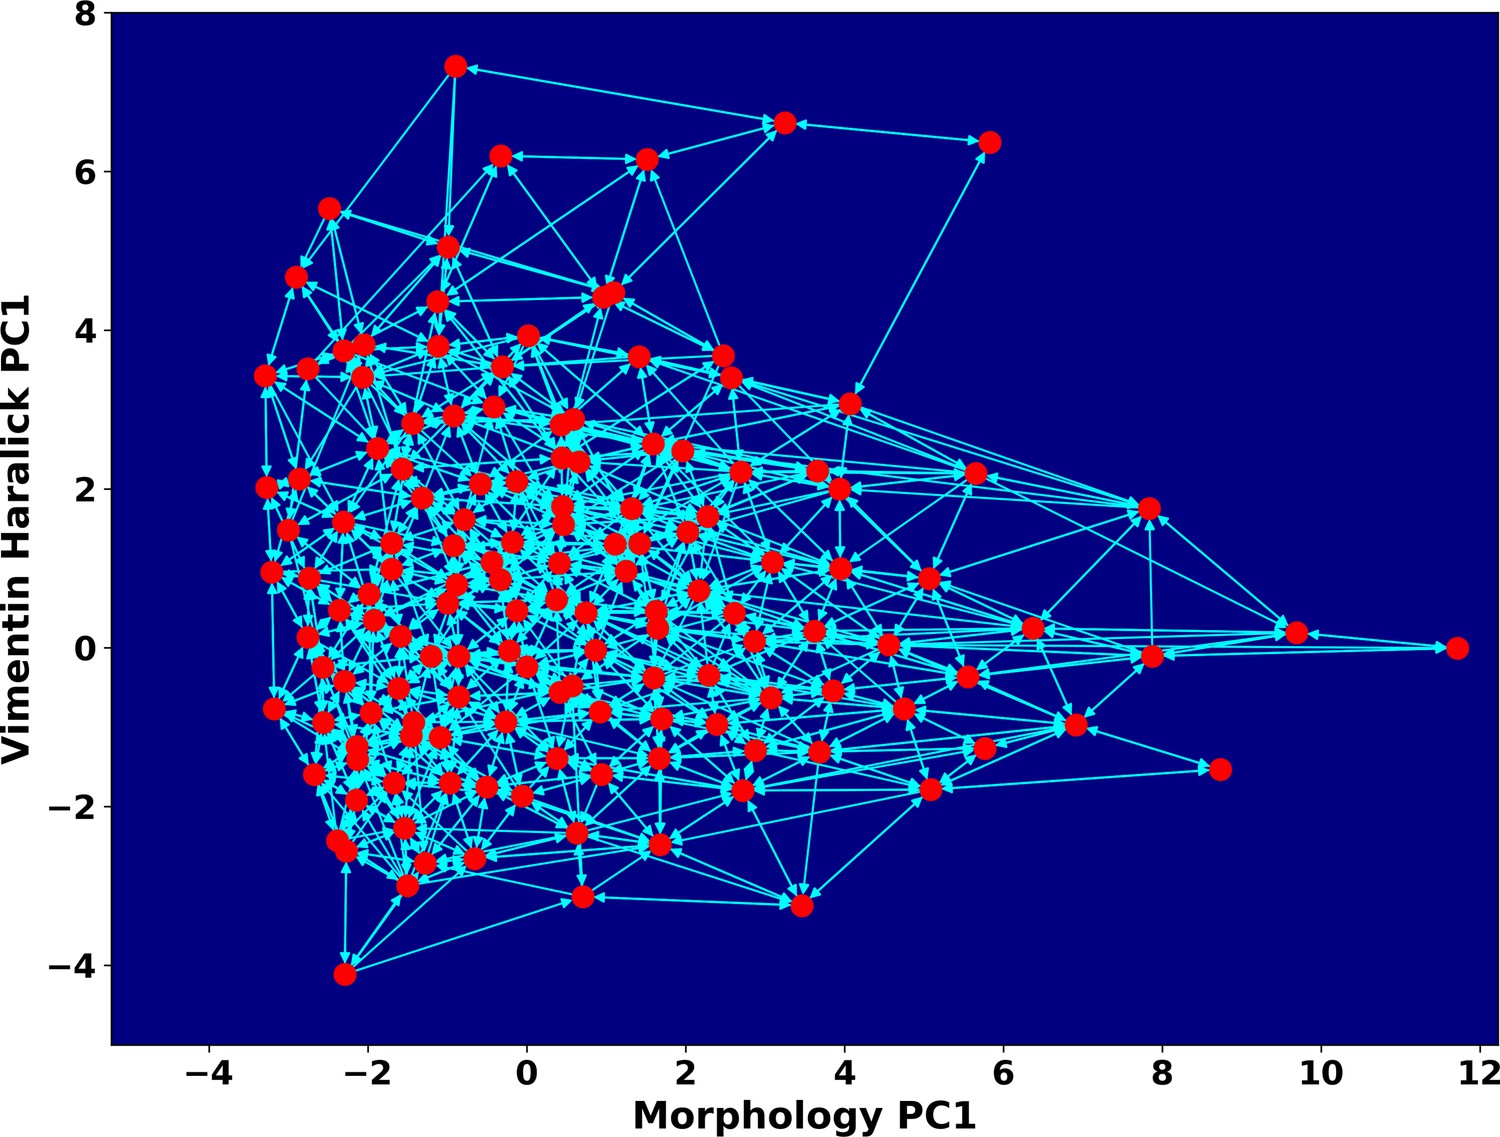
Space approximation of the whole single cell data set with self-organizing map into 12 × 12 discrete states (clusters).
Directed network generated base on the self-organizing map and the transition between states. The distance between two states is defined as the negative logarithm of transition probability.
Figure 4 with 1 supplement
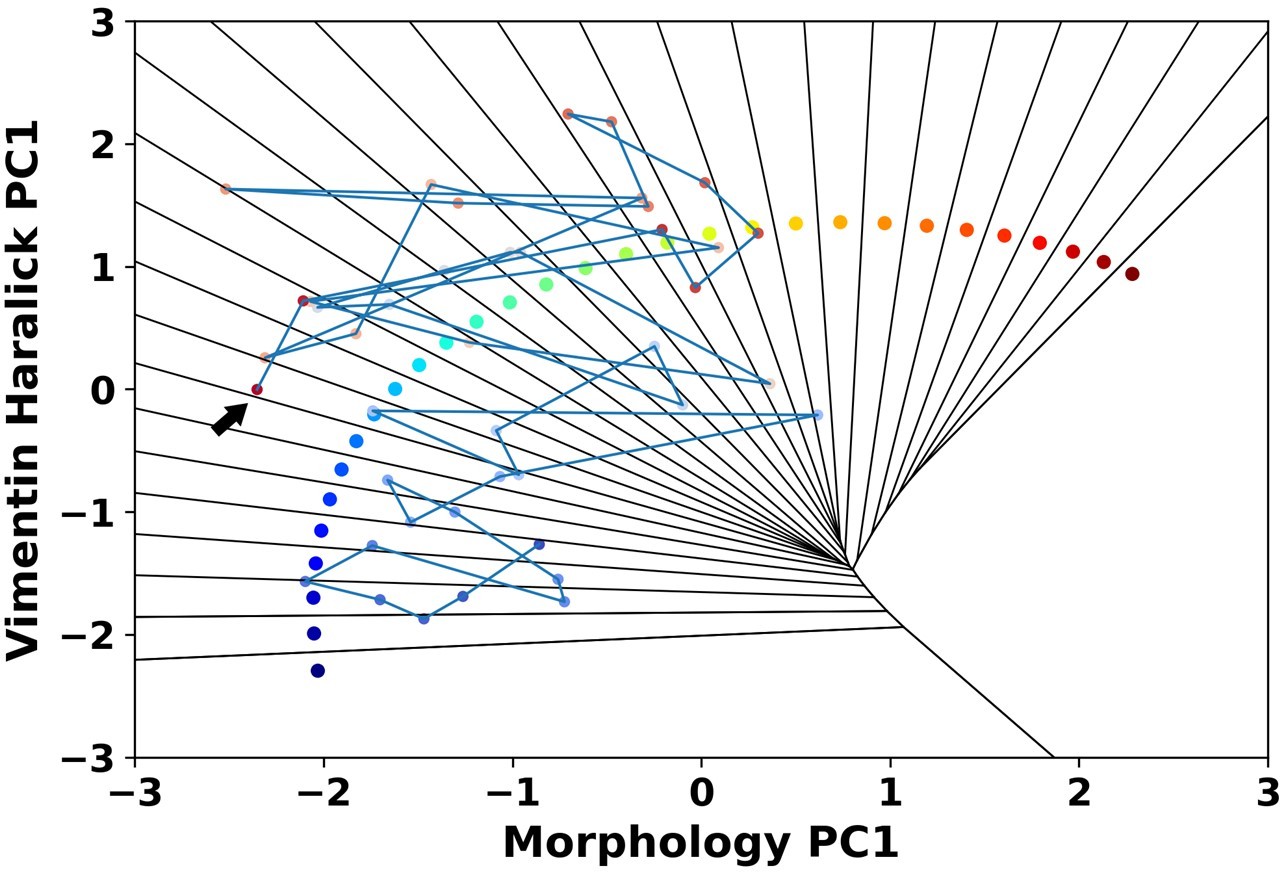
Reaction coordinate reconstruction of two parallel paths from reactive A549/Vim-RFP EMT trajectory ensemble with a modified string method.
(a) Discrete representation of a 1-D reaction coordinate (i.e. image points, represented as colored dots) on the filled contour map with corresponding Voronoi cells. The cyan line is a reactive trajectory that starts from A and ends in B. (b) Reconstructed RCs from reactive single cell EMT trajectories using a revised finite temperature string method. Single cell images represent typical cell states in their locations (Epithelial state, mesenchymal state, in mid-transition with vimentin varies first and in mid-transition with concerted variation) (c) Separate representation of the RCs overlaid with representative reactive single-cell trajectories. Top: vimentin varies first; Bottom: concerted variation. For visual clarity, the trajectories were plotted with data points separated by 50 min. (d) Cell shape (left), Haralick feature (right) along RC s1. The colors of the cell shapes in b/c left represent progression of EMT (starts from blue and ends in red). Haralick feature 1: Angular Second Moment; 2: Contrast; 3: Correlation; 4: Sum of Squares: Variance; 5: Inverse Difference Moment; 6: Sum Average; 7: Sum Variance; 8: Sum Entropy; 9: Entropy; 10: Difference Variance; 11: Difference Entropy; 12: Information Measure of Correlation 1; 13: Information Measure of Correlation 2. (e) Similar to panel e but along RC s2.
Figure 4—figure supplement 1
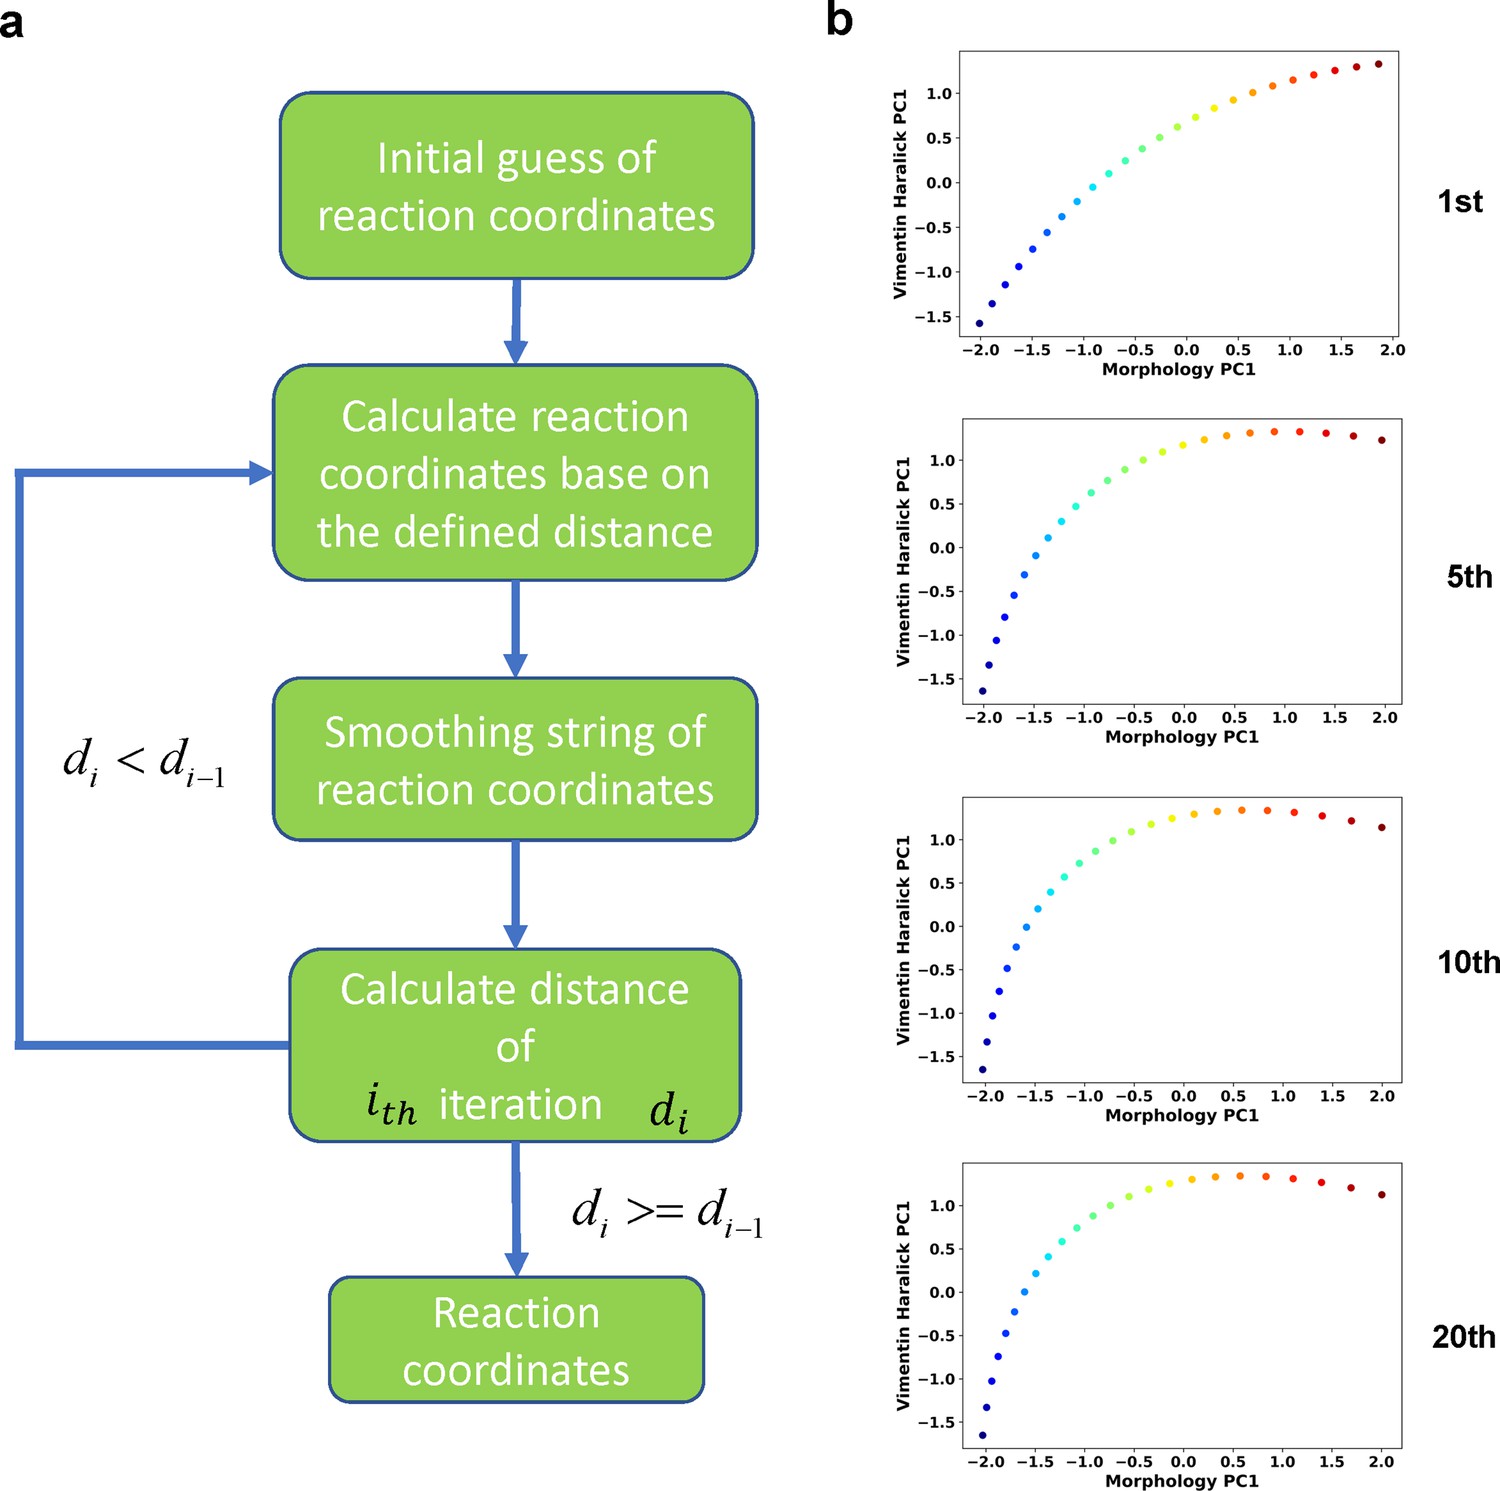
Iterative procedure of the finite temperature string method.
(a) Flow chart of the procedure. (b) Example RC curves obtained at different iteration cycles.
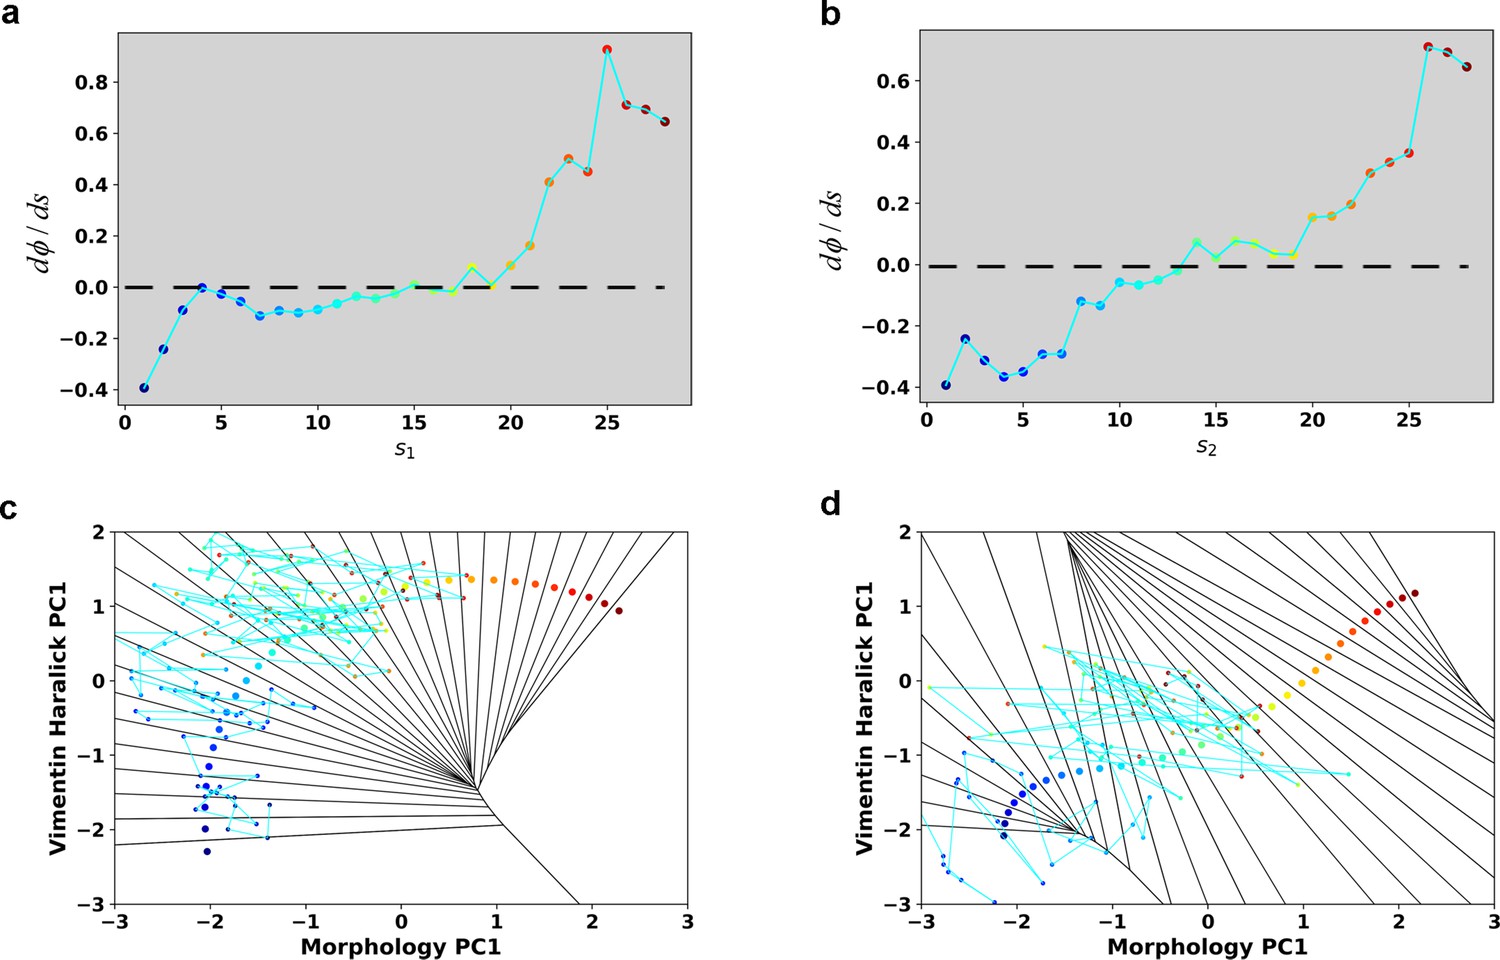
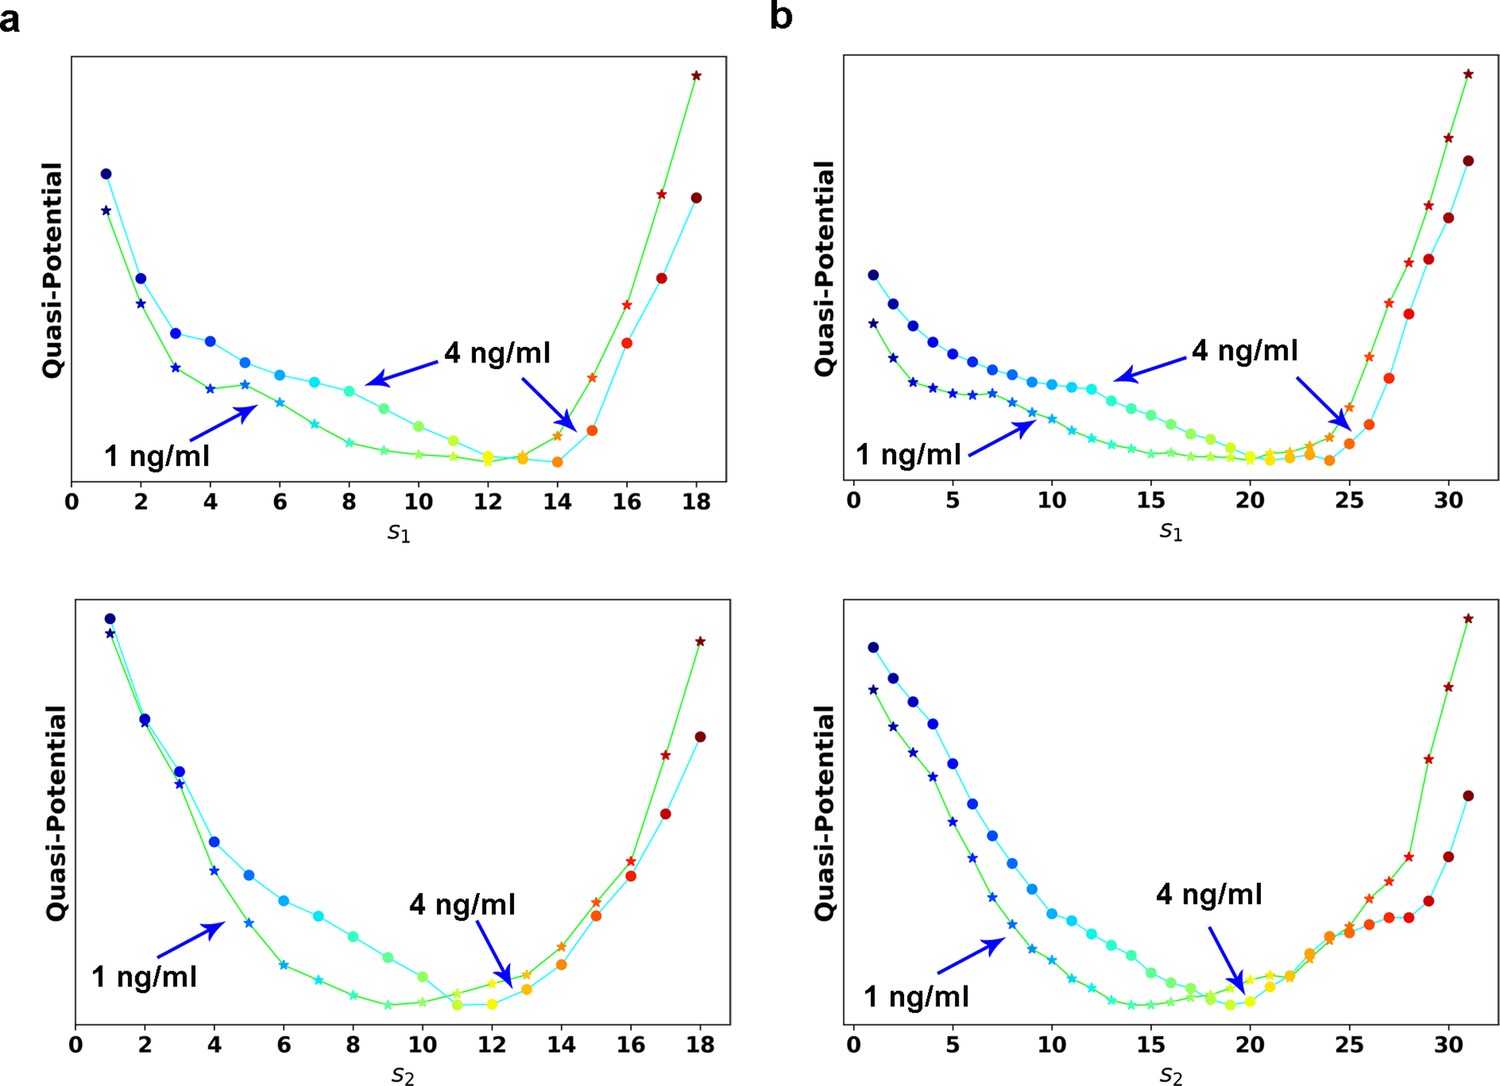
Figure 5 with 7 supplements
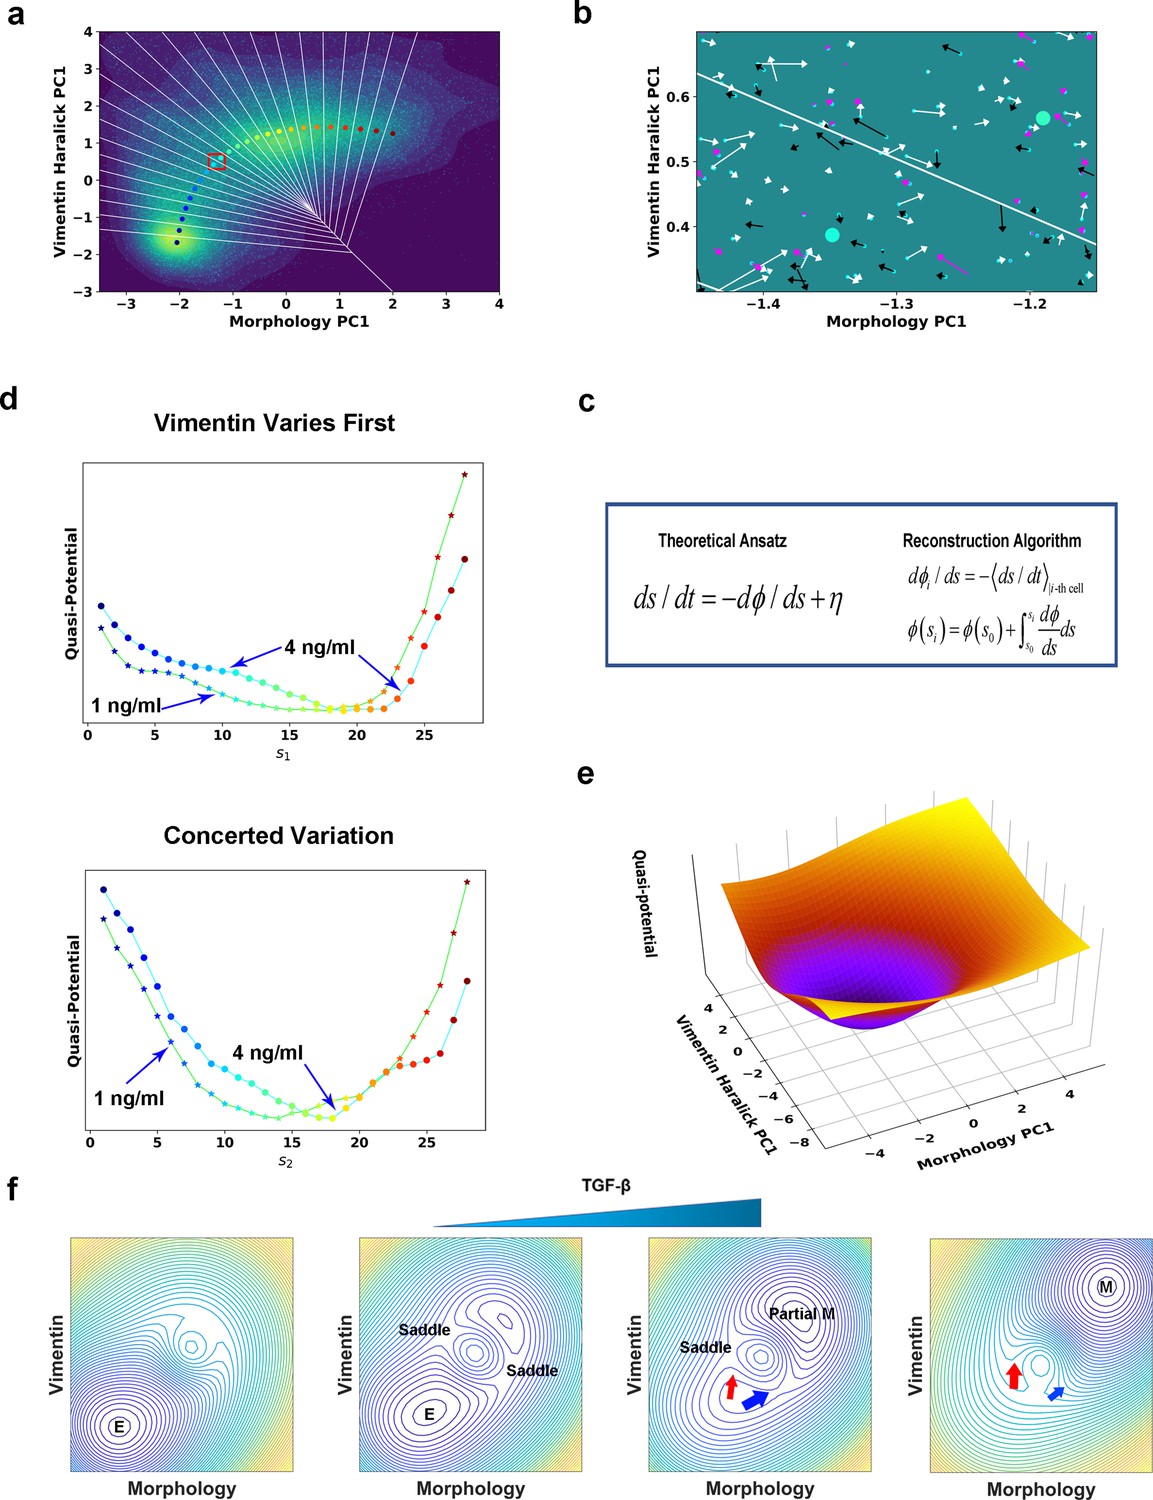
Quantification of dynamics along the two RCs suggests a mechanism of forming two EMT paths through sequential saddle-node collisions.
(a) Reconstructed RC s1 on density plot of single cell trajectories data. Cyan dots are single cell data points. (b) Enlarged view of the red box region in (a). The arrow associated with each data point (cyan dot) represents the value of ds/dt (white: > 0, magenta: = 0, black: < 0). (c) Theoretical framework of dynamics reconstruction along the RC. (d) Comparison of reconstructed quasi-potentials along the RC with 1 ng/ml (star) and 4 ng/ml (circle) TGF-β treatment. Top: Reconstructed quasi-potentials along RC s1. Bottom: Reconstructed quasi-potentials along RC s2. (e) Quasi-potential of the control cells based on kernel density estimation. (f) A metaphorical potential system to illustrate a plausible mechanism for generating the two paths through sequential collision between a stable attractor and two saddle points when the concentration of TGF-β increases. The width of the arrows represents the probabilities that single-cell trajectories follow corresponding paths. E: epithelial attractor; Partial M: partial EMT attractor; M: mesenchymal attractor.
Figure 5—figure supplement 1
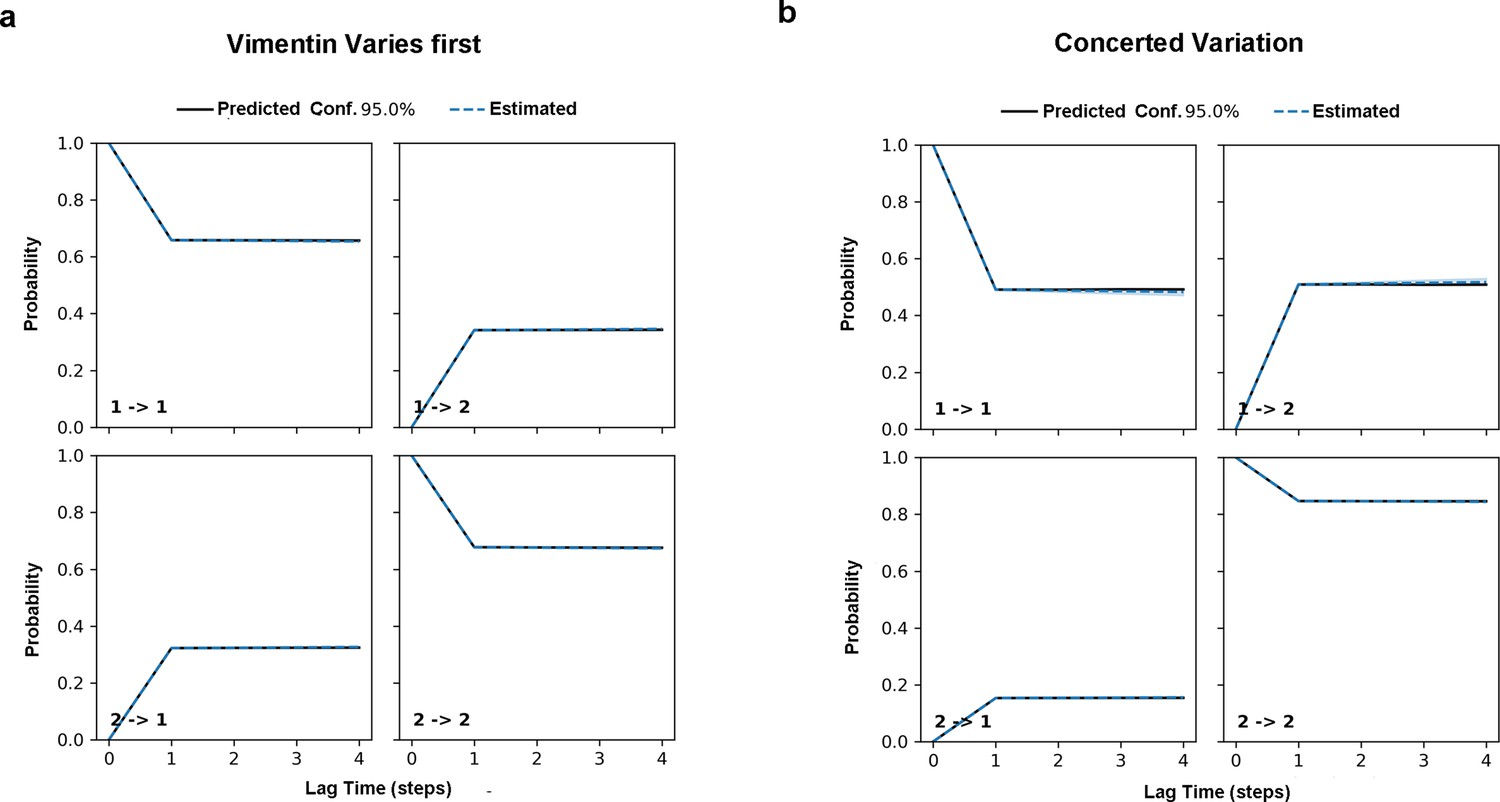
Chapman-Kolmogorow test on the RC s1 (a) and s2 (b).
Black solid lines are model predictions estimated from one-step time lag. Blue dashed lines are the estimations from larger steps of time lag. The shading blue region is the region with 95% confidence.
Figure 5—figure supplement 2
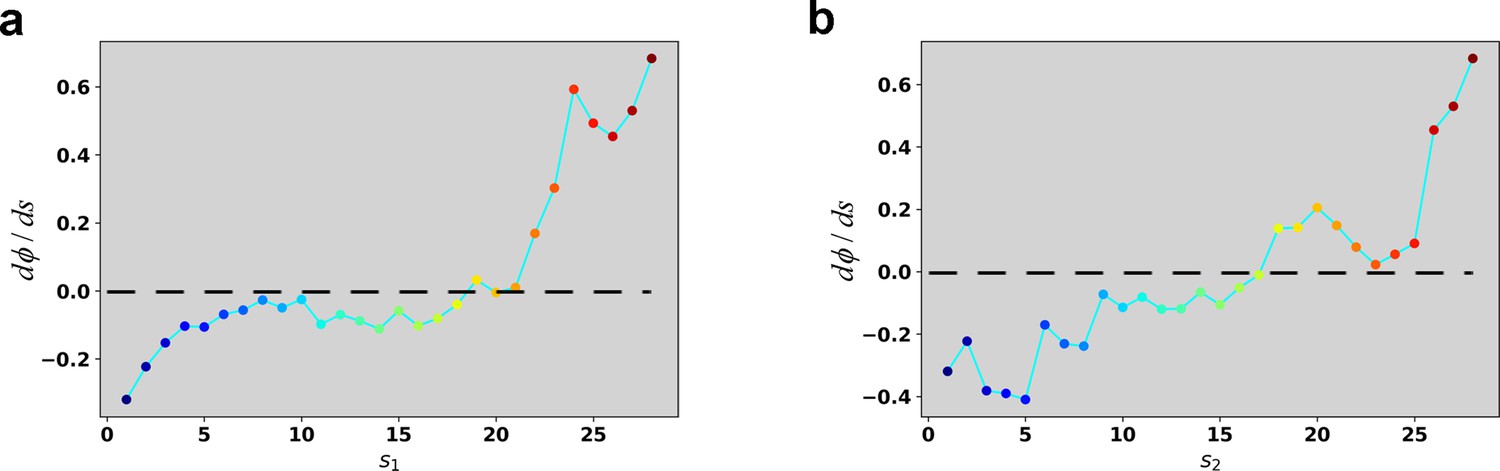
Reconstructed dΦ/ds along the RC in the case of 4 ng/ml TGF-β treatment.
(a) Reconstructed dΦ/ds along the RC s1. (b) Reconstructed dΦ/ds along the RC s2.
Figure 5—figure supplement 3
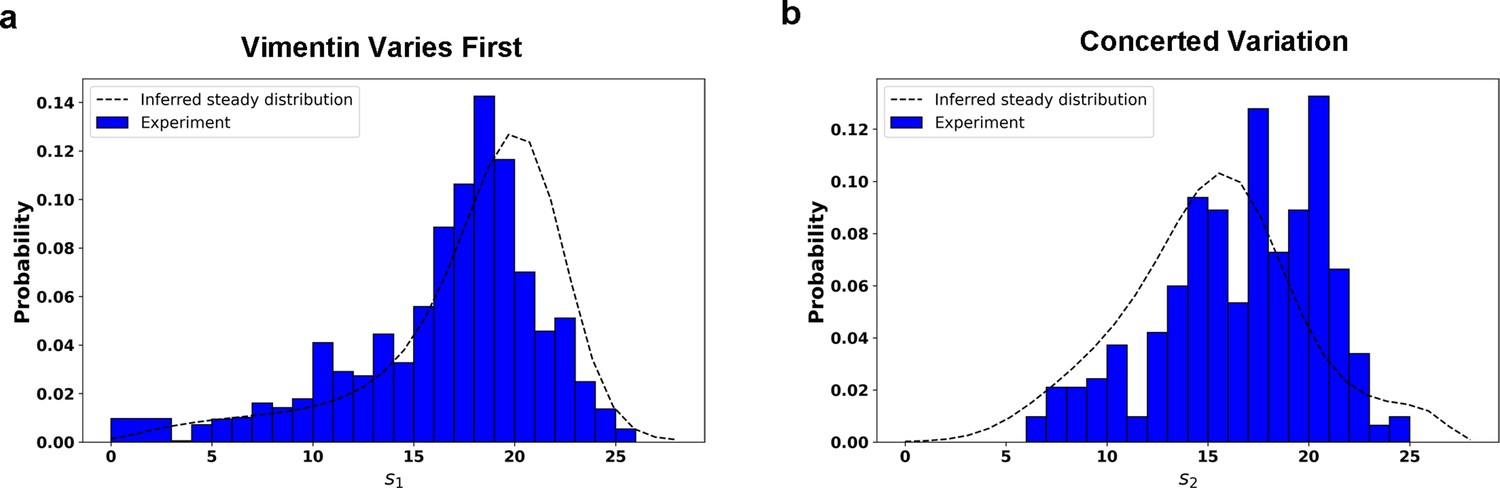
Comparison between the predicted steady distribution of RC values from reconstructed potential and experiment data.
Along the RC s1 (a) and the RC s2 (b). The effective temperature value in calculation is set as .
Figure 5—figure supplement 4
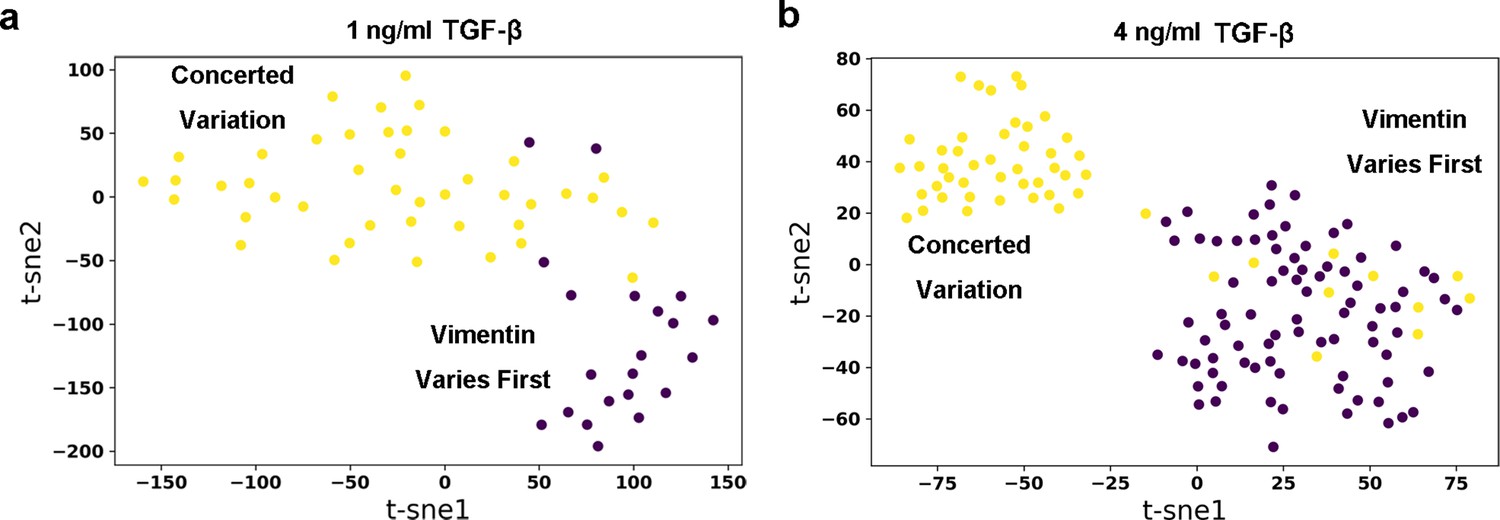
Embedding of dynamics time warping (DTW) distance matrix of reactive trajectories under 1 ng/ml (a) and 4 ng/ml (b) TGF-β treatment with t-SNE.
Each dot represents a reactive trajectory. The colors of dots represent different clusters they belong to: Brown, vimentin varies first; Yellow, Concerted variation.
Figure 5—figure supplement 5
Additional analyses of trajectories with 1 ng/ml TGF-β treatment.
(a) Reconstructed dϕ/ds along the RC s1 in the case of 1 ng/ml TGF-β treatment (b) Reconstructed dϕ/ds along the RC s2 in the case of 1 ng/ml TGF-β treatment. (c) Typical single cell trajectories treated with 1 ng/ml TGF-β along RC s1 (d) Typical single-cell trajectories treated with 1 ng/ml TGF-β along RC s2.
Figure 5—figure supplement 6
Reconstructed potentials of different numbers of points in the reaction coordinates Comparison of reconstructed quasi-potentials along the RC with 1 ng/ml (star, lime colored line) and 4 ng/ml (circle, cyan colored line) TGF-β treatment.
Top: Reconstructed quasi-potentials along RC s1. Bottom: Reconstructed quasi-potentials along RC s2. (a) The number of image points is 20. (b) The number of image points is 33.
Figure 5—figure supplement 7
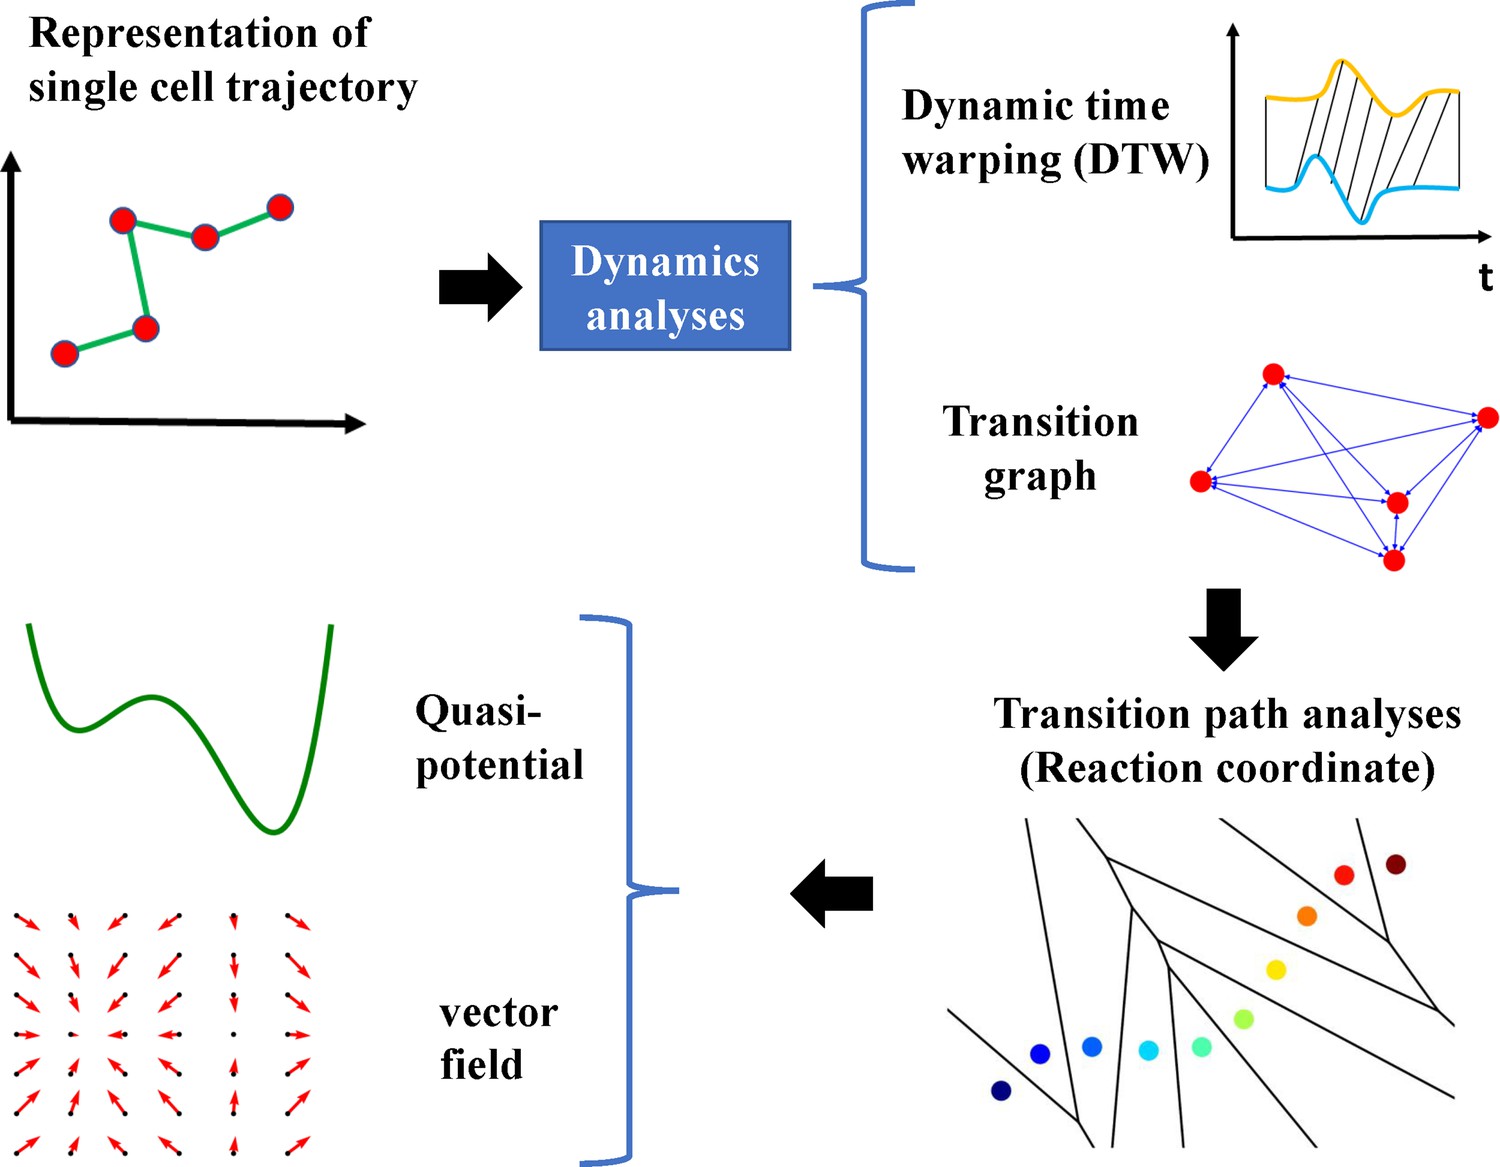
Pipeline of singe-cell trajectory analyses.
Author response image 1
Transition path analyses of single cell trajectories along the RCs obtained from 1 and 4 ng/ml trajectories, respectively.
(a) RCs in the 2-D state space plane. (b) Quasi-potentials of 1 ng/ml trajectories reconstructed along the 1 ng/ml RCs. Left: Vimentin varies first. Right: Concerted variation.
Author response image 2
A representative reactive trajectory which transits back into the epithelial region.
The arrow indicates the end point.
Author response image 3
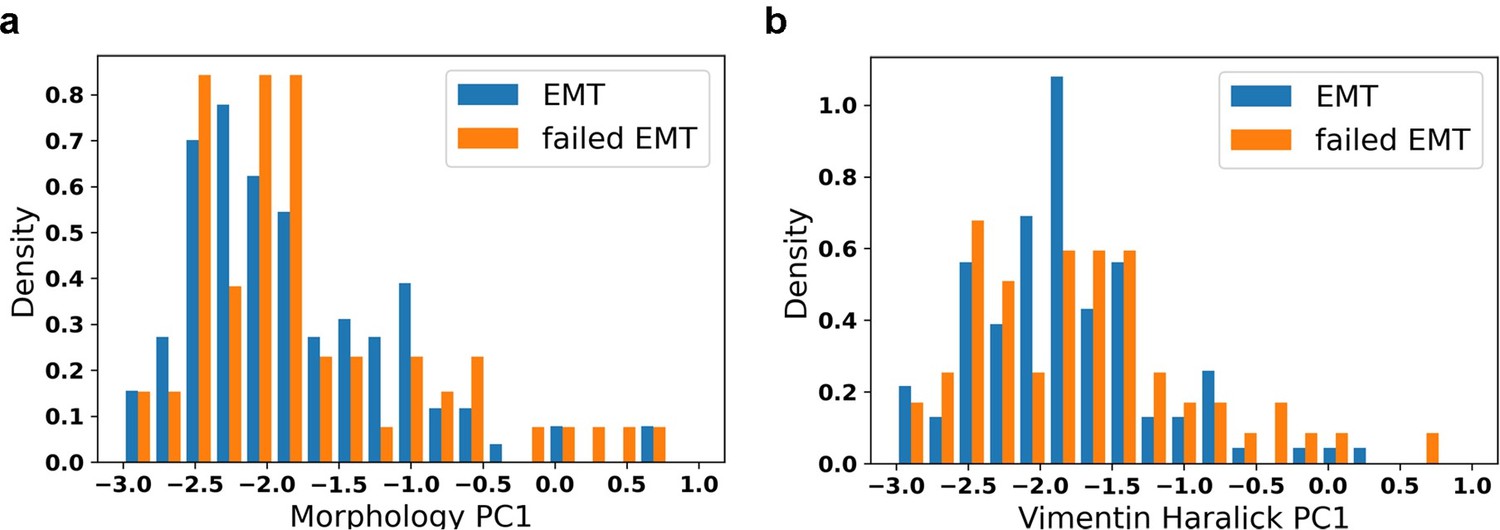
Distribution of initial values of EMT trajectory and failed EMT trajectory.
a: Distribution of initial morphology PC1; b: Distribution of initial vimentin Haralick PC1.
Author response image 4
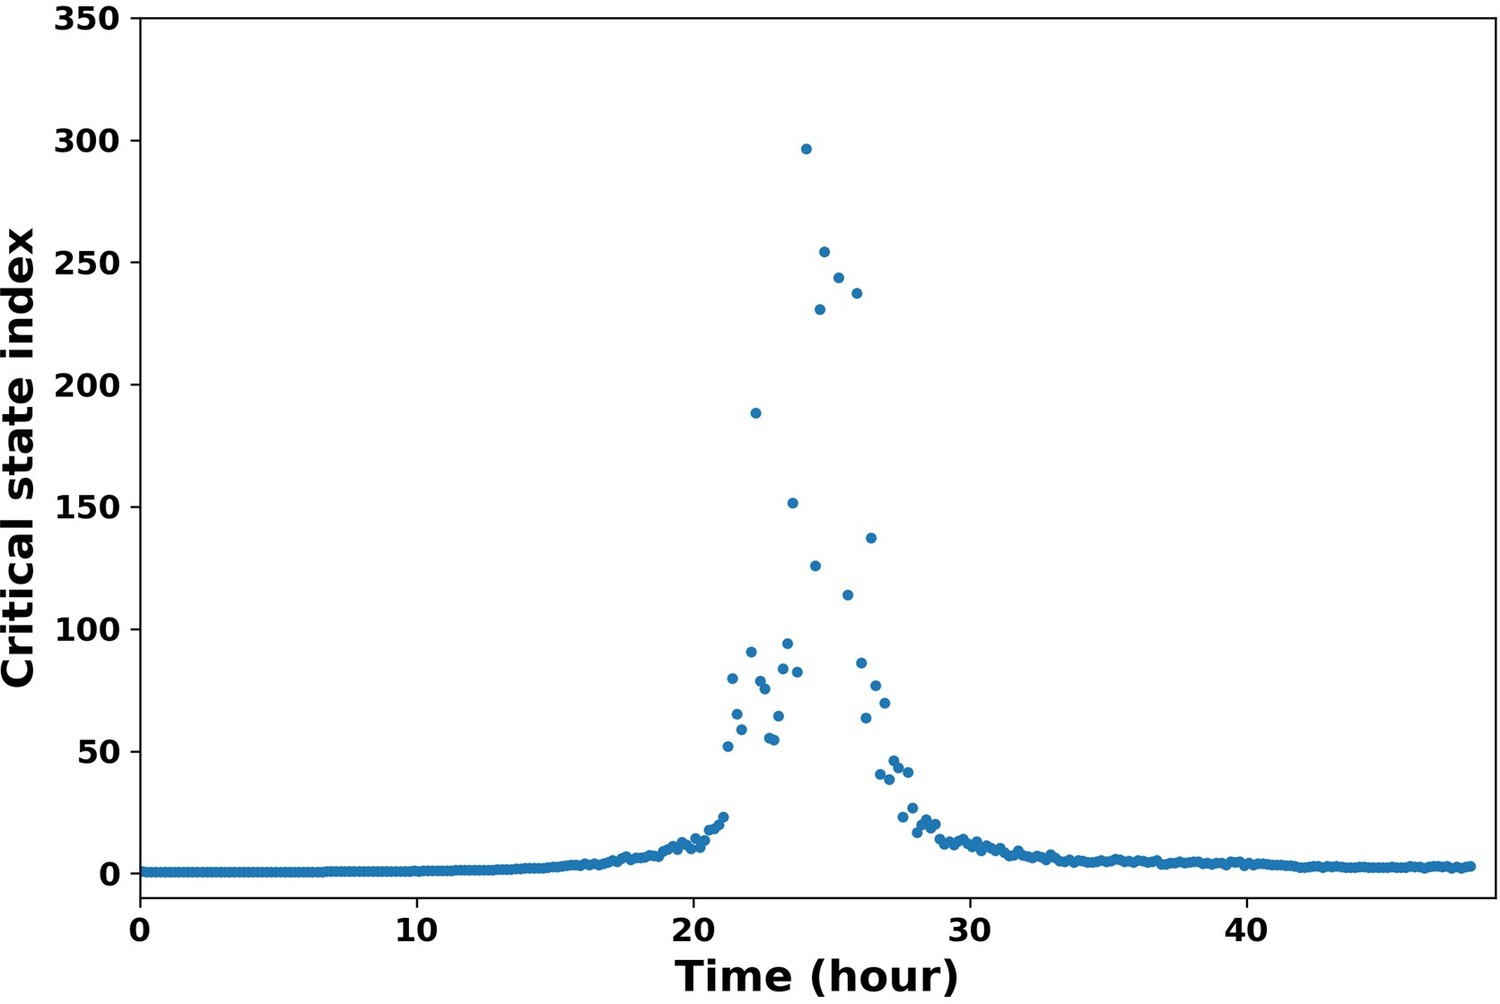
Critical state index along time.
The critical state index shows a peak around 24 hour, which indicates the transition from epithelial state to mesenchymal state.
Videos
Video 1
Recorded live cell trajectory in Figure 2e.
Each frame is a segmented cell mask cropped from the original vimentin fluorescence image.
Video 2
A metaphorical potential system illustrating how TGF-β treatment modifies the cell dynamics.
Tables
Key resources table
| Reagent type (species) or resource | Designation | Source or reference | Identifiers | Additional information |
|---|---|---|---|---|
| Cell line (Homo sapiens, human) | A-549 VIM RFP | American Type Culture Collection(ATCC) | Cat# CCL-185EMTRRID:SCR_007358 | |
| Peptide, recombinant protein | TGF-β (Recombinant Human TGF-beta 1 Protein) | R&D Systems | Cat#240-B | |
| Software, algorithm | CellProfiler | Broad Institute | RRID:SCR_007358 | |
| Software, algorithm | Scipy | PMID:32015543 | RRID:SCR_008058 | https://scipy.org/ |
Additional files
Download links
A two-part list of links to download the article, or parts of the article, in various formats.
Downloads (link to download the article as PDF)
Open citations (links to open the citations from this article in various online reference manager services)
Cite this article (links to download the citations from this article in formats compatible with various reference manager tools)
Epithelial-to-mesenchymal transition proceeds through directional destabilization of multidimensional attractor
eLife 11:e74866.
https://doi.org/10.7554/eLife.74866


