Conscious processing of global and local auditory irregularities causes differentiated heartbeat-evoked responses
- Laboratoire de Neurosciences Cognitives et Computationnelles, Département d’Etudes Cognitives, École Normale Supérieure, INSERM, Université PSL, France
- Sorbonne Université, Paris Brain Institute (ICM), INRIA, CNRS, INSERM, AP-HP, Hôpital Pitié-Salpêtrière, France
- Institute of Neuroscience and Medicine (INM-7: Brain and Behaviour), Forschungszentrum Jülich, Germany
- Institute of Systems Neuroscience, Heinrich Heine University Düsseldorf, Germany
- AP-HP, Hôpital de la Pitié Salpêtrière, Neuro ICU, DMU Neurosciences, France
- Pitié-Salpêtrière Faculty of Medicine, Pierre and Marie Curie University, Sorbonne Universities, France
- INSERM, National Institute of Health and Medical Research, France
- Department of Neurology, Pitié-Salpêtrière Hospital Group, Public Hospital Network of Paris, France
- Department of Neurophysiology, Pitié-Salpêtrière Hospital Group, Public Hospital Network of Paris, France
Figures
Figure 1
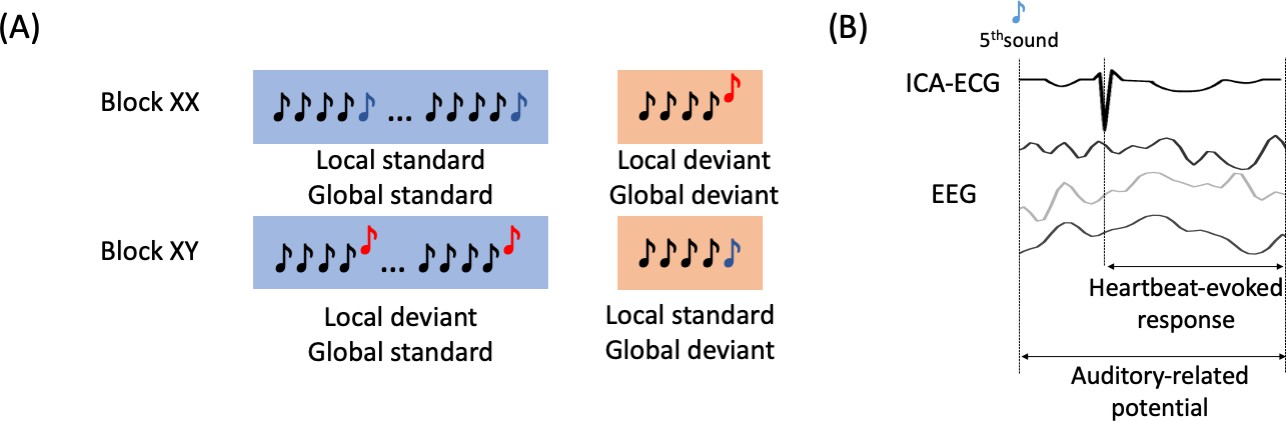
Experimental description and EEG analysis.
(A) Local-global paradigm. (B) Heartbeat-evoked response defined by the R-peaks that follow the 5th sound from all the trials, and the Auditory-related potential defined by the EEG activity locked to the stimuli.
Figure 2
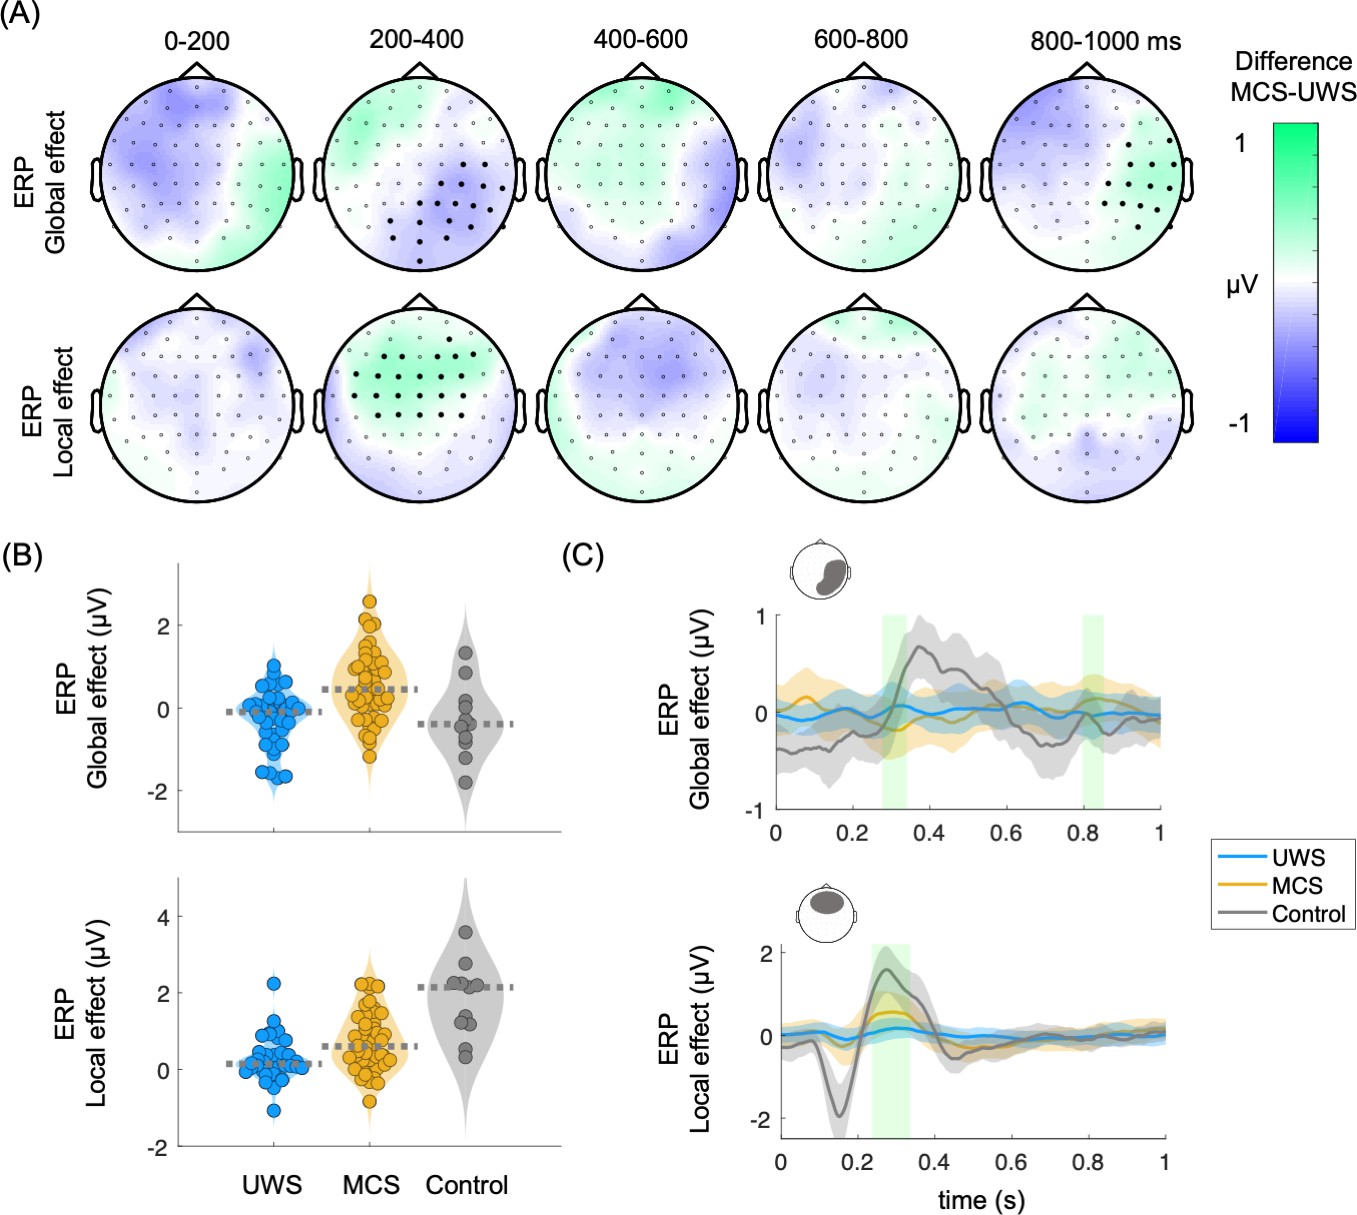
Auditory event-related potentials (ERPs) in the global and local effects.
(A) Scalp topographies indicate the average group differences between MCS and UWS patients. Thick electrodes indicate a clustered effect (Monte Carlo p<0.05). (B) Average of the clustered effects per patient, in the ERP global effect (main positive cluster: p=0.0001, Z=3.684, latency = 800–850 ms; main negative cluster: p=0.0013, Z=–3.1905, latency = 280–336 ms), and ERP local effect (main positive cluster: p=0.0011, Z=3.4416, latency = 236–328 ms). Healthy controls are displayed as a reference. Dashed lines indicate the group median (C) Time course of the group median among UWS, MCS, and control groups. The displayed time course corresponds to the scalp area marked above the corresponding plot. Shaded green areas indicate the segments in which a clustered effect was found when comparing MCS and UWS groups. ERPs: auditory event-related potentials, MCS: minimally conscious state, UWS: unresponsive wakefulness syndrome.
Figure 3
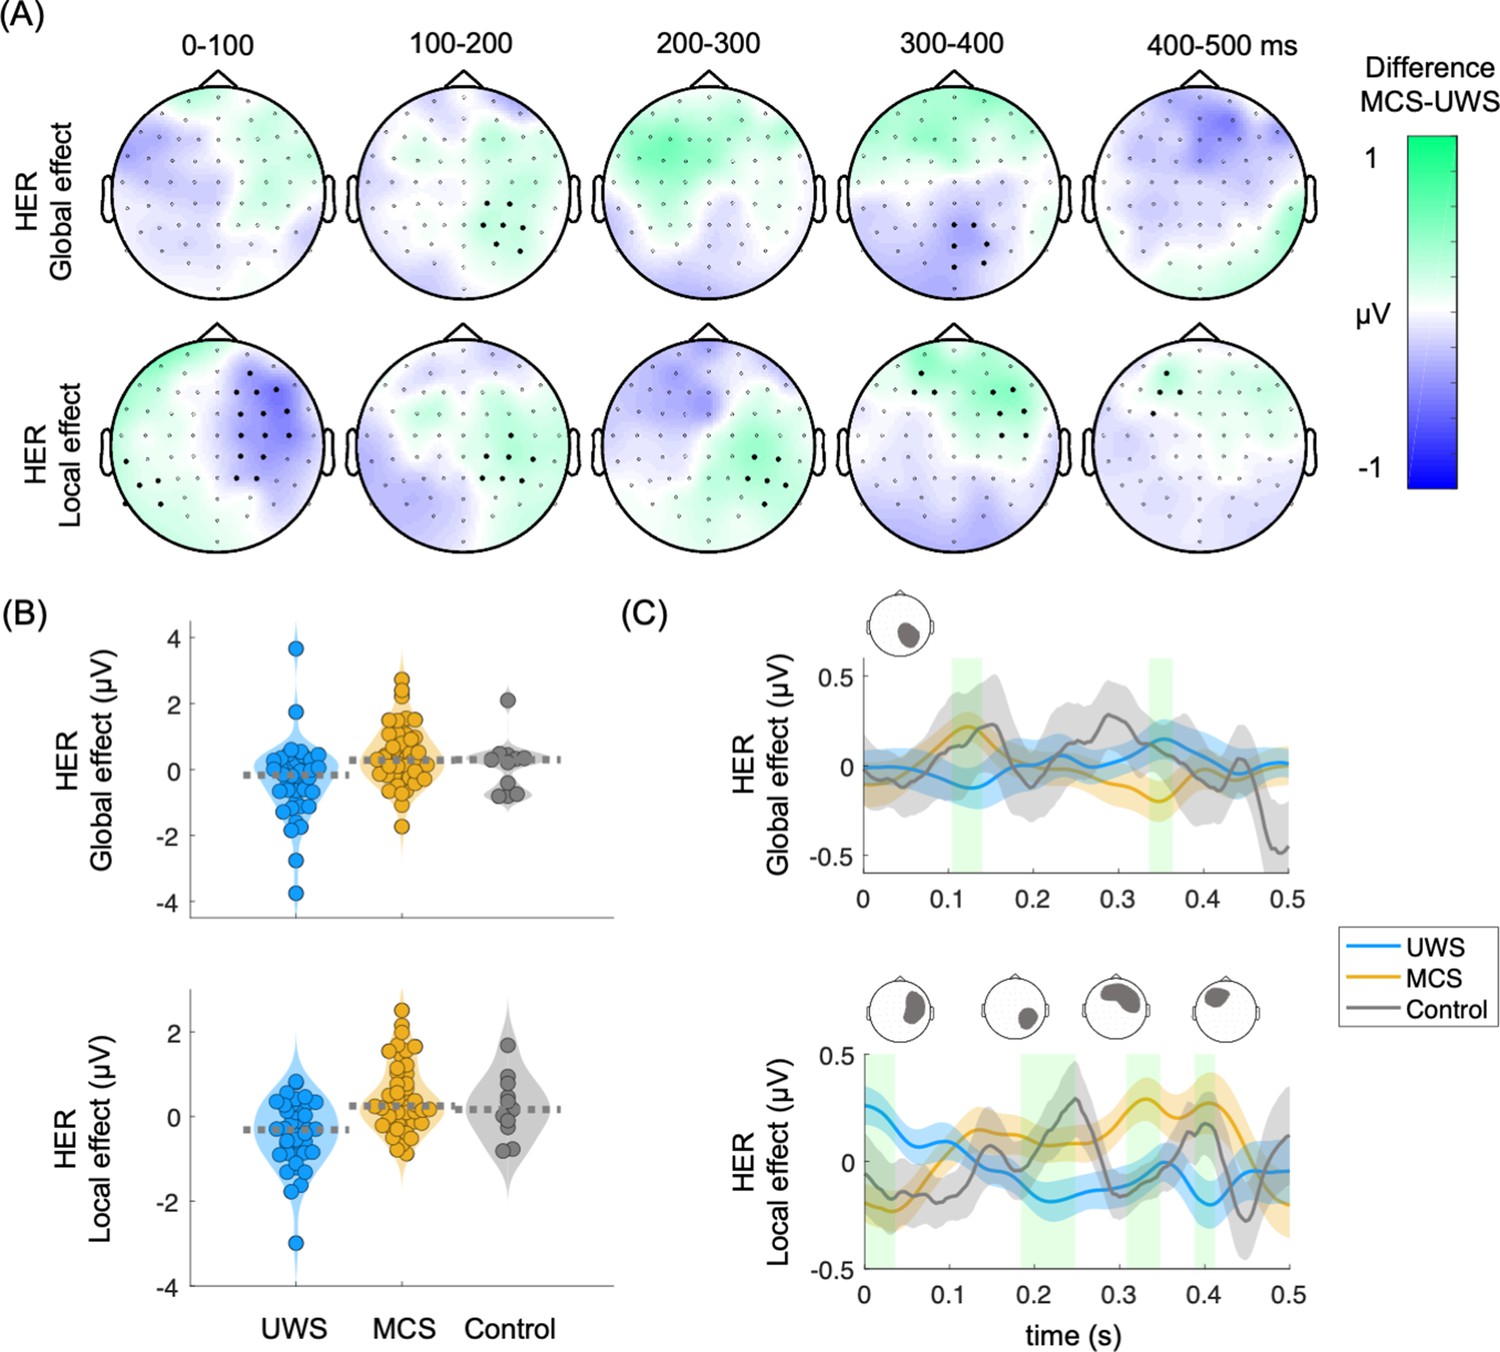
Heartbeat-evoked responses (HERs) in the global and local effects.
(A) Scalp topographies indicate the average group differences between MCS and UWS patients. Thick electrodes indicate a clustered effect (Monte Carlo p<0.05). (B) Average of the clustered effects per patient, in the HER global effect (main positive cluster: p=0.0037, Z=3.0173, latency = 112–130 ms; main negative cluster: p=0.0058, Z=–3.0173, latency = 340–360 ms) and HER local effect (main positive cluster: p=0.0029, Z=3.0606, latency = 400–412 ms; main negative cluster: p=0.0014, Z=–3.3983, latency = 0–40 ms). Healthy controls are displayed as a reference. Dashed lines indicate the group median (C) Time course of the group median among UWS, MCS, and control groups. The displayed time course corresponds to the scalp area marked above the corresponding plot. Shaded green areas indicate the segments in which a clustered effect was found when comparing MCS and UWS groups. HERs: heartbeat-evoked responses, MCS: minimally conscious state, UWS: unresponsive wakefulness syndrome.
Figure 4
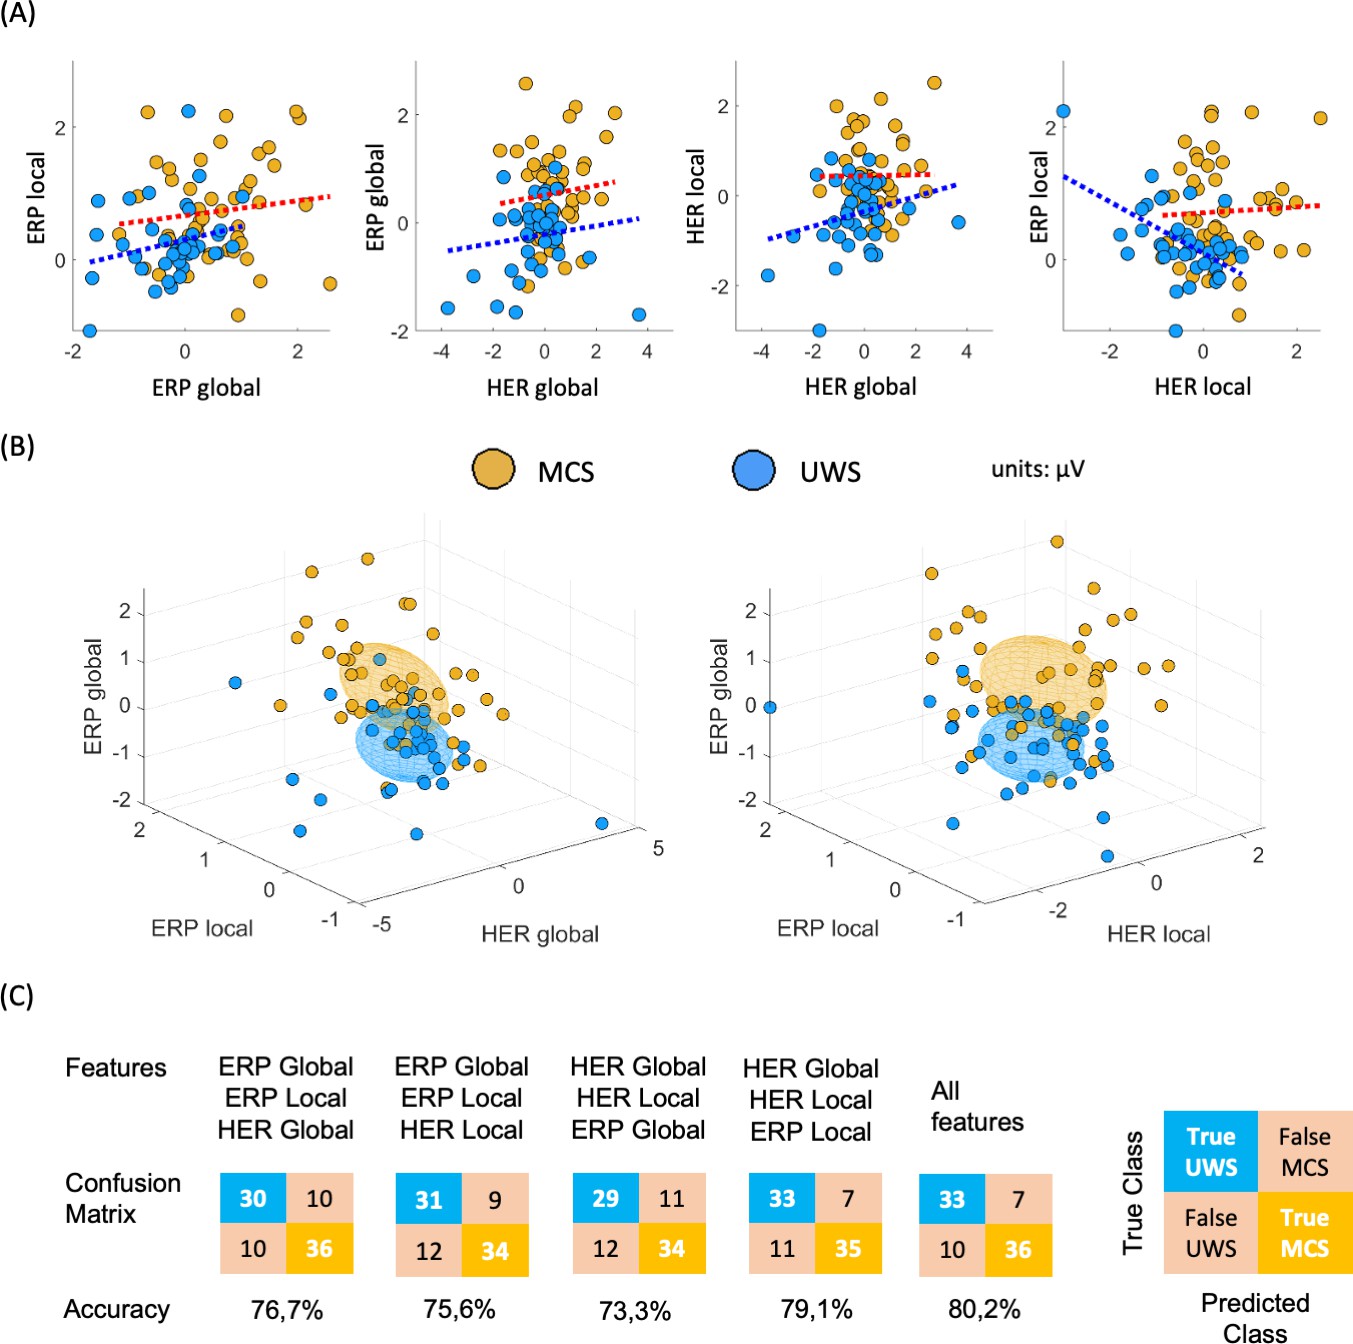
Multi-dimensional analysis of the clustered effects found when comparing MCS and UWS patients.
(A) Pairwise comparison between all possible combinations for ERPs and HERs, for local and global effects. Individual points corresponding to a single patient, and dotted line indicates the trend, separately per diagnosis. (B) Three-dimensional representation of the clustered effects: left panel for ERP global, ERP local, and HER global; and right panel for ERP global, ERP local, and HER local. Each ellipsoid was constructed per diagnostic group, centered in the group means with a ratio defined by the standard deviations, for the respective dimensions. (C) Confusion matrices depicting the classification results of MCS and UWS patients using a linear discriminant classifier in a fivefold cross-validation. The classifiers were trained using all possible combinations of feature triads, as well as all four features. HERs: heartbeat-evoked responses, ERPs: auditory event-related potentials, MCS: minimally conscious state, UWS: unresponsive wakefulness syndrome.
Figure 5
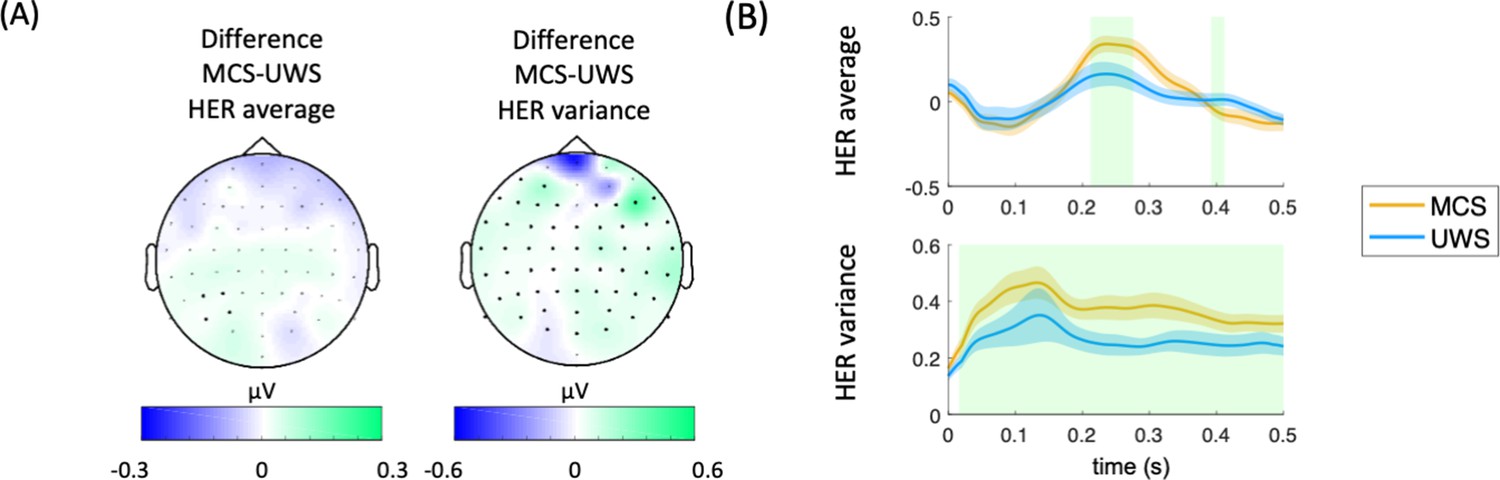
Results on HER average and HER variance for the whole protocol.
(A) HER scalp topographies of the differences between MCS and UWS patients. Thick electrodes show significant differences after cluster permutation. (B) HER variance in MCS and UWS patients in the significant cluster. Shaded green areas indicate the segments in which a clustered effect was found when comparing MCS and UWS groups. HERs: heartbeat-evoked responses, MCS: minimally conscious state, UWS: unresponsive wakefulness syndrome.
Tables
Table 1
Wilcoxon sign test performed separately for MCS and UWS patients, to test whether the global and local effects as measured from HERs and ERPs come from a distribution with median different to zero.
Bold indicates significance reached at α=0.05/8=0.0063, according to Bonferroni correction for multiple comparisons.
| Patients | HERs | ERPs | ||
|---|---|---|---|---|
| Global effect | Local effect | Global effect | Local effect | |
| MCS | Z=2.7805 p=0.0054 | Z=3.2175 p=0.0013 | Z=3.7529 p=0.0002 | Z=5.0311 p<0.0001 |
| UWS | Z=–1.9759 p=0.0482 | Z=–2.9840 p=0.0028 | Z=–1.9624 p=0.0497 | Z=2.9033 p=0.0037 |
-
HERs: heartbeat-evoked responses, ERPs: auditory event-related potentials, MCS: minimally conscious state, UWS: unresponsive wakefulness syndrome.
Table 2
Group-wise Spearman correlation analysis performed separately for MCS and UWS patients, between the combined clustered effects found when comparing MCS vs UWS in the ERP global effect, ERP local effect, HER global effect, and HER local effect.
Significance was set at α=0.05/8=0.0063, according to Bonferroni correction for multiple comparisons.
| MCS | UWS | |
|---|---|---|
| ERP global vs ERP local | R=0.1077 p=0.4748 | R=0.3099 p=0.0591 |
| HER global vs ERP global | R=0.0575 p=0.7033 | R=0.1580 p=0.3290 |
| HER global vs HER local | R=–0.1193 p=0.4283 | R=0.1480 p=0.3607 |
| HER local vs ERP local | R=–0.0436 p=0.7730 | R=–0.4114 p=0.0088 |
-
HER: heartbeat-evoked response, ERP: auditory event-related potential, MCS: minimally conscious state, UWS: unresponsive wakefulness syndrome.
Additional files
Download links
A two-part list of links to download the article, or parts of the article, in various formats.
Downloads (link to download the article as PDF)
Open citations (links to open the citations from this article in various online reference manager services)
Cite this article (links to download the citations from this article in formats compatible with various reference manager tools)
Conscious processing of global and local auditory irregularities causes differentiated heartbeat-evoked responses
eLife 12:e75352.
https://doi.org/10.7554/eLife.75352


