The role of surface adhesion on the macroscopic wrinkling of biofilms
- Laboratory for Soft Materials, Department of Materials, ETH Zurich, Switzerland
- Department of Civil, Environmental and Geomatic Engineering, ETH Zurich, Switzerland
Figures
Figure 1 with 1 supplement
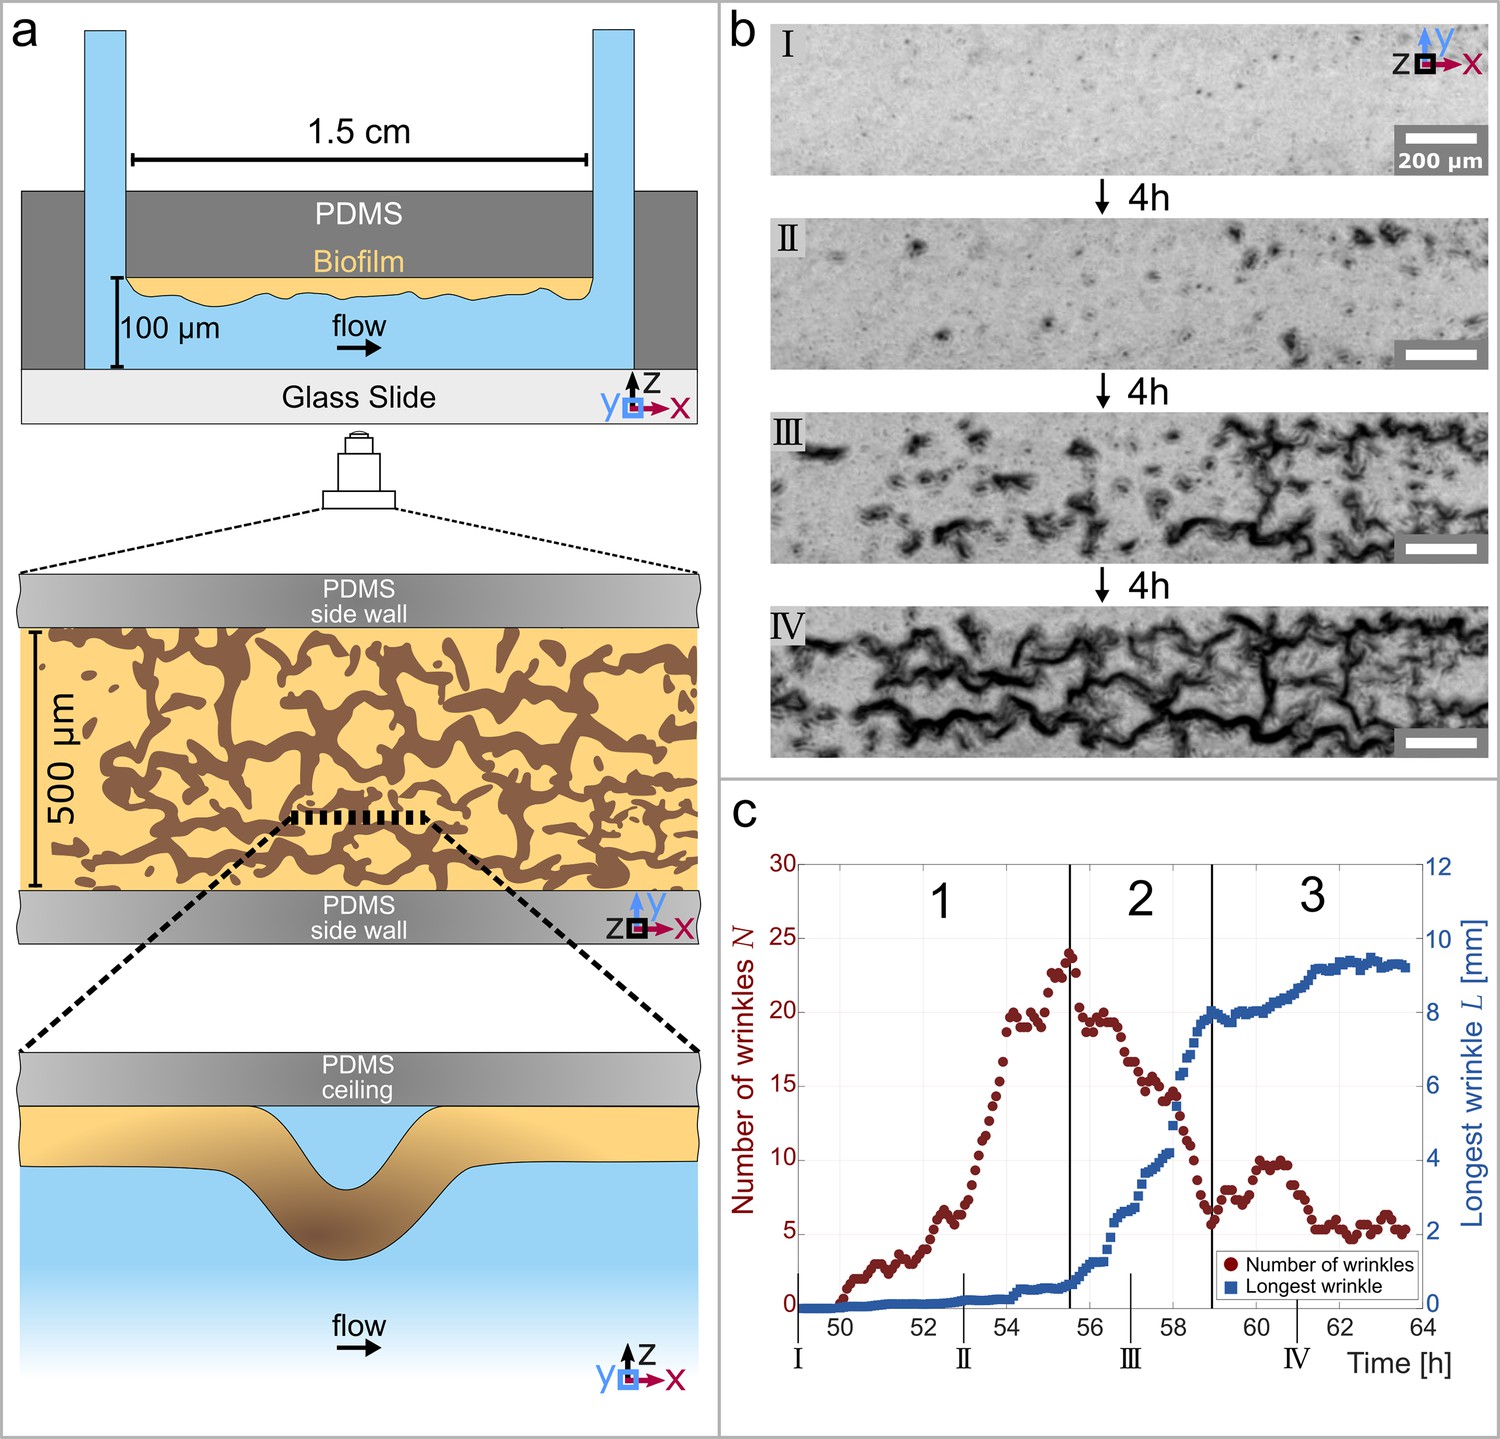
Temporal and structural evolution of wrinkles in P. aeruginosa PAO1 biofilms grown in flow.
(a) Schematic representations of the microfluidic device, the wrinkle network in the biofilm and a side view of a single wrinkle. (b) Time evolution of the wrinkled structure in the biofilm. Images were taken in phase contrast. (c) Number of individual wrinkles, (red) and the length of the longest connected wrinkle (in , blue). The evolution of the wrinkled biofilm can be divided into three distinct stages. Many small, isolated wrinkles appear in the first stage. The wrinkles connect to form a network in the second stage. In the third stage, the biofilm has reached a steady state.
Figure 1—video 1
Timelapse video of the wrinkle formation from a flat biofilm to the completely develop wrinkle network.
The video shows the biofilm development over 15 hr.
Figure 2
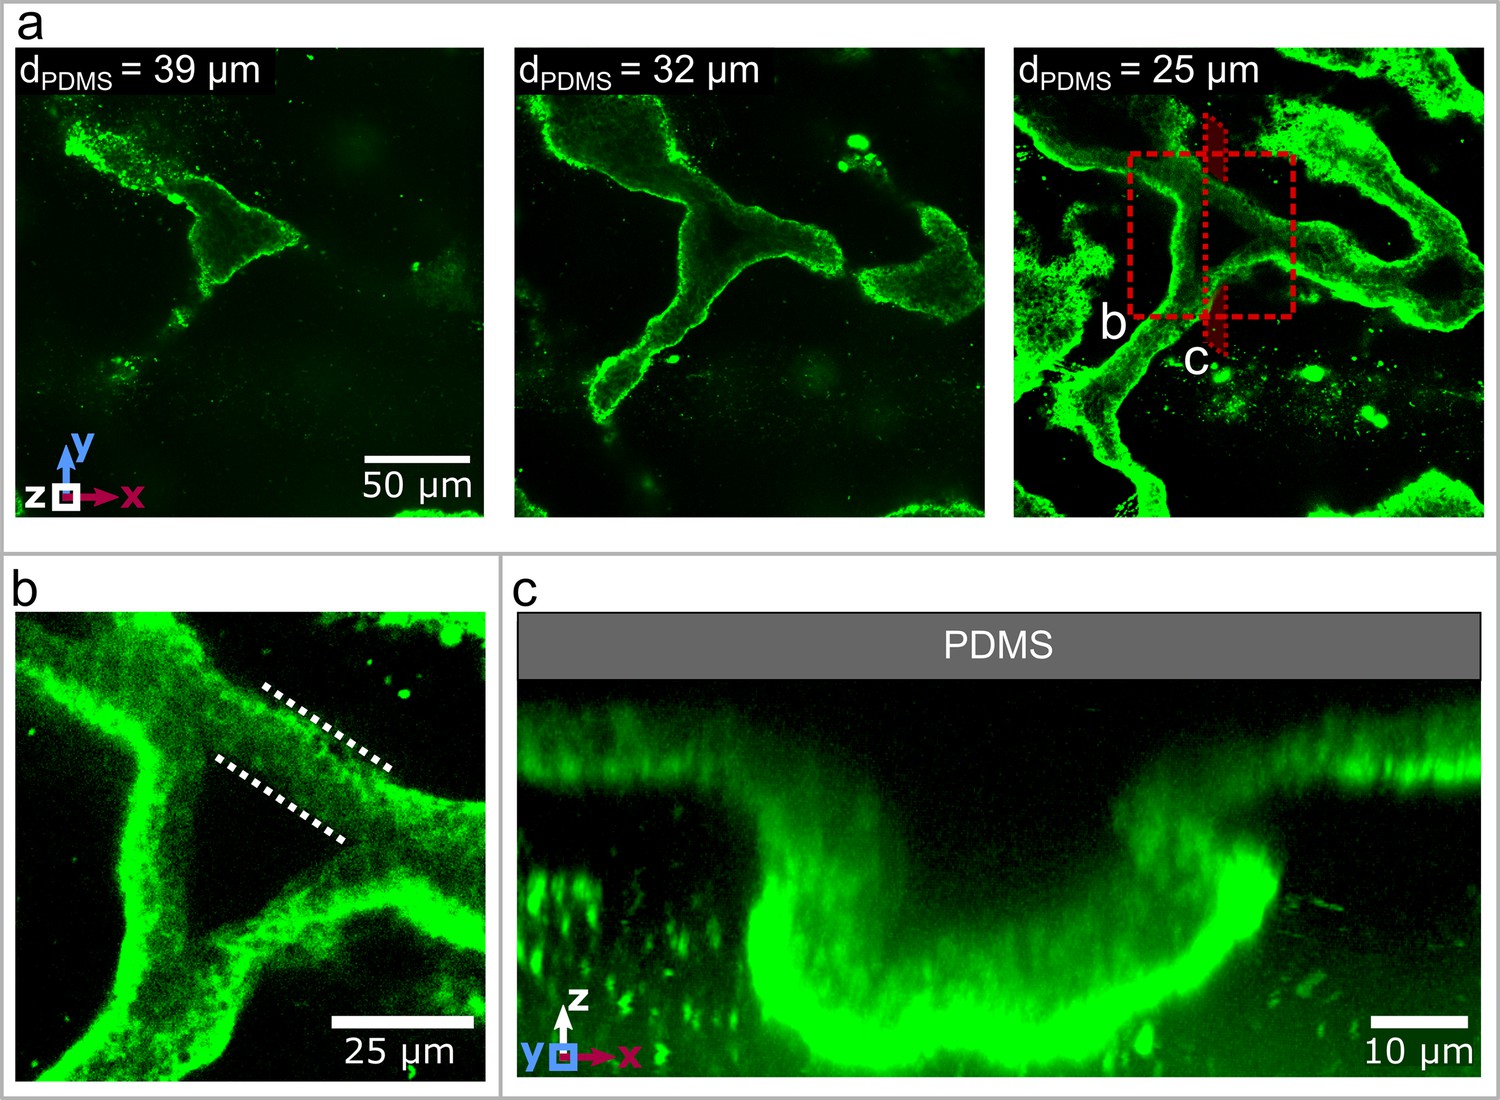
Three dimensional structure of the biofilm wrinkles.
(a) Laser-scanning confocal microscopy images of a biofilm that developed a channel network, stained with a GFP-labelled Concanavalin A lectin stain. The three images show slices in the x-y-plane, starting away from the PDMS surface. The second image is taken and the third image away from the PDMS substrate. (b) Close up of the biofilm channel shown in panel (a). The white, dotted lines indicate the walls of the biofilm channel. (c) Cross-section and close up of a channel along the cutting plane indicated in panel (a).
Figure 3
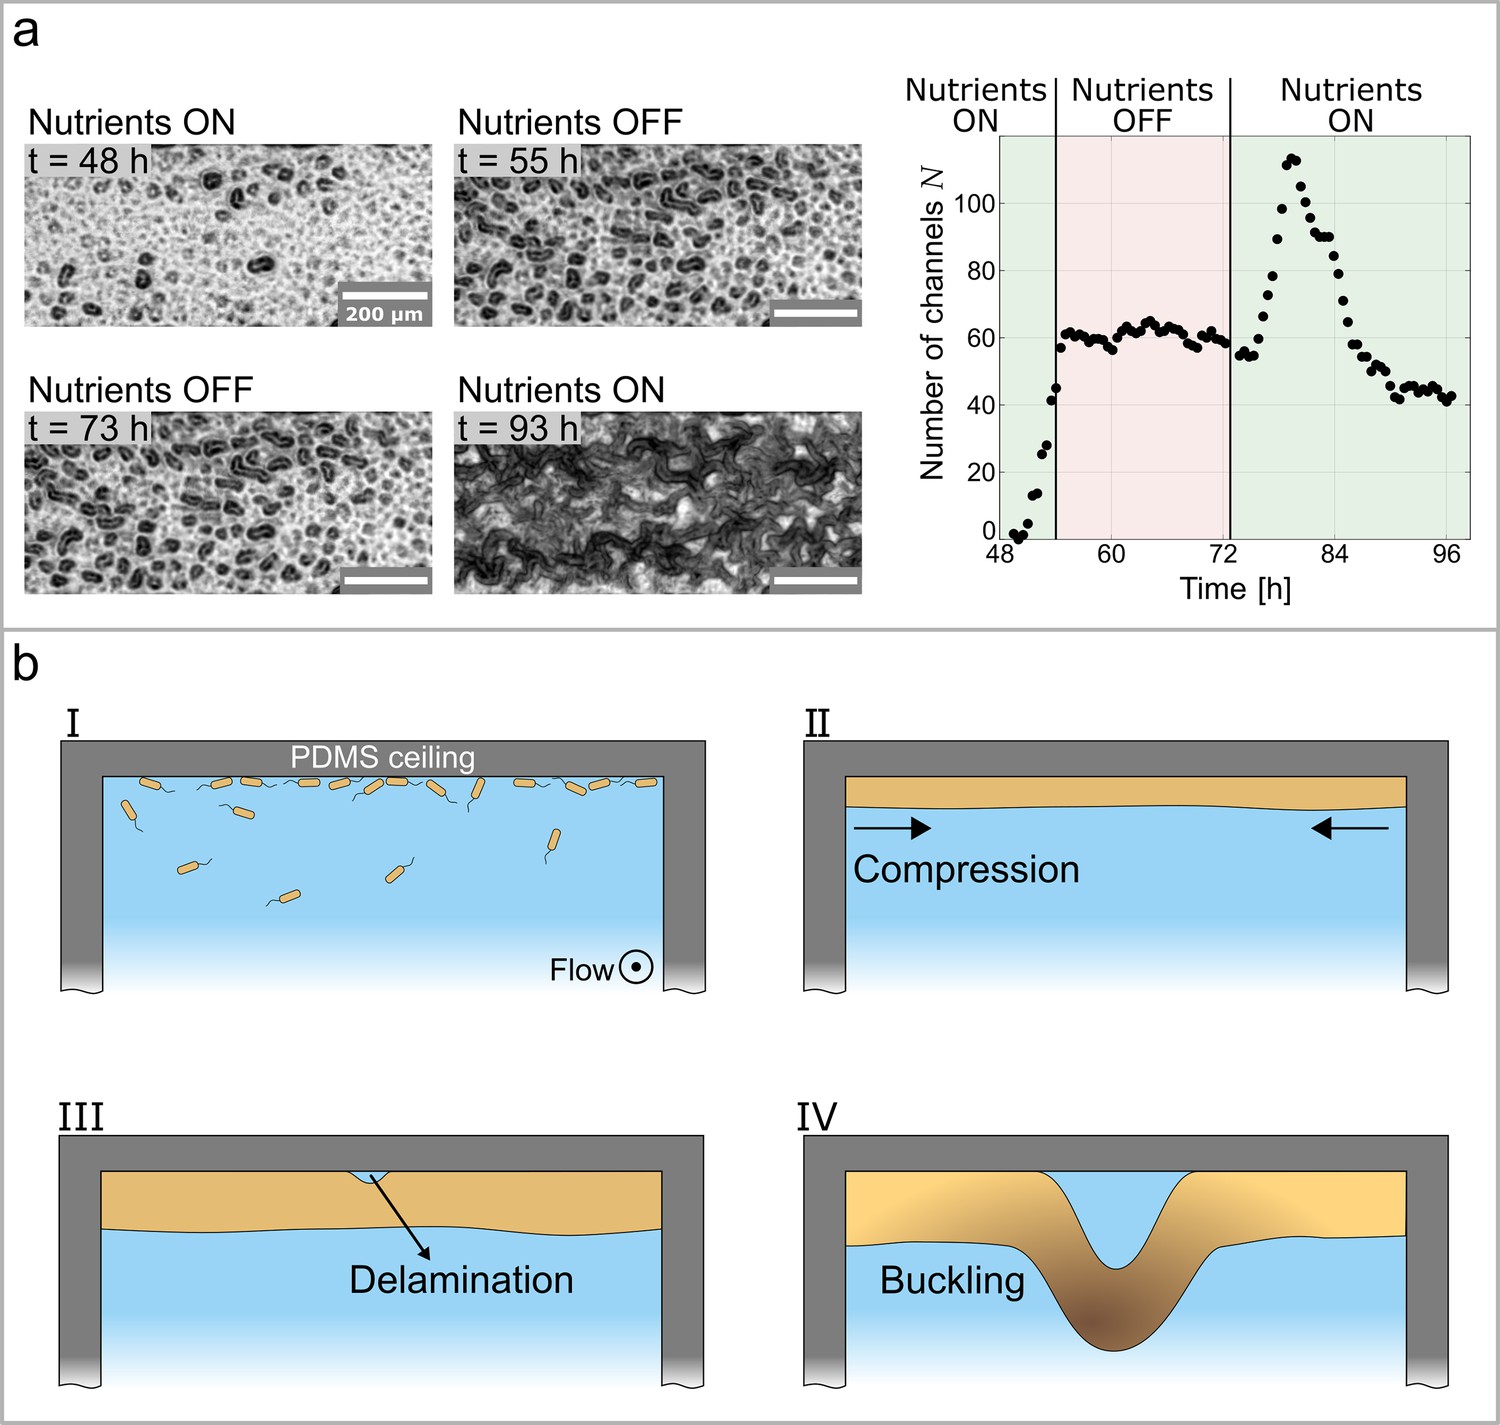
Growth controls the formation of channels through buckling-delamination.
(a) Phase-contrast images of the experiment conducted to investigate the role of biofilm growth in channel formation. At the nutrient solution is replaced with a nutrient-depleted salt solution to stop growth. At the salt solution is replaced with the original nutrient solution. The graph shows the number of channels, , as a function of time and nutrient availability. (b) Schematic representation of the buckling-delamination mechanism during channel formation in P. aeruginosa biofilm in a microfluidic device.
Figure 4 with 1 supplement
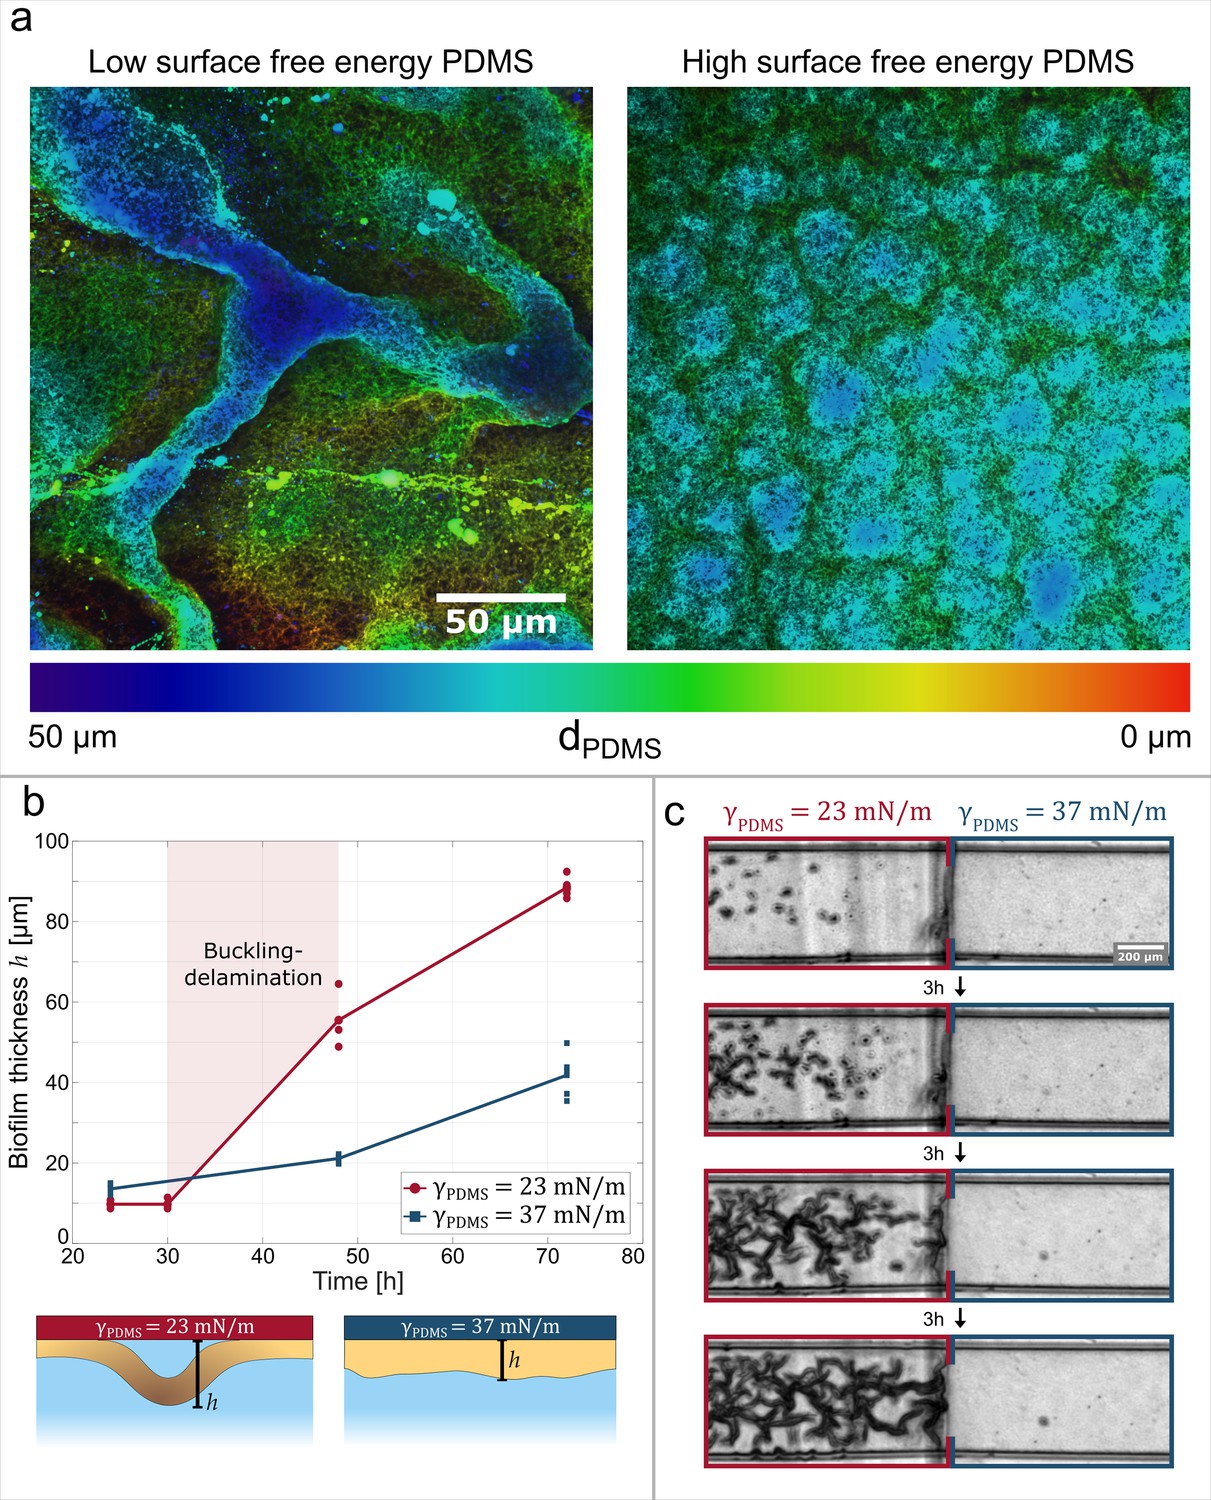
Adhesive strength between the biofilm and the substrate governs channel formation.
(a) Reconstructions from laser-scanning confocal microscopy images of the biofilm. The biofilms are either grown on a low surface free energy PDMS substrate (left, ) or on a high surface free energy PDMS substrate (right, ). (b) Average effective biofilm thickness as a function of time and surface free energy. The average thickness of biofilm grown on a low surface free energy PDMS substrate (red) and on a high surface free energy PDMS substrate (blue). (c) The image sequence shows a biofilm that is grown on a patterned PDMS substrate in the same microfluidic channel. On the left, the substrate has a low surface free energy, while on the right it has a high surface free energy.
Figure 4—figure supplement 1
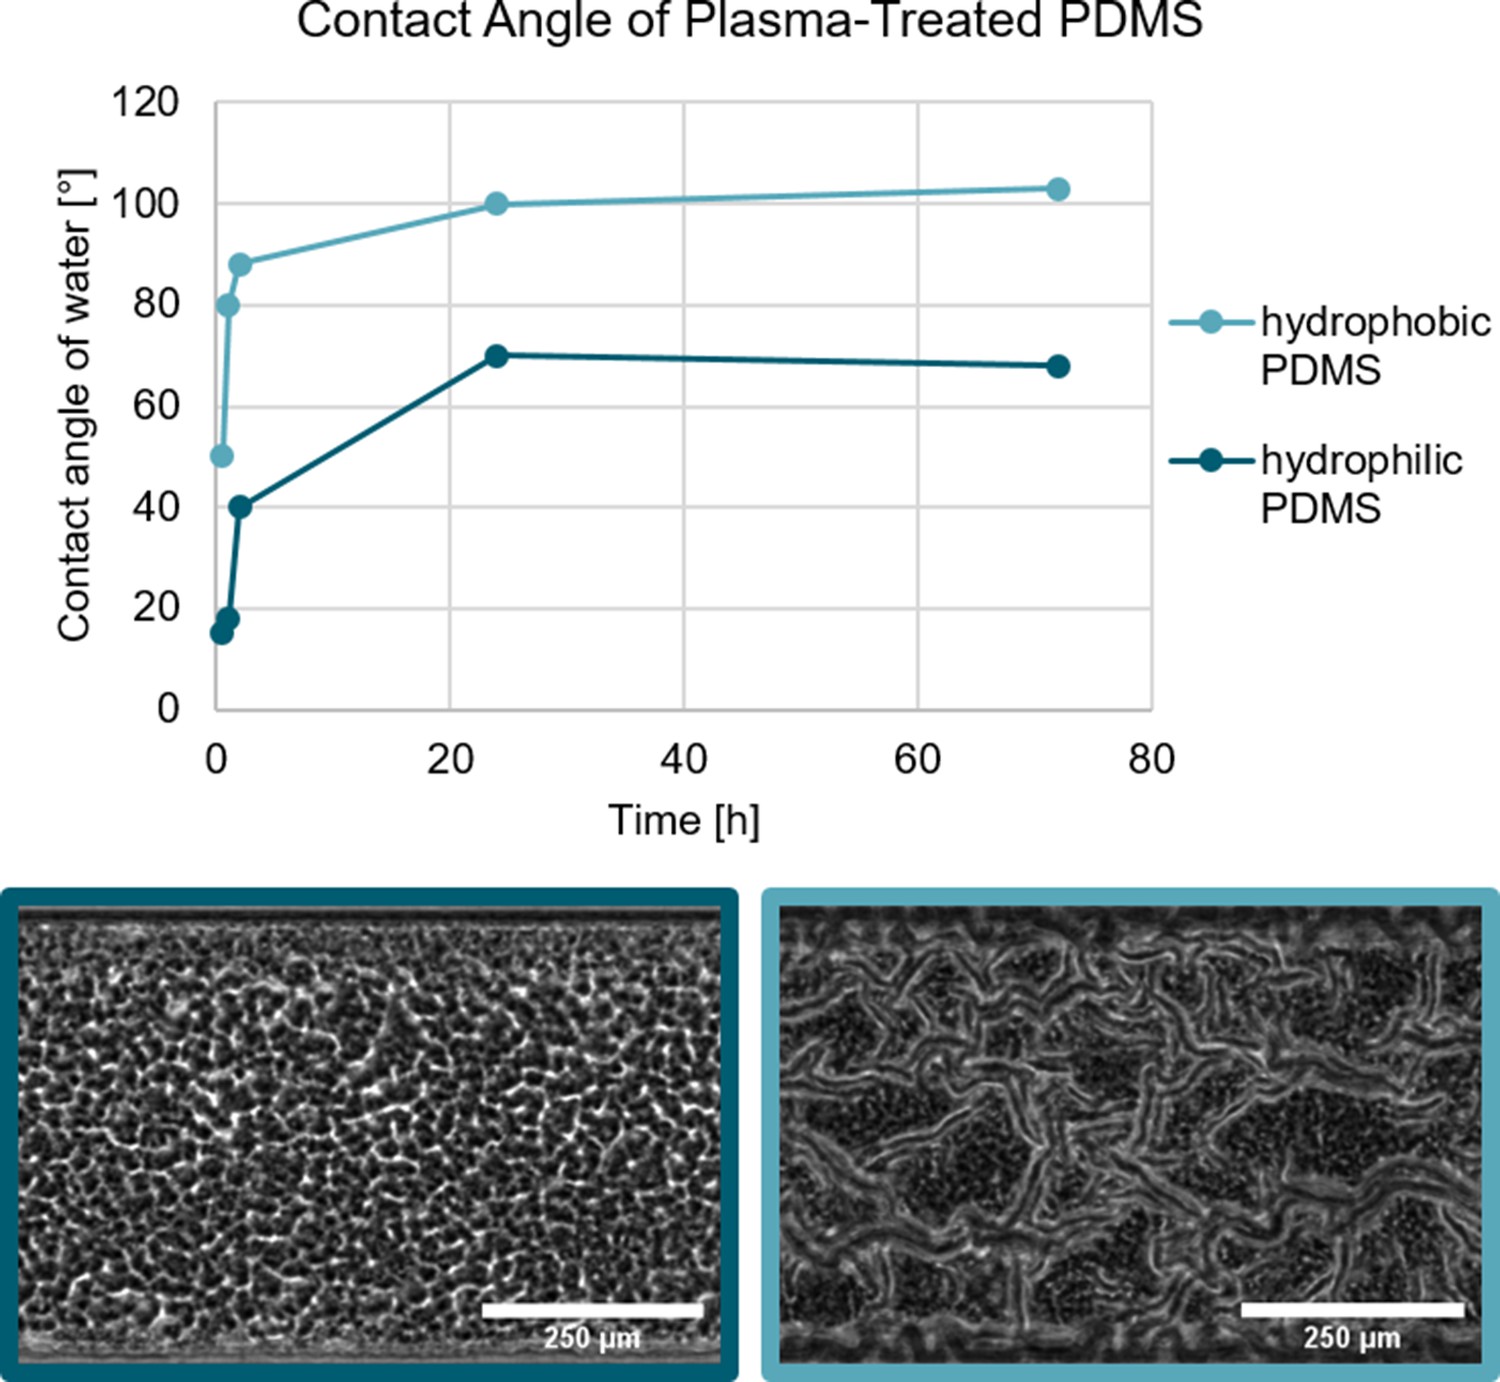
The surface free energy of the substrate can be changed through a physical process.
The treatment of PDMS with an oxygen plasma increases the hydrophilicity with identical results to the chemical modification. Biofilm growth on hydrophilic and hydrophobic PDMS substrate. In both cases, the PDMS was treated with an oxygen plasma which renders the PDMS hydrophilic. As shown by Kim et al., 2004 the hydrophobic recovery of plasma-treated can be varied depending on the storage conditions. Biofilm grown on the hydrophilic PDMS does not form a channel network, while the biofilm grown on the hydrophobic PDMS does form a channel network.
Figure 5 with 3 supplements
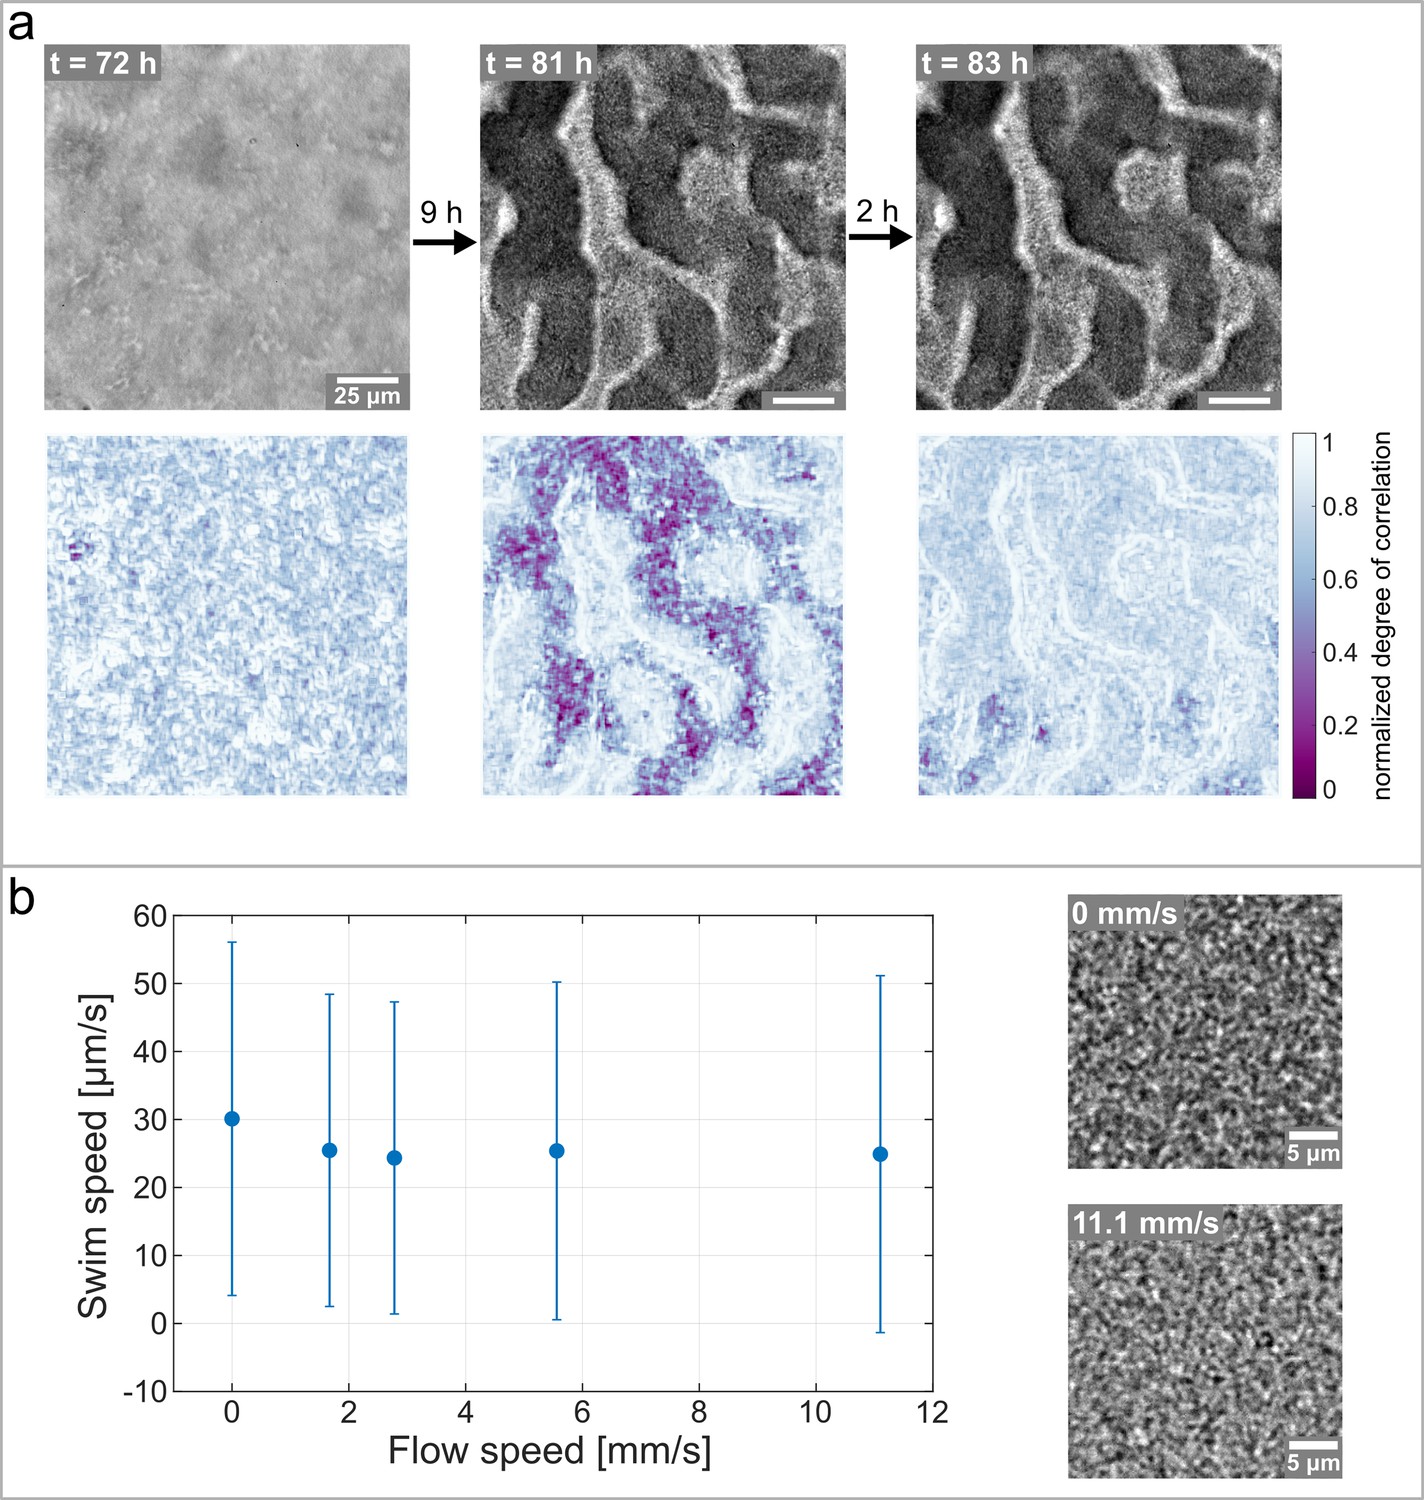
Hollow channels are populated by motile bacteria.
(a) Bacterial movement inside the channel network visualized using a spatially resolved, normalized degree of correlation. A low degree of correlation corresponds to an active region. The brightfield images show the corresponding structure of the biofilm. (b) Differential Dynamic Microscopy is used to quantify the bacterial swimming speed inside the biofilm channels. The swimming speed is measured at varying fluid flow speeds inside the microfluidic device. The two microscopy images show a close up of the bacterial biofilm at two different fluid flow velocities. The errorbars indicate the standard deviation from the mean swim speed. The videos of the bacteria motion can be found in Figure 5—video 2 and Figure 5—video 3.
Figure 5—video 1
Video of the bacterial movement inside the biofilm channels.
Figure 5—video 2
Video of bacteria movement with no surrounding fluid flow.
Figure 5—video 3
Video of bacteria movement with a surrounding fluid flow velocity of .
Additional files
Download links
A two-part list of links to download the article, or parts of the article, in various formats.
Downloads (link to download the article as PDF)
Open citations (links to open the citations from this article in various online reference manager services)
Cite this article (links to download the citations from this article in formats compatible with various reference manager tools)
The role of surface adhesion on the macroscopic wrinkling of biofilms
eLife 11:e76027.
https://doi.org/10.7554/eLife.76027


