Windborne migration amplifies insect-mediated pollination services
- State Key Laboratory for Biology of Plant Diseases and Insect Pests, Institute of 8 Plant Protection, Chinese Academy of Agricultural Sciences, China
- Guangdong Laboratory for Lingnan Modern Agriculture, China
- College of Plant Protection, Shenyang Agricultural University, China
- Institute of Entomology, Guizhou Provincial Key Laboratory for Agricultural Pest, Management of the Mountainous Region, Guizhou University, China
- College of Plant Protection, Southwest University, China
Figures
Figure 1 with 1 supplement

Seasonal migration patterns of Episyrphus balteatus in Eastern China.
(A) Annual migration dynamics, expressed as nightly searchlight-trap catches, of E. balteatus on Beihuang Island (BH; Bohai Gulf, China) from April to October 2003–2018. (B) Endpoints of backward trajectories of BH-caught E. balteatus individuals during mass migration events over 2003–2018 for a 12-hr flight duration. Darker colors indicate a higher density of endpoints at a particular location. The left panel (i.e., orange colors) reveals the possible source areas of late spring and summer immigrants, while the right panel (i.e., blue colors) indicates those of autumn immigrants.
-
Figure 1—source data 1
Nightly catches of E. balteatus in the searchlight trap on BH from April to October 2003–2018.
- https://cdn.elifesciences.org/articles/76230/elife-76230-fig1-data1-v2.xlsx
Figure 1—figure supplement 1
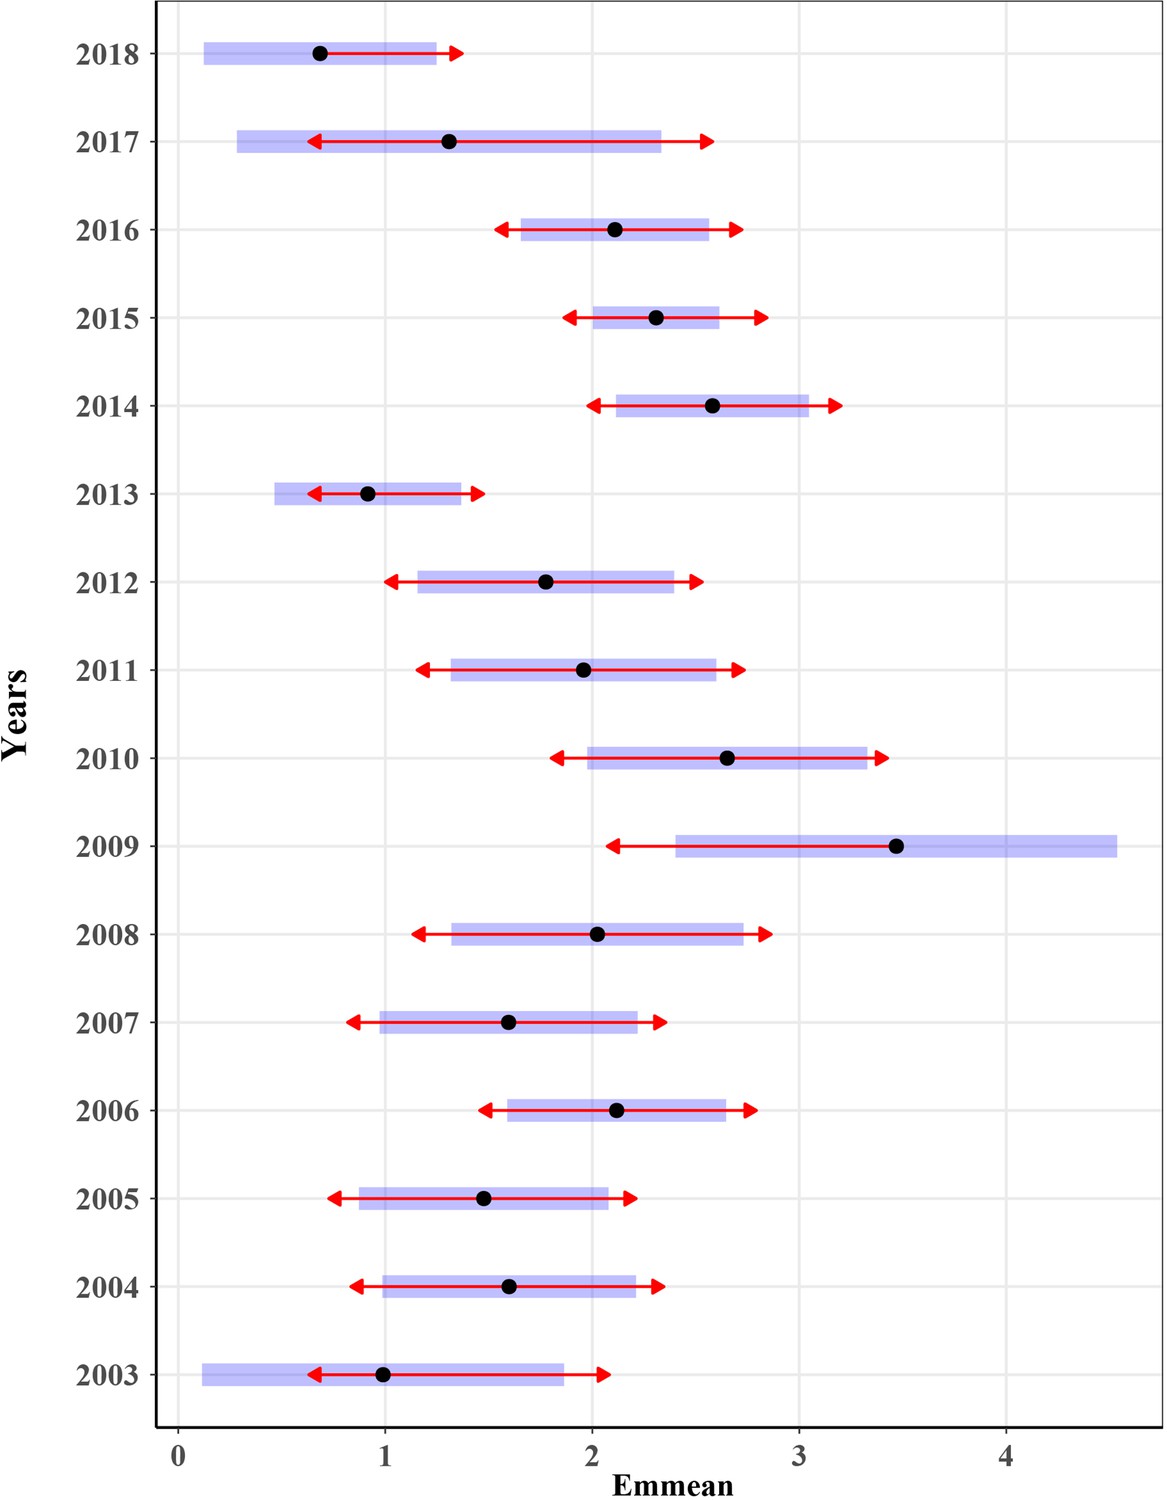
Analysis of variance on the number of E. balteatus captured in the searchlight trap on BH Island from May to October 2003–2018 by comparing EMMs.
The blue bars are confidence intervals for the EMMs, and the red arrows are for the comparisons among them. If an arrow from one mean overlaps an arrow from another group, the difference is not ‘significant’, based on the adjust setting (which defaults to ‘turkey’) and the value of alpha (which defaults to 0.05).
Figure 2
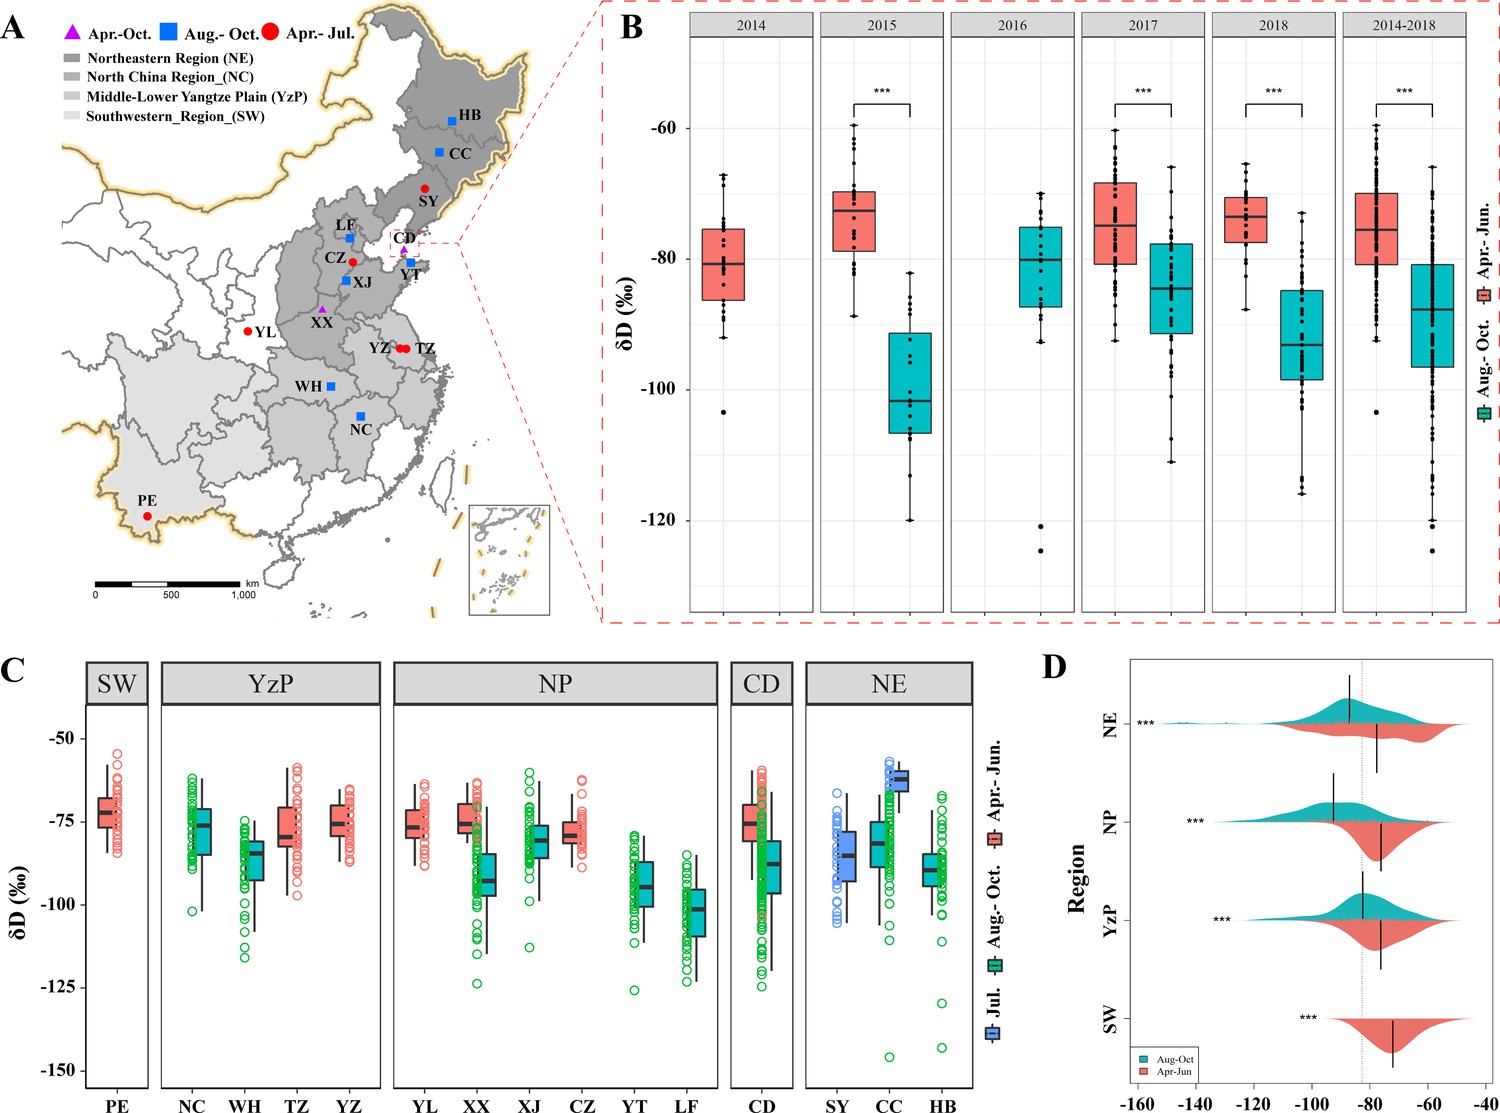
Stable hydrogen isotope analysis of E. balteatus.
(A) Sampling locations. (B) Seasonal incidence of mean δD values in the wings of migratory E. balteatus adults, as recorded for different migration stages over 2014–2018 on Beihuang Island (BH). Double asterisks (***) indicate a statistically significant difference (p < 0.01, Wilcoxon test). (C, D) Seasonal incidence of mean δD values in the wings of wild-caught individuals from each sampling location or geographic region during April to October 2017–2018, respectively. Locations are ranked as per their longitudinal position. PE, Puer; NC, Nanchang; WH, Wuhan; TZ, Taizhou; YZ, Yangzhou; YL,Yangling; XX, Xinxiang; XJ, Xiajin; CZ,Cangzhou; YT, Yantai; LF, Langfang; CD, Changdao; SY, Shenyang; CC, Changchun; HB, Harbin.
Figure 3 with 4 supplements
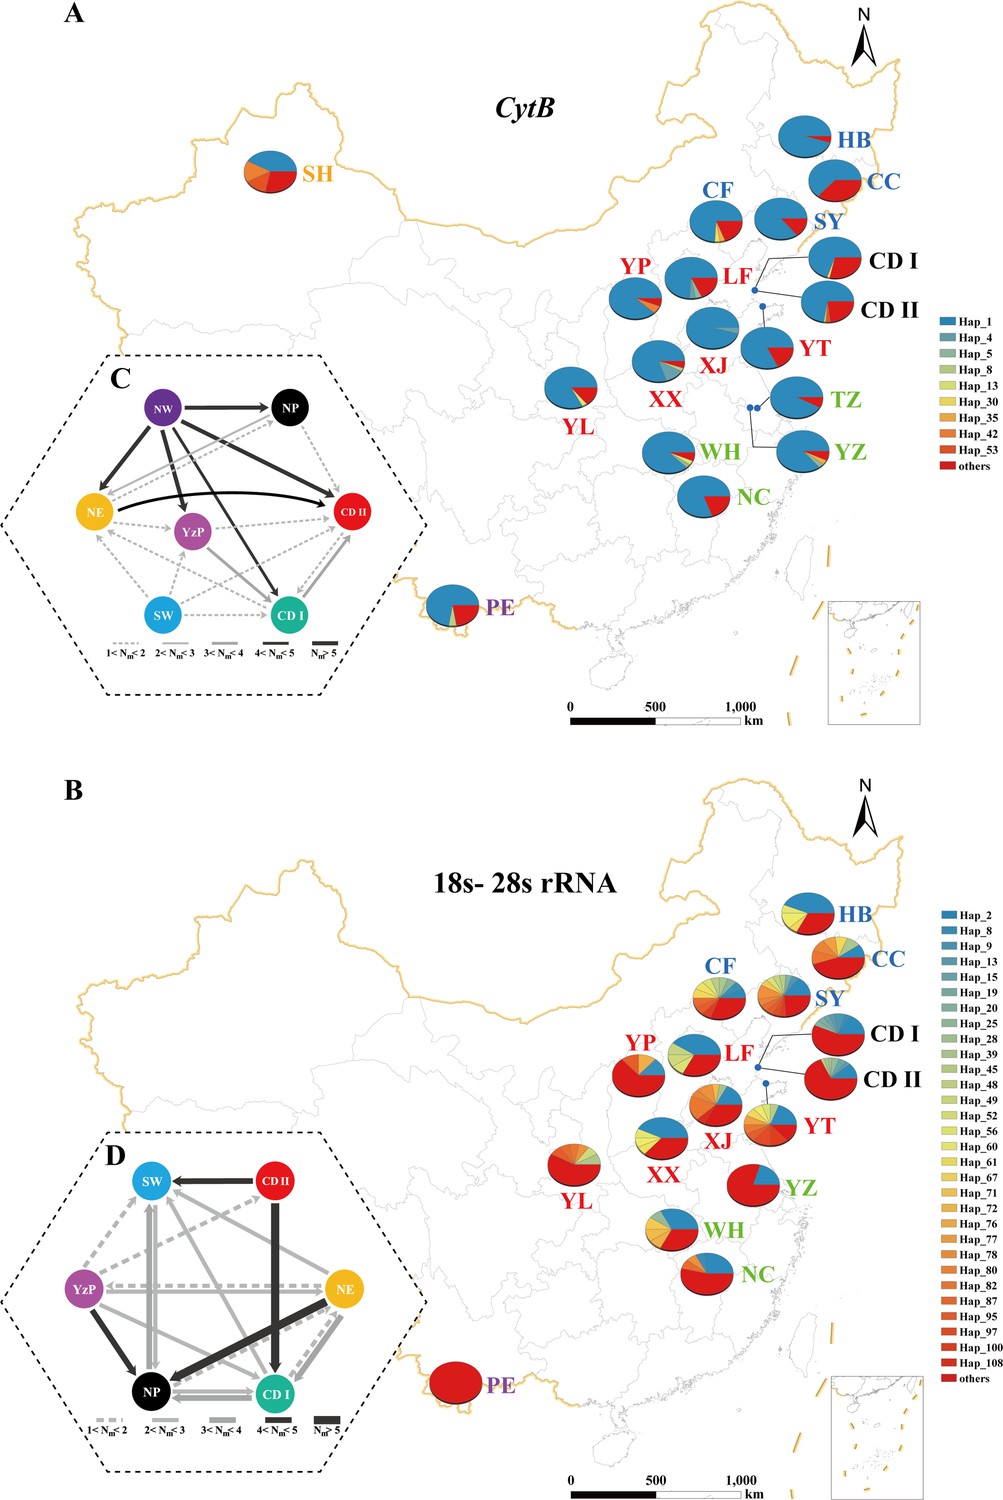
Population genetic structure of E. balteatus populations sampled in 18 locations across China.
Analyses are either based on one mitochondrial Cytb gene (upper panels, i.e., A, C) or on combined 18s and 28s rRNA nuclear genes (lower panels, i.e., B, D). (A, B), Spatial distribution of E. balteatus haplotypes. At each given location, a pie chart shows the proportional abundance of haplotypes. (C, D) Migration dynamics of different populations as estimated through MIGRATE-N. Individual arrows represent the prevailing migration direction and arrow thickness is proportional to the number of migrants. SW, Southwestern Region; YzP, Yangtze Plain; NP, Northern Region; and NE, Northeastern Region, as defined in Figure 2.
Figure 3—figure supplement 1
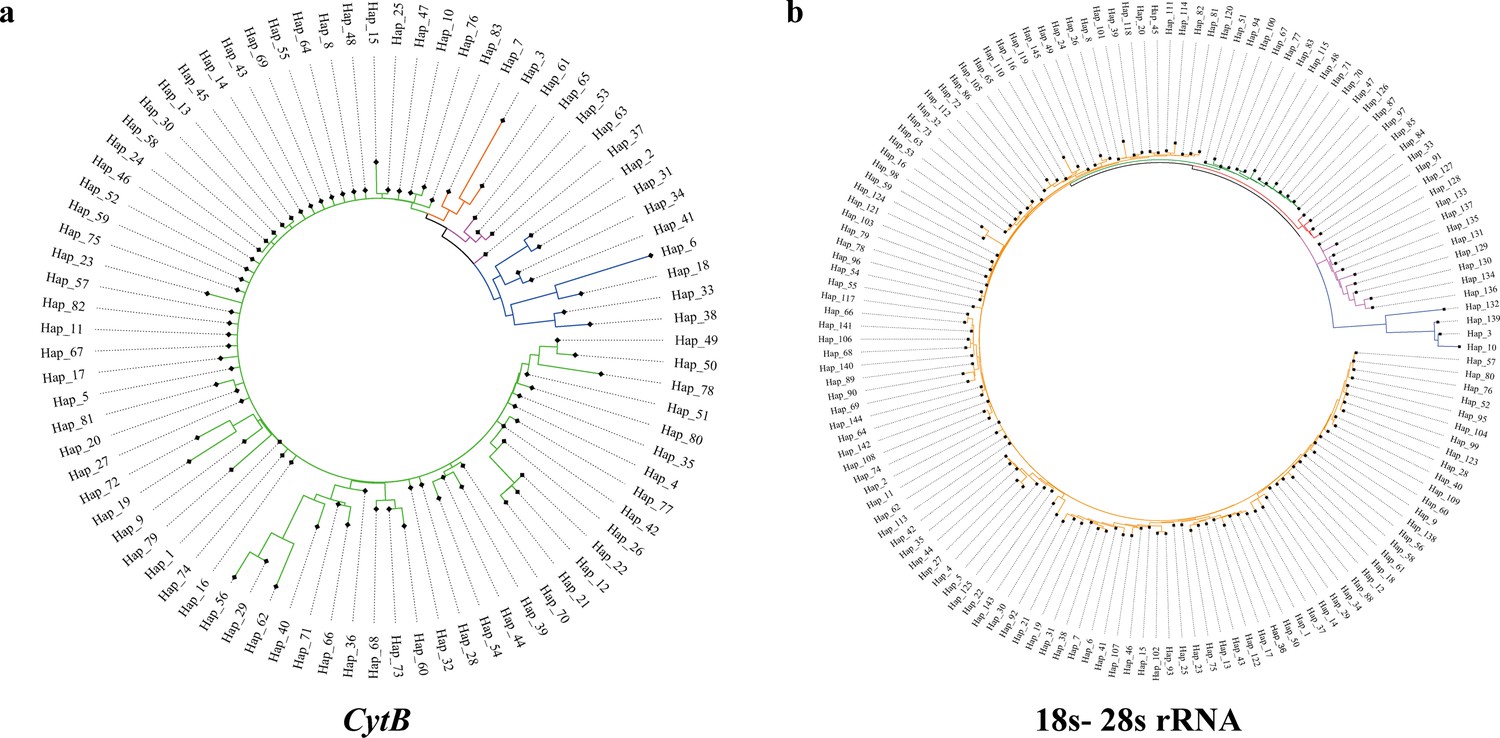
Neighbor-joining (NJ) phylogenetic trees of haplotypes, in which different clades are depicted with different colors.
Figure 3—figure supplement 2
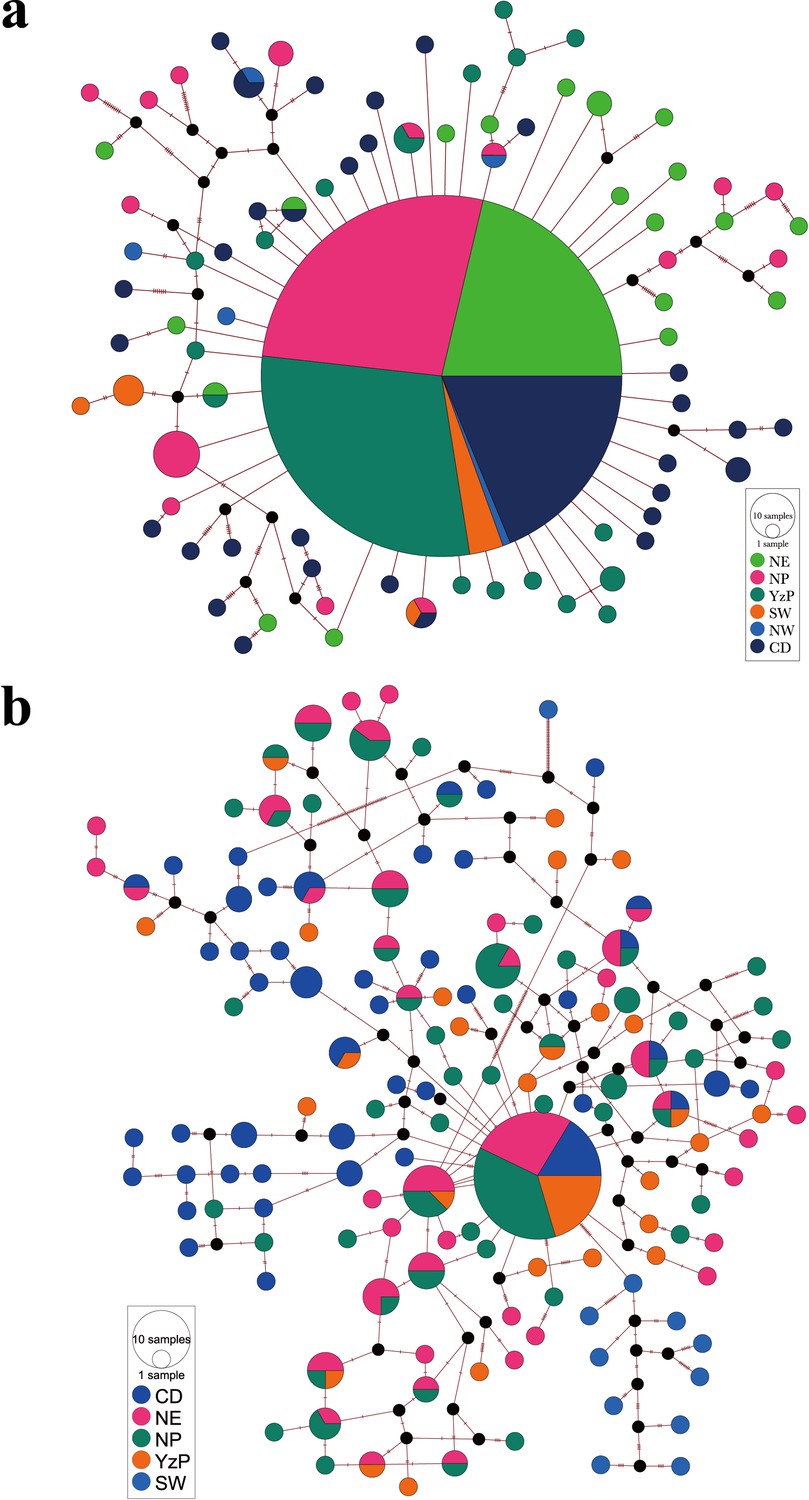
Median-joining haplotype network of the CytB (a) and 18S-28S rRNA gene (b).
Circle areas indicated the proportion of haplotype frequencies, while colored portions represent the proportions of the same haplotype that occurs in each region.
Figure 3—figure supplement 3

Heatmap diagram of genetic differentiation coefficient (Fst) between populations based on the CytB (a) and combined 18S-28S rRNA (b) gene.
Figure 3—figure supplement 4

Mismatch distribution of the Cytb and18S-28S rRNA gene in E. balteatus populations.
Figure 4

Scanning electron microscopy (SEM) microphotographs of pollen grains attached to E. balteatus migrants on BH during 2014–2018.
1. Ailanthus altissima; 2. Cotinus coggygria; 3. Forsythia suspensa; 4. Prunus avium; 5. Brassica L.; 6. Morus alba; 7. Citrus sinensis; 8. Descurainia sophia; 9. Euonymus L.; 10. Taraxacum L.; 11. Sedum japonicum; 12. Populus cathayana; 13. Celastrus orbiculatus; 14. Daucus carota; 15. Chenopodium L.; 16. Castanea mollissima; 17. Amorpha fruticosa; 18. Diospyros lotus; 19. Ziziphus jujuba; 20. Cirsium setosum; 21. Neoshirakia japonica; 22. Flueggea L.; 23. Maclura pomifera; 24. Rumex L.; 25. Euonymus L.; 26. Schisandra chinensis; 27. Eleusine indica; 28. Actinidia kolomikta; 29. Cannabis sativa; 30. Humulus scandens; 31. Helianthus annuus; 32. Persicaria orientalis; 33. Adenophora trachelioides; 34. Gypsophila paniculata; 35. Artemisia L.; 36. Rubia cordifolia; 37. Rubia cordifolia; 38. Artemisia L.; 39. Artemisia L.; 40. Artemisia L.; 41. Allium tuberosum; 42. Tripolium vulgare; 43. Ambrosia trifida; 44. Sorghum bicolor; 45. Aster tataricus; 46. Chrysanthemum zawadskii. The scale bar is shown on the bottom of each photograph.
Figure 5
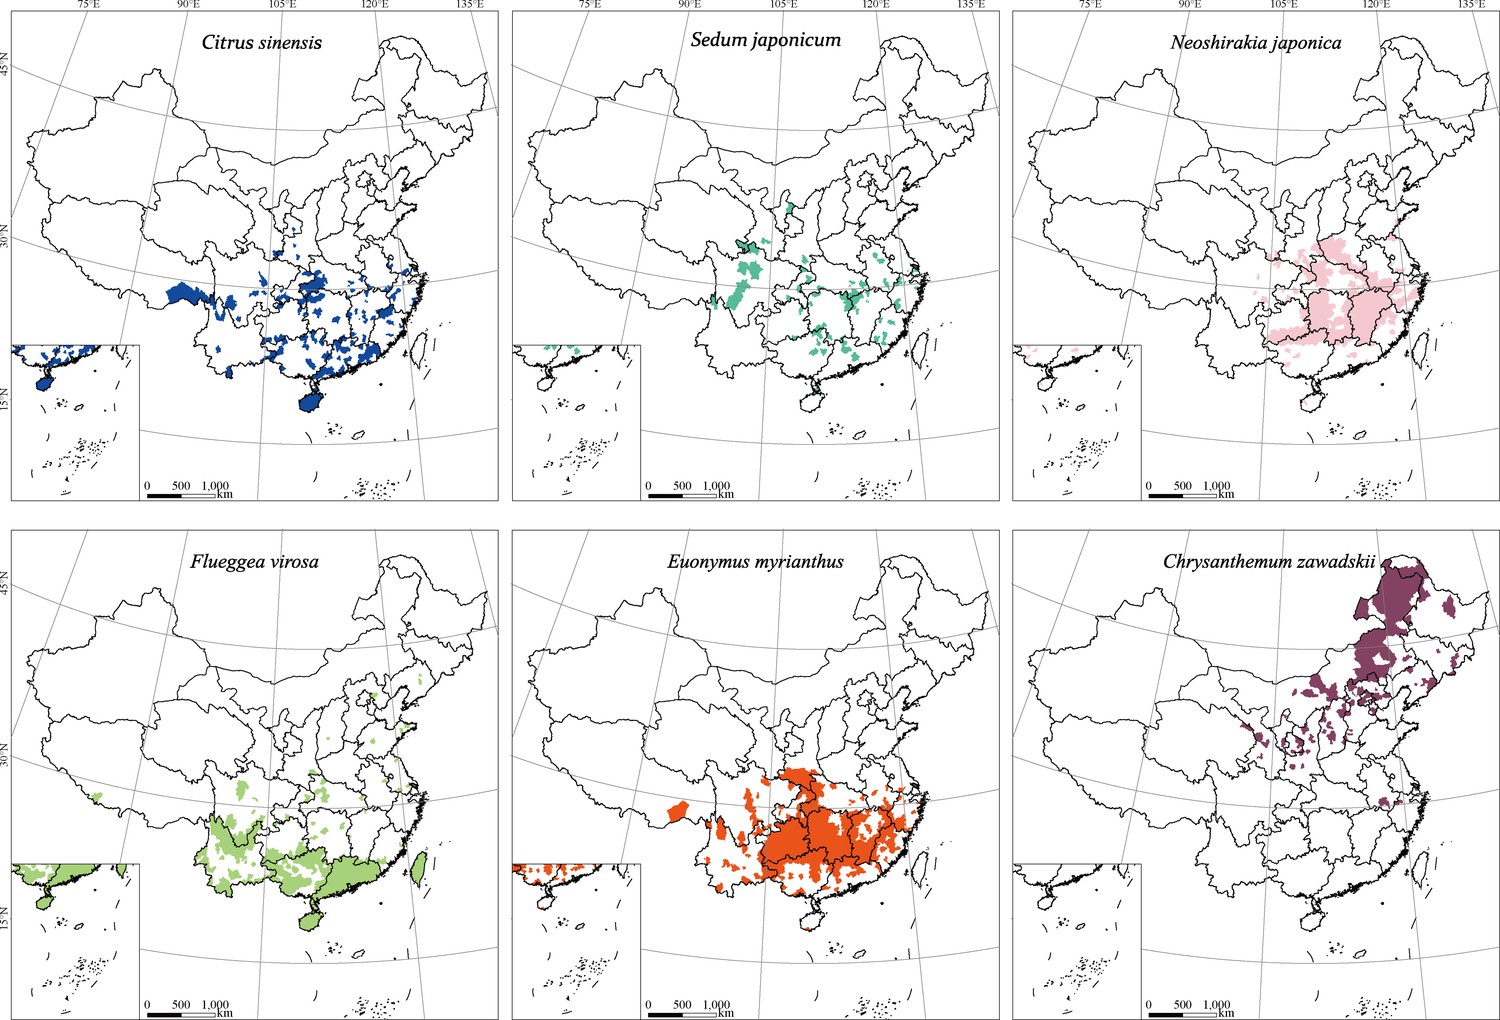
Geographical distribution of pollen-bearing plant species that help delineate E. balteatus migration patterns.
Maps show the (district-level) geographical distribution of individual plant species.
Figure 6 with 1 supplement
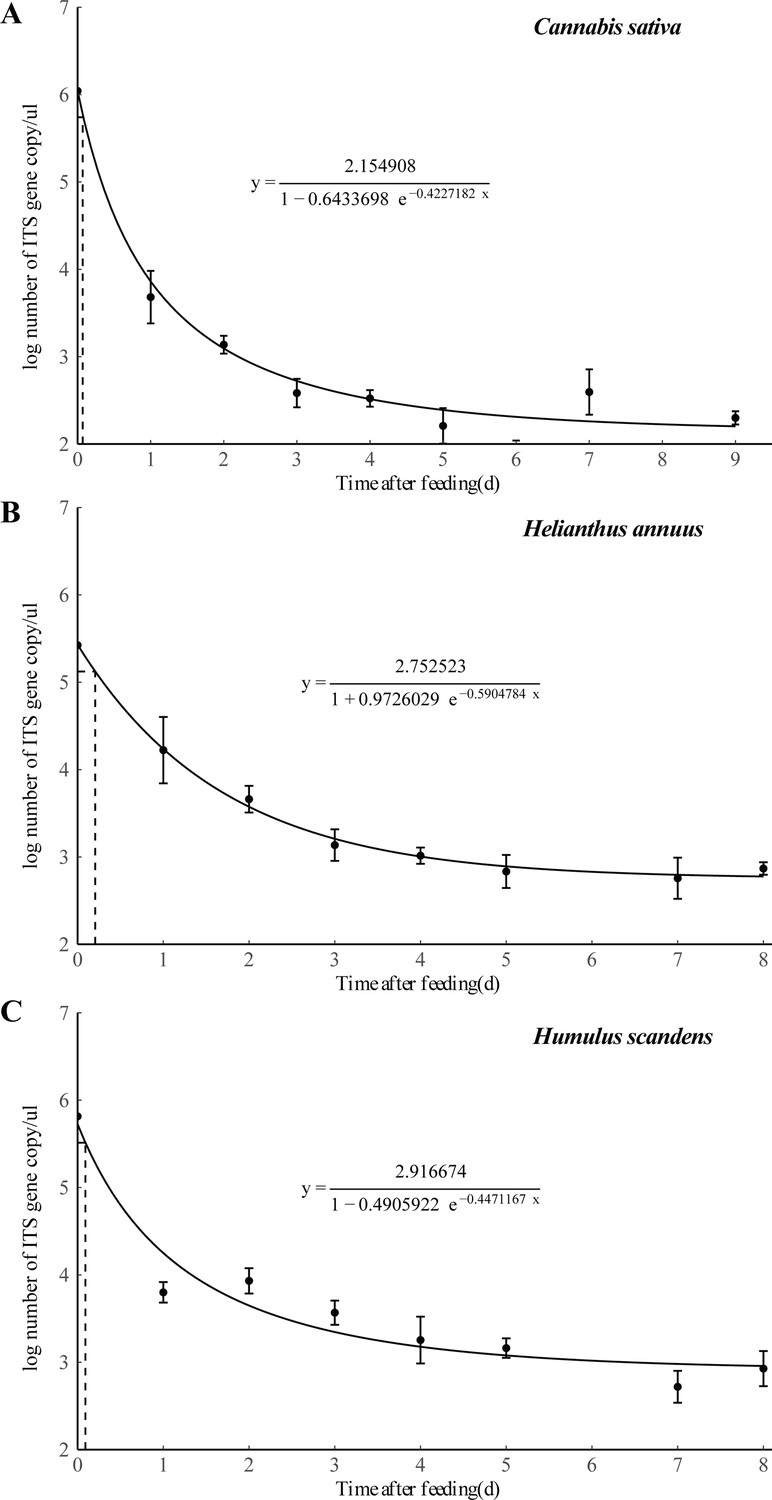
Detection of three different plant DNA in the guts of E. balteatus adults at different times after ingestion by qPCR analysis.
Error bars at each point on the curves represent the standard error of replicates.
Figure 6—figure supplement 1
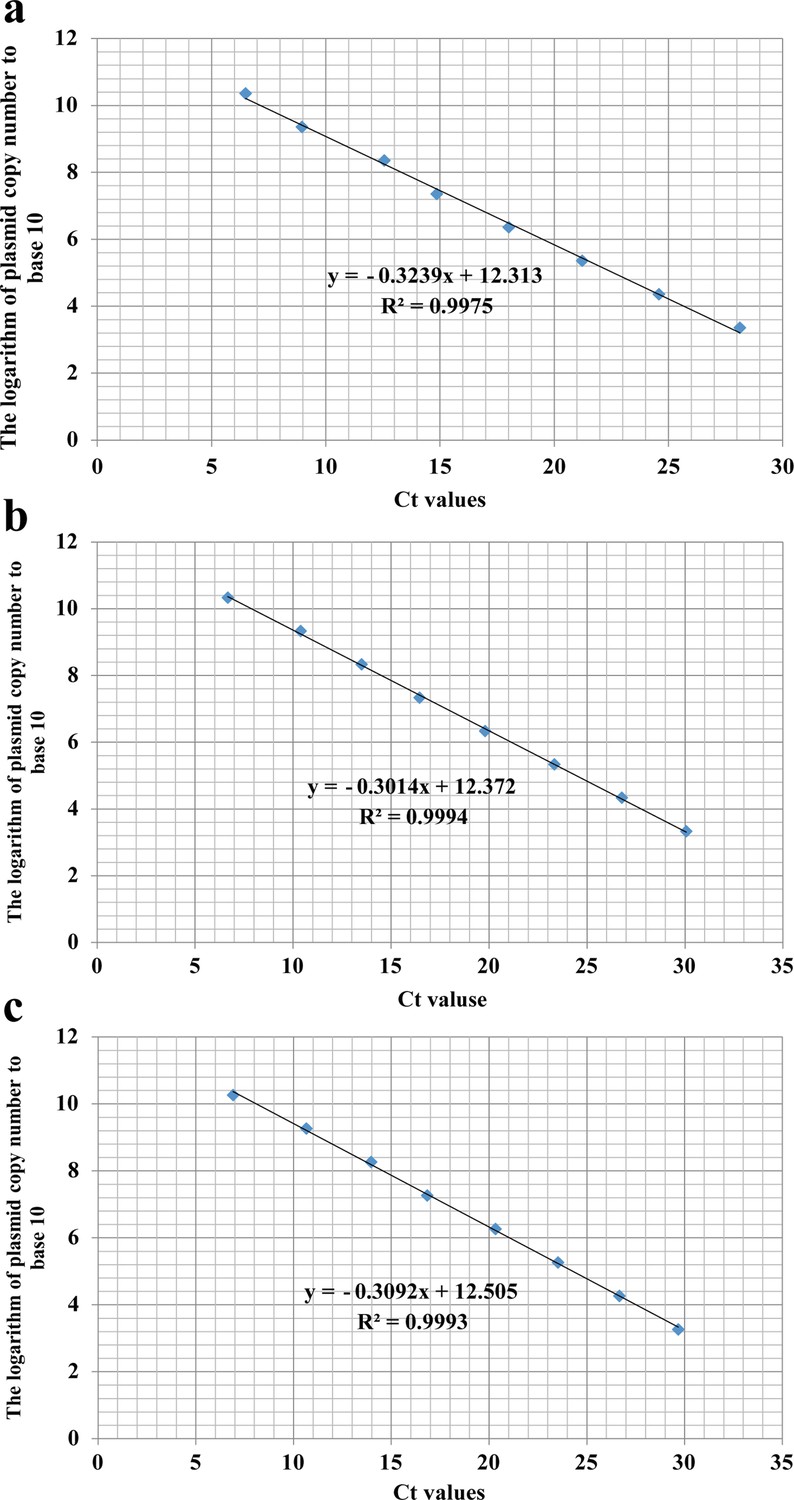
The respective standard curve equations of the three plants in the feeding experiments.
(a) Cannabis sativa, (b) Humulus scandens, and (c) Helianthus annuus.
-
Figure 6—figure supplement 1—source data 1
qPCR analysis of three different plant DNA in the guts of E.balteatus adults at different times after ingestion.
- https://cdn.elifesciences.org/articles/76230/elife-76230-fig6-figsupp1-data1-v2.xls
Figure 7 with 8 supplements
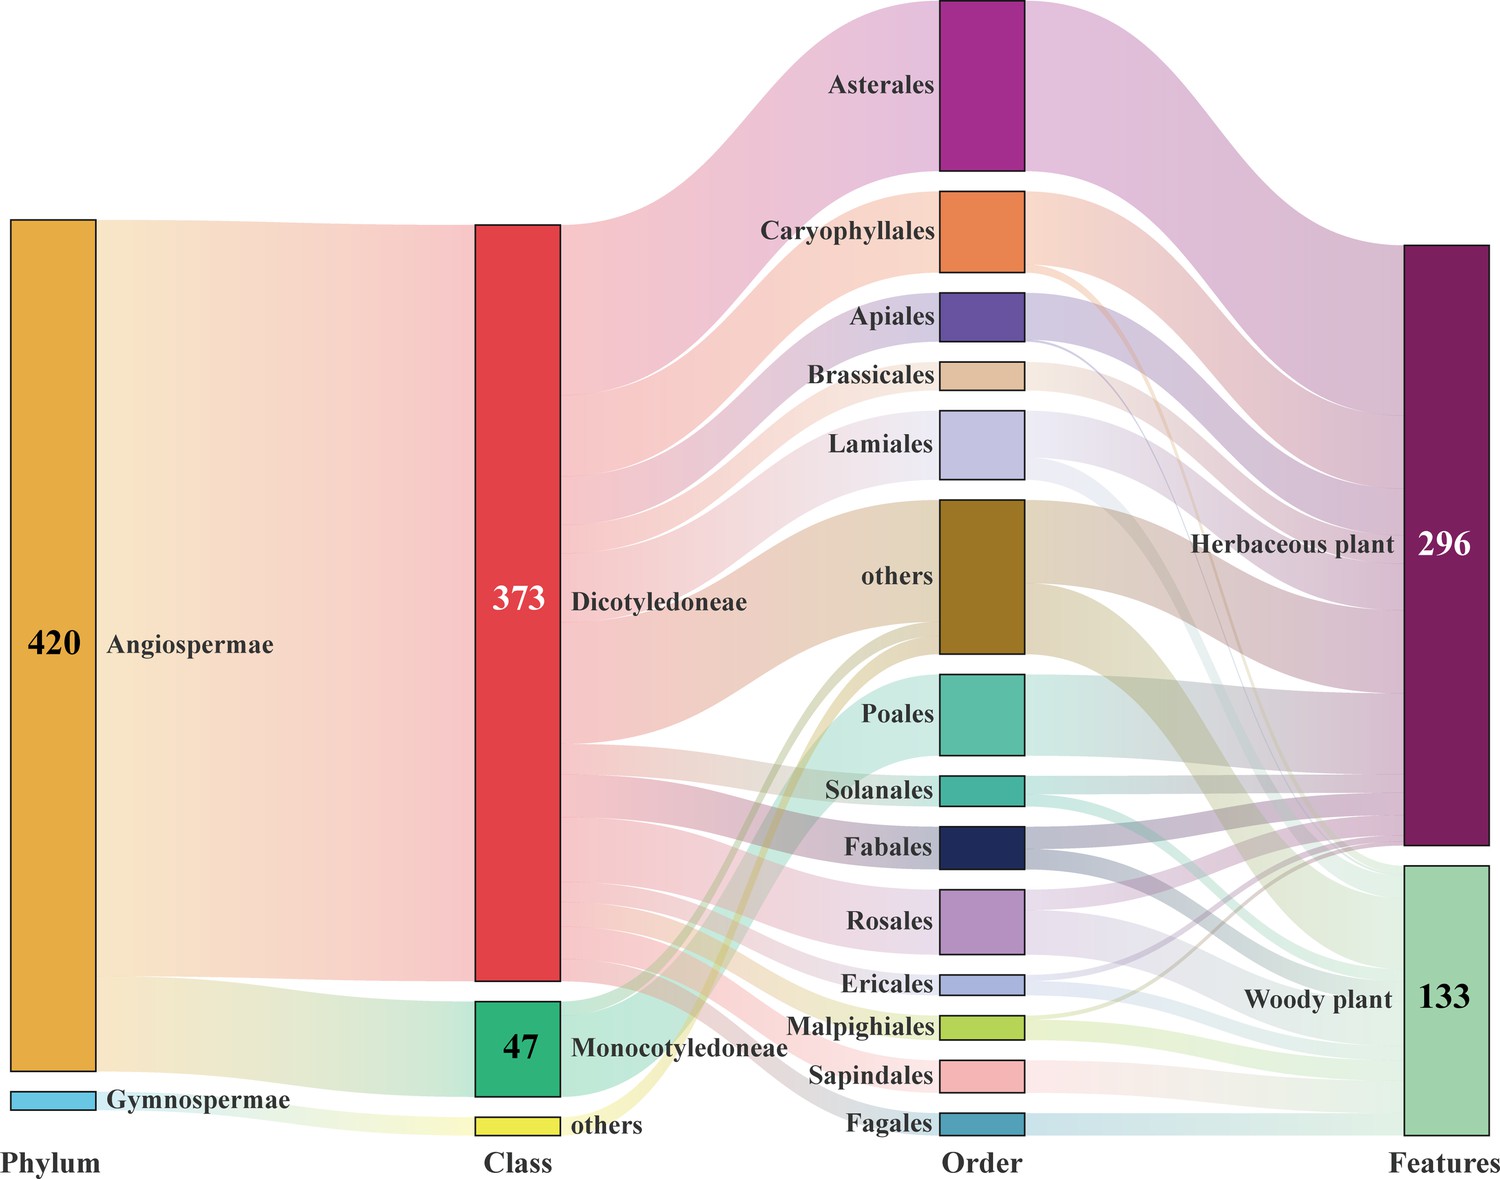
Sankey diagram summarizing the host plants of E. balteatus, as identified via DNA metabarcoding (i.e., for BH migrant individuals) or DNA-based gut content analysis (i.e., for field-collected individuals from 19 sites).
Taxonomic structure is shown for 429 plant genera, with individual numbers referring to the number of counts of particular taxa.
-
Figure 7—source data 1
List of the host plants of E. balteatus, as identified via DNA metabarcoding (i.e., for BH migrant individuals) or DNA-based gut content analysis (i.e., for field-collected individuals from 19 sites).
- https://cdn.elifesciences.org/articles/76230/elife-76230-fig7-data1-v2.xlsx
Figure 7—figure supplement 1
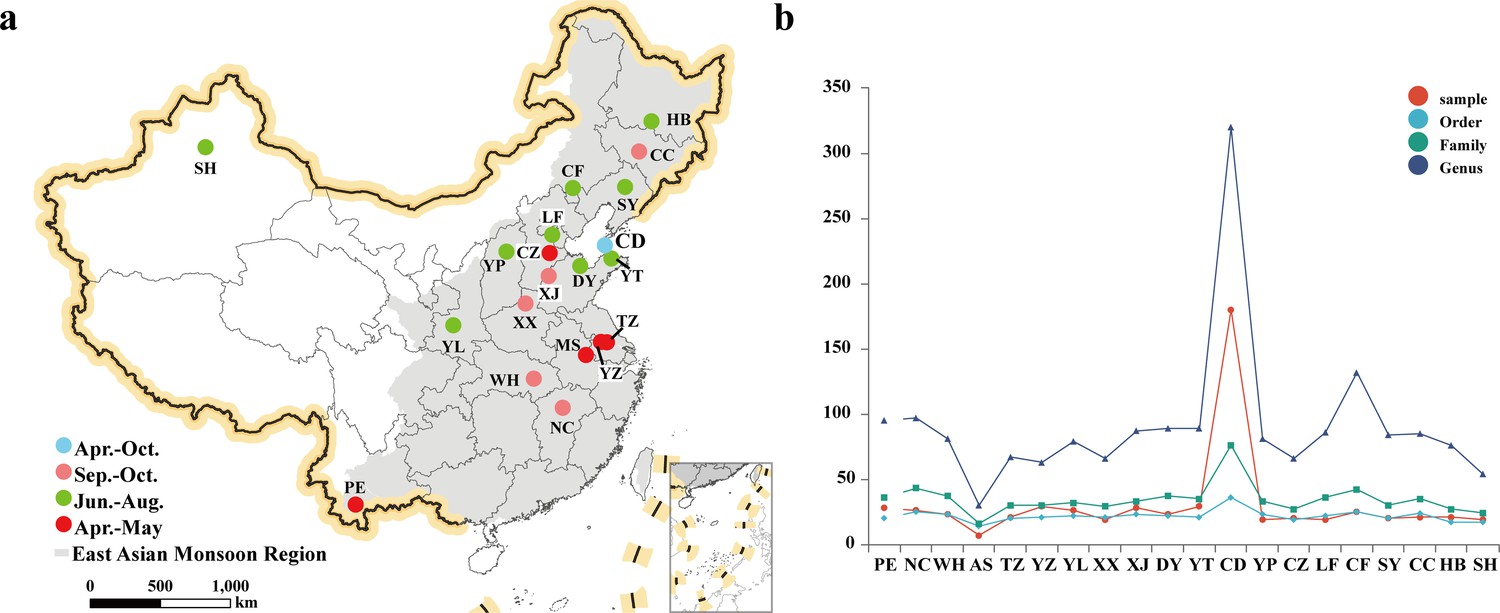
Host plants of E. balteatus, as identified through DNA metabarcoding (i.e., for BH migrant individuals) or DNA-based gut content analysis (i.e., for field-collected individuals from 19 sites).
(a) Geographical location of the sampling sites. (b) Taxonomic resolution (i.e., order, family, and genus) of the identified host plants for each hoverfly population.
Figure 7—figure supplement 2
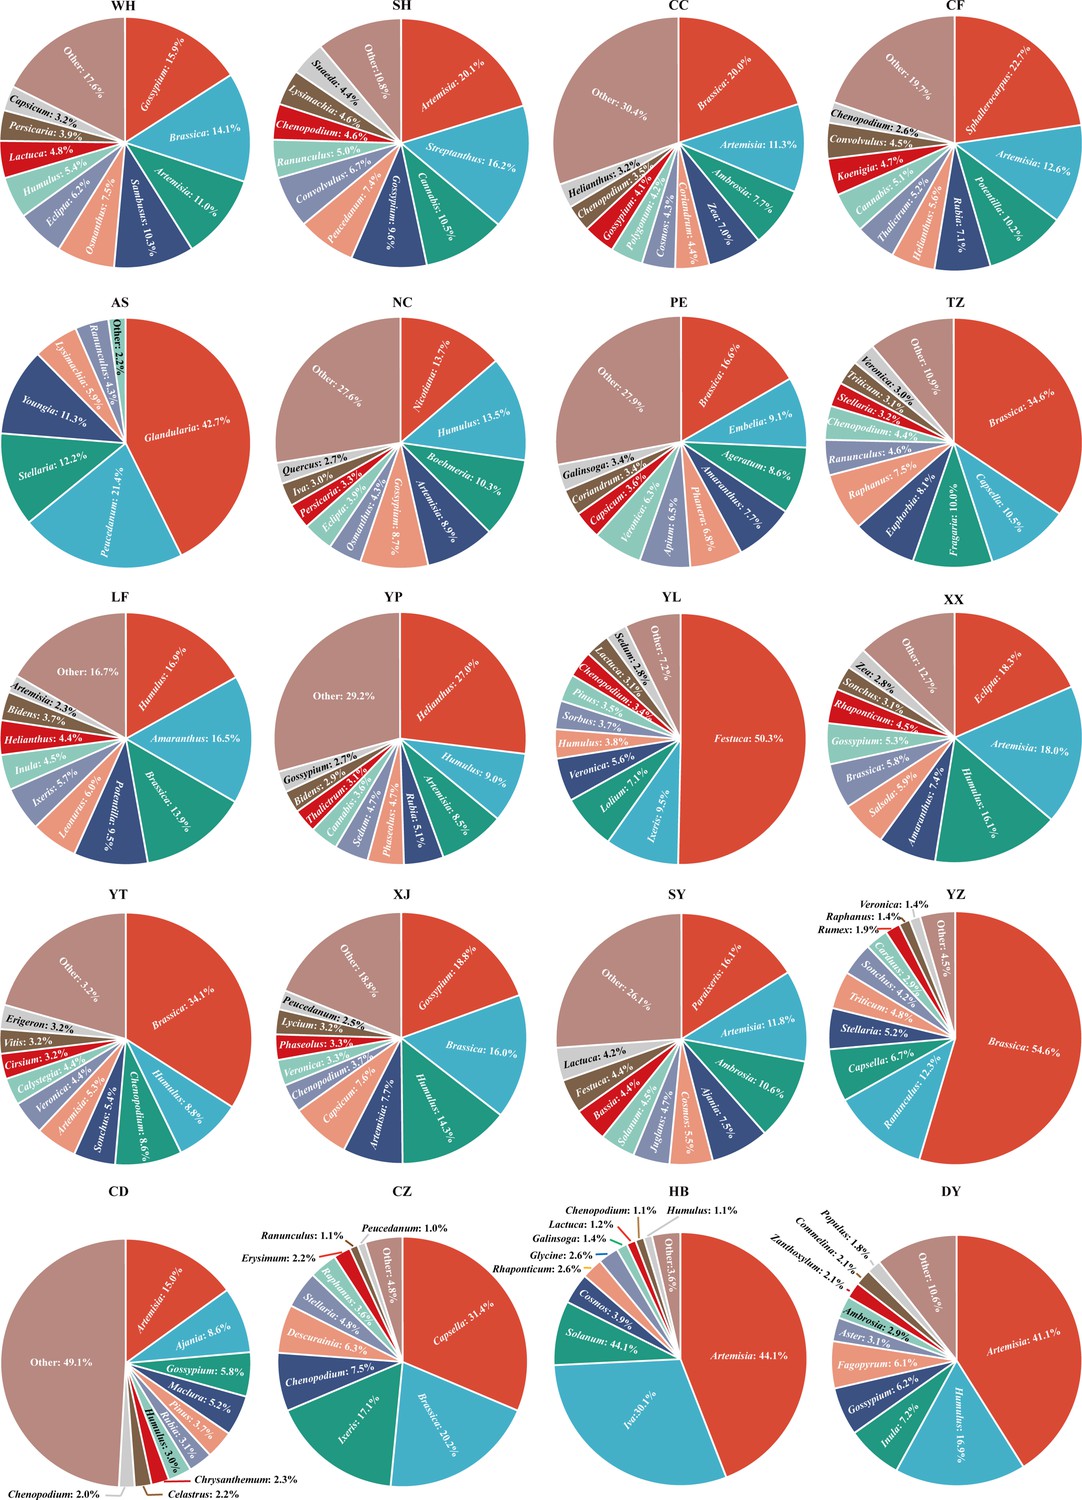
Relative abundance profiles of the 10 prevailing host plants of adult E.
balteatus. Abundance profiles are drawn per region and migration season. Host plants are identified at the genus level.
-
Figure 7—figure supplement 2—source data 1
Host plants across different regions, with plant hosts specified at the family or genus level.
- https://cdn.elifesciences.org/articles/76230/elife-76230-fig7-figsupp2-data1-v2.xlsx
Figure 7—figure supplement 3
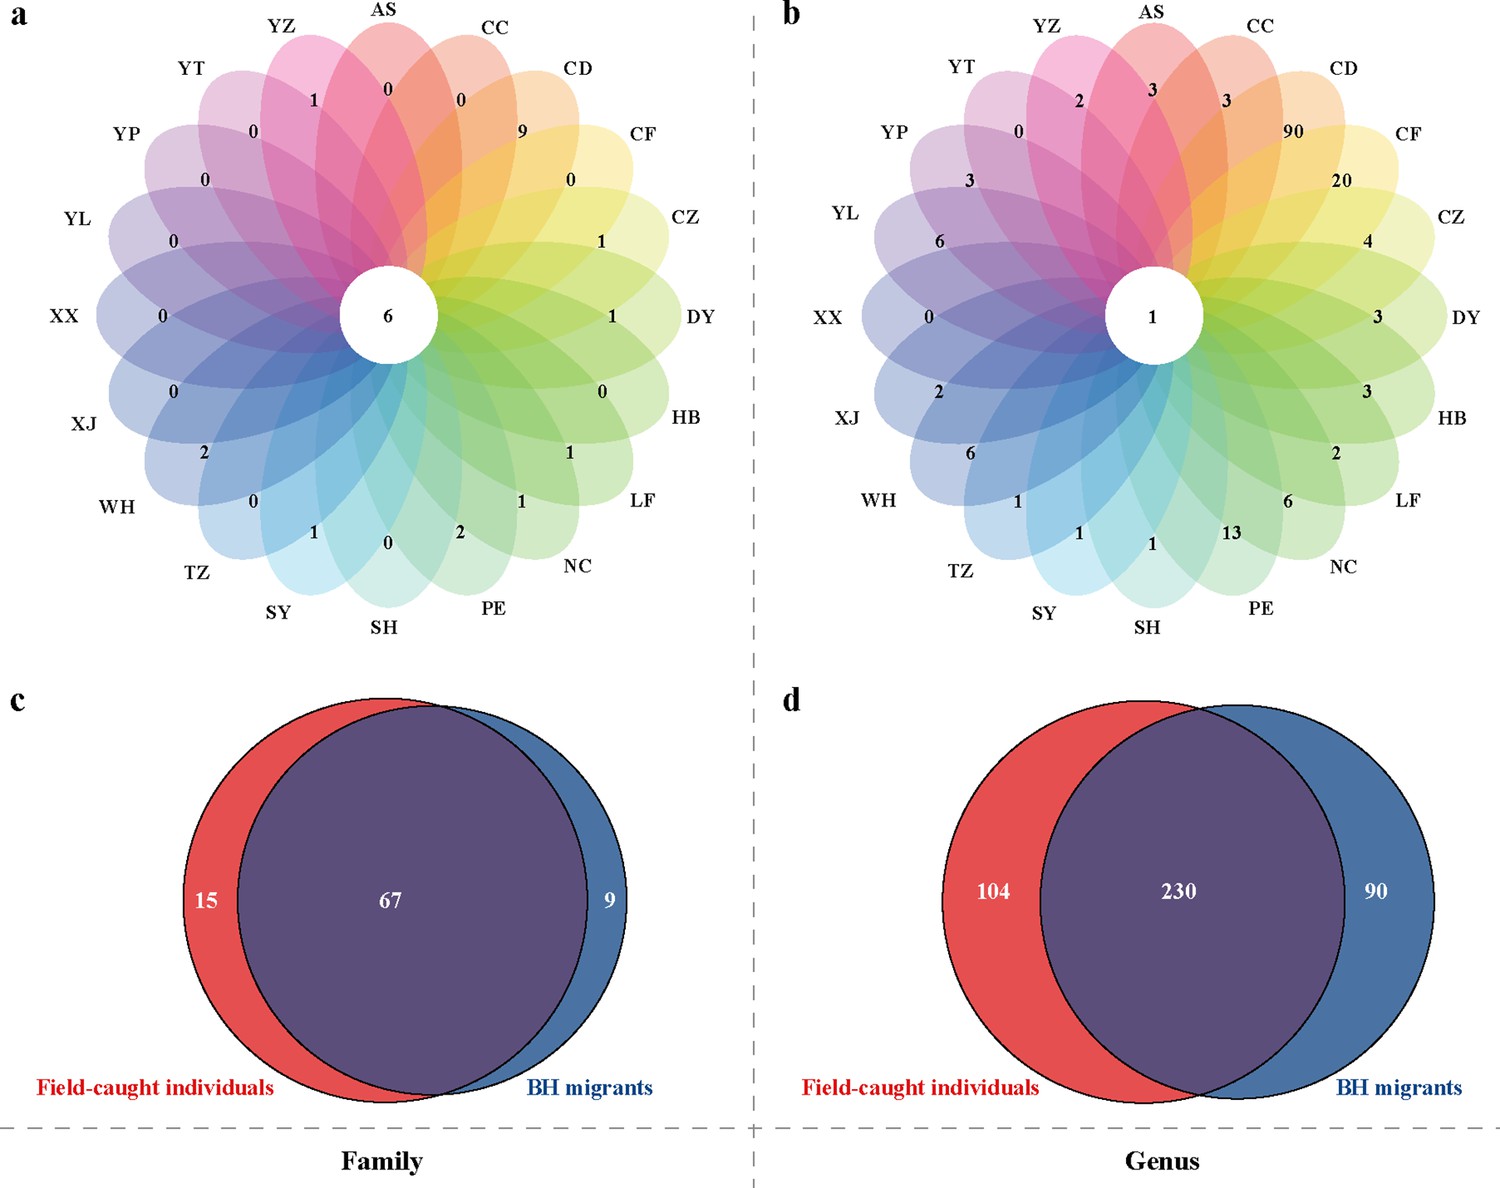
Spatial variability in E. balteatus host plant usage at 20 sites across China, as inferred through molecular gut content analysis.
Venn analysis for host plants across different regions, with plant hosts specified at the family (Panel a) or genus (Panel b) level. Venn diagram showing the common and unique host plants associated with BH E. balteatus migrants or field-collected individuals. Plant hosts are specified at the family (Panel c) or genus (Panel d) level. For the site names see Figure 2.
Figure 7—figure supplement 4
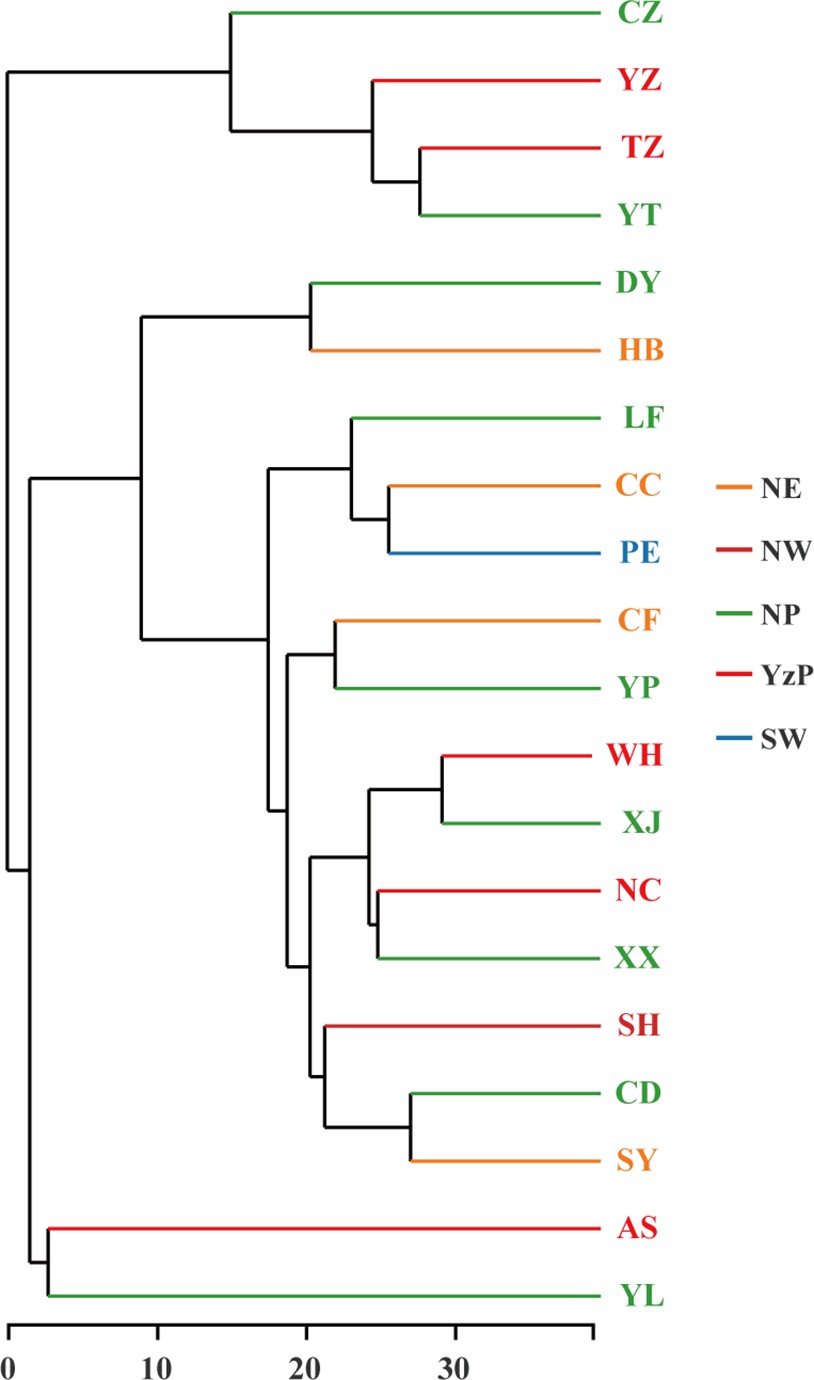
Hierarchical clustering tree for plant hosts among different populations, as specified at the genus level.
Figure 7—figure supplement 5
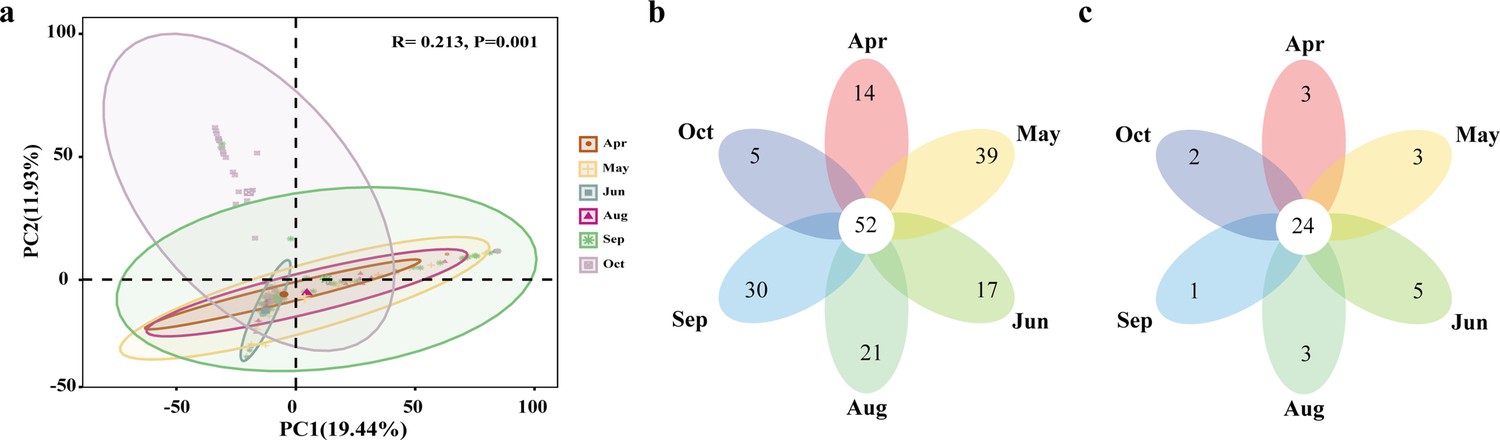
Temporal shifts in host plant usage of E. balteatus migrants on BH during different migrating seasons, as determined by molecular gut content analysis.
(a) Principal coordinate analysis (PCoA) of the host plants based on the unweighted UniFrac distance metrics on genus level. ANOSIM, R = 0.213, p = 0.001. Venn analysis for plant hosts during different migration seasons, with plants specified at genus (b) and family (c) levels, respectively.
Figure 7—figure supplement 6
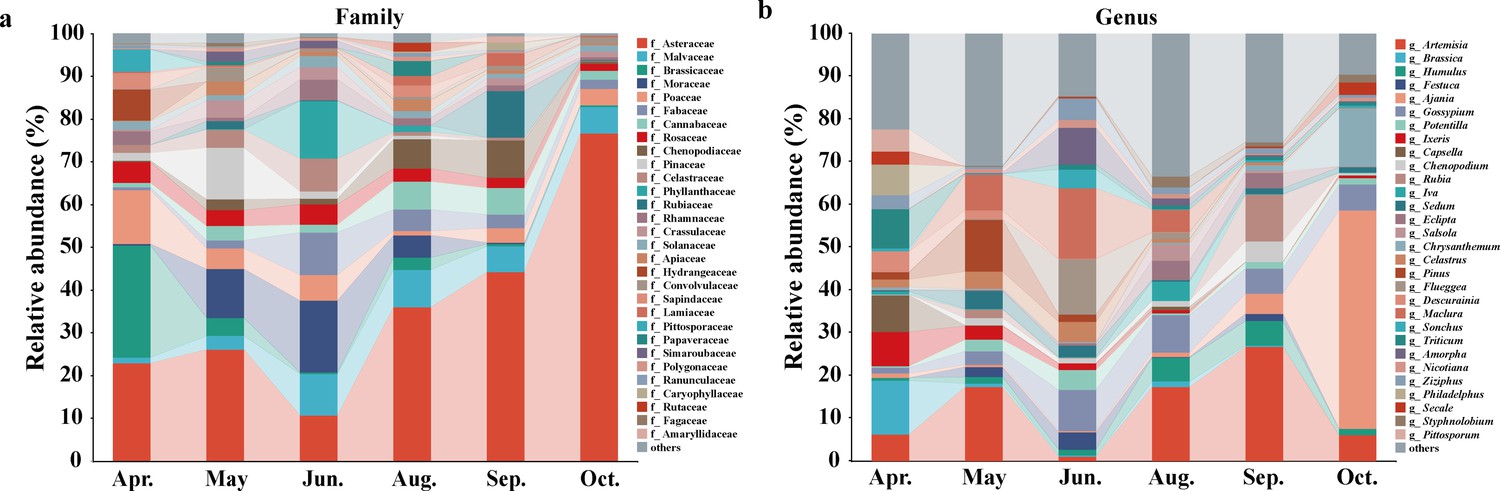
Temporal shifts in host plant usage for E. balteatus migrants on BH, as determined through molecular gut content analysis.
Relative abundance of the 30 most common plant taxa is shown throughout the E. balteatus migration season, with patterns plotted at the family (Panel a) or genus level (Panel b).
Figure 7—figure supplement 7

Top 30 plant genera prioritized by random forest analysis and ranked by the mean decrease in accuracy.
Figure 7—figure supplement 8
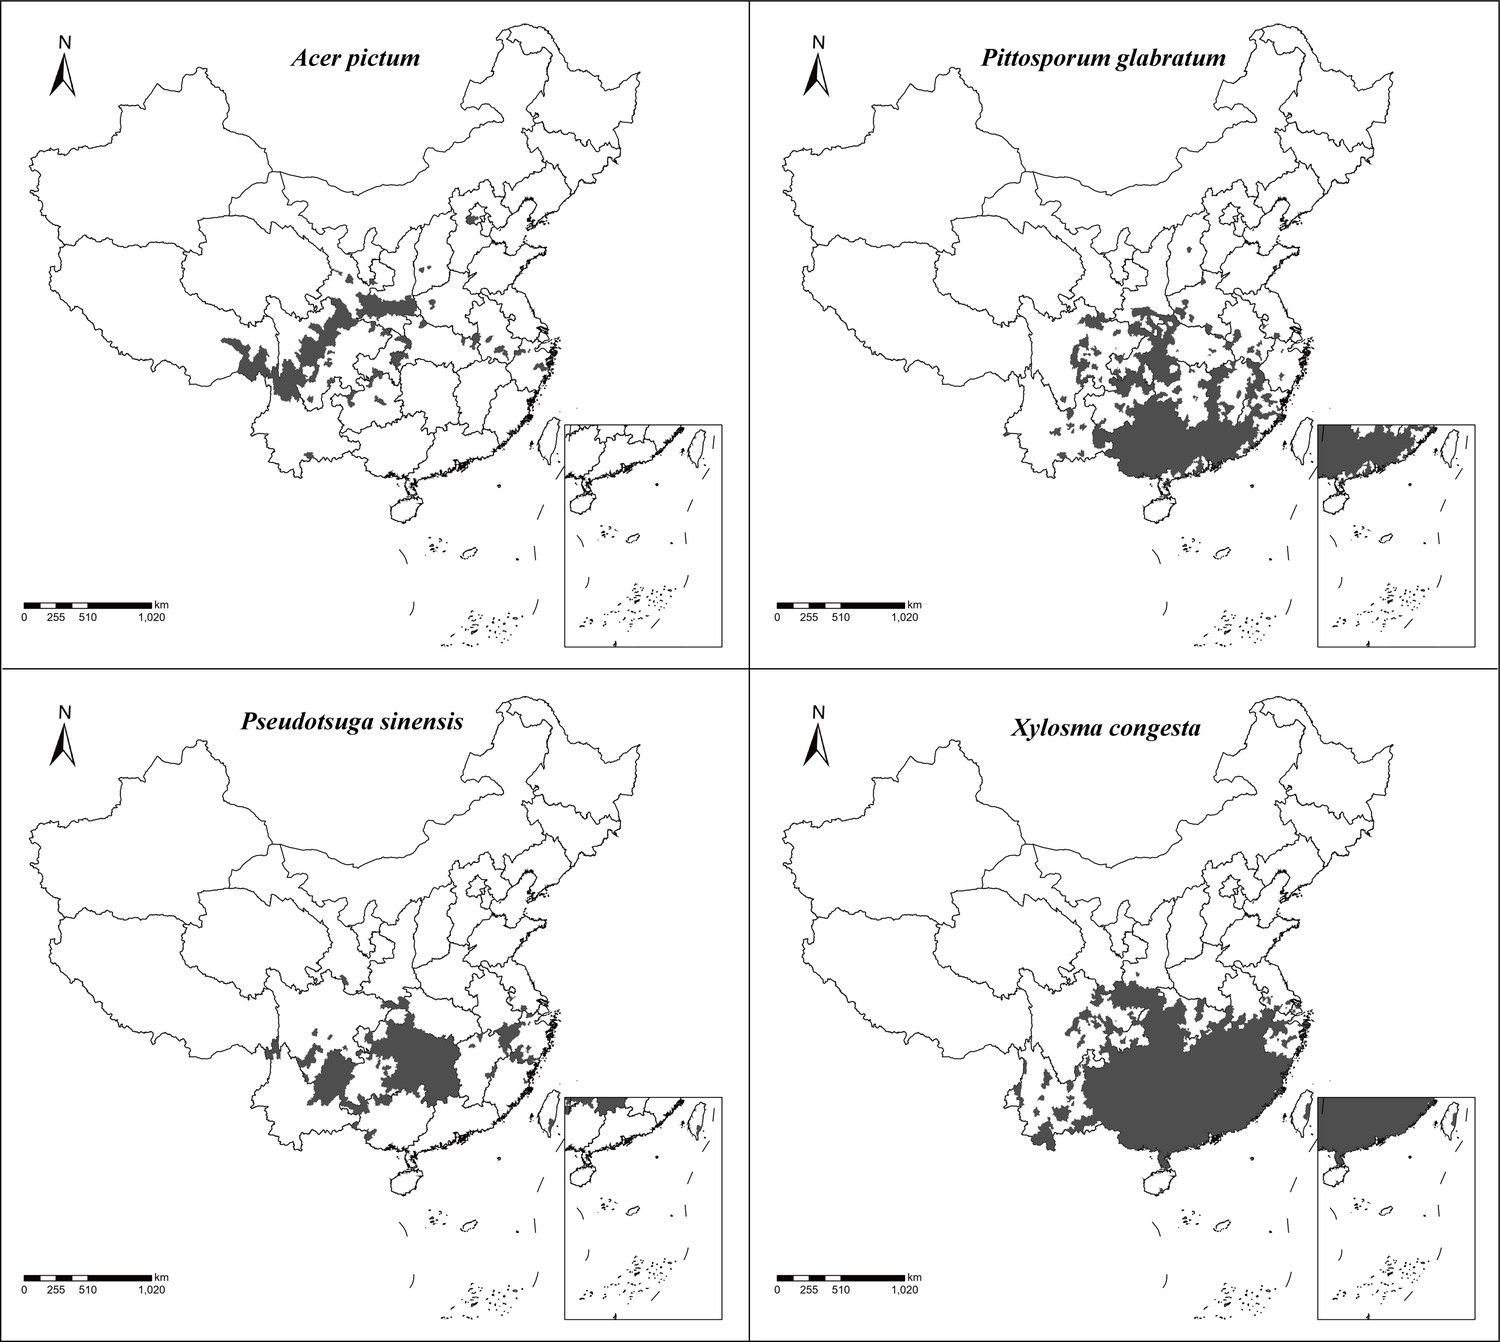
Geographical distribution of plant species that help delineate E. balteatus migration patterns.
Maps show the (district-level) geographical distribution of individual plant species.
Tables
Table 1
Genetic diversity indices of 18 E. balteatus populations based on Cytb and 18S-28S rRNA gene.
For each population (and sampling location), the following metrics are reported: N, sample size; S, number of segregating sites; H, number of haplotypes; Hd, haplotype diversity; K, average number of differences; Pi, nucleotide diversity. For the site names see Figure 2.
| Site code | CytB | 18S-28S rRNA | ||||||||||||
|---|---|---|---|---|---|---|---|---|---|---|---|---|---|---|
| N | S | H | Hd | K | Pi | PiJC | N | S | H | Hd | K | Pi | PiJC | |
| LF | 23 | 37 | 7 | 0.46245 | 3.92095 | 0.00536 | 0.00543 | 12 | 25 | 8 | 0.84848 | 5.51515 | 0.00452 | 0.00454 |
| XX | 42 | 6 | 5 | 0.33682 | 0.45296 | 0.00062 | 0.00062 | 16 | 31 | 10 | 0.825 | 4.79167 | 0.00392 | 0.00394 |
| HB | 23 | 1 | 2 | 0.08696 | 0.08696 | 0.00012 | 0.00012 | 18 | 28 | 10 | 0.81046 | 5.60784 | 0.00459 | 0.00461 |
| WH | 34 | 10 | 5 | 0.2246 | 0.58824 | 0.0008 | 0.00081 | 12 | 32 | 9 | 0.90909 | 6.90909 | 0.00566 | 0.00569 |
| CC | 16 | 28 | 7 | 0.625 | 3.5 | 0.00478 | 0.00482 | 11 | 22 | 10 | 0.98182 | 5.63636 | 0.00462 | 0.00464 |
| NC | 21 | 12 | 5 | 0.35238 | 1.65714 | 0.00226 | 0.00228 | 15 | 45 | 12 | 0.94286 | 9.61905 | 0.00788 | 0.00793 |
| SY | 45 | 16 | 6 | 0.25051 | 0.75354 | 0.00103 | 0.00104 | 21 | 49 | 18 | 0.98095 | 9.2619 | 0.00759 | 0.00764 |
| CF | 27 | 21 | 8 | 0.45869 | 2.02849 | 0.00277 | 0.00279 | 16 | 39 | 16 | 1 | 9.00833 | 0.00738 | 0.00742 |
| XJ | 25 | 1 | 2 | 0.08 | 0.08 | 0.00011 | 0.00011 | 18 | 31 | 13 | 0.95425 | 6.71895 | 0.0055 | 0.00553 |
| YT | 29 | 22 | 5 | 0.31773 | 1.95074 | 0.00266 | 0.00268 | 16 | 34 | 12 | 0.95833 | 7.8 | 0.00639 | 0.00643 |
| YP | 18 | 8 | 3 | 0.21569 | 0.88889 | 0.00121 | 0.00122 | 8 | 38 | 8 | 1 | 12.89286 | 0.01056 | 0.01064 |
| YL | 30 | 4 | 6 | 0.31034 | 0.33103 | 0.00045 | 0.00045 | 14 | 35 | 14 | 1 | 8.56044 | 0.00701 | 0.00705 |
| TZ | 28 | 2 | 3 | 0.14021 | 0.14286 | 0.0002 | 0.0002 | N/A | N/A | N/A | N/A | N/A | N/A | N/A |
| PE | 18 | 7 | 4 | 0.47059 | 1.79739 | 0.00246 | 0.00247 | 11 | 98 | 11 | 1 | 22.96364 | 0.01881 | 0.01922 |
| YZ | 31 | 4 | 5 | 0.24516 | 0.25806 | 0.00035 | 0.00035 | 10 | 72 | 9 | 0.97778 | 15.62222 | 0.01279 | 0.01309 |
| SH | 7 | 8 | 5 | 0.85714 | 2.28571 | 0.00312 | 0.00313 | N/A | N/A | N/A | N/A | N/A | N/A | N/A |
| CDI | 52 | 43 | 16 | 0.52413 | 2.30166 | 0.00314 | 0.00316 | 25 | 103 | 21 | 0.97667 | 16.9 | 0.01384 | 0.01413 |
| CDII | 61 | 48 | 17 | 0.48251 | 1.70055 | 0.00232 | 0.00234 | 37 | 65 | 28 | 0.98198 | 9.15165 | 0.0075 | 0.00754 |
Additional files
-
Supplementary file 1
Data supporting the findings of this study.
(a) Mass migration events of E. balteatus across the Bohai Strait observed by the searchlight trapping on BH Island during 2003–2018. (b) Collection information for sample in the study. (c) Pollen carrying rate of the migratory E. balteatus hoverflies across Bohai Sea during 2014–2018. (d) Quantitative PCR (qPCR) primers and conditions used in this study. (e) Key parameters within E. balteatus searchlight trapping on BH Island during 2003–2018. (f) The percentage of the total trajectories that ended in each region. (g) Results of analysis of molecular variance (AMOVA) test in different populations and regions of E.balteatus based on Cytb and18S-28S rRNA gene. (h) Comparative assessment of the degree of taxonomic identification obtained through either molecular or morphology-based approaches, for 46 different types of pollen grains dislocated from E. balteatus long-distance migrants collected on Beihuang Island (Bohai Sea, northeastern China). For each type of pollen grain, the highest level of taxonomic identification is indicated and contrasted between molecular and morphology-based approaches.
- https://cdn.elifesciences.org/articles/76230/elife-76230-supp1-v2.docx
-
Supplementary file 2
List of sequence information of each sample in molecular gut analysis.
- https://cdn.elifesciences.org/articles/76230/elife-76230-supp2-v2.xlsx
-
Supplementary file 3
Absolute abundance of host plants for each sample based on molecular gut analysis.
- https://cdn.elifesciences.org/articles/76230/elife-76230-supp3-v2.xlsx
-
Transparent reporting form
- https://cdn.elifesciences.org/articles/76230/elife-76230-transrepform1-v2.docx
Download links
A two-part list of links to download the article, or parts of the article, in various formats.
Downloads (link to download the article as PDF)
Open citations (links to open the citations from this article in various online reference manager services)
Cite this article (links to download the citations from this article in formats compatible with various reference manager tools)
Windborne migration amplifies insect-mediated pollination services
eLife 11:e76230.
https://doi.org/10.7554/eLife.76230


