Estimating the potential to prevent locally acquired HIV infections in a UNAIDS Fast-Track City, Amsterdam
- Department of Mathematics, Imperial College London, United Kingdom
- Amsterdam Institute for Global Health and Development, Netherlands
- Stichting HIV Monitoring, Netherlands
- Department of Hygiene, Epidemiology and Medical Statistics, University of Athens, Greece
- Center for Infectious Diseases Prevention and Control, National Institute for Public Health and the Environment (RIVM), Netherlands
- Department of Donor Medicine Research, Sanquin, Netherlands
- Department of Medical Microbiology, Onze Lieve Vrouwe Gasthuis, Netherlands
- Big Data Institute, Nuffield Department of Medicine, University of Oxford, United Kingdom
- Academic Medical Center, Netherlands
- Department of Global Health, Amsterdam University Medical Centers, Netherlands
- Division of Infectious Diseases, Department of Internal Medicine, Amsterdam Infection and Immunity Institute, Netherlands
Figures
Figure 1
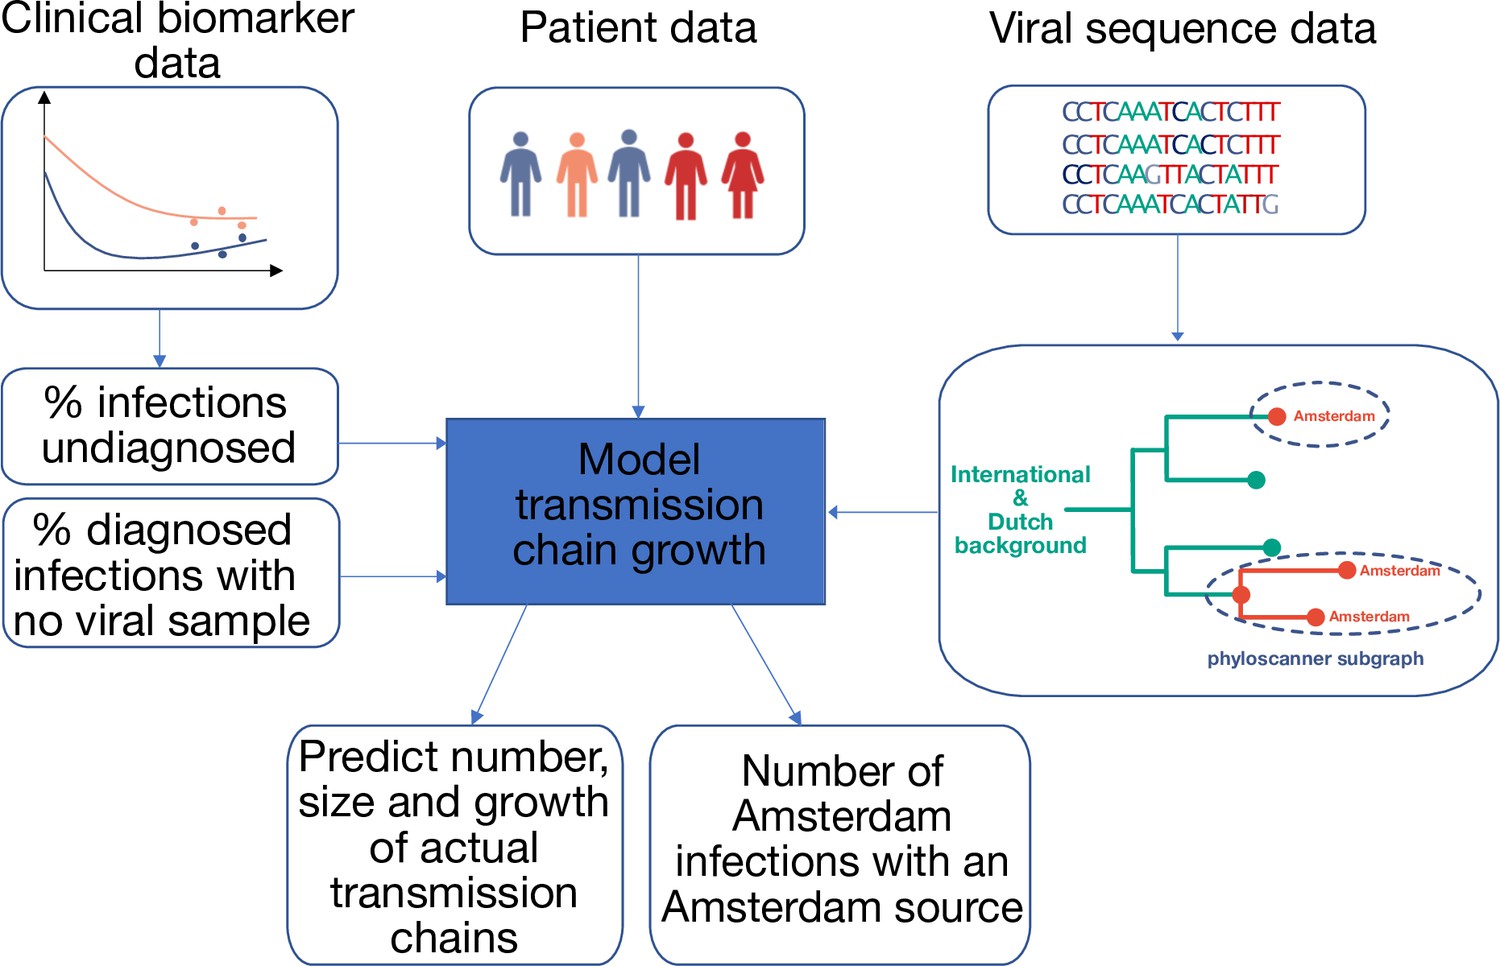
Approach to analysis.
Input data includes patient baseline data at registration, clinical biomarker data and viral sequence data. Biomarker data is used to estimate infection times, the proportion of undiagnosed infections, and thus the total population size of people living with HIV. HIV sequence data is used to reconstruct phylogenetic trees. Groups of Amsterdam residents with distinct virus are determined phylogeographically with phyloscanner, and without considering genetic distances or bootstrap support. Each such group of Amsterdam residents with distinct virus is interpreted as the partially observed part of a distinct transmission chain among Amsterdam residents, and analysed in calendar time based on the infection times estimated from individual biomarker data, as well as clinical data on viral suppression. The partial observations are used to infer the number, size and growth of the actual transmission chains among Amsterdam residents, and derive key epidemic quantities of interest.
Figure 2
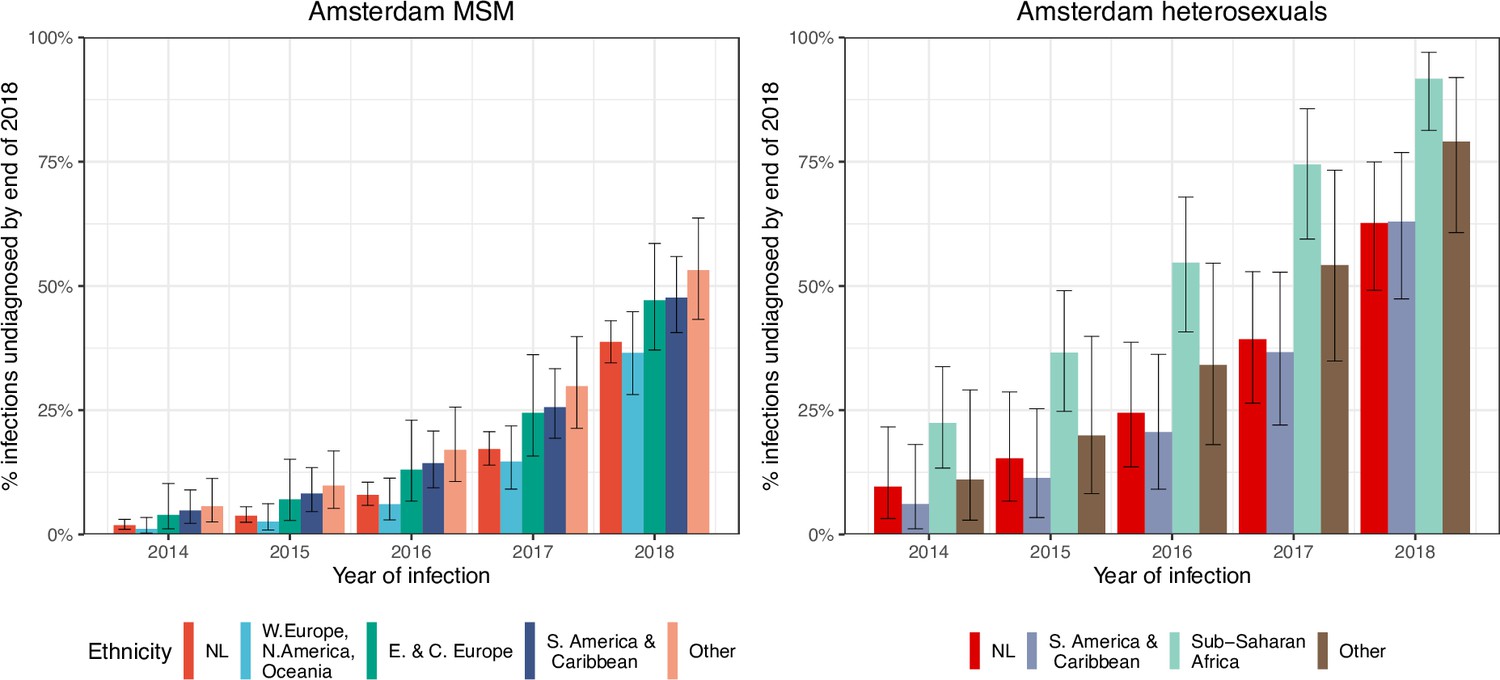
HIV infections in Amsterdam residents in 2014–2018 that remained undiagnosed by 1 May 2019.
Posterior median estimates are shown as bars and 95% credible intervals as error bars. Estimates generated from time-to-diagnosis estimates for 535 MSM and 97 heterosexuals.
Figure 3
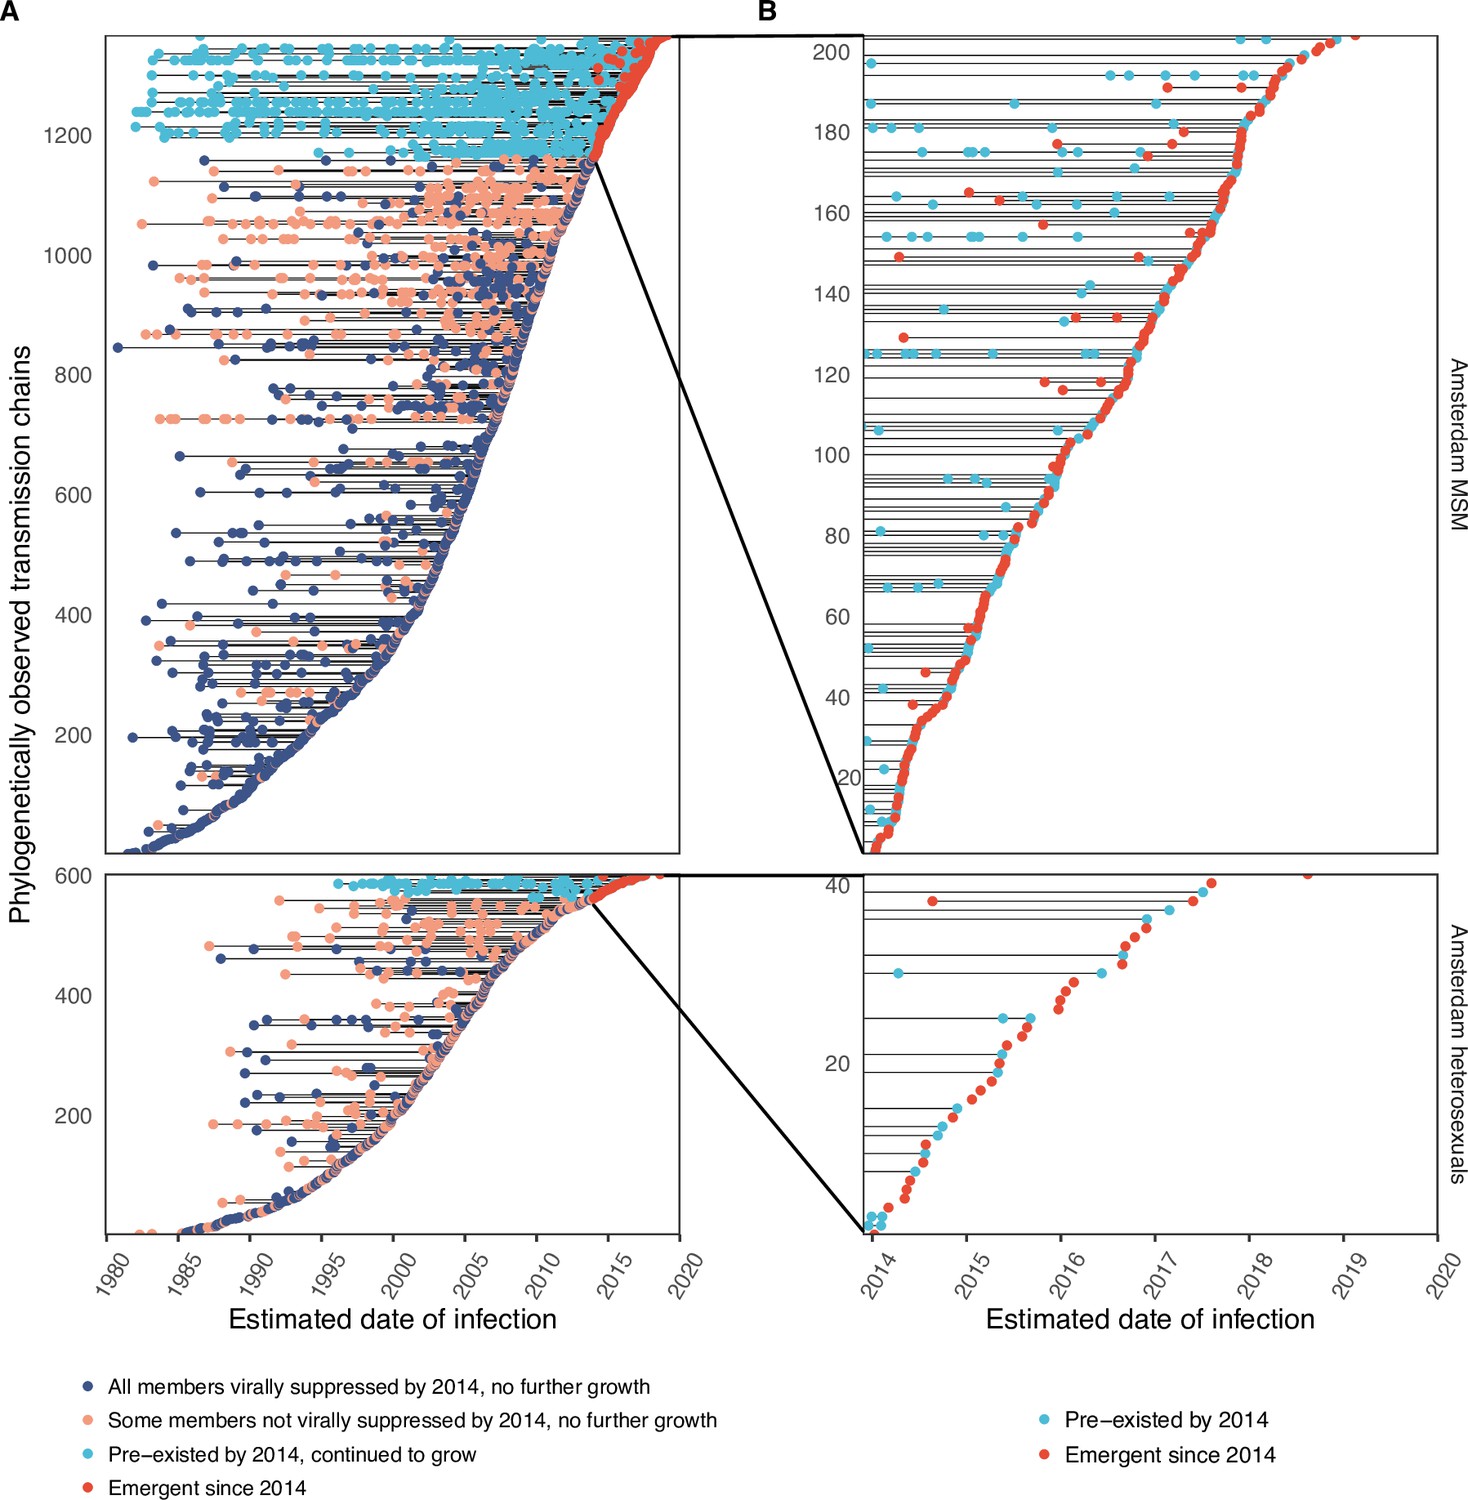
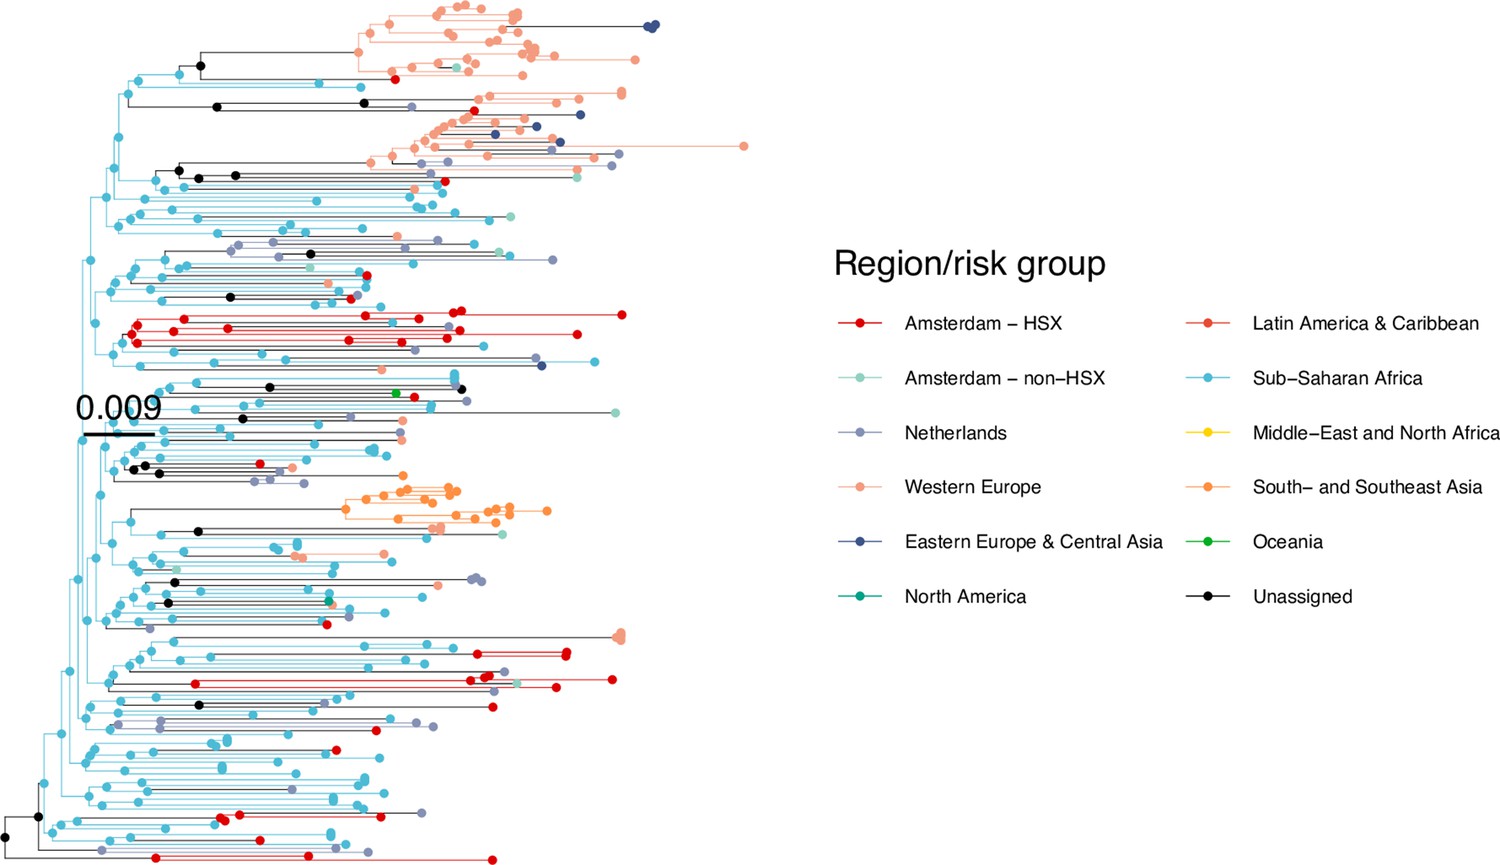
Phylogenetically observed parts of Amsterdam transmission chains.
(A) All chains. Horizontal lines connect individuals in reconstructed transmission chains in Amsterdam by chains which had no new case since 2014, and those which continued to grow or emerged, among MSM (top) and heterosexuals (bottom), in order of last diagnosis per chain. (B) Subset of chains in which at least one individual was estimated to have been infected since 2014. Data are presented as in subfigure A.
Figure 4
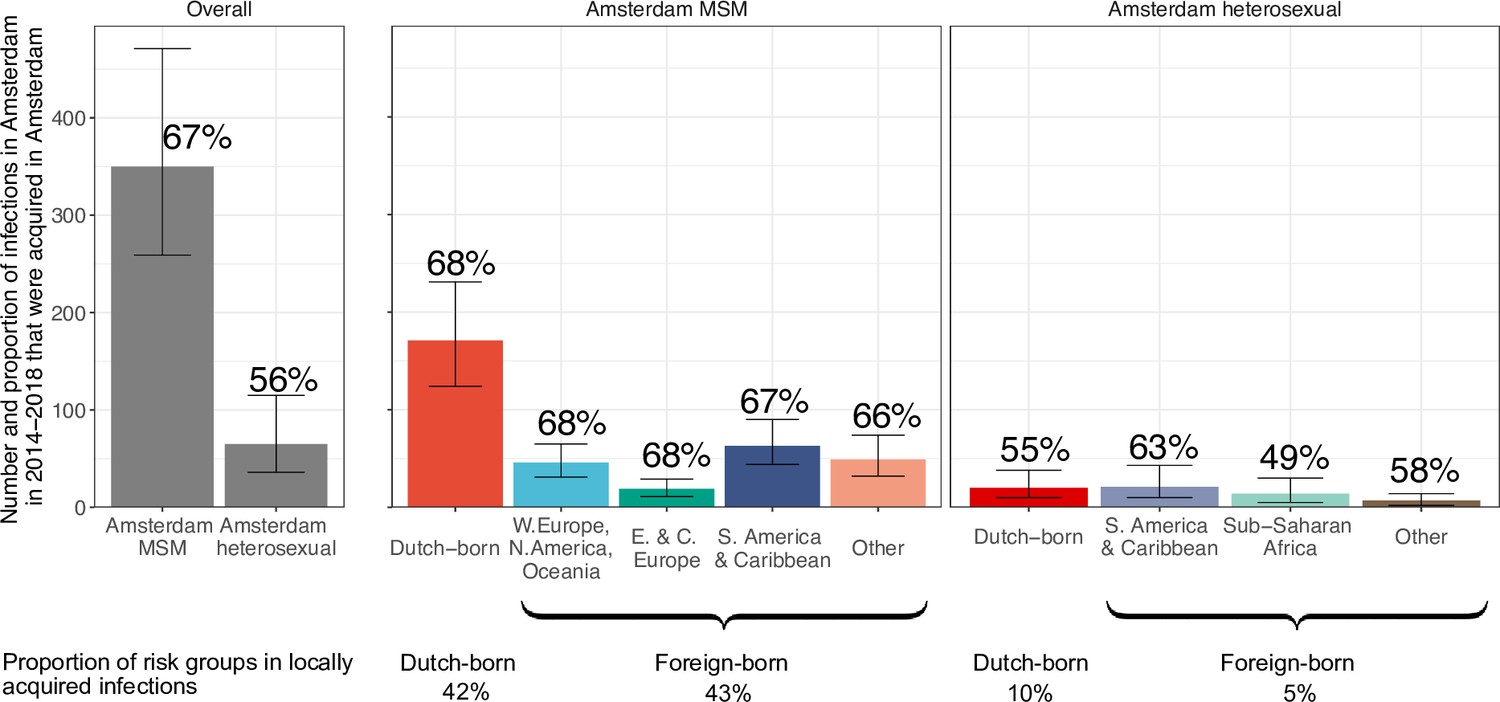
Estimated number of locally preventable infections in 2014–2018 along with 95% credible intervals, for MSM and heterosexuals stratified by region of birth.
Posterior median estimates of proportion (%) of preventable infections shown above bars. Estimates generated from 203 phylogenetic subgraphs among Amsterdam MSM, containing 297 individuals, and 41 subgraphs among Amsterdam heterosexuals, containing 44 individuals.
Appendix 1—figure 1
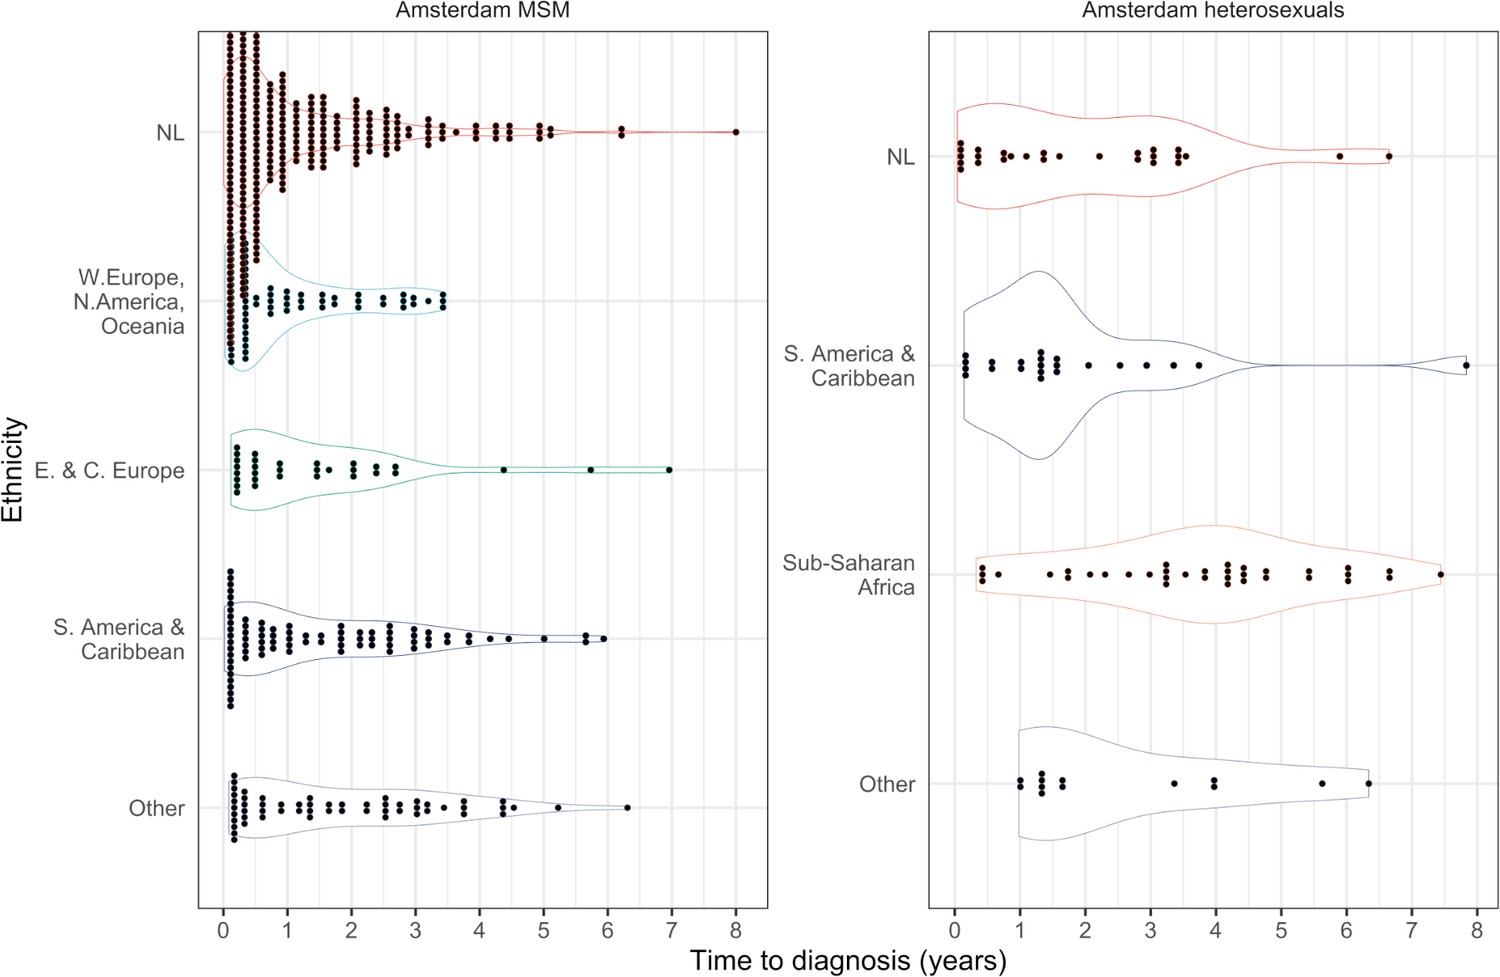
Distribution of individual level posterior median estimated times to diagnosis by place of birth, for Amsterdam MSM and heterosexuals.
Appendix 1—figure 2
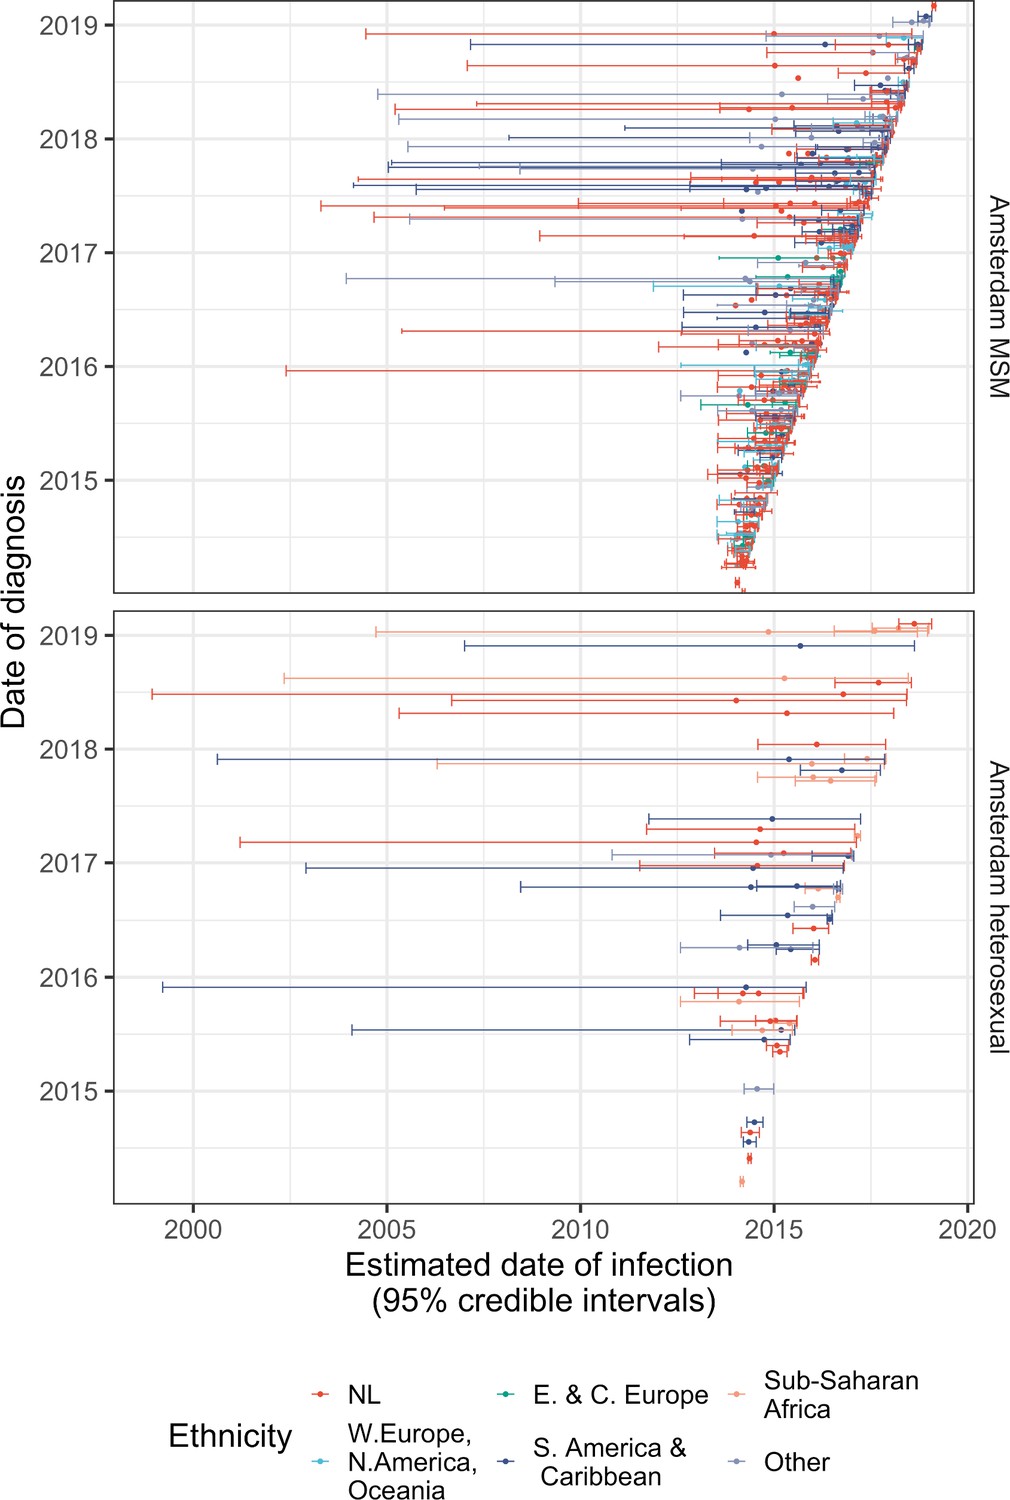
Diagnosis date and posterior median estimated infection date (with 95% credible interval) of individuals in Amsterdam diagnosed between January 2014 and May 2019.
Appendix 1—figure 3
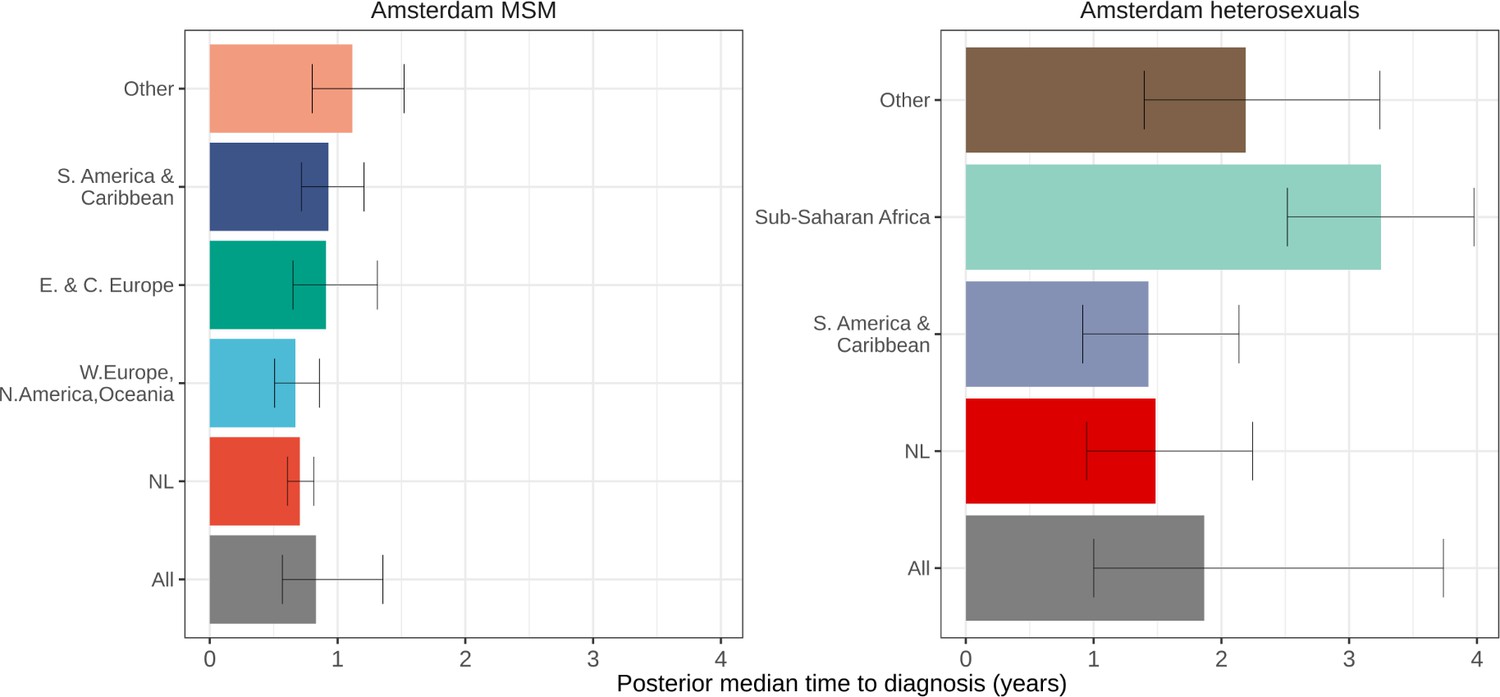
Posterior median estimated time to diagnosis (with 95% credible interval) of HIV infections in Amsterdam occurring in 2014-2018, stratified by risk group (MSM and heterosexuals) and place of birth.
Estimates generated from time-to-diagnosis estimates for 535 MSM and 97 heterosexuals.
Appendix 1—figure 4

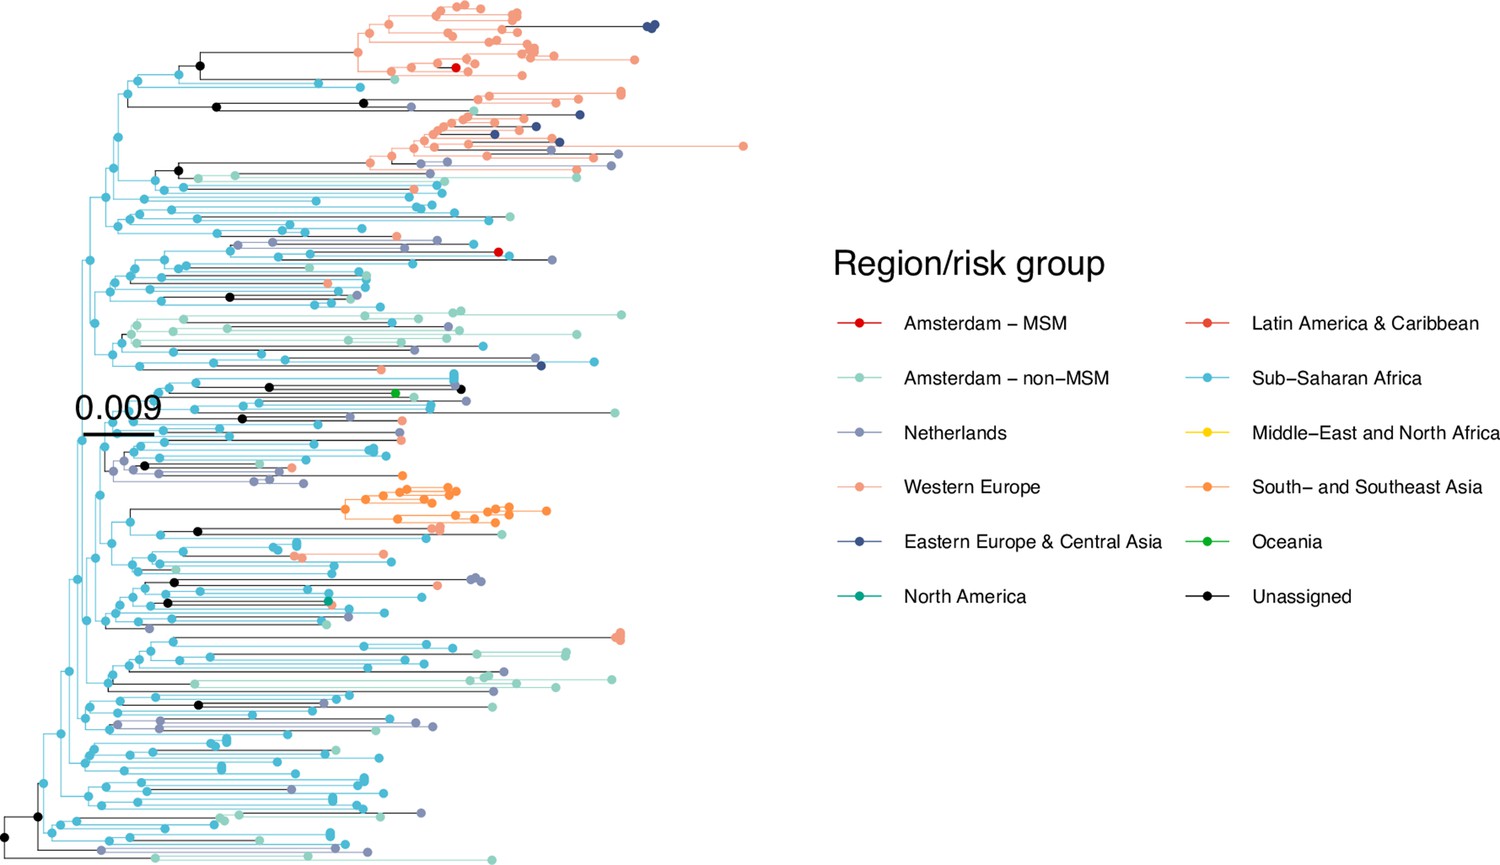
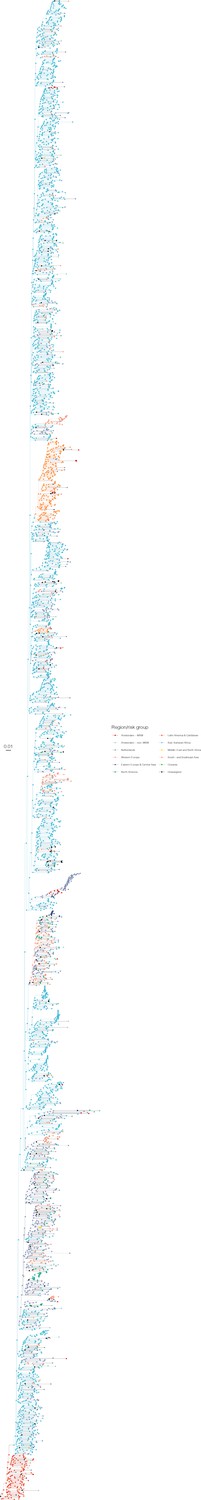
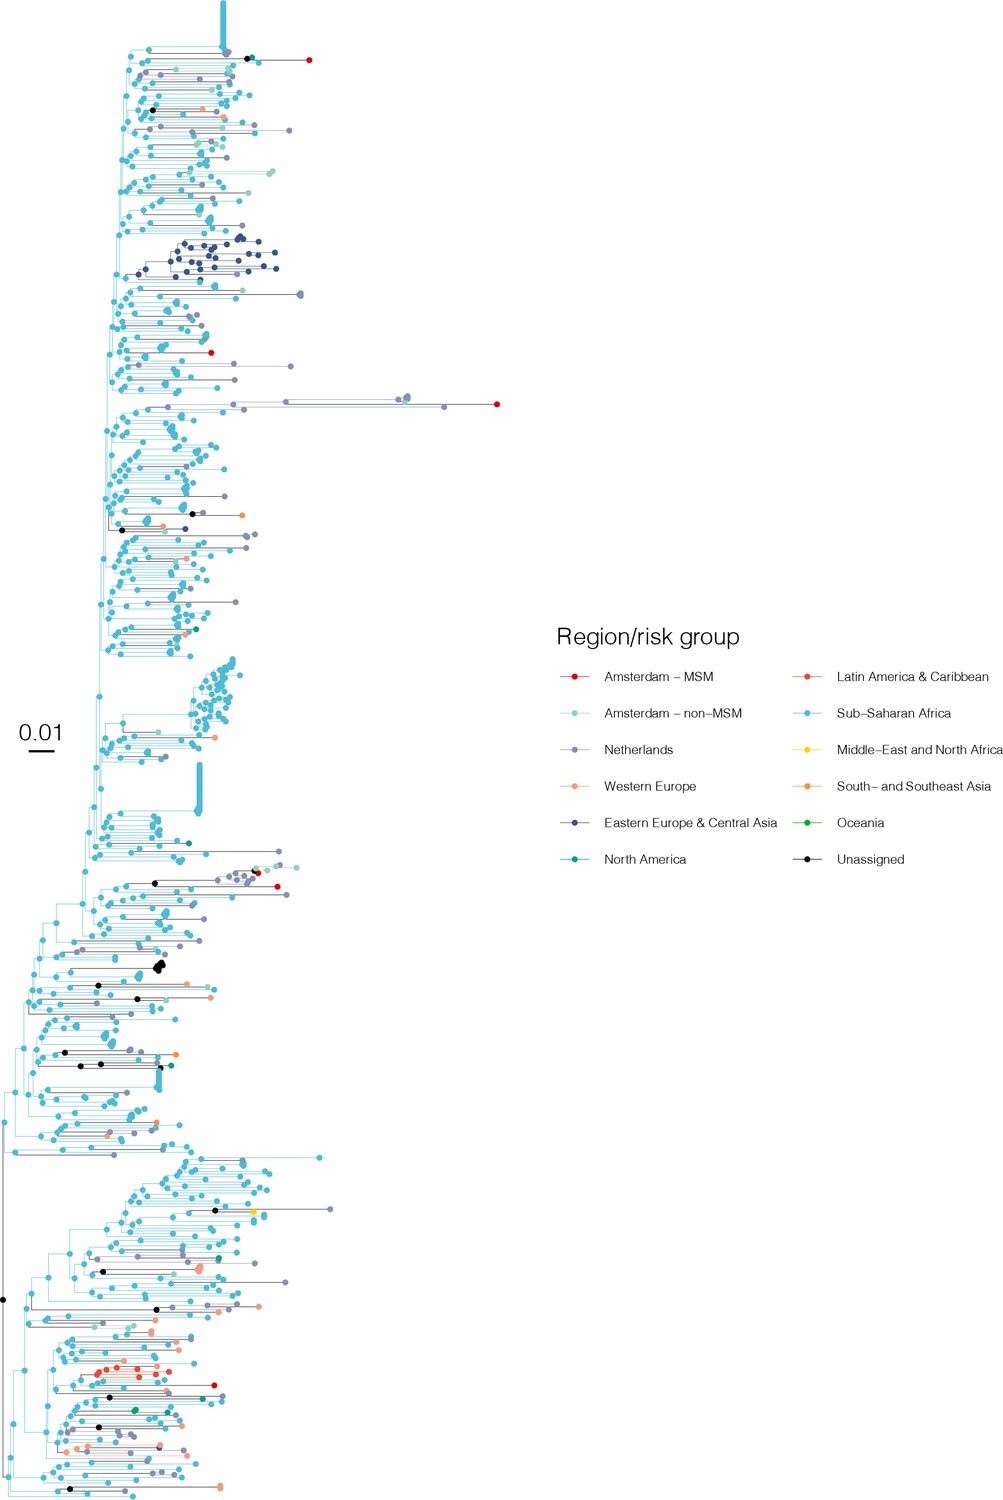
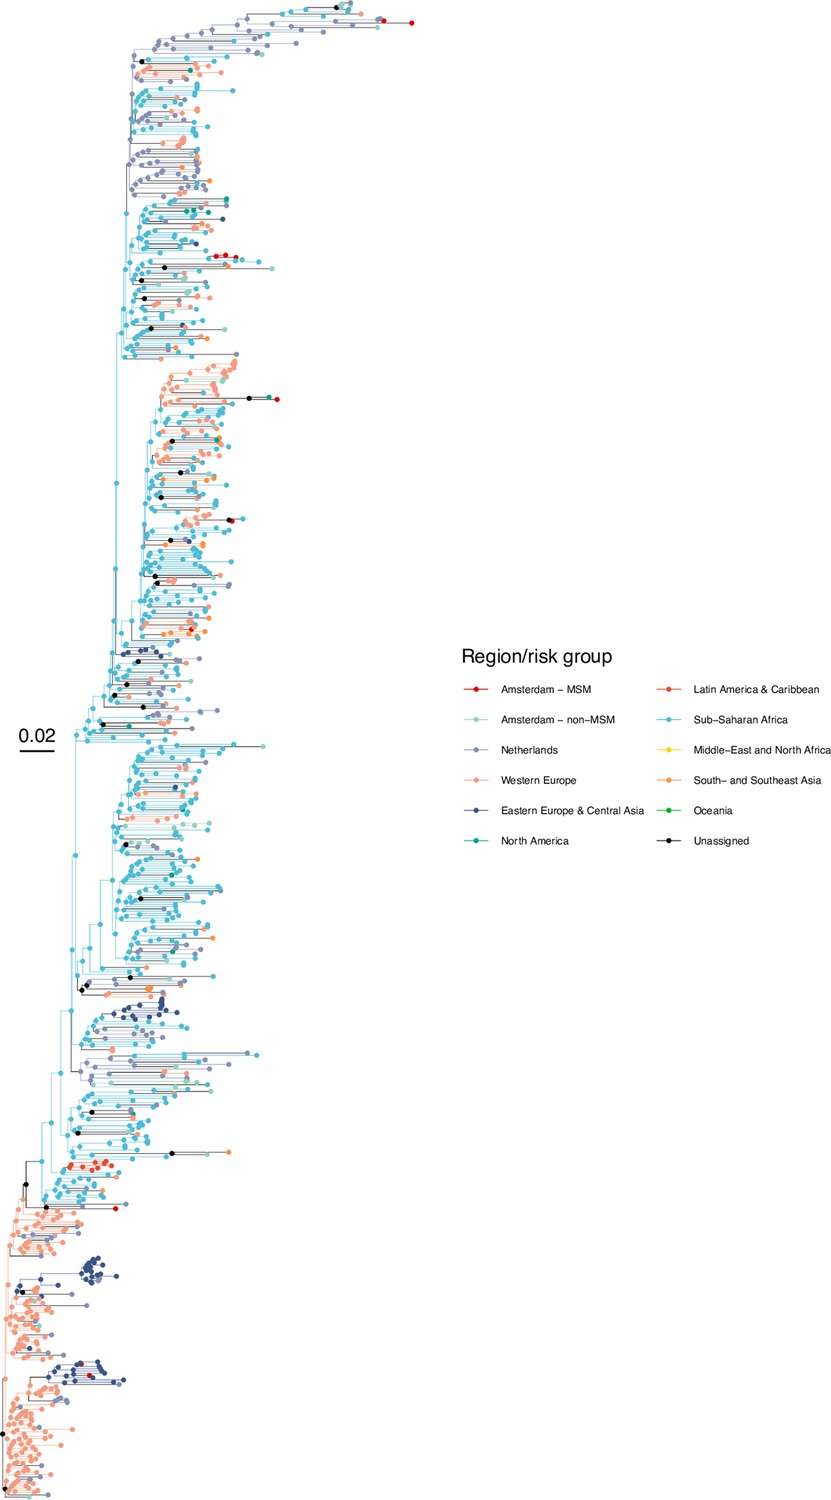
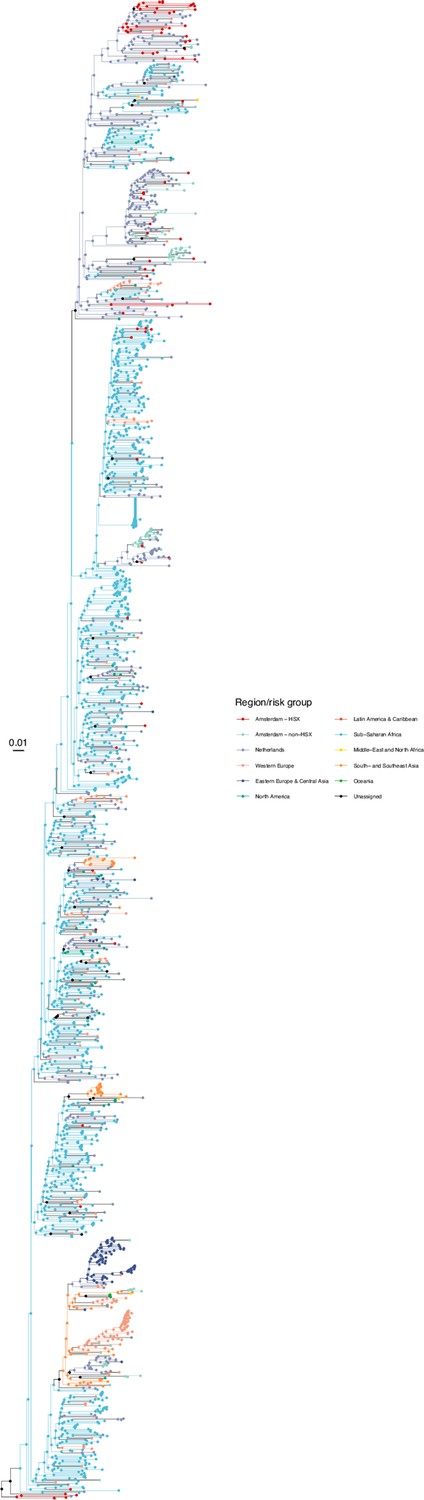
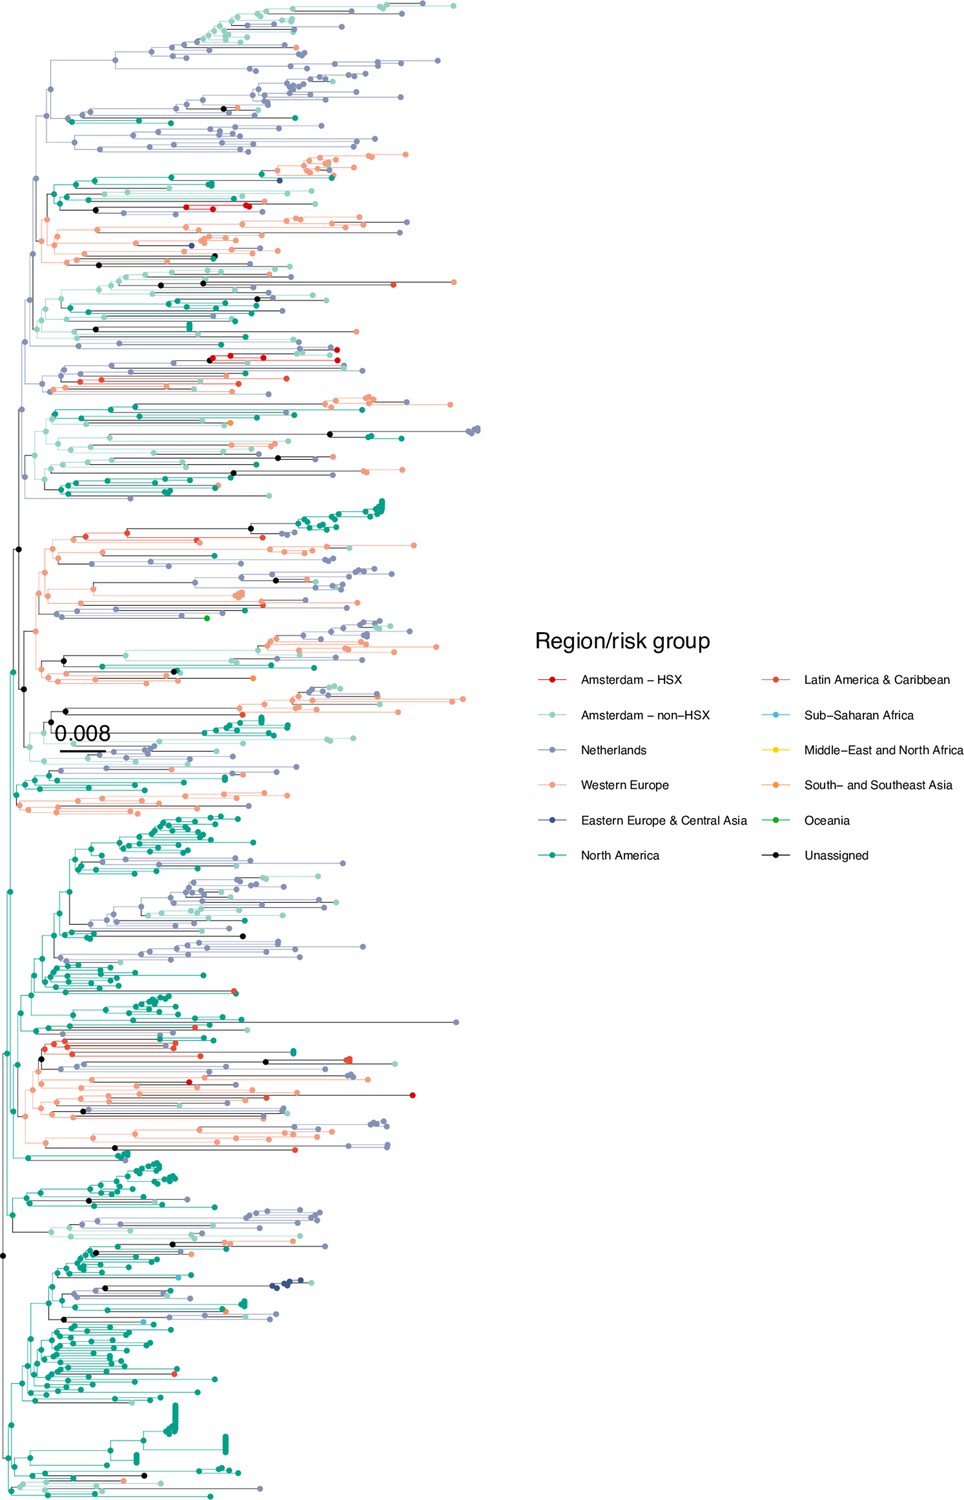
Annotated phylogeny of viral sequences of subtype A1 of Amsterdam MSM and background individuals.
Colours of tips show the observed states of each observed sequence, and colours of lineages represent inferred states. States were assigned to each sequence as described in Equation S22, and represent both transmission group (MSM, non-MSM) and place of birth or residence.
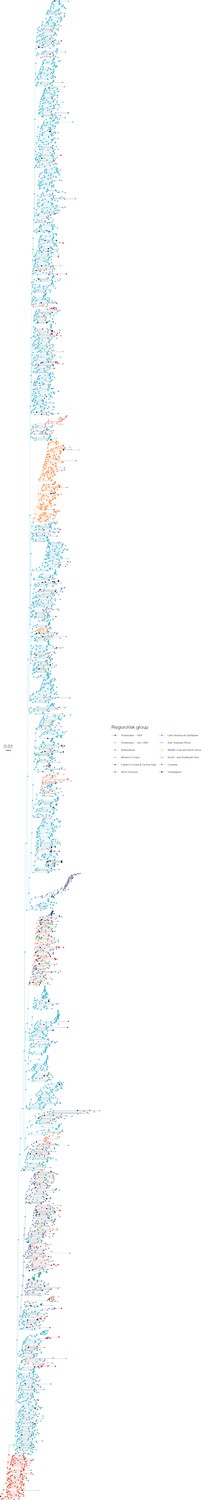
Appendix 1—figure 5

Annotated phylogeny of viral sequences of circulating recombinant form 02AG of Amsterdam MSM and background individuals.
Colours of tips show the observed states of each observed sequence, and colours of lineages represent inferred states. States were assigned to each sequence as described in Equation S22, and represent both transmission group (MSM, non-MSM) and place of birth or residence.
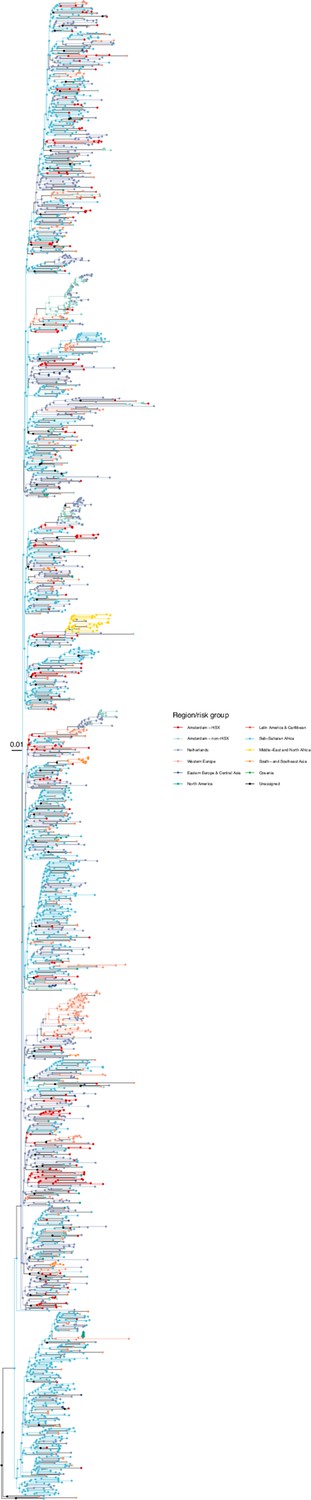
Appendix 1—figure 6
Annotated phylogeny of viral sequences of circulating recombinant form 01AE of Amsterdam MSM and background individuals.
Colours of tips show the observed states of each observed sequence, and colours of lineages represent inferred states. States were assigned to each sequence as described in Equation S22, and represent both transmission group (MSM, non-MSM) and place of birth or residence.
Appendix 1—figure 7
Annotated phylogeny of viral sequences of circulating recombinant form 06cpx of Amsterdam MSM and background individuals.
Colours of tips show the observed states of each observed sequence, and colours of lineages represent inferred states. States were assigned to each sequence as described in Equation S22, and represent both transmission group (MSM, non-MSM) and place of birth or residence.
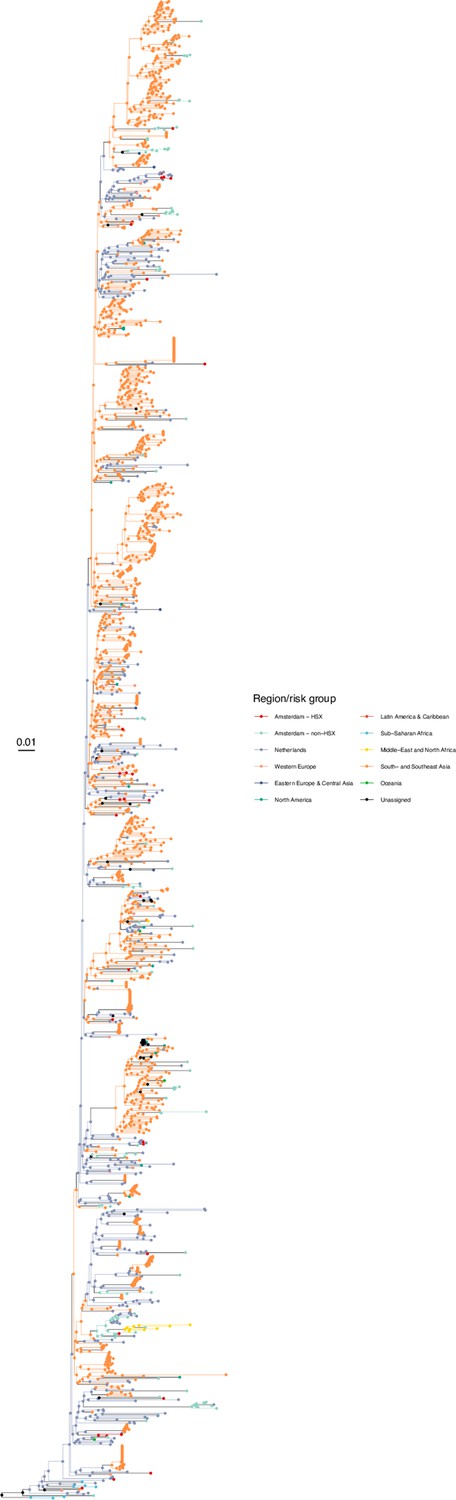
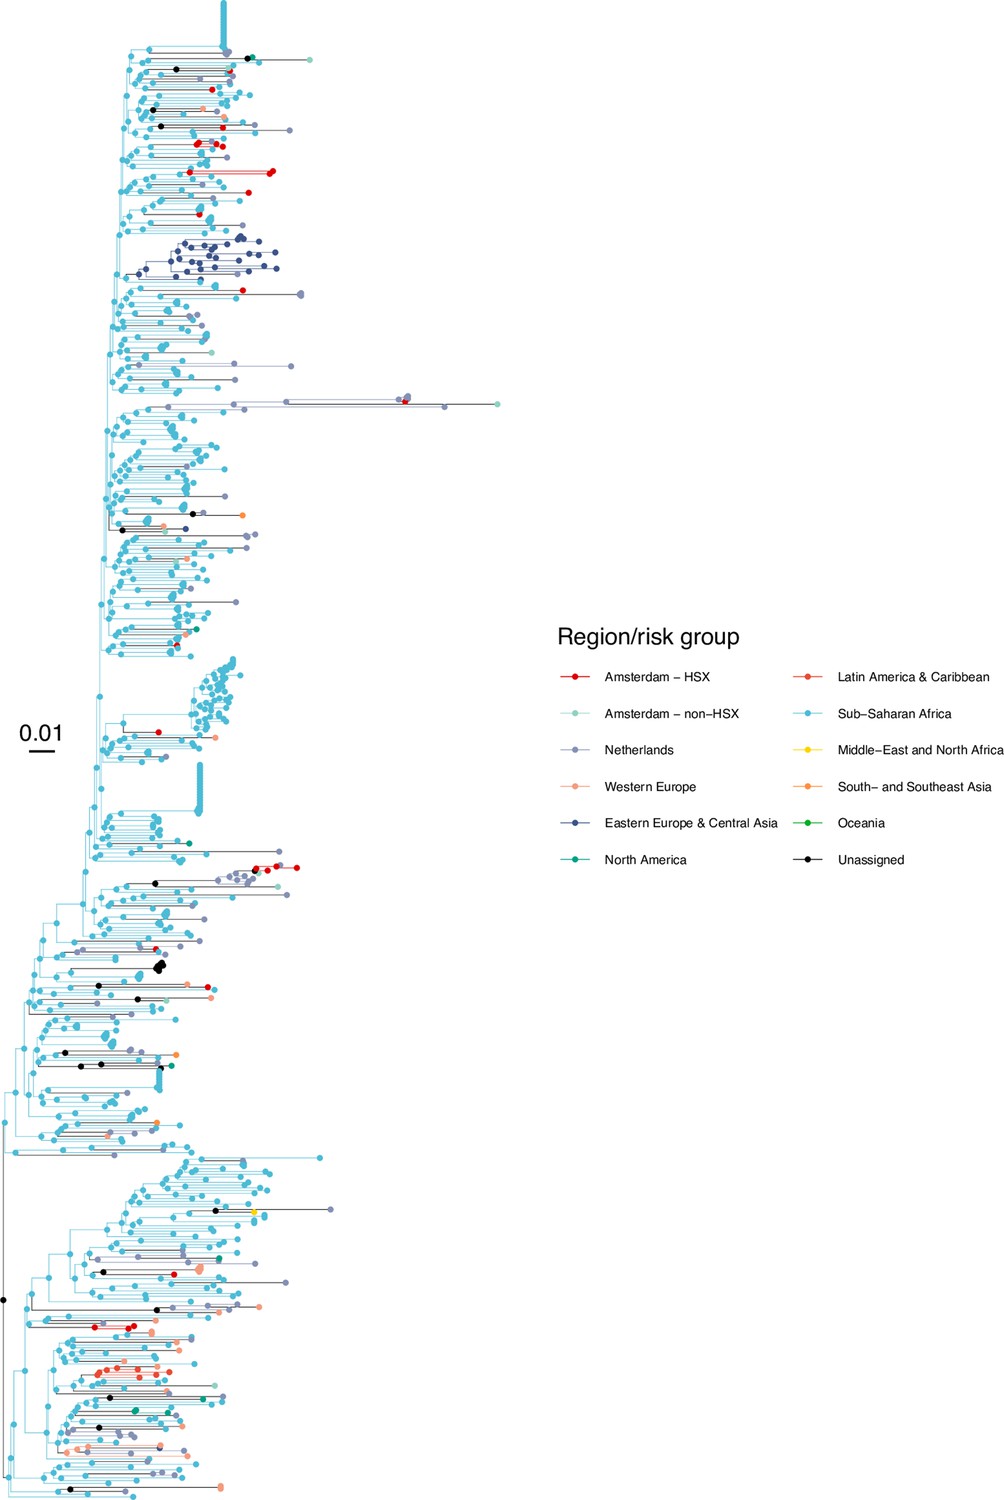
Appendix 1—figure 8

Annotated phylogeny of viral sequences of a sub-clade of subtype B of Amsterdam MSM and background individuals.
Colours of tips show the observed states of each observed sequence, and colours of lineages represent inferred states. States were assigned to each sequence as described in Equation S22, and represent both transmission group (MSM, non-MSM) and place of birth or residence.
Appendix 1—figure 9

Annotated phylogeny of viral sequences of a sub-clade of subtype B of Amsterdam MSM and background individuals.
Colours of tips show the observed states of each observed sequence, and colours of lineages represent inferred states. States were assigned to each sequence as described in Equation S22, and represent both transmission group (MSM, non-MSM) and place of birth or residence.
Appendix 1—figure 10

Annotated phylogeny of viral sequences of a sub-clade of subtype B of Amsterdam MSM and background individuals.
Colours of tips show the observed states of each observed sequence, and colours of lineages represent inferred states. States were assigned to each sequence as described in Equation S22, and represent both transmission group (MSM, non-MSM) and place of birth or residence.
Appendix 1—figure 11

Annotated phylogeny of viral sequences of a sub-clade of subtype B of Amsterdam MSM and background individuals.
Colours of tips show the observed states of each observed sequence, and colours of lineages represent inferred states. States were assigned to each sequence as described in Equation S22, and represent both transmission group (MSM, non-MSM) and place of birth or residence.
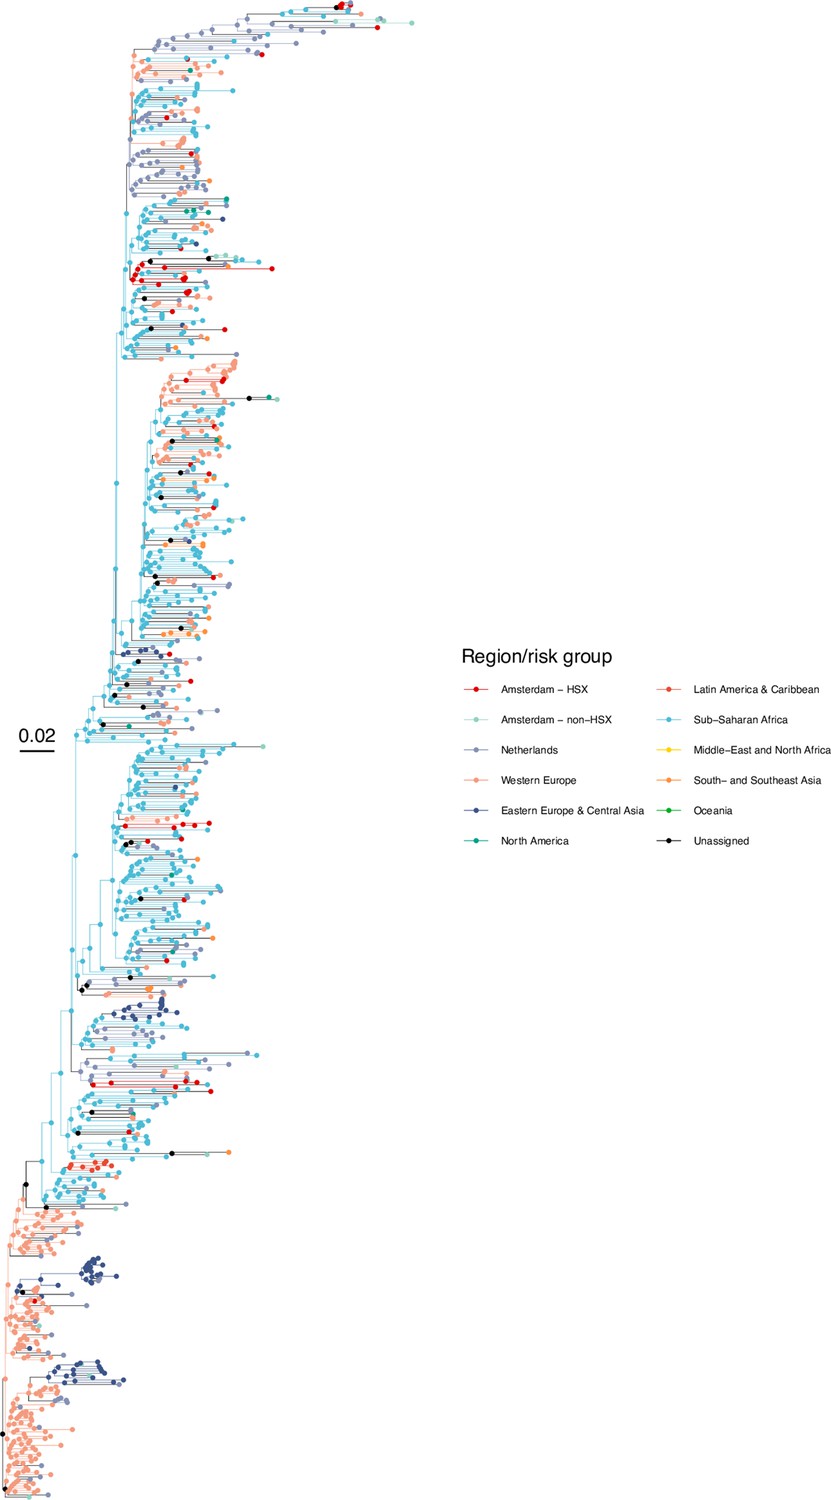
Appendix 1—figure 12
Annotated phylogeny of viral sequences of subtype C of Amsterdam MSM and background individuals.
Colours of tips show the observed states of each observed sequence, and colours of lineages represent inferred states. States were assigned to each sequence as described in Equation S22, and represent both transmission group (MSM, non-MSM) and place of birth or residence.
Appendix 1—figure 13
Annotated phylogeny of viral sequences of subtype D of Amsterdam MSM and background individuals.
Colours of tips show the observed states of each observed sequence, and colours of lineages represent inferred states. States were assigned to each sequence as described in Equation S22, and represent both transmission group (MSM, non-MSM) and place of birth or residence.
Appendix 1—figure 14
Annotated phylogeny of viral sequences of subtype G of Amsterdam MSM and background individuals.
Colours of tips show the observed states of each observed sequence, and colours of lineages represent inferred states. States were assigned to each sequence as described in Equation S22, and represent both transmission group (MSM, non-MSM) and place of birth or residence.
Appendix 1—figure 15
Annotated phylogeny of viral sequences of subtype A1 of Amsterdam heterosexual and background individuals.
Colours of tips show the observed states of each observed sequence, and colours of lineages represent inferred states. States were assigned to each sequence as described in Equation S23, and represent both transmission group (heterosexual, non-heterosexual) and place of birth or residence.
Appendix 1—figure 16
Annotated phylogeny of viral sequences of circulating recombinant form 02AG of Amsterdam heterosexual and background individuals.
Colours of tips show the observed states of each observed sequence, and colours of lineages represent inferred states. States were assigned to each sequence as described in Equation S23, and represent both transmission group (heterosexual, non-heterosexual) and place of birth or residence.
Appendix 1—figure 17
Annotated phylogeny of viral sequences of circulating recombinant form 01AE of Amsterdam heterosexual and background individuals.
Colours of tips show the observed states of each observed sequence, and colours of lineages represent inferred states. States were assigned to each sequence as described in Equation S23, and represent both transmission group (heterosexual, non-heterosexual) and place of birth or residence.
Appendix 1—figure 18
Annotated phylogeny of viral sequences of circulating recombinant form 06cpx of Amsterdam heterosexual and background individuals.
Colours of tips show the observed states of each observed sequence, and colours of lineages represent inferred states. States were assigned to each sequence as described in Equation S23, and represent both transmission group (heterosexual, non-heterosexual) and place of birth or residence.
Appendix 1—figure 19
Annotated phylogeny of viral sequences of a sub-clade of subtype B of Amsterdam heterosexual and background individuals.
Colours of tips show the observed states of each observed sequence, and colours of lineages represent inferred states. States were assigned to each sequence as described in Equation S23, and represent both transmission group (heterosexual, non-heterosexual) and place of birth or residence.
Appendix 1—figure 20

Annotated phylogeny of viral sequences of a sub-clade of subtype B of Amsterdam heterosexual and background individuals.
Colours of tips show the observed states of each observed sequence, and colours of lineages represent inferred states. States were assigned to each sequence as described in Equation S23, and represent both transmission group (heterosexual, non-heterosexual) and place of birth or residence.
Appendix 1—figure 21

Annotated phylogeny of viral sequences of a sub-clade of subtype B of Amsterdam heterosexual and background individuals.
Colours of tips show the observed states of each observed sequence, and colours of lineages represent inferred states. States were assigned to each sequence as described in Equation S23, and represent both transmission group (heterosexual, non-heterosexual) and place of birth or residence.
Appendix 1—figure 22

Annotated phylogeny of viral sequences of a sub-clade of subtype B of Amsterdam heterosexual and background individuals.
Colours of tips show the observed states of each observed sequence, and colours of lineages represent inferred states. States were assigned to each sequence as described in Equation S23, and represent both transmission group (heterosexual, non-heterosexual) and place of birth or residence.
Appendix 1—figure 23
Annotated phylogeny of viral sequences of subtype C of Amsterdam heterosexual and background individuals.
Colours of tips show the observed states of each observed sequence, and colours of lineages represent inferred states. States were assigned to each sequence as described in Equation S23, and represent both transmission group (heterosexual, non-heterosexual) and place of birth or residence.
Appendix 1—figure 24
Annotated phylogeny of viral sequences of subtype D of Amsterdam heterosexual and background individuals.
Colours of tips show the observed states of each observed sequence, and colours of lineages represent inferred states. States were assigned to each sequence as described in Equation S23, and represent both transmission group (heterosexual, non-heterosexual) and place of birth or residence.
Appendix 1—figure 25
Annotated phylogeny of viral sequences of subtype G of Amsterdam heterosexual and background individuals.
Colours of tips show the observed states of each observed sequence, and colours of lineages represent inferred states. States were assigned to each sequence as described in Equation S23, and represent both transmission group (heterosexual, non-heterosexual) and place of birth or residence.
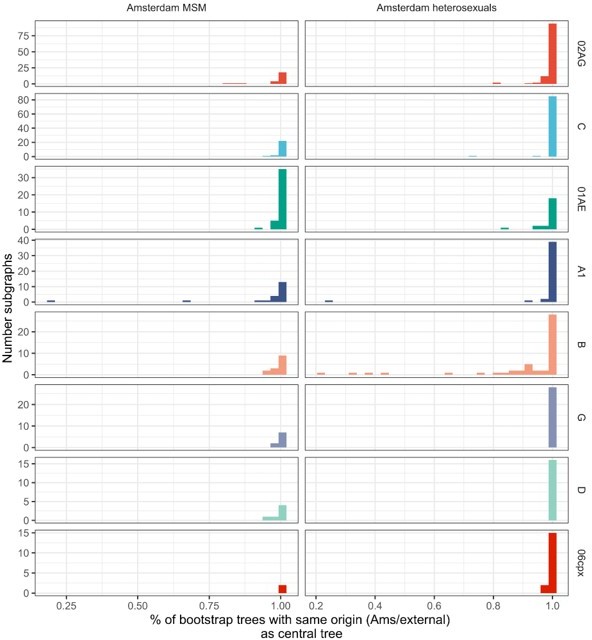
Appendix 1—figure 26
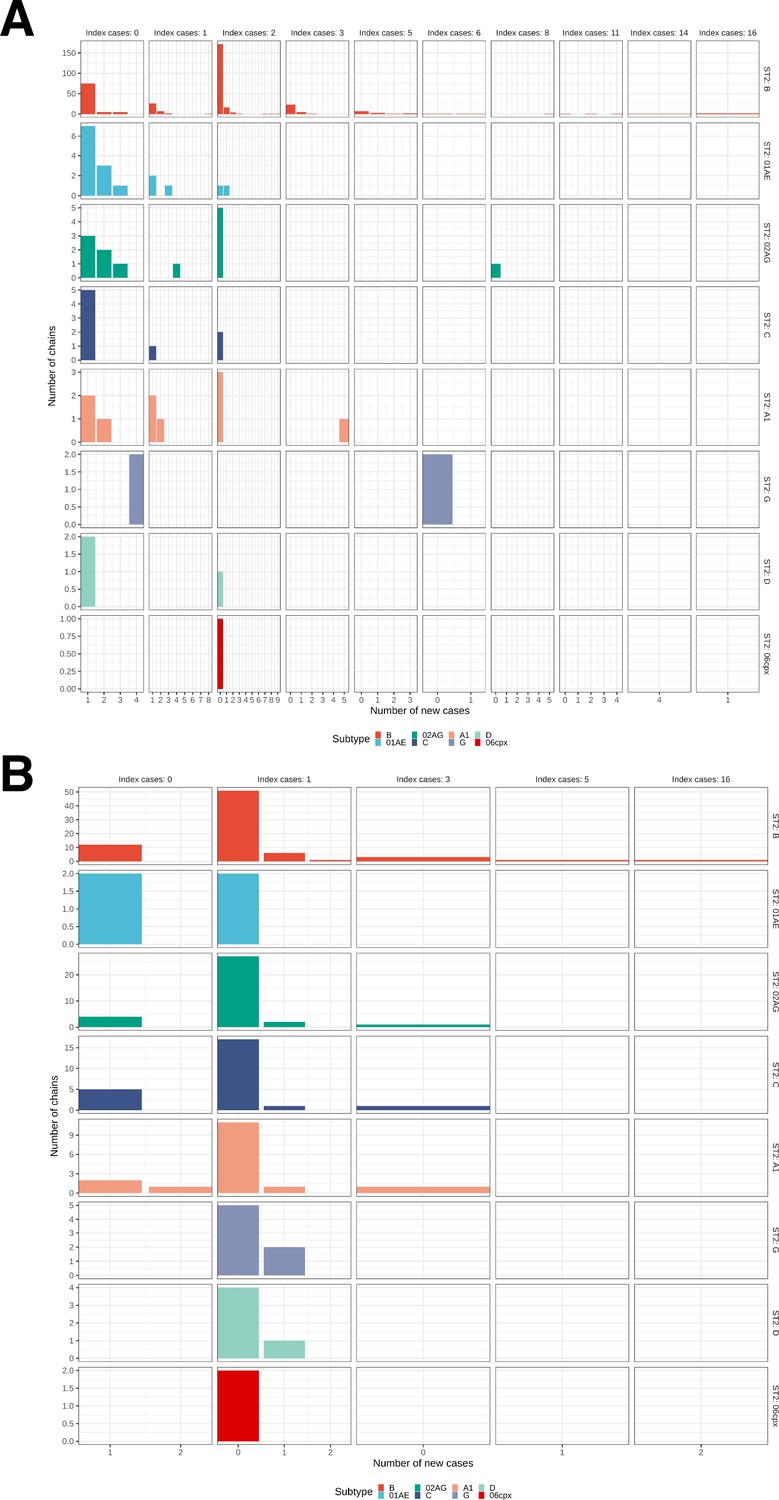
Growth of phylogenetically observed subgraphs by subtype.
First column (index cases = 0) are for emergent chains, where the index case is among the newly generated cases. (A) Subgraphs among Amsterdam MSM. (B) Subgraphs among Amsterdam heterosexuals.
Appendix 1—figure 27
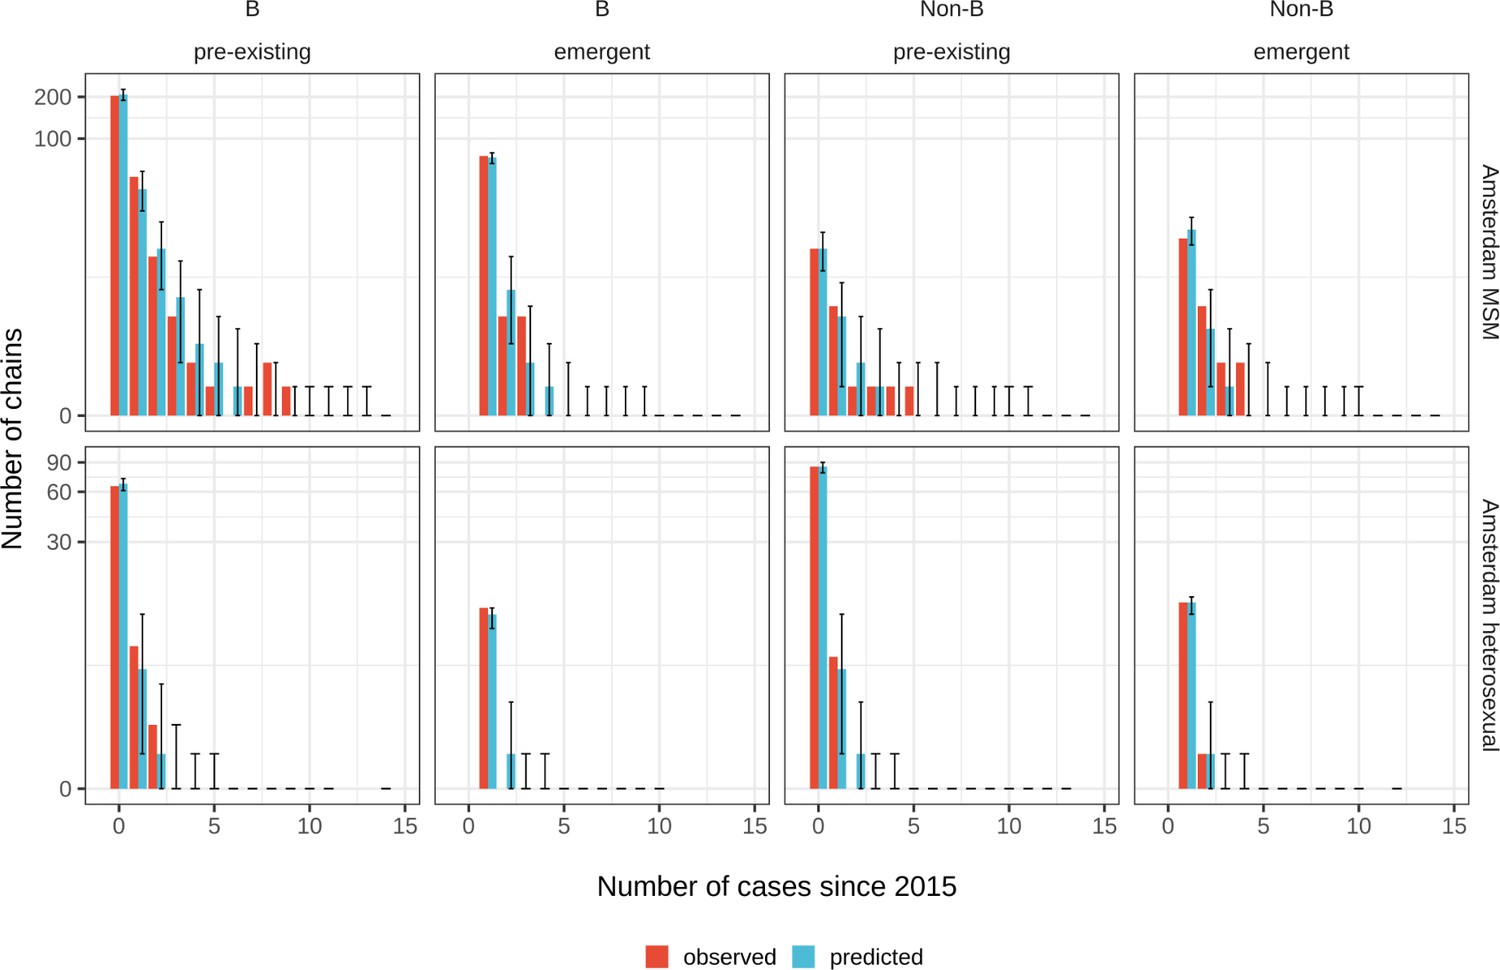
Posterior predictive check for Amsterdam MSM (top) and Amsterdam heterosexuals (bottom) for B and non-B subtypes.
Estimates generated from 203 phylogenetic subgraphs among Amsterdam MSM, containing 297 individuals, and 41 subgraphs among Amsterdam heterosexuals, containing 44 individuals.
Appendix 1—figure 28
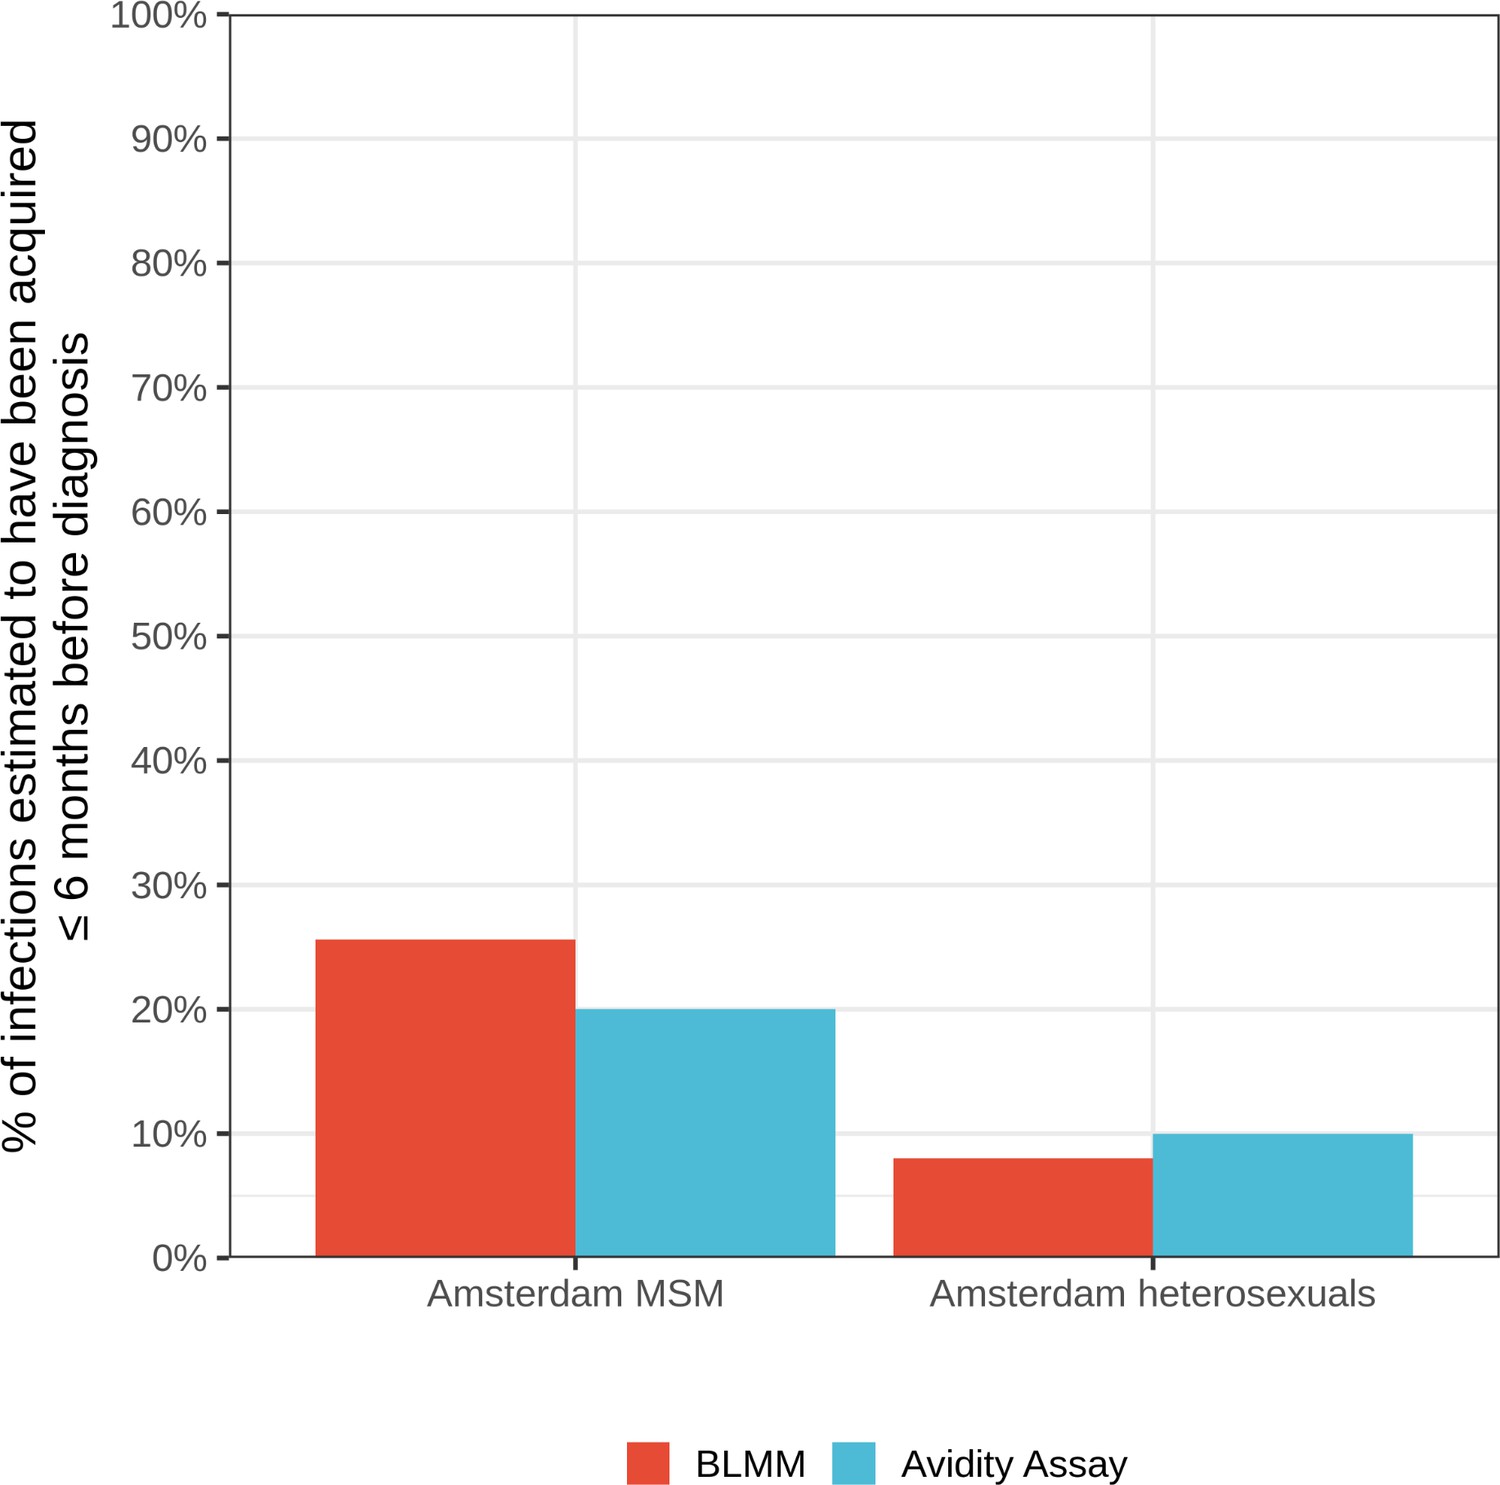
Estimates for the proportion of HIV infections acquired within 6 months of diagnosis from the bivariate linear mixed model (BLMM) approach (for infections diagnosed between 2013-2015), compared with estimates obtained from avidity assays in a study by Slurink et al., 2021 (for infections diagnosed between 2013-2015).
Appendix 1—figure 29
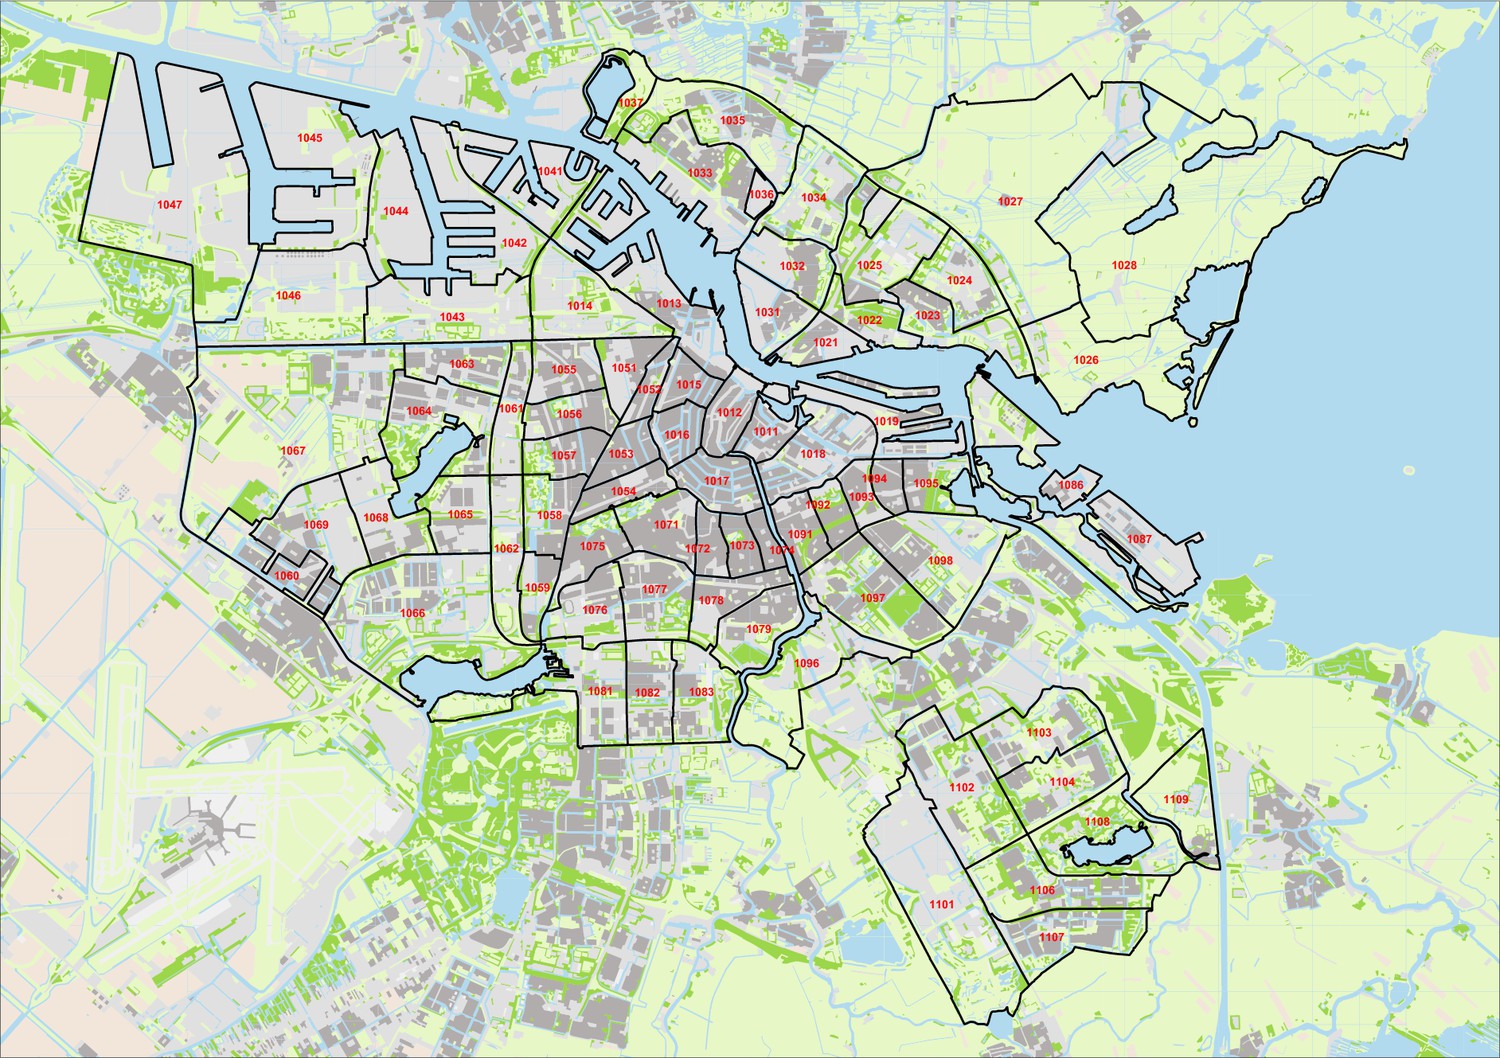
Map of Amsterdam postal code (PC4) areas.
Appendix 1—figure 30
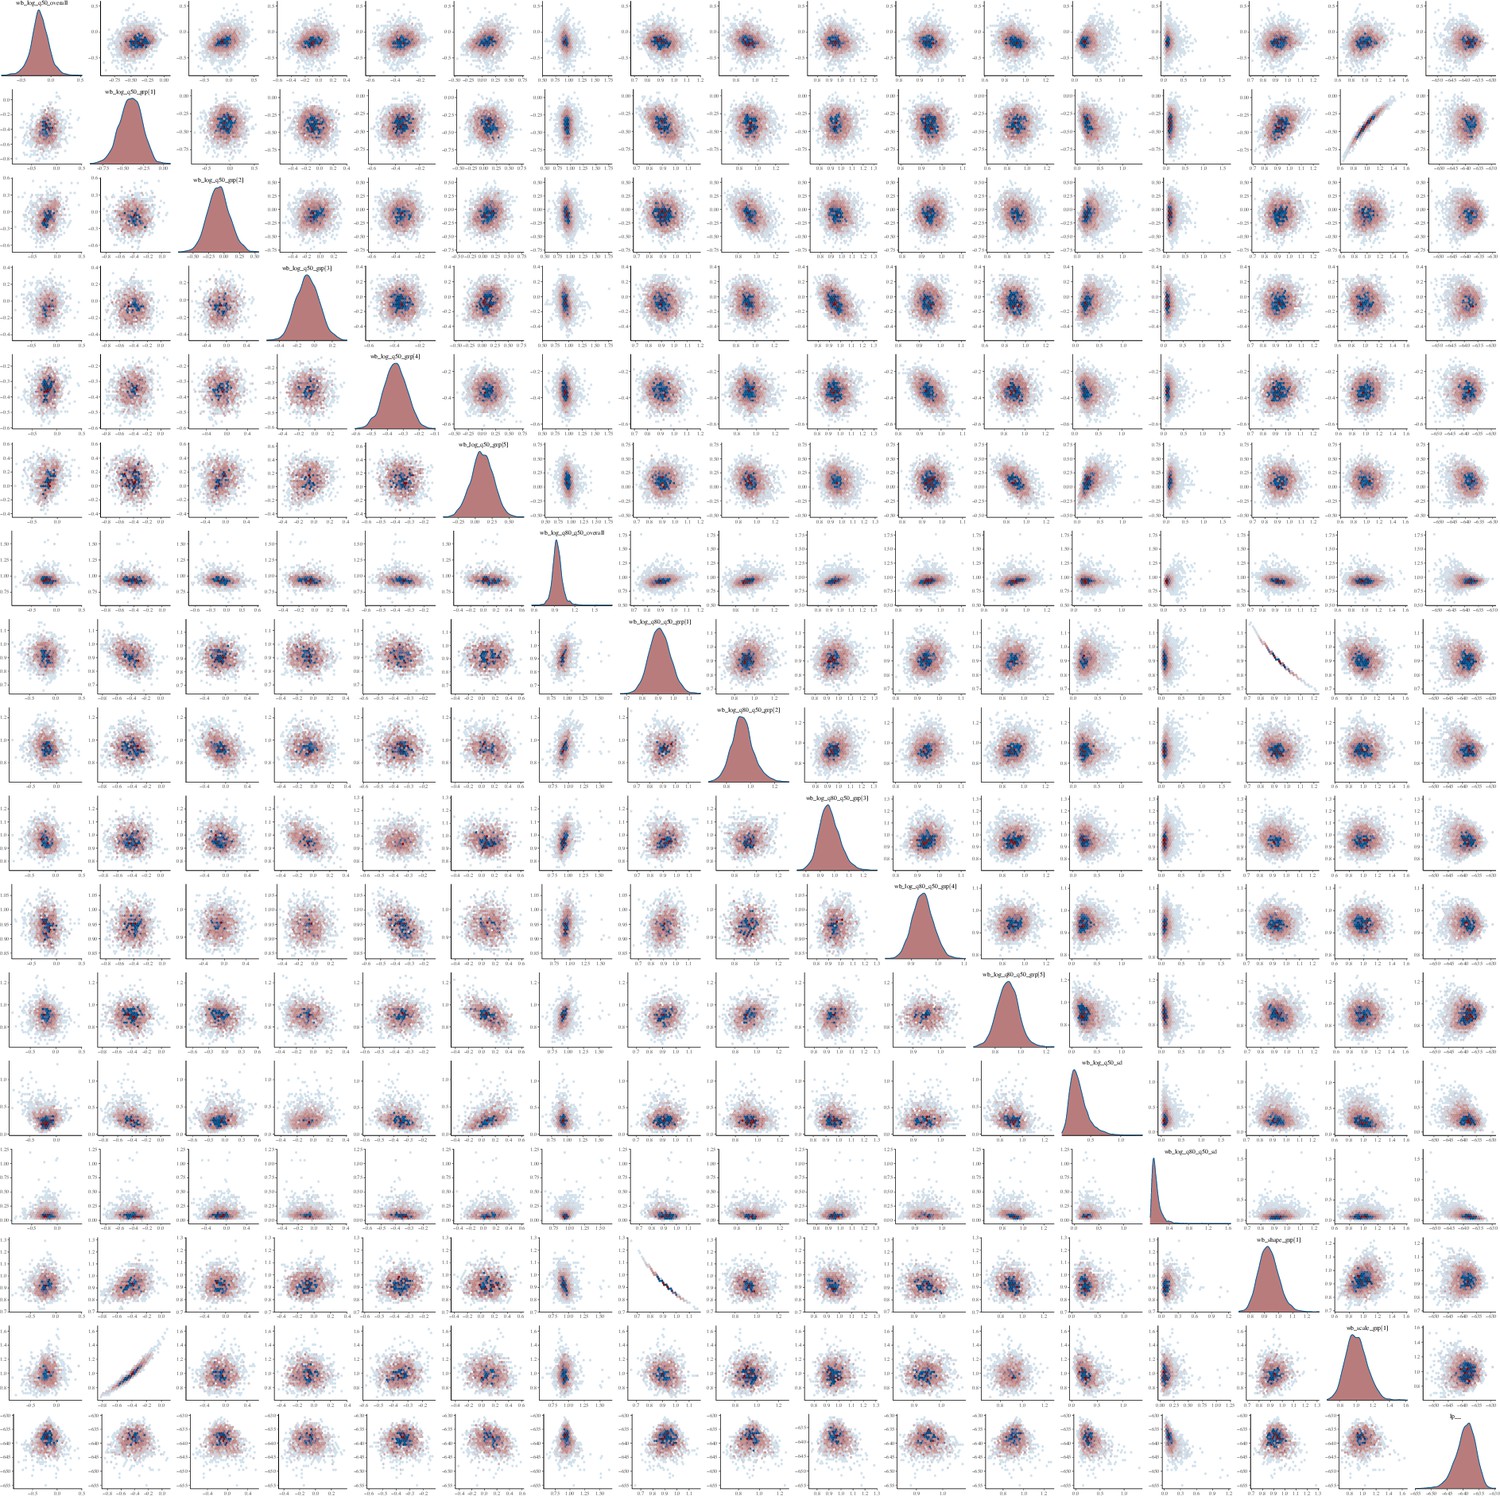
Pairs plot of the joint posterior density of the model parameters for MSM time-to-diagnosis model.
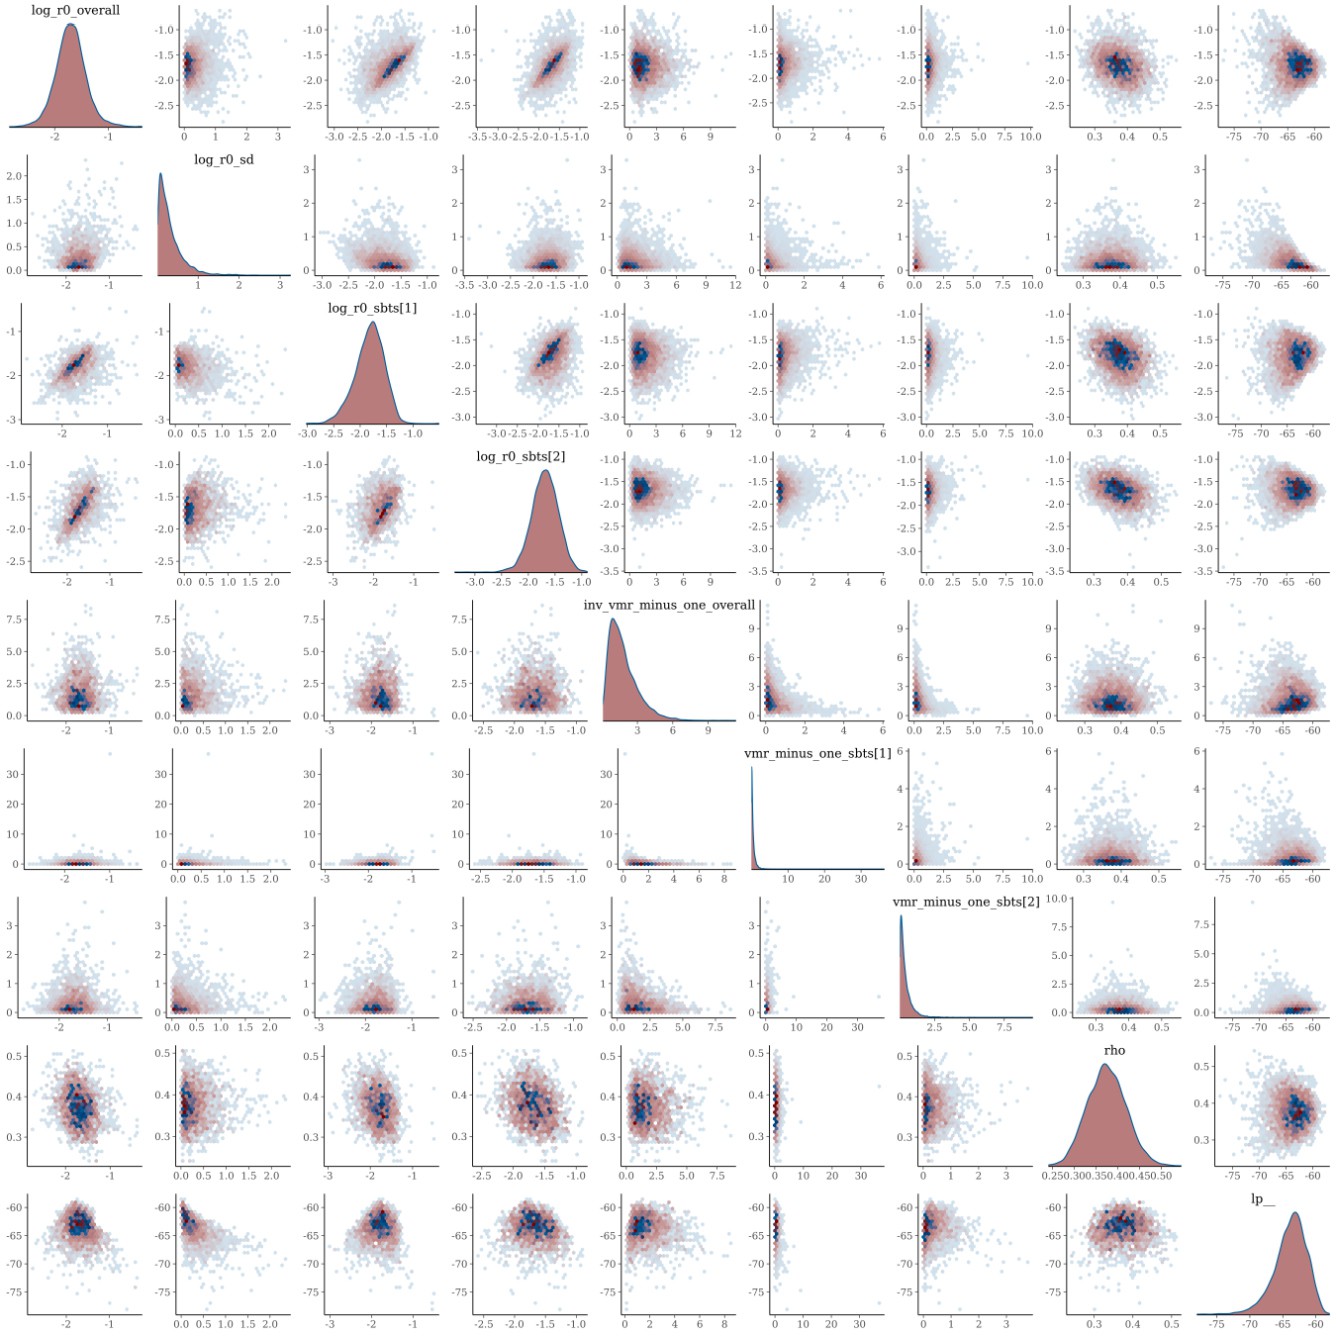
Appendix 1—figure 31
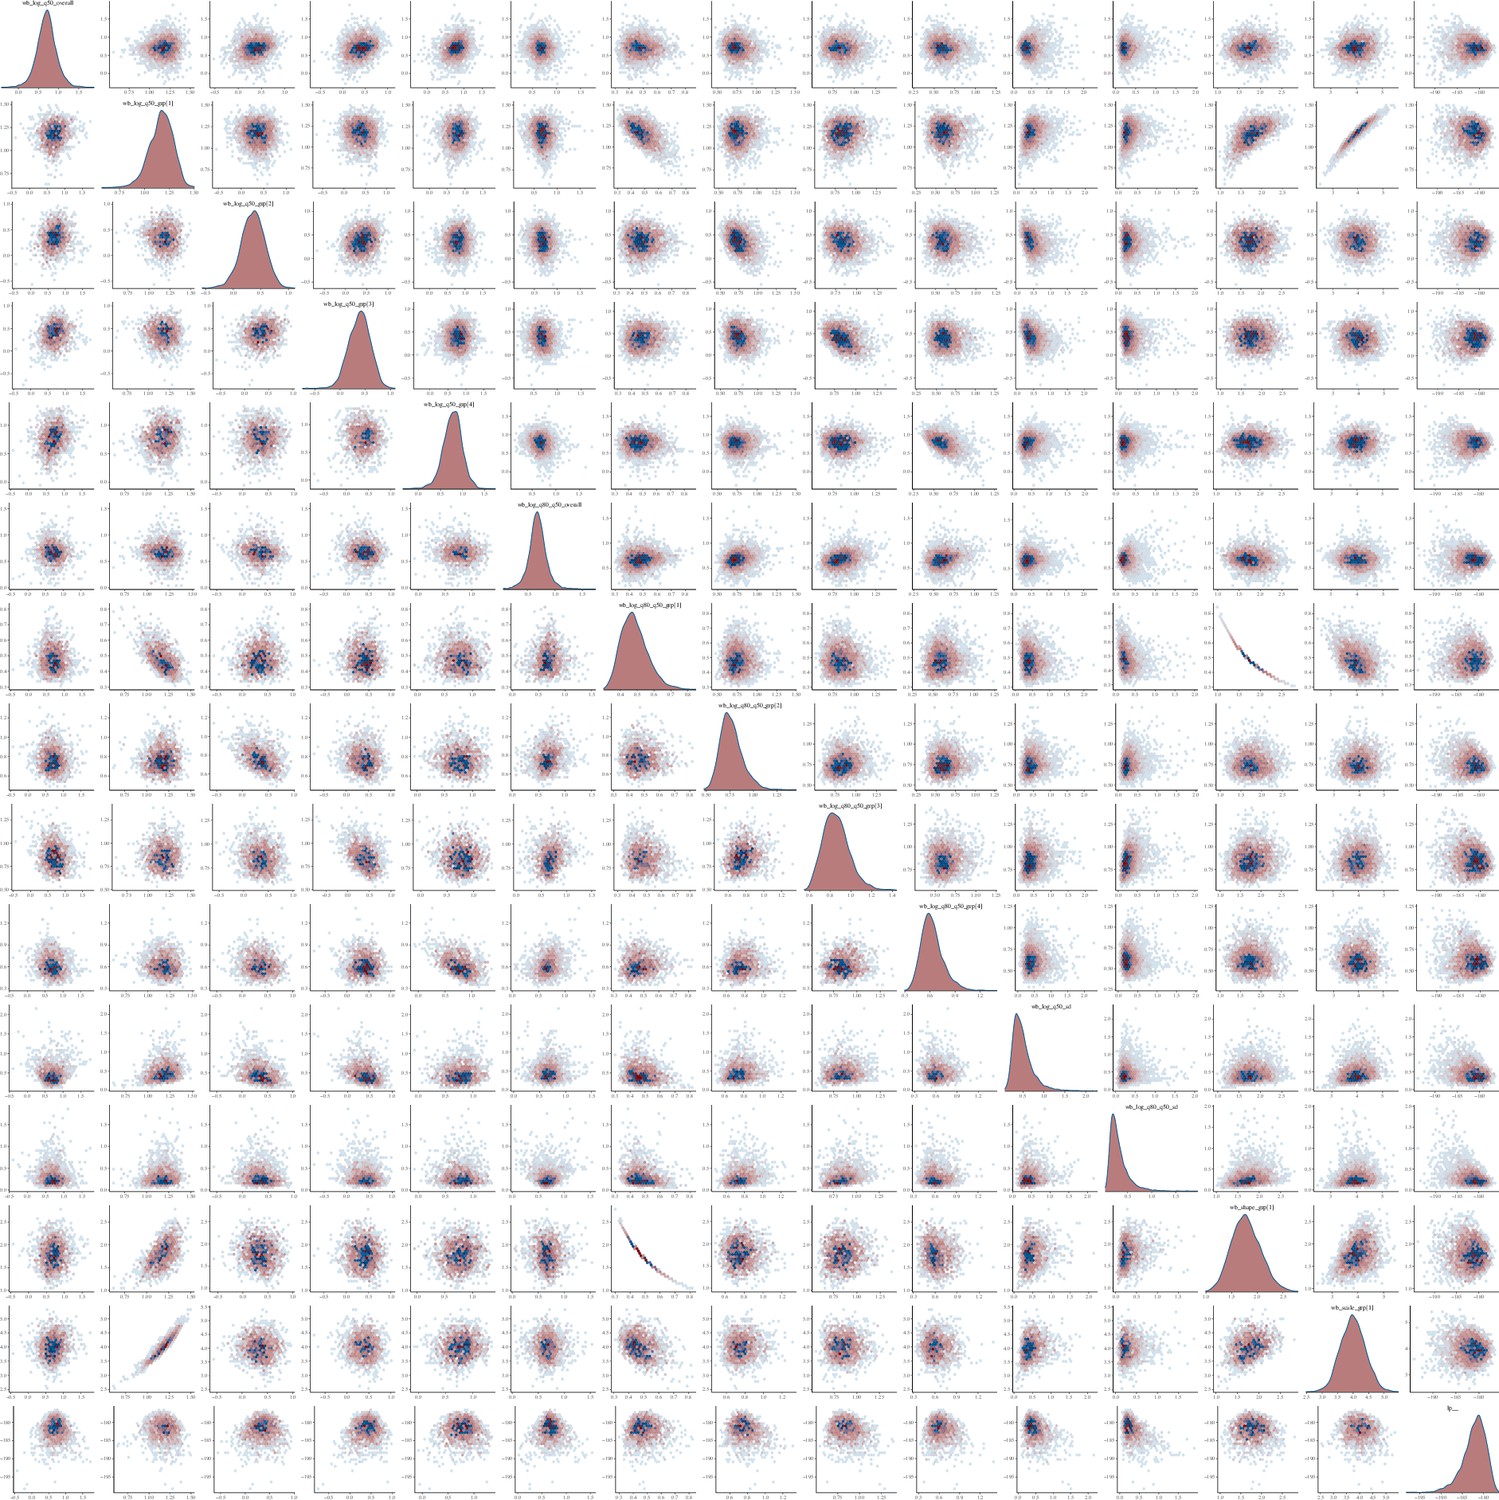
Pairs plot of the joint posterior density of the model parameters for heterosexual time-to-diagnosis model.
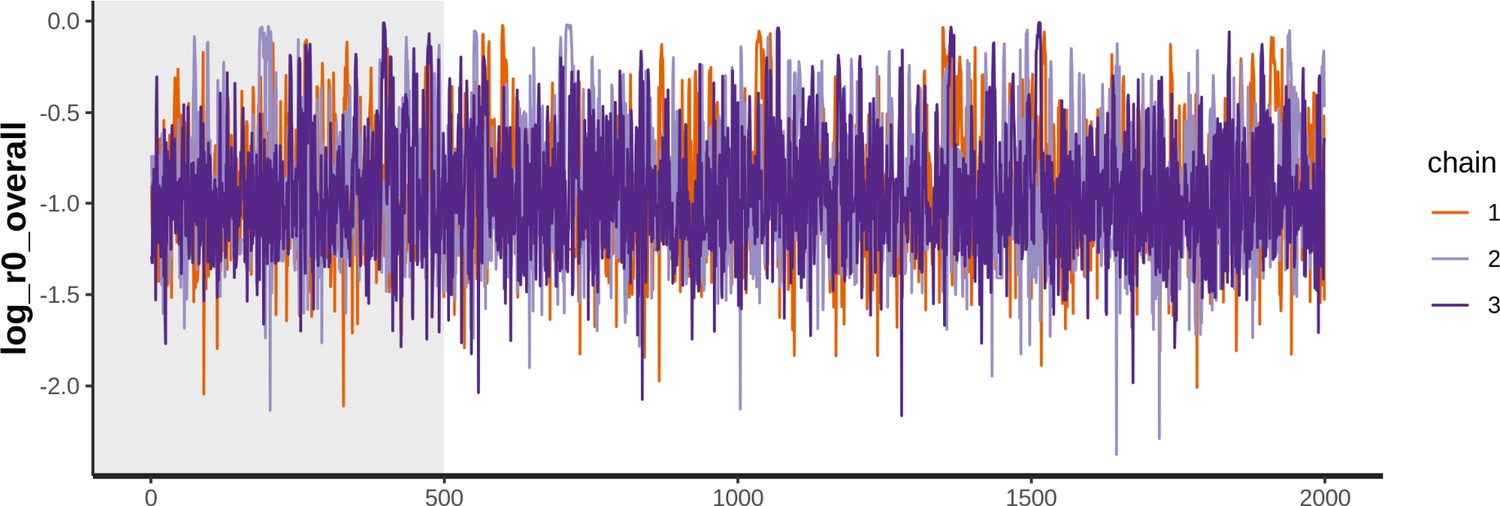
Appendix 1—figure 32
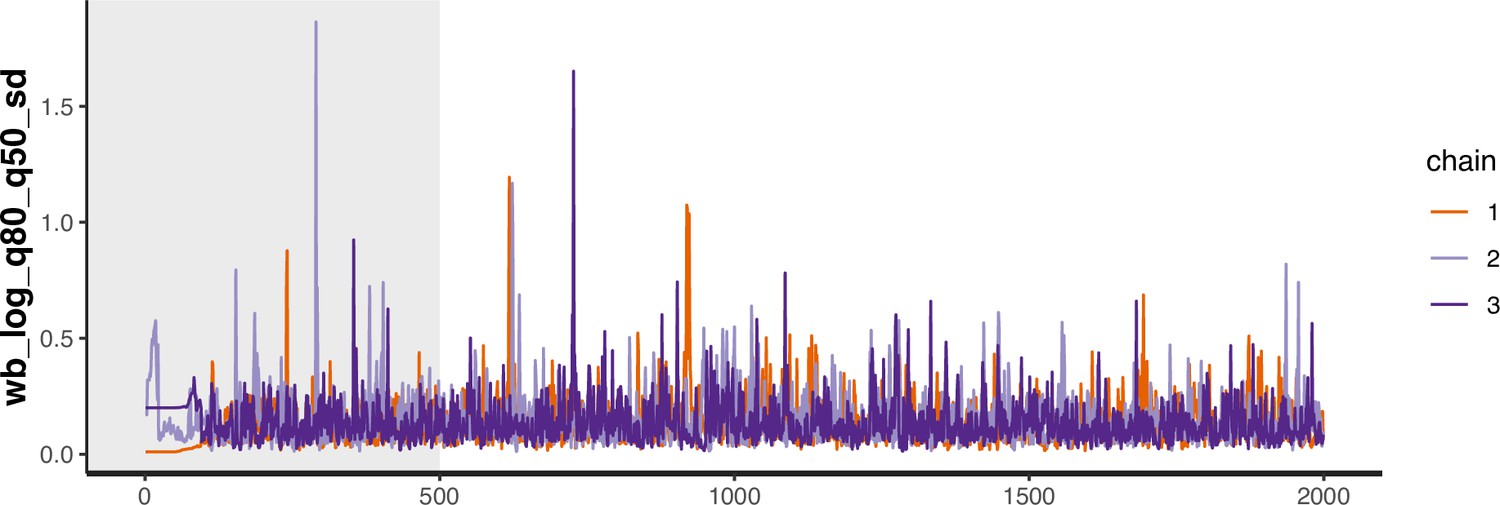
Trace plot for parameter with smallest effective sample size in MSM time-to-diagnosis model.
Appendix 1—figure 33
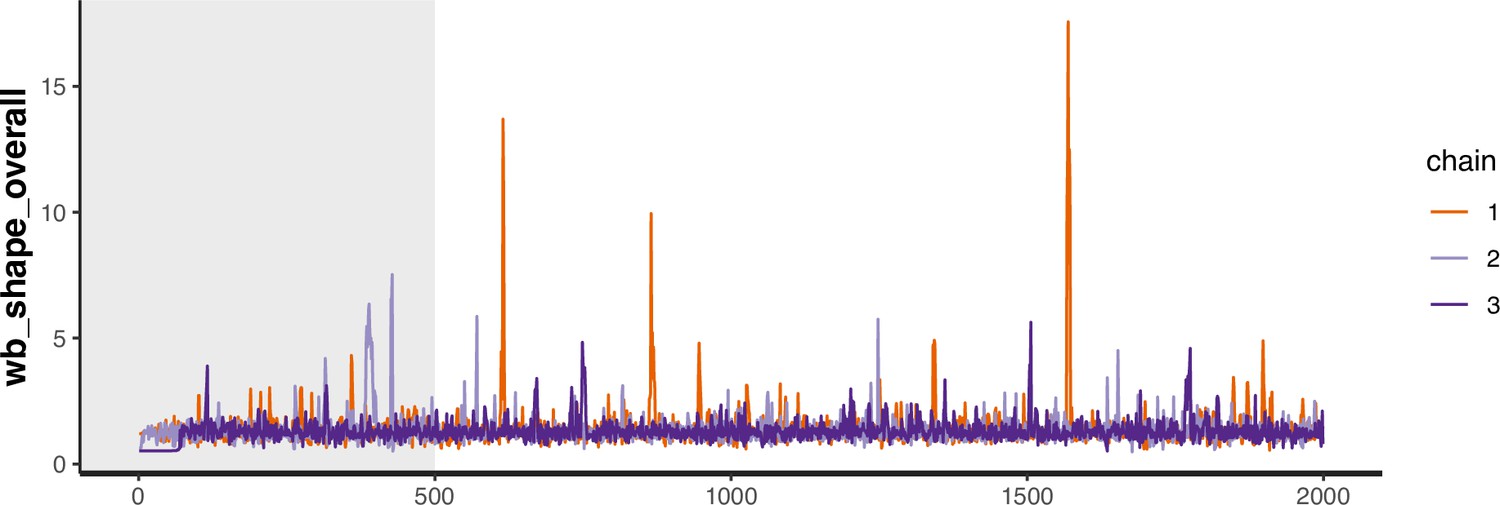
Trace plot for parameter with smallest effective sample size in heterosexual time-to-diagnosis model.
Appendix 1—figure 34

Posterior median cumulative distribution functions (CDFs) (line in colours) and 95% credible intervals (ribbon in colours) are shown along with the empirical CDF (steps in black).
Appendix 1—figure 35
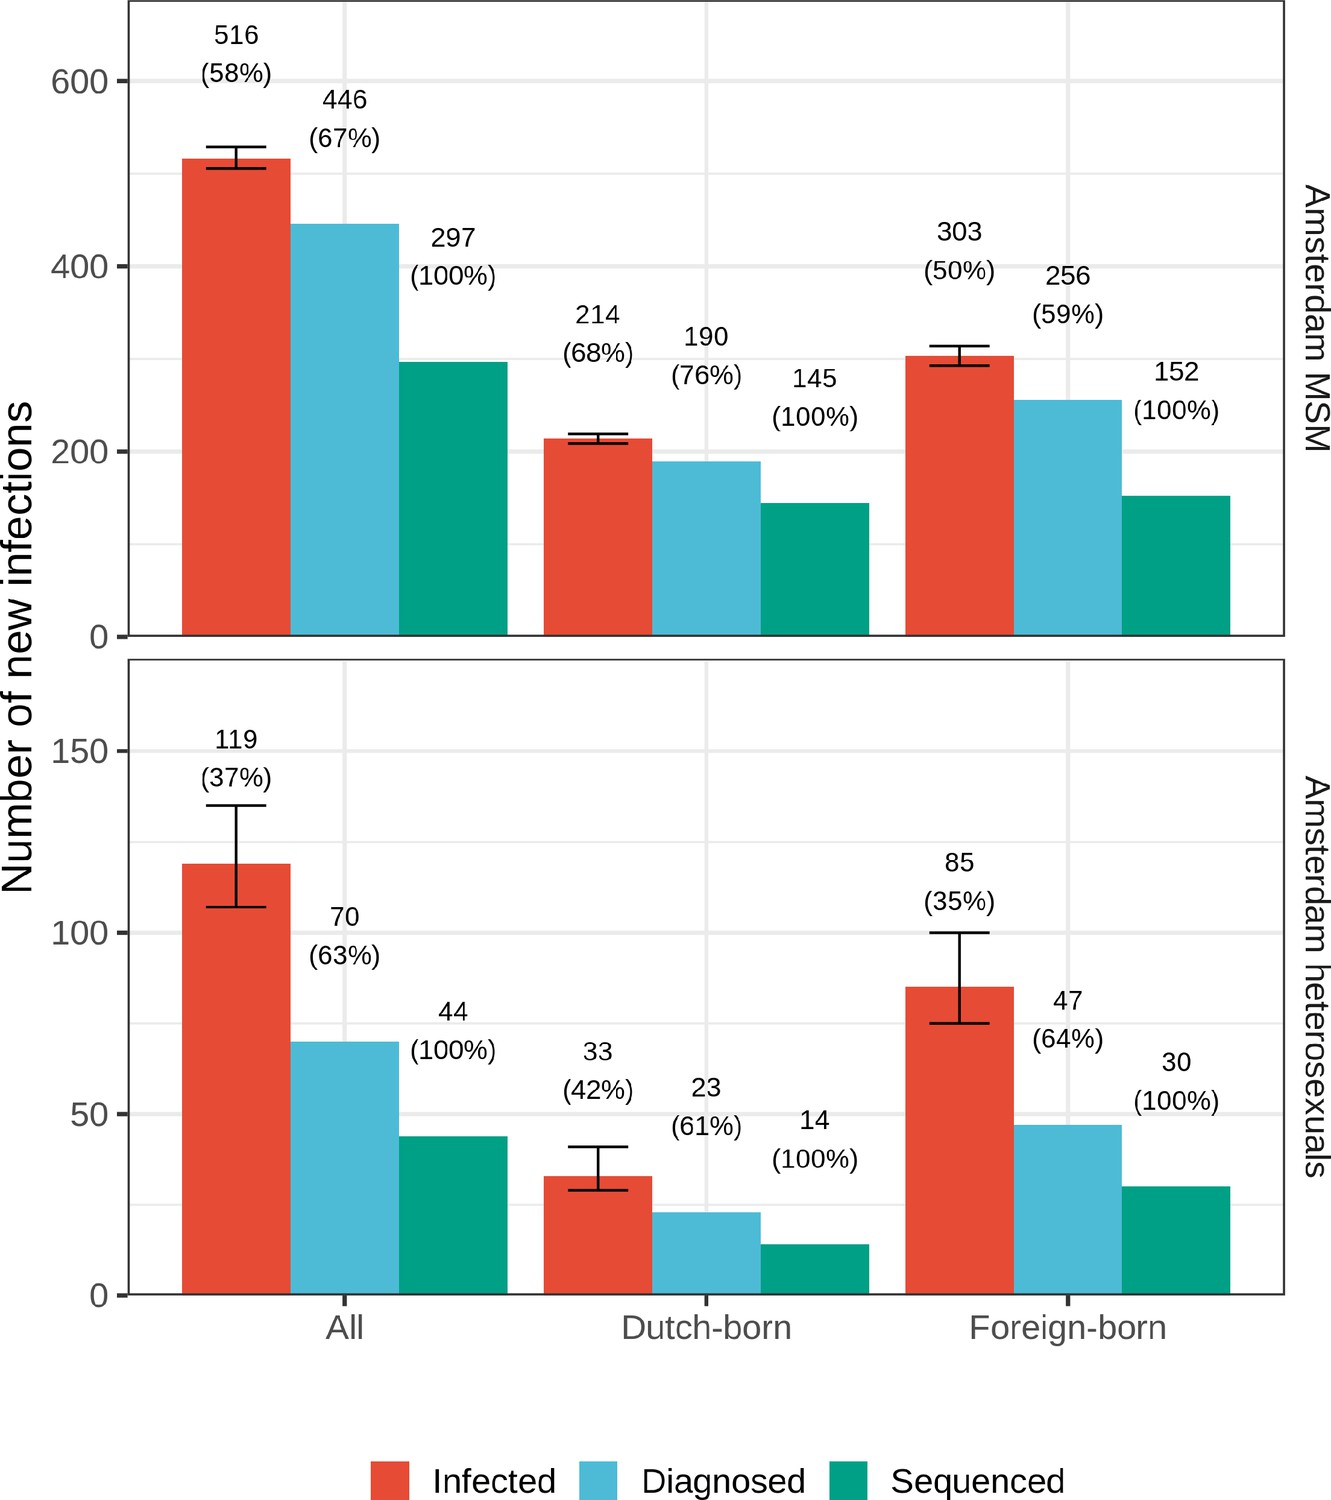
Estimated Amsterdam infections in 2014-2018.
Estimates of the total number of individuals resident in Amsterdam that were infected in 2014-2018 are shown along with the subset of individuals that were diagnosed, and the subset of those for who at least one viral sequence is available. Posterior median estimates (bars, and number on top of bar) are shown along with 95% credible intervals. The posterior median proportion of individuals with a viral sequence is also shown (proportion on top of bar).
Appendix 1—figure 36

Estimated proportion of Amsterdam infections in 2014-2018 which remained undiagnosed by 2019, by year of infection.
(A) Using all biomarker data from all individuals. (B) Using midpoint estimates from seroconverters.
Appendix 1—figure 37
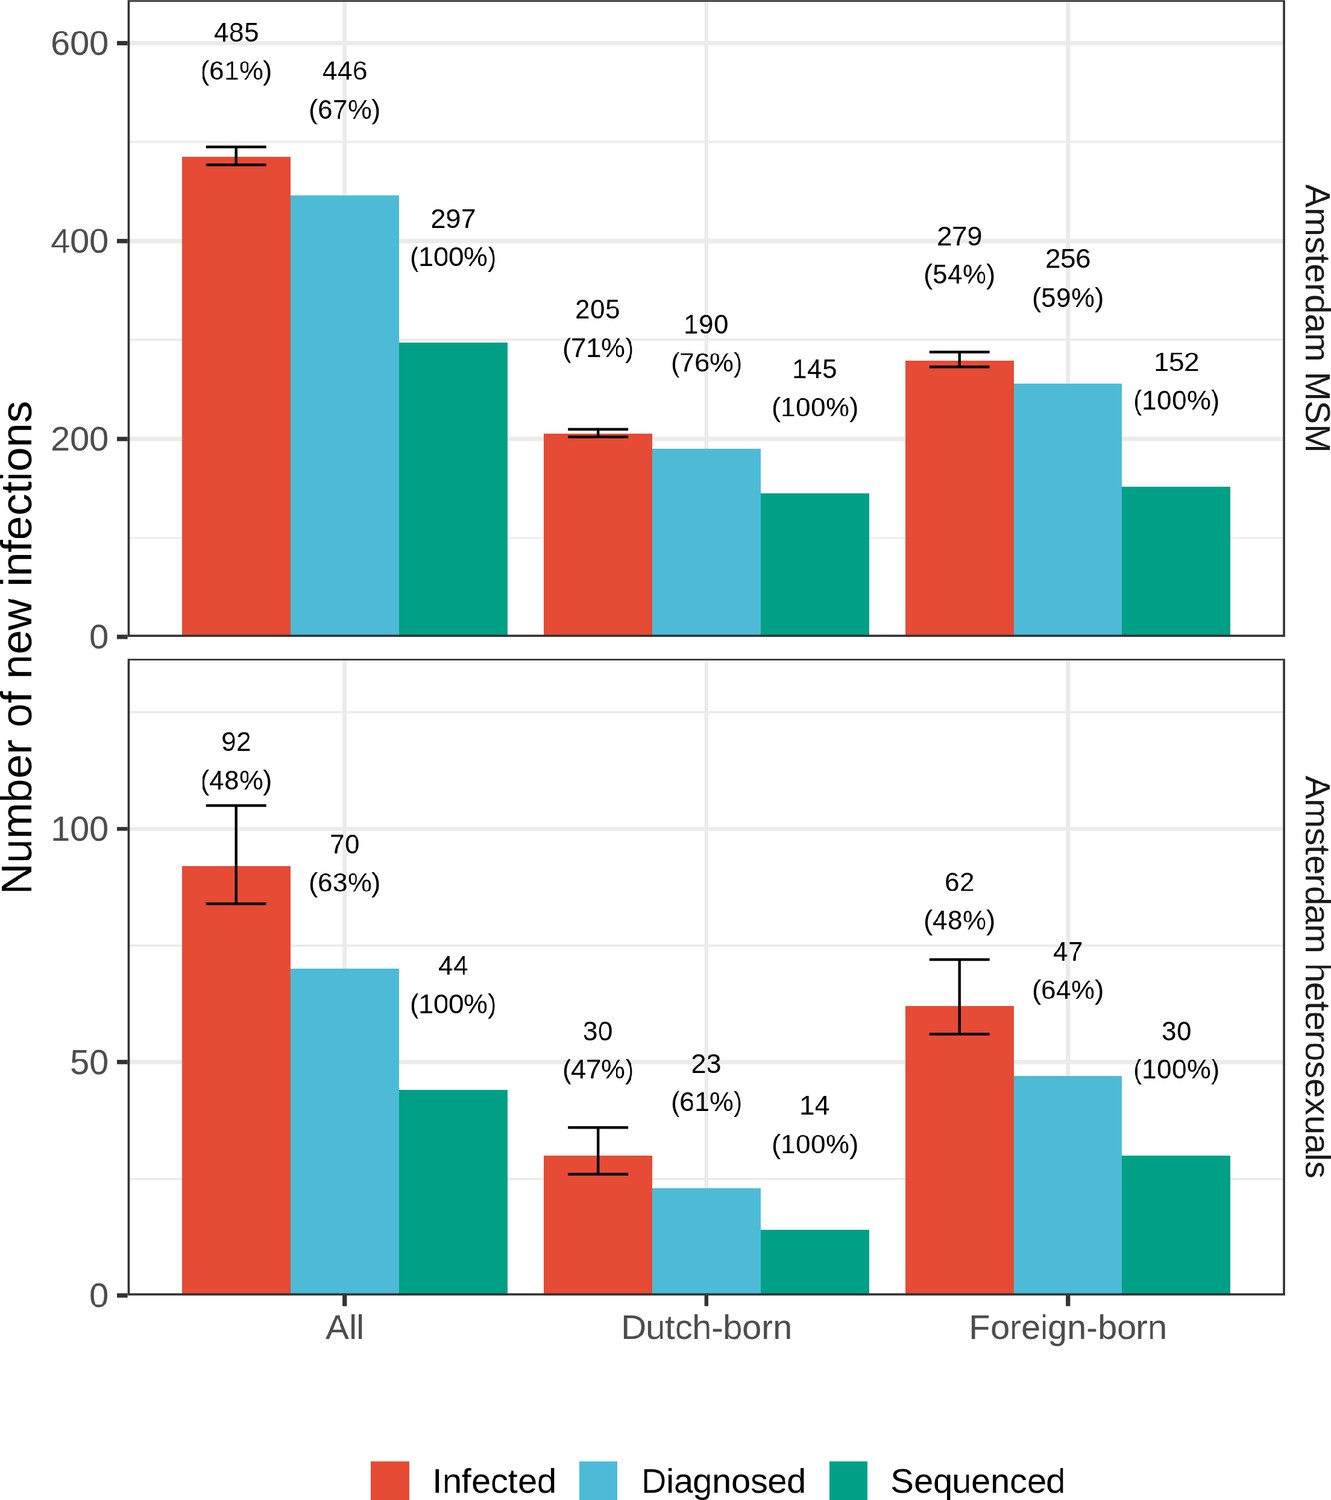
Estimated Amsterdam infections in 2014-2018, using midpoint estimates from seroconverters.
Estimates of the total number of individuals resident in Amsterdam that were infected in 2014-2018 are shown along with the subset of individuals that were diagnosed, and the subset of those for who at least one viral sequence is available. Posterior median estimates (bars, and number on top of bar) are shown along with 95% credible intervals. The posterior median proportion of individuals with a viral sequence is also shown (proportion on top of bar).
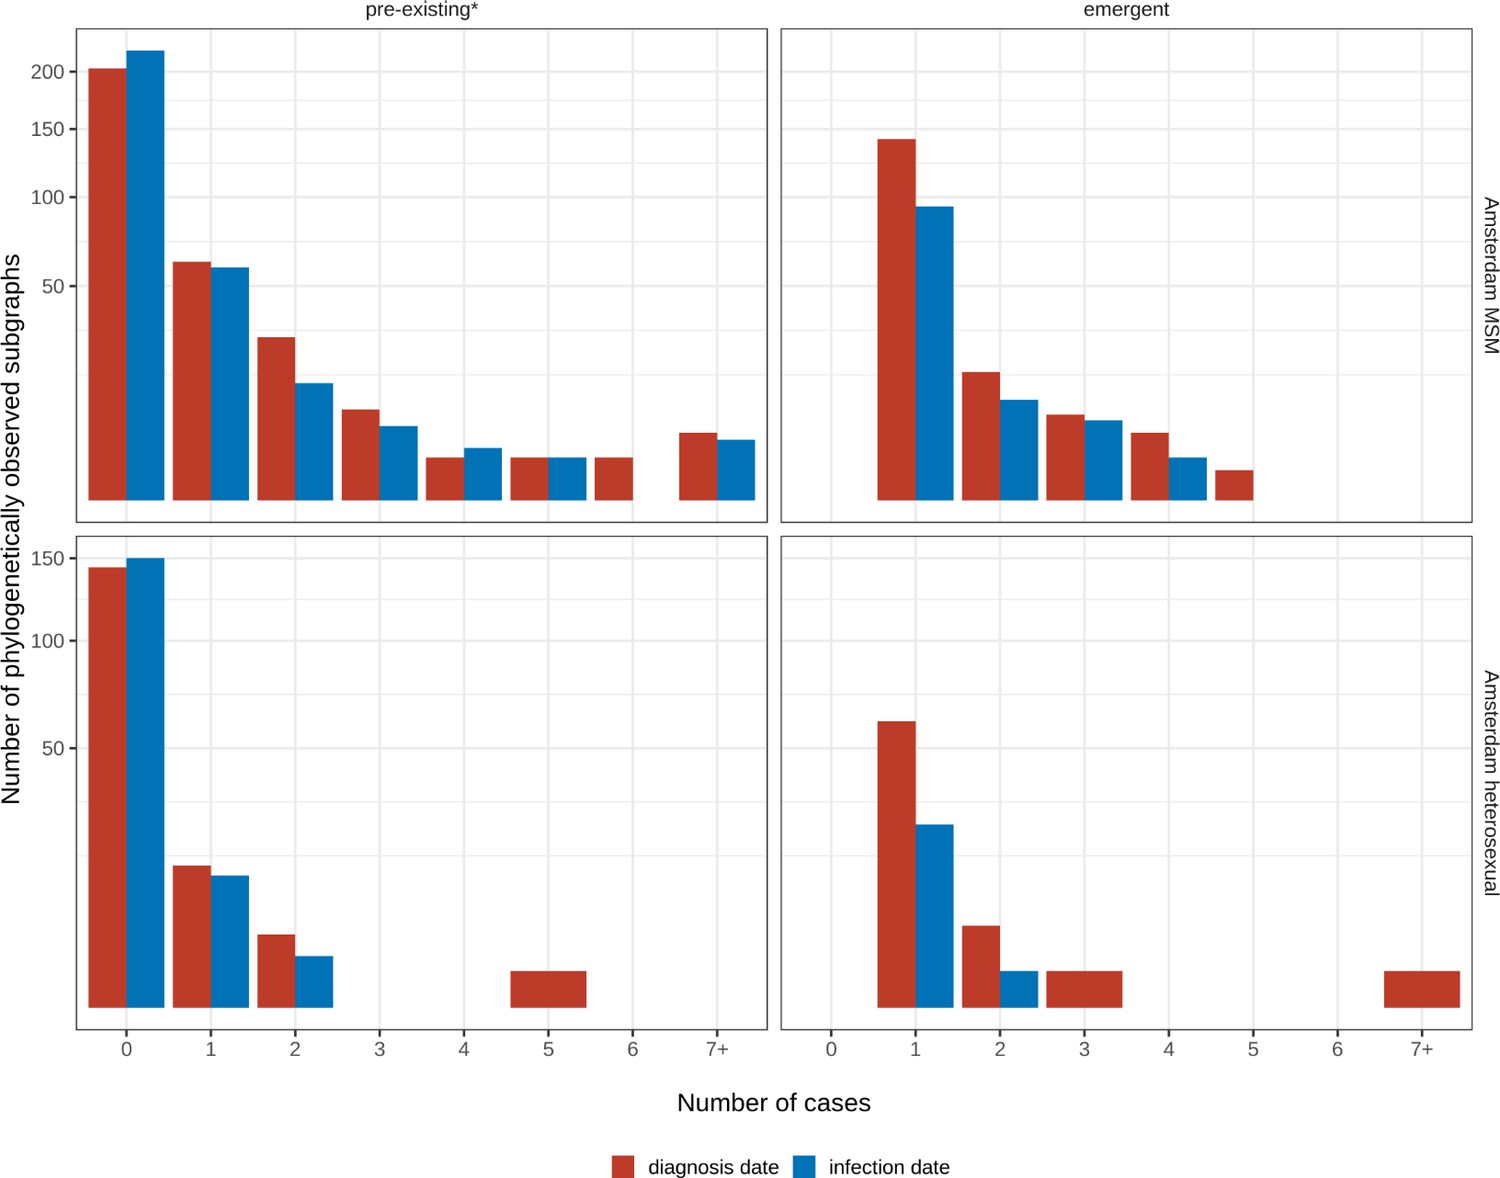
Appendix 1—figure 38
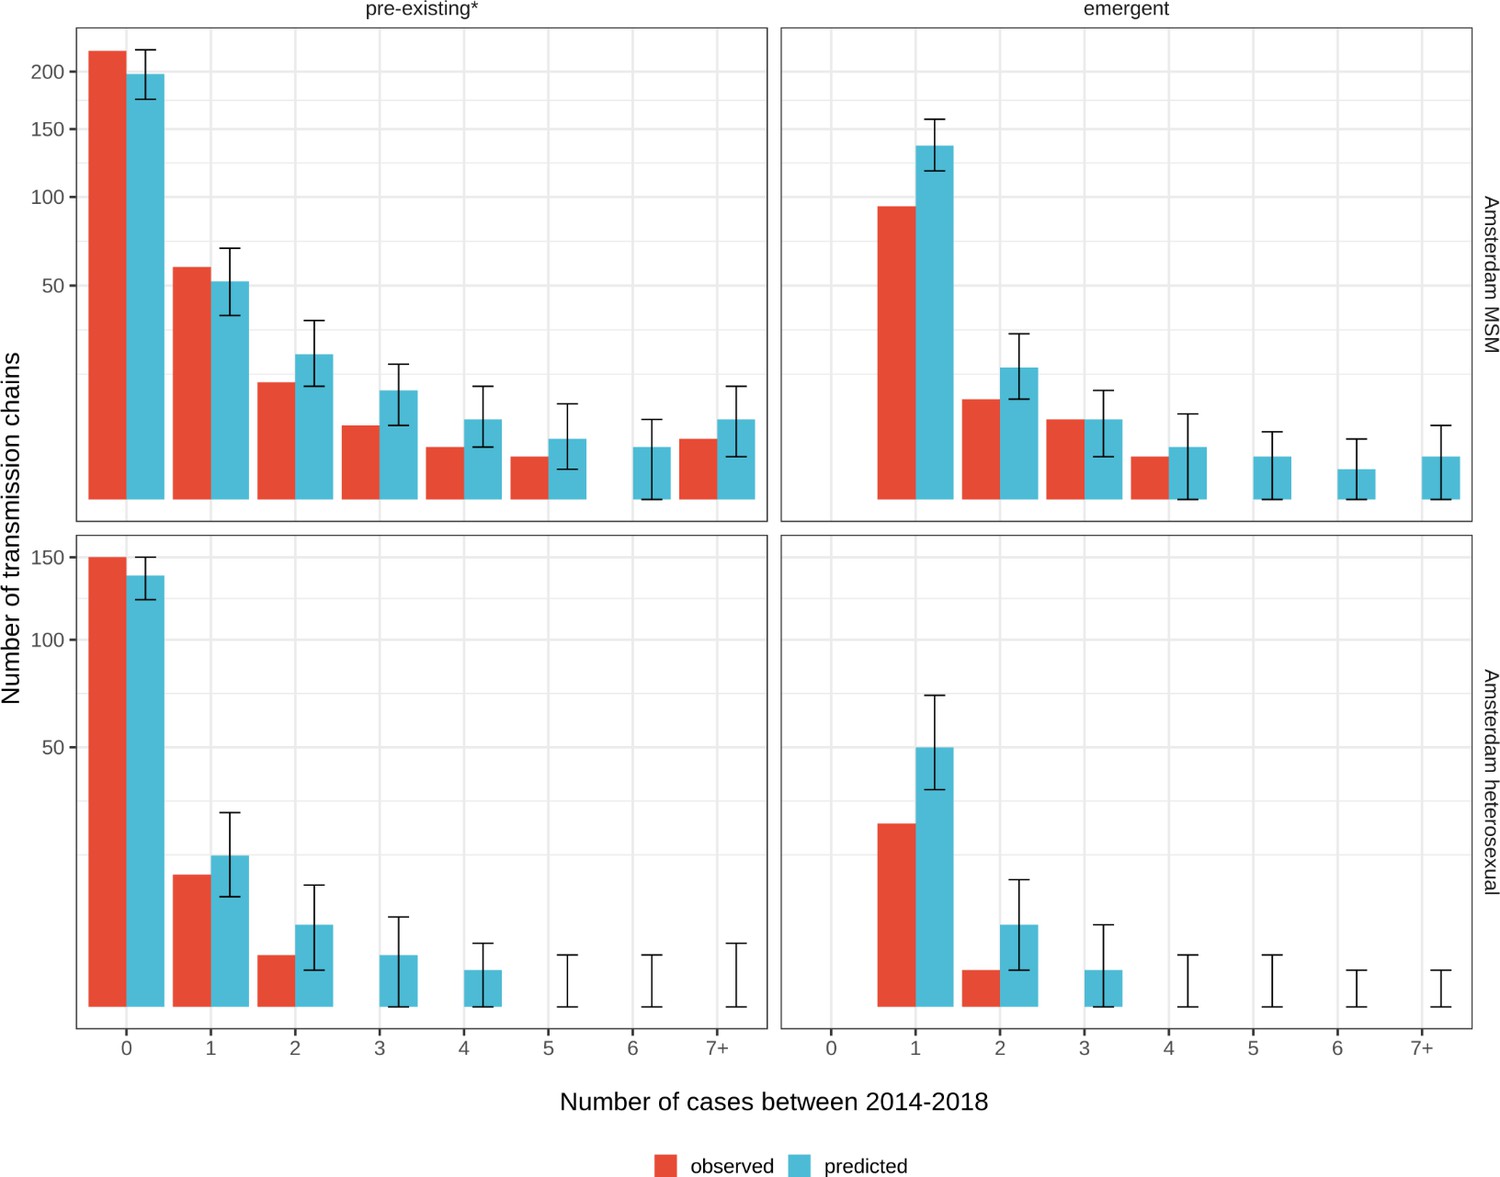
Growth of pre-existing (left) and emergent (right) phylogenetically observed subgraph sizes using estimated date of infection.
Estimates generated from 203 phylogenetic subgraphs among Amsterdam MSM, containing 297 individuals, and 41 subgraphs among Amsterdam heterosexuals, containing 44 individuals. * pre-existing prior to 2014.
Appendix 1—figure 39
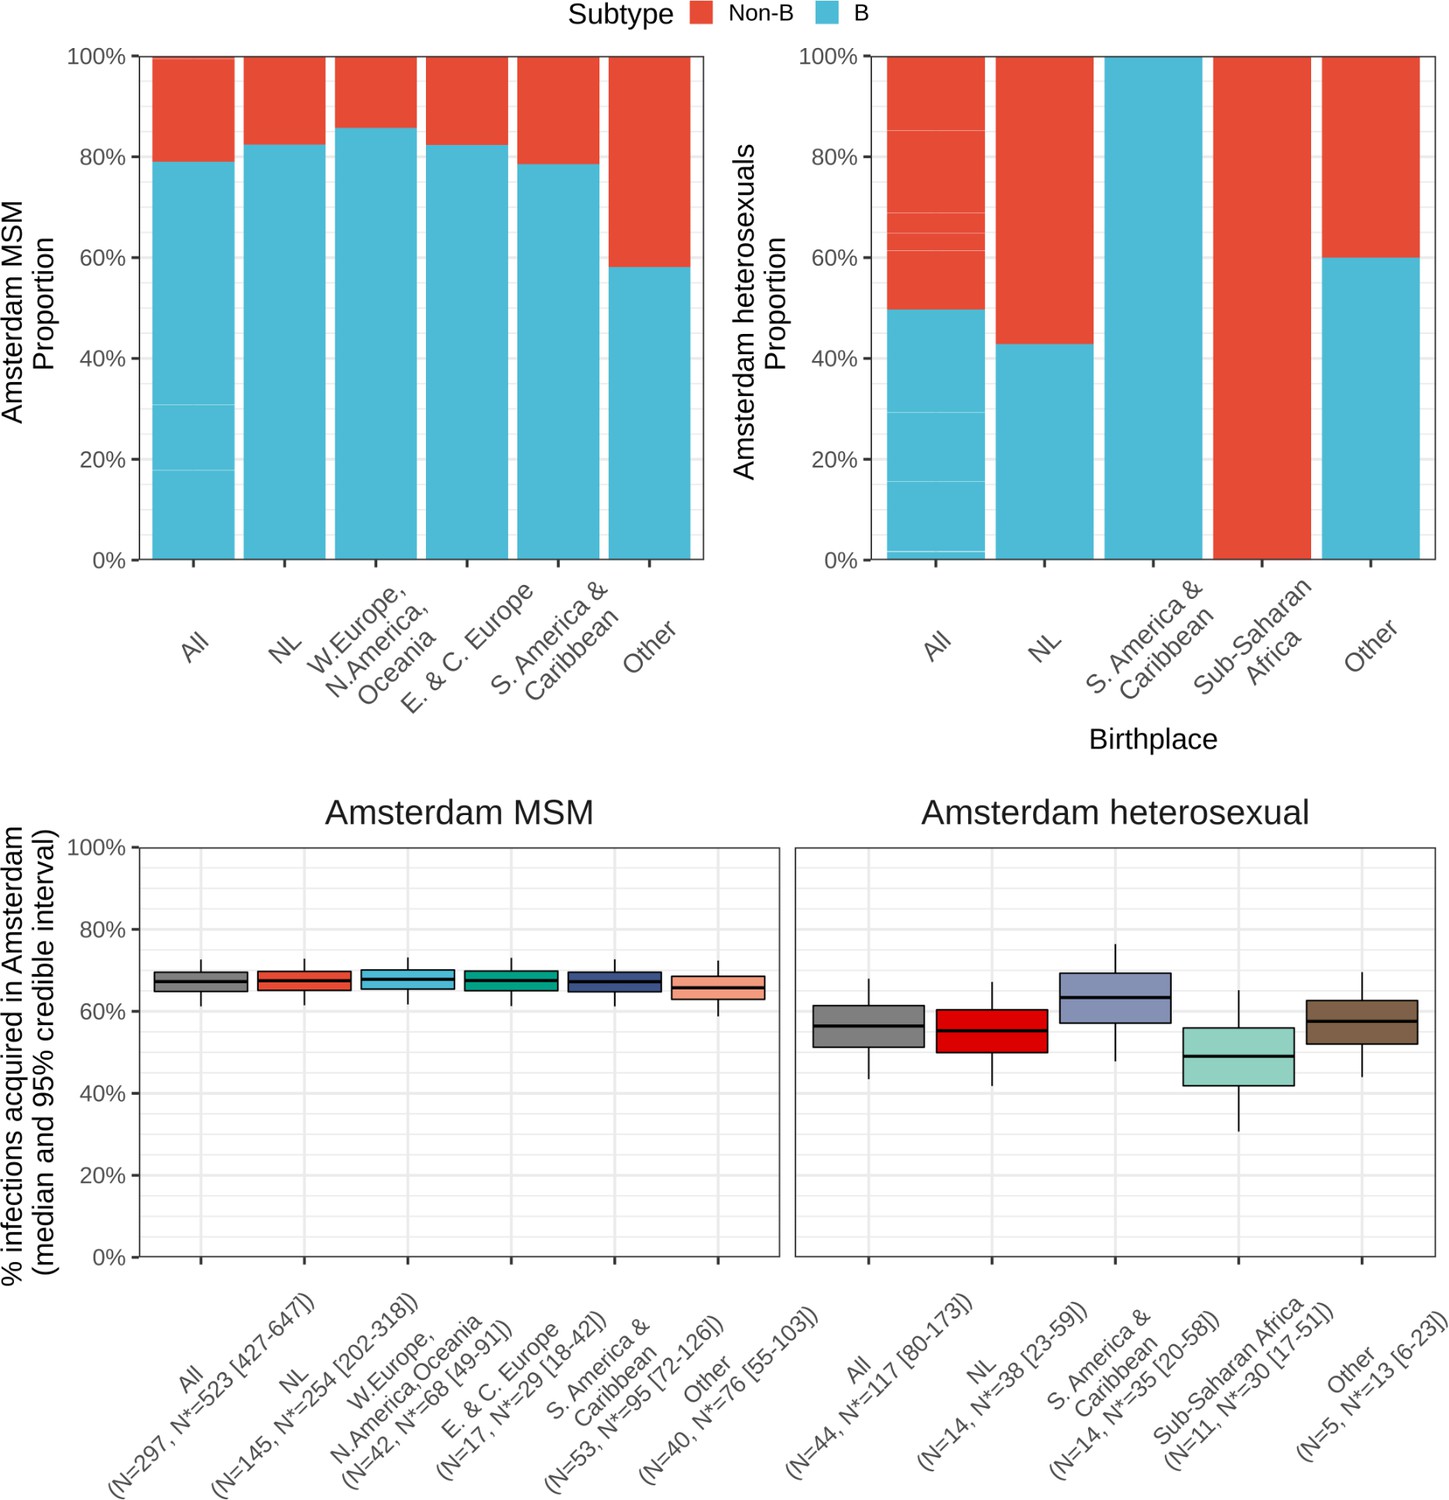
Top: Composition of subtypes among total predicted new cases.
Bottom: Estimated local infections among MSM (left) and heterosexuals (right), stratified by place of birth between 2014-2018. N = number of sequences available, N* = estimated actual infections [95% credible interval].
Appendix 1—figure 40
Trace plot of parameter with the smallest effective sample size for Amsterdam MSM model.
Appendix 1—figure 41
Trace plot of parameter with the smallest effective sample size for Amsterdam heterosexual model.
Appendix 1—figure 42

Pairs plot of the joint posterior density of the model parameters for Amsterdam MSM.
Appendix 1—figure 43
Pairs plot of the joint posterior density of the model parameters for Amsterdam heterosexuals.
Appendix 1—figure 44
Growth of pre-existing and emergent phylogenetically observed subgraph sizes using diagnosis date and estimated date of infection.
* pre-existing prior to 2014.
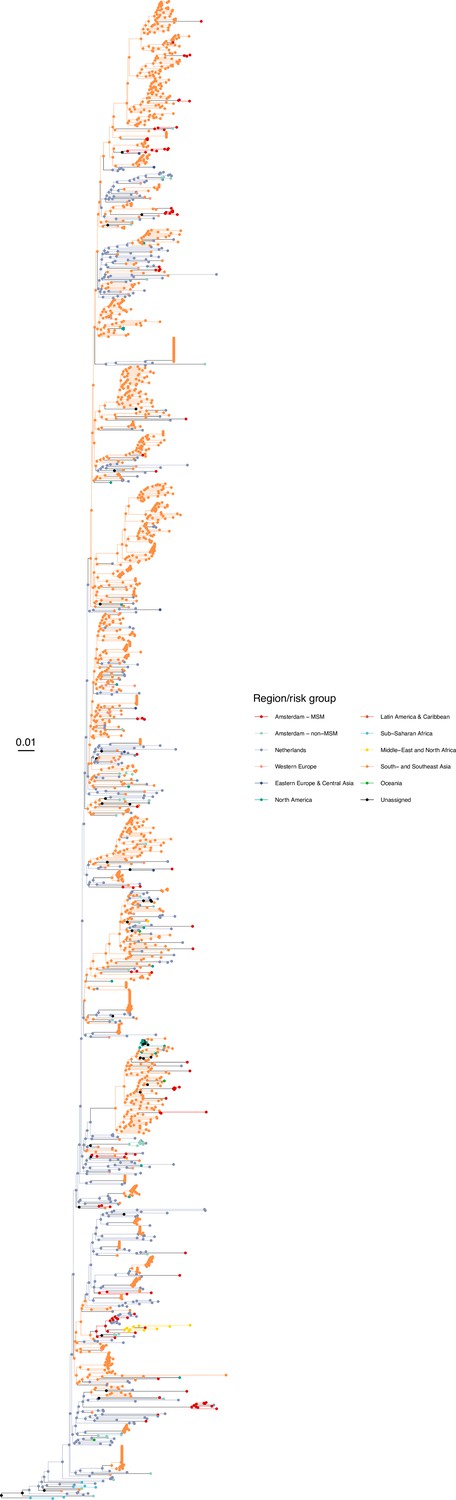
Author response image 1
Tables
Table 1
HIV infections among Amsterdam residents in 2014-2018.
| Risk group | Observed HIV diagnoses in Amsterdam residents in 2014-May 2019(n) | Observed HIV diagnoses in Amsterdam residents in 2014-May 2019 with CD4 <350(n) | Observed HIV diagnoses in Amsterdam residents, estimated to have been infected in 2014–2018(n) | Estimated undiagnosed HIV infections in Amsterdam residents until May 2019(%) | Estimated HIV infections in Amsterdam residents in 2014–2018(n) |
|---|---|---|---|---|---|
| Total | 846 | 275 | 516 | 19% [17–21%] | 636 [620-656] |
| MSM (all) | 671 | 192 | 446 | 14% [12–16%] | 516 [506-529] |
| MSM (Dutch-born) | 298 | 103 | 190 | 11% [9–13%] | 214 [209-219] |
| MSM (Born in W. Europe, N. America and Oceania) | 100 | 12 | 80 | 9% [6–14%] | 88 [85-93] |
| MSM (Born in E. and C. Europe) | 51 | 8 | 32 | 16% [11–24%] | 38 [36-42] |
| MSM (Born in S. America and the Caribbean) | 124 | 38 | 83 | 17% [13–22%] | 100 [95-107] |
| MSM (Born in any other country) | 98 | 31 | 61 | 20% [14–27%] | 76 [71-83] |
| Heterosexuals (all) | 175 | 83 | 70 | 41% [35–48%] | 119 [107-135] |
| Heterosexuals (Dutch-born) | 51 | 19 | 23 | 30% [21–44%] | 33 [29-41] |
| Heterosexuals (Born in Sub-Saharan Africa) | 67 | 36 | 17 | 57% [47–67%] | 40 [32-51] |
| Heterosexuals (Born in S. America and the Caribbean) | 37 | 18 | 21 | 28% [19–42%] | 29 [26-36] |
| Heterosexuals (Born in any other country) | 20 | 10 | 9 | 40% [25–57%] | 15 [12-21] |
-
Posterior estimated median time from infection to diagnosis [95% CI].
Table 2
Growth distribution of transmission chains among Amsterdam residents in 2014–2018.
| Observed* | Predicted† | ||||||||
|---|---|---|---|---|---|---|---|---|---|
| Pre-existing chains | Emerging chains | Pre-existing chains | Emerging chains | ||||||
| Transmission group | New cases | (N) | (%) | (N) | (%) | (N) | (%) | (N) | (%) |
| Amsterdam MSM | 0 | 220 | 71.2% | - | - | 198 [175-221] | 64.1% [56.6–71.5%] | - | - |
| 1 | 59 | 19.1% | 94 | 82.5% | 52 [37-69] | 16.8% [12.0–22.3%] | 137 [118-158] | 79.7% [72.3–86.1%] | |
| 2 | 15 | 4.9% | 11 | 9.6% | 23 [14-35] | 7.4% [4.5–11.3%] | 19 [11-30] | 11.2% [6.3–17.0%] | |
| 3 | 6 | 1.9% | 7 | 6.1% | 13 [6-20] | 4.2% [1.9–6.5%] | 7 [2-13] | 4.1% [1.2–7.6%] | |
| 4 | 3 | 1.0% | 2 | 1.8% | 7 [3-14] | 2.3% [1.0–4.5%] | 3 [0–8] | 1.8% [0.0–4.3%] | |
| 5 | 2 | 0.6% | 0 | 0.0% | 4 [1-10] | 1.3% [0.3–3.2%] | 2 [0–5] | 1.1% [0.0–2.9%] | |
| 6 | 0 | 0.0% | 0 | 0.0% | 3 [0–7] | 1.0% [0.0–2.3%] | 1 [0–4] | 0.6% [0.0–2.1%] | |
| 7+ | 4 | 1.3% | 0 | 0.0% | 7 [2-14] | 2.3% [0.6–4.5%] | 2 [0–6] | 1.1% [0.0–3.2%] | |
| Total that grew | 89 | 114 | 111 [88-134] | 172 [154-195] | |||||
| Total | 309 | 114 | 309 [309-309] | 172 [154-195] | |||||
| Amsterdam heterosexual | 0 | 150 | 90.9% | - | - | 138 [123-150] | 83.6% [74.5–90.9%] | - | |
| 1 | 13 | 7.9% | 25 | 96.2% | 17 [9-28] | 10.3% [5.5–17.0%] | 50 [35-72] | 86.4% [74.1–95.6%] | |
| 2 | 2 | 1.2% | 1 | 3.8% | 5 [1-11] | 3.0% [0.6–6.7%] | 5 [1-12] | 9.3% [2.0–19.0%] | |
| 3 | 0 | 0.0% | 0 | 0.0% | 2 [0–6] | 1.2% [0.0–3.6%] | 1 [0–5] | 2.0% [0.0–7.8%] | |
| 4 | 0 | 0.0% | 0 | 0.0% | 1 [0–3] | 0.6% [0.0–1.8%] | 0 [0–2] | 0.0% [0.0–4.3%] | |
| 5 | 0 | 0.0% | 0 | 0.0% | 0 [0–2] | 0.0% [0.0–1.2%] | 0 [0–2] | 0.0% [0.0–2.6%] | |
| 6 | 0 | 0.0% | 0 | 0.0% | 0 [0–2] | 0.0% [0.0–1.2%] | 0 [0–1] | 0.0% [0.0–2.0%] | |
| 7+ | 0 | 0.0% | 0 | 0.0% | 0 [0–3] | 0.0% [0.0–1.8%] | 0 [0–1] | 0.0% [0.0–2.0%] | |
| Total that grew | 15 | 26 | 27 [15-42] | 58 [42-83] | |||||
| Total | 165 | 26 | 165 [165-165] | 58 [42-83] | |||||
-
*
Parts of the actual Amsterdam transmission chains were observed in viral phylogenies of the major subtypes and circulating recombinant forms (B, 01AE, 02AG, C, D, G, A1 or 06 cpx).
-
†
Predicted based on the Bayesian branching process growth model and accounting for undiagnosed and unsampled individuals.
Table 3
Distribution of Amsterdam infections since 2014 in pre-existing and emerging transmission chains.
| Observed* | Predicted† | |||||||||
|---|---|---|---|---|---|---|---|---|---|---|
| Total | In pre-existing chains | In emerging chains | Total | In pre-existing chains | In emerging chains | |||||
| (N) | (N) | (%) | (N) | (%) | (N) | (N) | (%) | (N) | (%) | |
| MSM (Dutch) | 145 | 86 | 59.30% | 59 | 40.70% | 254 [202-318] | 136 [95-188] | 53.6% [44.1–62.4%] | 117 [93-147] | 46.4% [37.6–55.9%] |
| MSM (W. Europe, N. America, Oceania) | 40 | 25 | 62.50% | 15 | 37.50% | 68 [49-91] | 37 [23-56] | 54.8% [40.5–68.1%] | 31 [20-43] | 45.2% [31.9–59.5%] |
| MSM (E. & C. Europe) | 17 | 9 | 52.90% | 8 | 47.10% | 29 [18-42] | 15 [8-25] | 53.6% [34.2–72.7%] | 13 [7-21] | 46.4% [27.3–65.8%] |
| MSM (S. America & Caribbean) | 53 | 24 | 45.30% | 29 | 54.70% | 95 [72-126] | 50 [33-74] | 52.8% [40.3–64.8%] | 45 [31-61] | 47.2% [35.2–59.7%] |
| MSM (Other) | 42 | 14 | 33.30% | 28 | 66.70% | 76 [55-103] | 37 [22-57] | 48.4% [34.4–61.7%] | 39 [26-56] | 51.6% [38.3–65.6%] |
| MSM (All) | 297 | 158 | 53.20% | 139 | 46.80% | 523 [427-647] | 276 [200-377] | 52.8% [44.6–60.7%] | 246 [206-300] | 47.2% [39.3–55.4%] |
| Heterosexual (Dutch) | 14 | 2 | 14.30% | 12 | 85.70% | 38 [23-59] | 14 [5-29] | 37.8% [17.5–58.9%] | 23 [13-38] | 62.2% [41.1–82.5%] |
| Heterosexual (Sub-Saharan Africa) | 11 | 4 | 36.40% | 7 | 63.60% | 30 [17-51] | 10 [3-24] | 34.3% [11.3–58.6%] | 20 [11-34] | 65.7% [41.4–88.7%] |
| Heterosexual (S. America & Caribbean) | 14 | 8 | 57.10% | 6 | 42.90% | 35 [20-58] | 14 [5-33] | 42.9% [18.6–65.8%] | 19 [10-34] | 57.1% [34.2–81.4%] |
| Heterosexual (Other) | 5 | 3 | 60.0% | 2 | 40.0% | 13 [6-23] | 5 [1-12] | 39.1% [9.1–70.0%] | 8 [3-15] | 60.9% [30.0–90.9%] |
| Heterosexual (All) | 44 | 17 | 38.60% | 27 | 61.40% | 117 [80-173] | 45 [22-83] | 38.7% [22.6–54.9%] | 71 [49-105] | 61.3% [45.1–77.4%] |
-
*
Parts of the actual Amsterdam transmission chains were observed in viral phylogenies of the major subtypes and circulating recombinant forms (B, 01AE, 02AG, C, D, G, A1 or 06 cpx).
-
†
Predicted based on the Bayesian branching process growth model and accounting for undiagnosed and unsampled individuals.
Appendix 1—table 1
Patient characteristics for Amsterdam residents with an estimated infection date between 2014 and 2018.
| Strata | All patients | Patients with a sequence* | |
|---|---|---|---|
| Sex | Female | 40 (7.8%) | 24 (7%) |
| Male | 476 (92.2%) | 317 (93%) | |
| Risk group | MSM | 446 (86.4%) | 297 (87.1%) |
| Heterosexual | 70 (13.6%) | 44 (12.9%) | |
| Age group at estimated time of infection | 18–24 | 74 (14.3%) | 48 (14.1%) |
| 25–34 | 209 (40.5%) | 124 (36.4%) | |
| 35–44 | 113 (21.9%) | 76 (22.3%) | |
| 45–59 | 110 (21.3%) | 87 (25.5%) | |
| 60+ | 10 (1.9%) | 6 (1.8%) | |
| Place of birth | Sub-Saharan Africa | 24 (4.8%) | 16 (4.8%) |
| Asia | 20 (4%) | 13 (3.9%) | |
| Australia & New Zealand | 2 (0.4%) | 2 (0.6%) | |
| Central Europe | 25 (5%) | 16 (4.8%) | |
| Eastern Europe | 8 (1.6%) | 1 (0.3%) | |
| Suriname, Curacao and Aruba | 41 (8.1%) | 32 (9.6%) | |
| South America and Caribbean | 63 (12.5%) | 35 (10.5%) | |
| Middle East and North Africa | 31 (6.1%) | 20 (6%) | |
| Netherlands | 213 (42.2%) | 159 (47.6%) | |
| North America | 23 (4.6%) | 14 (4.2%) | |
| Western Europe | 55 (10.9%) | 26 (7.8%) | |
| Estimated time to diagnosis (years) | 0.4 [0.04–3.2] | 0.41 [0.03–3.25] | |
-
*
Patients with sequence of a subtype or circulating recombinant form B, 01AE, 02AG, C, D, G, A1 or 06 cpx
Appendix 1—table 2
Number and size of phylogenetically observed transmission chains by transmission risk group and HIV subtype or circulating recombinant form (CRF) for central analysis.
95% confidence intervals are obtained from 100 bootstrap analyses for each subtype alignment.
| Risk group | Subtype or CRF | Total number of chains | Chains of size 1 | Chains of size 2-5 | Chains of size 5-10 | Chains of size ≥10 |
|---|---|---|---|---|---|---|
| Amsterdam MSM | B | 1237 [1259-2097] | 856 [872-1446] | 276 [264-479] | 64 [58-116] | 41 [32-66] |
| 01AE | 41 [37-46] | 24 [21-32] | 15 [12-17] | 2 [0-3] | 0 [0-1] | |
| 02AG | 26 [21-34] | 17 [14-27] | 7 [2-9] | 1 [0-4] | 1 [0-2] | |
| C | 26 [24-28] | 22 [18-25] | 4 [3-6] | 0 [0-0] | 0 [0-0] | |
| A1 | 21 [18-25] | 13 [10-18] | 6 [4-7] | 0 [0-3] | 2 [0-2] | |
| G | 9 [8-9] | 0 [0-0] | 8 [6-8] | 1 [1-2] | 0 [0-0] | |
| D | 6 [6-6] | 6 [6-6] | 0 [0-0] | 0 [0-0] | 0 [0-0] | |
| 06cpx | 2 [2-2] | 2 [2-2] | 0 [0-0] | 0 [0-0] | 0 [0-0] | |
| Amsterdam heterosexuals | B | 277 [272-482] | 225 [217-392] | 45 [39-77] | 6 [2-9] | 1 [1-3] |
| 01AE | 23 [20-24] | 19 [15-21] | 4 [3-6] | 0 [0-0] | 0 [0-0] | |
| 02AG | 111 [106-126] | 77 [77-100] | 30 [20-31] | 4 [1-6] | 0 [0-1] | |
| C | 87 [82-89] | 72 [63-75] | 15 [13-19] | 0 [0-1] | 0 [0-0] | |
| A1 | 43 [37-49] | 34 [30-42] | 8 [3-12] | 1 [0-2] | 0 [0-1] | |
| G | 28 [28-33] | 22 [20-29] | 6 [4-8] | 0 [0-0] | 0 [0-0] | |
| D | 16 [15-18] | 12 [10-16] | 4 [2-5] | 0 [0-0] | 0 [0-0] | |
| 06cpx | 17 [14-21] | 12 [8-15] | 4 [2-8] | 1 [0-2] | 0 [0-1] |
Appendix 1—table 3
Estimated numbers of phylogenetic transmission chains with ancestral origins in each geographic region from central analysis.
95% confidence intervals obtained from 100 bootstrap analyses for each subtype alignment.
| Subtype or CRF | Estimated ancestral origin | Amsterdam MSM | Amsterdam heterosexuals |
|---|---|---|---|
| B | Amsterdam - other risk group | 16 [8-27] | 73 [59-124] |
| Netherlands | 699 [721-1238] | 110 [113-199] | |
| Western Europe | 147 [133-253] | 18 [6-24] | |
| Eastern Europe and Central Asia | 27 [21-46] | 1 [1-3] | |
| North America | 84 [71-151] | 7 [4-20] | |
| South America and Caribbean | 21 [16-43] | 1 [1-4] | |
| Middle East and North Africa | 2 [1-5] | - | |
| South and South-East Asia | 3 [2-8] | - | |
| Oceania | 1 [1-3] | - | |
| 01AE | Amsterdam - other risk group | - | 2 [1-4] |
| Netherlands | 11 [5-17] | 10 [5-14] | |
| Middle East and North Africa | 1 [1-1] | - | |
| South and South-East Asia | 21 [14-24] | 8 [3-9] | |
| 02AG | Amsterdam - other risk group | - | 5 [3-8] |
| Netherlands | 11 [6-20] | 29 [20-39] | |
| Sub-Saharan Africa | 4 [1-7] | 39 [29-51] | |
| Western Europe | 5 [1-4] | 2 [1-9] | |
| C | Amsterdam - other risk group | 2 [1-3] | 1 [1-2] |
| Netherlands | 8 [3-9] | 21 [15-26] | |
| Sub-Saharan Africa | 4 [2-7] | 29 [25-39] | |
| Western Europe | 1 [1-3] | 2 [1-7] | |
| South America and Caribbean | 2 [1-3] | 1 [1-1] | |
| South and South-East Asia | 3 [1-3] | 1 [1-2] | |
| A1 | Amsterdam - other risk group | 1 [1-2] | 3 [1-5] |
| Netherlands | 10 [6-13] | 19 [12-24] | |
| Sub-Saharan Africa | 1 [1-2] | 11 [9-17] | |
| Western Europe | 2 [1-3] | - | |
| Eastern Europe and Central Asia | 1 [1-2] | - | |
| A1 | South and South-East Asia | 3 [1-3] | - |
| Netherlands | 2 [1-3] | 5 [1-7] | |
| Sub-Saharan Africa | 1 [1-3] | 12 [9-18] | |
| Western Europe | 1 [1-2] | 3 [1-6] | |
| G | Eastern Europe and Central Asia | 2 [1-2] | 1 [1-1] |
| Netherlands | 1 [1-2] | 2 [1-6] | |
| D | Sub-Saharan Africa | 2 [1-3] | 9 [5-11] |
| Netherlands | - | 1 [1-4] | |
| Sub-Saharan Africa | 1 [1-1] | 9 [6-14] | |
| Western Europe | 1 [1-1] | - |
Appendix 1—table 4
Viral suppression status of the phylogenetically observed pre-2014 Amsterdam transmission chains.
| Risk group | Subtype | All sampled individuals virally suppressed by 2014* | Pre-2014 chains | Pre-2014 chains that grew | Individuals (Total) | Individuals (infected before 2014) | Individuals (infected before 2014 and not virally suppressed) | |||
|---|---|---|---|---|---|---|---|---|---|---|
| (n) | (n) | (%) | (n) | (n) | (%) | (n) | (%) | |||
| Amsterdam MSM | B | Yes | 866 | 35 | 4% | 1432 | 1279 | 89% | 0 | 0% |
| B | No | 286 | 44 | 15% | 1740 | 1303 | 75% | 352 | 20% | |
| Non-B | Yes | 83 | 8 | 10% | 172 | 119 | 69% | 0 | 0% | |
| Non-B | No | 18 | 2 | 11% | 80 | 51 | 64% | 23 | 29% | |
| Total | 1253 | 89 | 7% | 3424 | 2752 | 80% | 375 | 11% | ||
| Amsterdam heterosexual | B | Yes | 180 | 5 | 3% | 218 | 200 | 92% | 0 | 0% |
| B | No | 85 | 4 | 5% | 284 | 189 | 67% | 90 | 32% | |
| Non-B | Yes | 221 | 5 | 2% | 301 | 281 | 93% | 0 | 0% | |
| Non-B | No | 90 | 1 | 1% | 235 | 142 | 60% | 92 | 39% | |
| Total | 576 | 15 | 3% | 1038 | 812 | 78% | 182 | 18% | ||
| Total | 1829 | 104 | 6% | 4462 | 3564 | 80% | 557 | 12% | ||
-
*
Individuals infected prior to 2014, with last viral load measurement before 2014 below 100copies/ml.
Appendix 1—table 5
Observed and estimated ancestral origins of phylogenetic subgraphs and estimated complete transmission chains with new cases in 2014-2018.
| Risk group | Subtype | Origin of chains | Observed (N) | Observed (%) | Predicted (N) | Predicted (%) |
|---|---|---|---|---|---|---|
| Amsterdam MSM | B | Amsterdam - other risk group | 1 [1-3] | 0.8% [0.5-2%] | 2 [1-6] | 0.5% [0.2-1.4%] |
| Asia | 2 [2-4] | 1.5% [1-2.3%] | 6 [2-12] | 1.5% [0.5-2.8%] | ||
| Eastern Europe and Central Asia | 7 [4-13] | 5% [2.9-7.3%] | 21 [12-30] | 5% [3-7.3%] | ||
| South America and Caribbean | 5 [2-12] | 3.2% [1.5-5.9%] | 14 [8-22] | 3.4% [1.9-5.4%] | ||
| Middle East and North Africa | 1 [1-2] | 0.8% [0.5-1.3%] | 3 [1-7] | 0.7% [0.2-1.7%] | ||
| Netherlands | 96 [84-159] | 71.1% [64-77.1%] | 294 [272-317] | 71.1% [66.8-75.4%] | ||
| North America | 8 [4-17] | 5.7% [2.5-9.3%] | 23 [15-33] | 5.7% [3.6-8%] | ||
| Oceania | 2 [2-2] | 1% [1-1%] | 1 [1-2] | 0.2% [0.2-0.5%] | ||
| Western Europe | 16 [11-29] | 11.7% [8-15.9%] | 48 [36-61] | 11.6% [8.7-14.9%] | ||
| Non-B | Sub-Saharan Africa | 3 [1-5] | 10.7% [3.6-19.6%] | 7 [3-13] | 10.8% [4.2-19%] | |
| Amsterdam - other risk group | 1 [1-3] | 3.9% [3.3-11.4%] | 2 [1-4] | 2.5% [1.3-6.2%] | ||
| Asia | 8 [6-11] | 31% [22.2-42.3%] | 21 [13-30] | 31.3% [20.3-43.1%] | ||
| Eastern Europe and Central Asia | 1 [1-1] | 3.5% [3.3-3.6%] | 1 [1-2] | 1.5% [1.3-2.8%] | ||
| South America and Caribbean | 1 [1-2] | 4% [3.3-8.2%] | 3 [1-7] | 4.4% [1.4-10%] | ||
| Middle East and North Africa | 1 [1-1] | 3.6% [3.3-4%] | 1 [1-3] | 1.5% [1.3-4.2%] | ||
| Netherlands | 12 [8-16] | 46.4% [32.1-59.5%] | 31 [22-41] | 45.9% [34.2-57.8%] | ||
| Amsterdam heterosexual | B | Amsterdam - other risk group | 3 [1-7] | 21.4% [7.4-38.5%] | 22 [14-30] | 21.4% [13.8-29.4%] |
| Eastern Europe and Central Asia | 1 [1-1] | 7.2% [6.7-7.7%] | 1 [1-2] | 1% [0.9-1.9%] | ||
| Netherlands | 11 [8-17] | 75% [54.8-92%] | 75 [64-89] | 74.8% [66.3-82.8%] | ||
| North America | 1 [1-3] | 6.7% [4.7-10.6%] | 2 [1-4] | 1.9% [0.9-4.2%] | ||
| Western Europe | 1 [1-3] | 7.1% [5.3-20.3%] | 2 [1-6] | 2.1% [0.9-5.5%] | ||
| Non-B | Sub-Saharan Africa | 5 [2-8] | 33.3% [9.4-51.9%] | 39 [29-51] | 31.9% [24-40.5%] | |
| Amsterdam - other risk group | 1 [1-2] | 6.7% [5.4-12.5%] | 9 [3-15] | 7% [2.7-11.8%] | ||
| Asia | 1 [1-1] | 6.7% [5.7-9.8%] | 2 [1-6] | 1.7% [0.8-4.7%] | ||
| Netherlands | 8 [4-12] | 50% [28.9-74.2%] | 62 [50-77] | 50.4% [41.7-59.7%] | ||
| North America | 1 [1-1] | 5.6% [5.6-5.6%] | 1 [1-2] | 0.8% [0.7-1.6%] |
Appendix 1—table 6
Patient characteristics for individuals with an estimated infection date between 2010-2012.
| Risk group | Place of birth | Amsterdam infections 2010-2012 | Median estimated time to diagnosis (years) [95% quantiles] |
|---|---|---|---|
| Amsterdam MSM | W.Europe, N.America, Oceania | 72 | 0.42 [0.05-3.41] |
| E. & C. Europe | 31 | 0.88 [0.13-6.04] | |
| S. America & Caribbean | 81 | 1.04 [0.05-5.57] | |
| Netherlands | 295 | 0.56 [0.04-4.77] | |
| Other | 56 | 1.38 [0.12-4.97] | |
| All | 535 | 0.64 [0.04-4.97] | |
| Amsterdam heterosexual | Sub-Saharan Africa | 35 | 3.86 [0.33-6.8] |
| S. America & Caribbean | 22 | 1.37 [0.14-5.68] | |
| Netherlands | 27 | 1.42 [0.07-6.16] | |
| Other | 13 | 1.6 [0.99-6.12] | |
| All | 97 | 2.22 [0.1-6.67] |
Appendix 1—table 7
Estimated undiagnosed HIV infections in Amsterdam until May 2019 using equal weights, or weighting by diagnosis rates or estimated infection rates.
| Estimated undiagnosed HIV infections | ||||
|---|---|---|---|---|
| Risk group | Region of birth | Equal weights | Weighted by diagnosis rates | Weighted by infection rates |
| Amsterdam MSM | Netherlands | 17% [15-20%] | 11% [9-13%] | 11% [9-13%] |
| W. Europe, N. America, Oceania | 16% [11-21%] | 9% [6-13%] | 9% [6-14%] | |
| E. & C. Europe | 22% [16-32%] | 14% [9-22%] | 16% [11-24%] | |
| S. America and Caribbean | 23% [19-30%] | 19% [14-25%] | 17% [13-22%] | |
| Other | 27% [20-34%] | 23% [16-31%] | 20% [14-27%] | |
| All | 20% [18-22%] | 14% [13-17%] | 14% [12-16%] | |
| Amsterdam heterosexual | Netherlands | 34% [23-47%] | 28% [18-39%] | 30% [21-44%] |
| Sub-Saharan Africa | 60% [48-69%] | 48% [37-59%] | 57% [47-67%] | |
| S. America and Caribbean | 30% [19-45%] | 25% [16-38%] | 28% [19-42%] | |
| Other | 44% [31-59%] | 31% [18-50%] | 40% [25-57%] | |
| All | 44% [37-50%] | 34% [28-41%] | 41% [35-48%] | |
| All | 24% [22-27%] | 18% [16-20%] | 19% [17-21%] | |
Appendix 1—table 8
Input quantities used to estimate proportion of infections acquired locally in Amsterdam.
| Risk group | Subtype | Chains of non-Amsterdam origin (1 − λ) | Phylogenetically observed emergent subgraphs () | Emergent transmission chains (unobserved) (N∗not-obs) | Total emergent chains (partially observed + unobserved |) | Individuals in pre-existing and emergent chains (x∗) | Proportion of infections that are importations () | External importations () | Locally acquired infections (γ) |
|---|---|---|---|---|---|---|---|---|---|
| Amsterdam hetersexual | B | 78.6% [70.6-86.2%] | 12 [12-12] | 14 [5-30] | 26 [17-42] | 58 [35-95] | 0.47 [0.27-0.7] | 36.6% [21.1-55.6%] | 63.4% [44.4-78.9%] |
| Amsterdam hetersexual | Non-B | 93% [88.2-97.3%] | 14 [14-14] | 17 [7-35] | 31 [21-49] | 58 [37-93] | 0.55 [0.35-0.78] | 51% [32.1-72.5%] | 49% [27.5-67.9%] |
| Amsterdam MSM | B | 99.5% [98.6-100%] | 85 [85-85] | 45 [30-64] | 130 [115-149] | 412 [332-521] | 0.32 [0.25-0.4] | 31.5% [24.8-39.3%] | 68.5% [60.7-75.2%] |
| Amsterdam MSM | Non-B | 98.5% [94.1-100%] | 29 [29-29] | 13 [5-24] | 42 [34-53] | 106 [72-172] | 0.4 [0.24-0.58] | 38.7% [23.5-57.2%] | 61.3% [42.8-76.5%] |
Appendix 1—table 9
Empirical results from partially observed subgraphs in phylogenetic trees, and model estimates based on complete transmission chains, adjusting for sampling (those in study with a sequence available) for new infections since 2014.
Estimated reproduction number and proportion of locally acquired infections are also presented.
| Phylogenetically observed | Model estimates | ||||||||
|---|---|---|---|---|---|---|---|---|---|
| Risk group | Subtype | New cases | Subgraphs | Average new cases | Transmission chains | Average new cases | Effective reproduction number | Variance-to-mean ratio | Infections acquired in Amsterdam |
| Amsterdam MSM | B | 241 | 368 | 0.65 | 413 [398-432] | 1.01 | 0.26 [0.22-0.31] | 1.69 [1.26-2.38] | 68.5% [60.7-75.2%] |
| Amsterdam MSM | Non-B | 65 | 55 | 1.18 | 68 [60-79] | 1.62 | 0.39 [0.28-0.53] | 1.33 [1.02-2.53] | 61.3% [42.8-76.5%] |
| Amsterdam heterosexual | Non-B | 21 | 105 | 0.2 | 122 [112-140] | 0.49 | 0.17 [0.09-0.26] | 1.26 [1.01-2.94] | 49% [27.5-67.9%] |
| Amsterdam heterosexual | B | 23 | 86 | 0.27 | 100 [91-116] | 0.59 | 0.19 [0.11-0.3] | 1.25 [1.01-2.59] | 63.4% [44.4-78.9%] |
Author response table 1
| Year | MSM | Heterosexuals |
|---|---|---|
| 2014 | 0.26 | 0.19 |
| 2015 | 0.23 | 0.19 |
| 2016 | 0.20 | 0.20 |
| 2017 | 0.17 | 0.21 |
| 2018 | 0.13 | 0.22 |
Author response table 2
| MSM | HSX | |||
|---|---|---|---|---|
| year | origin | weight | origin | weight |
| 2014 | W.Europe, N.America, Oceania | 0.28 | Sub-Saharan Africa | 0.25 |
| 2015 | 0.27 | 0.30 | ||
| 2016 | 0.19 | 0.20 | ||
| 2017 | 0.13 | 0.16 | ||
| 2018 | 0.13 | 0.09 | ||
| 2014 | E and C. Europe | 0.25 | S. America and Caribbean | 0.24 |
| 2015 | 0.25 | 0.16 | ||
| 2016 | 0.29 | 0.27 | ||
| 2017 | 0.12 | 0.19 | ||
| 2018 | 0.08 | 0.14 | ||
| 2014 | S. America and Caribbean | 0.20 | NL | 0.24 |
| 2015 | 0.20 | 0.24 | ||
| 2016 | 0.20 | 0.20 | ||
| 2017 | 0.25 | 0.14 | ||
| 2018 | 0.16 | 0.18 | ||
| 2014 | NL | 0.28 | Other | 0.20 |
| 2015 | 0.24 | 0.20 | ||
| 2016 | 0.20 | 0.35 | ||
| 2017 | 0.14 | 0.25 | ||
| 2018 | 0.15 | 0.00 | ||
| 2014 | Other | 0.23 | ||
| 2015 | 0.15 | |||
| 2016 | 0.23 | |||
| 2017 | 0.21 | |||
| 2018 | 0.19 |
Additional files
Download links
A two-part list of links to download the article, or parts of the article, in various formats.
Downloads (link to download the article as PDF)
Open citations (links to open the citations from this article in various online reference manager services)
Cite this article (links to download the citations from this article in formats compatible with various reference manager tools)
Estimating the potential to prevent locally acquired HIV infections in a UNAIDS Fast-Track City, Amsterdam
eLife 11:e76487.
https://doi.org/10.7554/eLife.76487


