Decomposing the role of alpha oscillations during brain maturation
- Department of Psychology, University of Zurich, Methods of Plasticity Research, Switzerland
- University Research Priority Program (URPP) Dynamic of Healthy Aging, Switzerland
- Neuroscience Center Zurich (ZNZ), University of Zurich & ETH Zurich, Switzerland
Figures
Figure 1 with 2 supplements
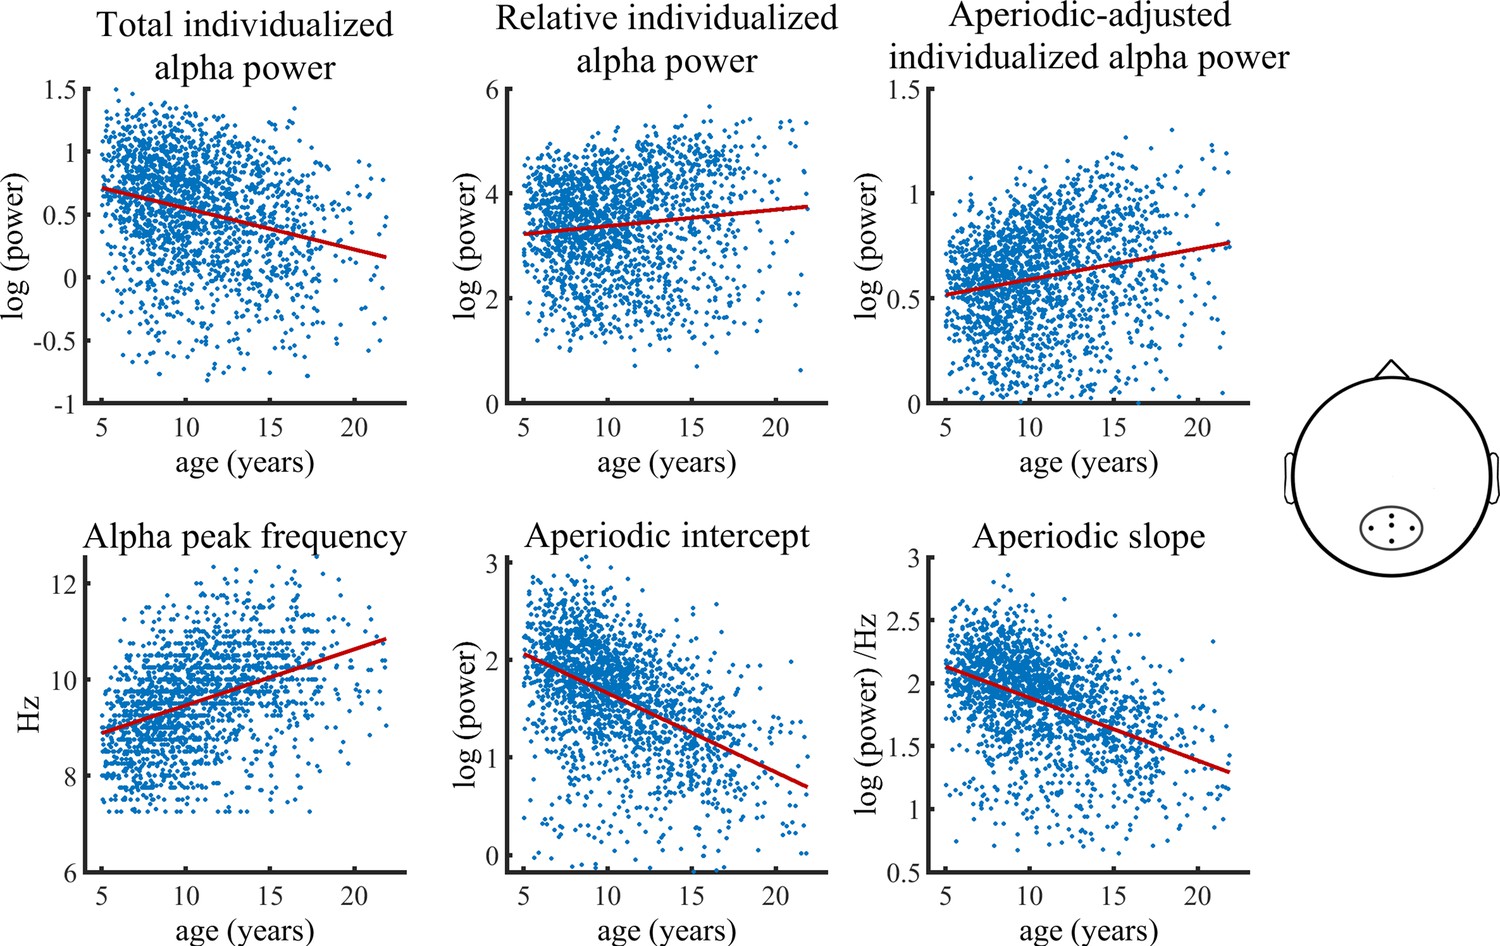
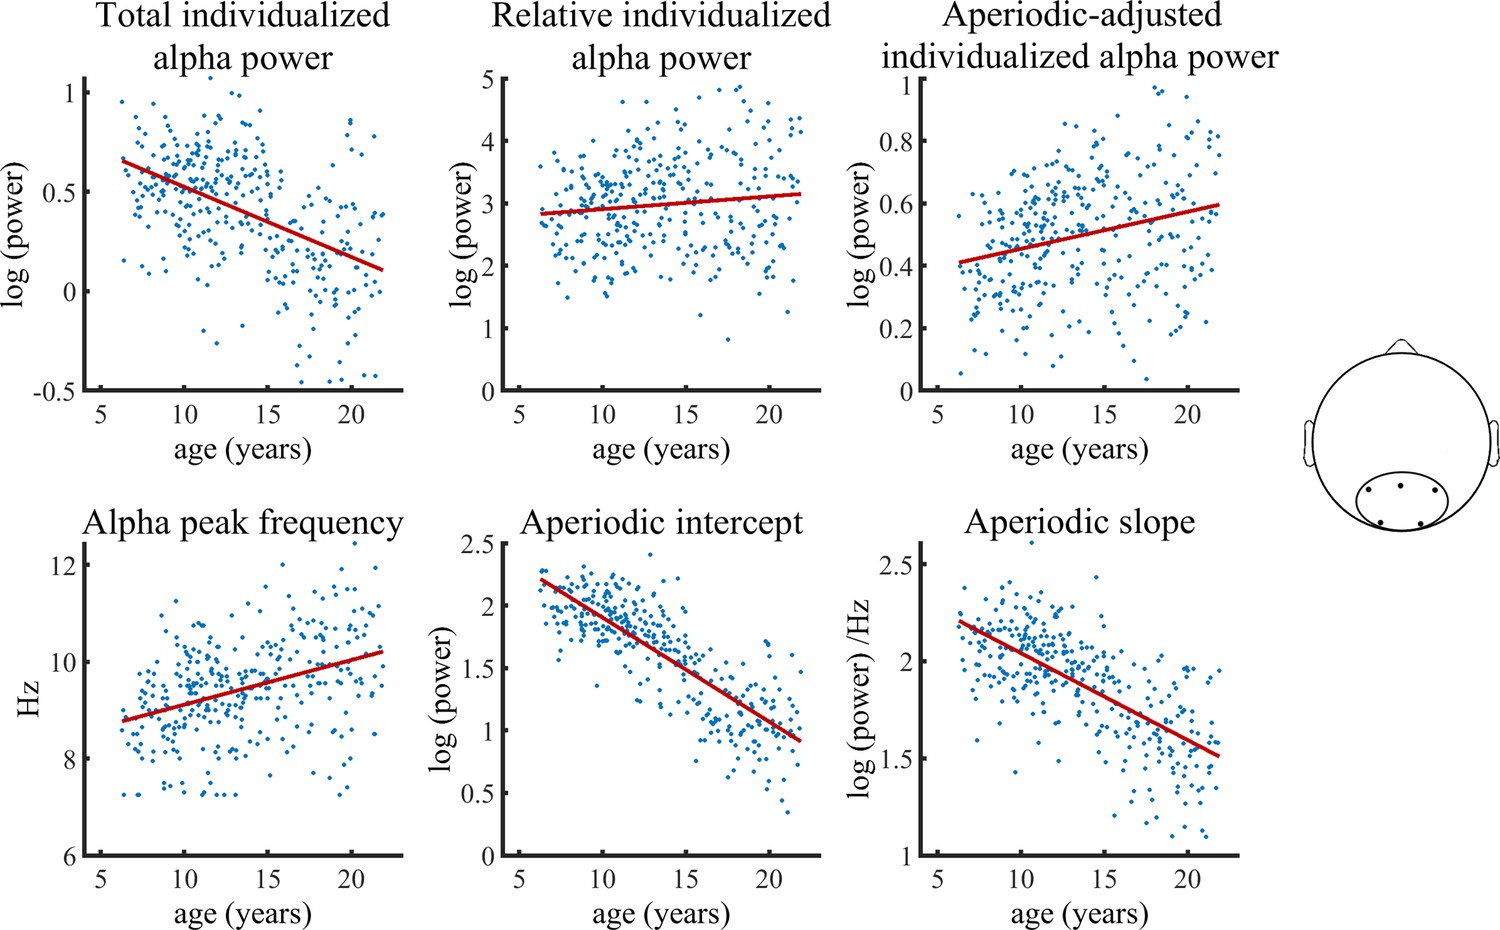
Visualization of data of the main HBN sample used in the Bayesian regression model.
Solid lines represent fitted regression lines. The schematic head on the right indicates the location of the electrode cluster from which data was aggregated. The results revealed a decrease in total individualized alpha power with increasing age. Importantly, this relationship inverts when individualized alpha power is adjusted for the aperiodic signal, which then shows an age-related increase in power. Furthermore, relative individualized alpha power exhibits a positive relationship to brain maturation. An age-related increase of the IAF and a decrease of the aperiodic intercept and slope are also indicated (bottom row).
-
Figure 1—source data 1
Numerical data for each scatterplot displayed in Figure 1.
- https://cdn.elifesciences.org/articles/77571/elife-77571-fig1-data1-v1.csv
Figure 1—figure supplement 1
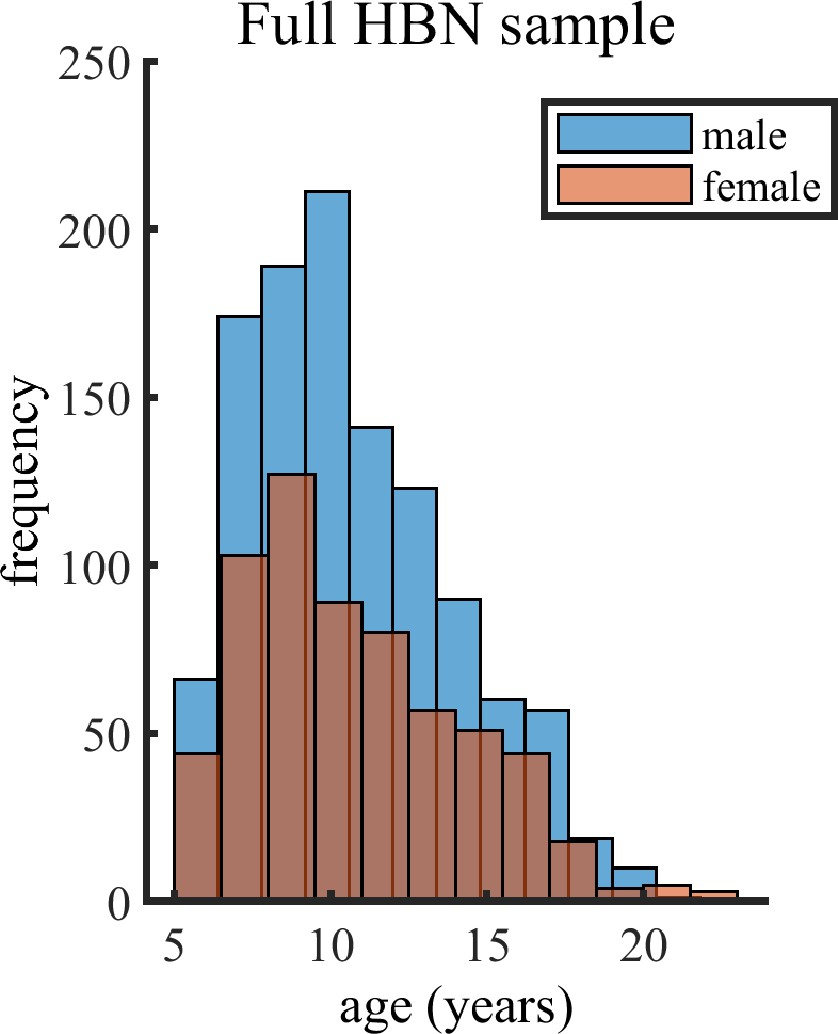
Distribution of age and gender in the final included sample plotted in Figure 1 and used for the statistical analyses.
Figure 1—figure supplement 2
Visualization of data of the HBN subsample without any given diagnosis used in the Bayesian regression models.
Solid lines represent fitted regression lines. The schematic head (right) indicates the location of the electrode cluster from which data was aggregated.
Figure 2
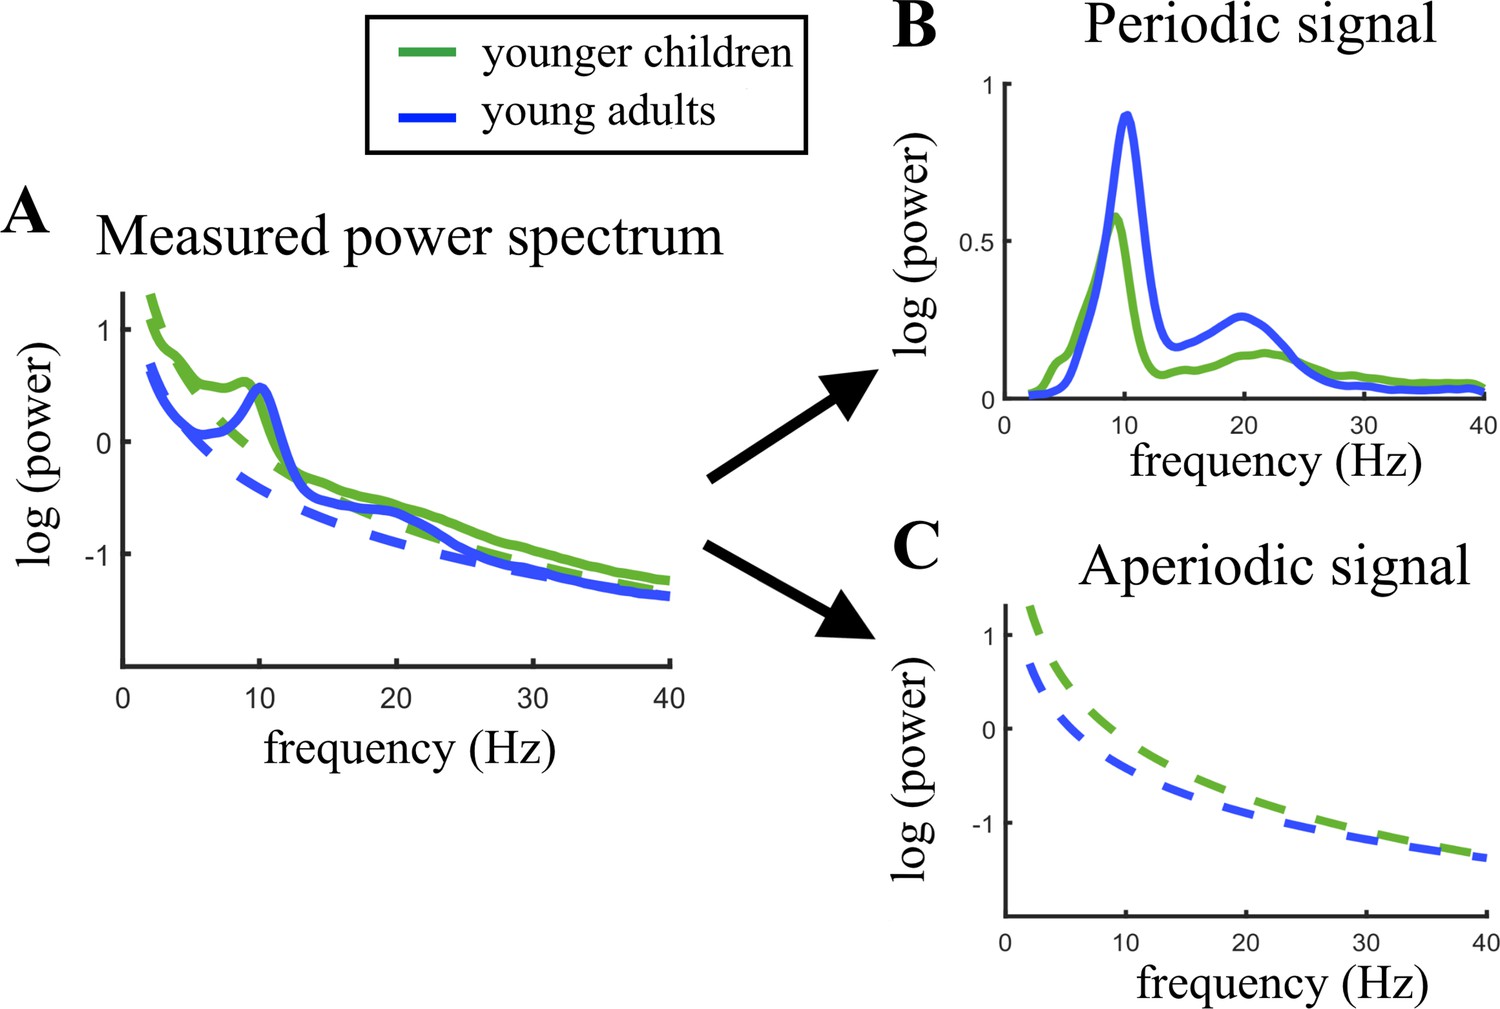
Visualization of age-related changes during brain maturation in (A) the measured power spectrum (i.e., total power spectrum), (B) the periodic (i.e. aperiodic-adjusted) power spectrum, and (C) the aperiodic signal.
Younger children represent the 20% youngest children in the sample, young adults the 20% oldest participants. This split of the sample was only done for visualization purposes and not used in any statistical analysis.
-
Figure 2—source data 1
Numerical averaged data of the periodic and aperiodic signal of both age groups.
- https://cdn.elifesciences.org/articles/77571/elife-77571-fig2-data1-v1.csv
Figure 3 with 2 supplements
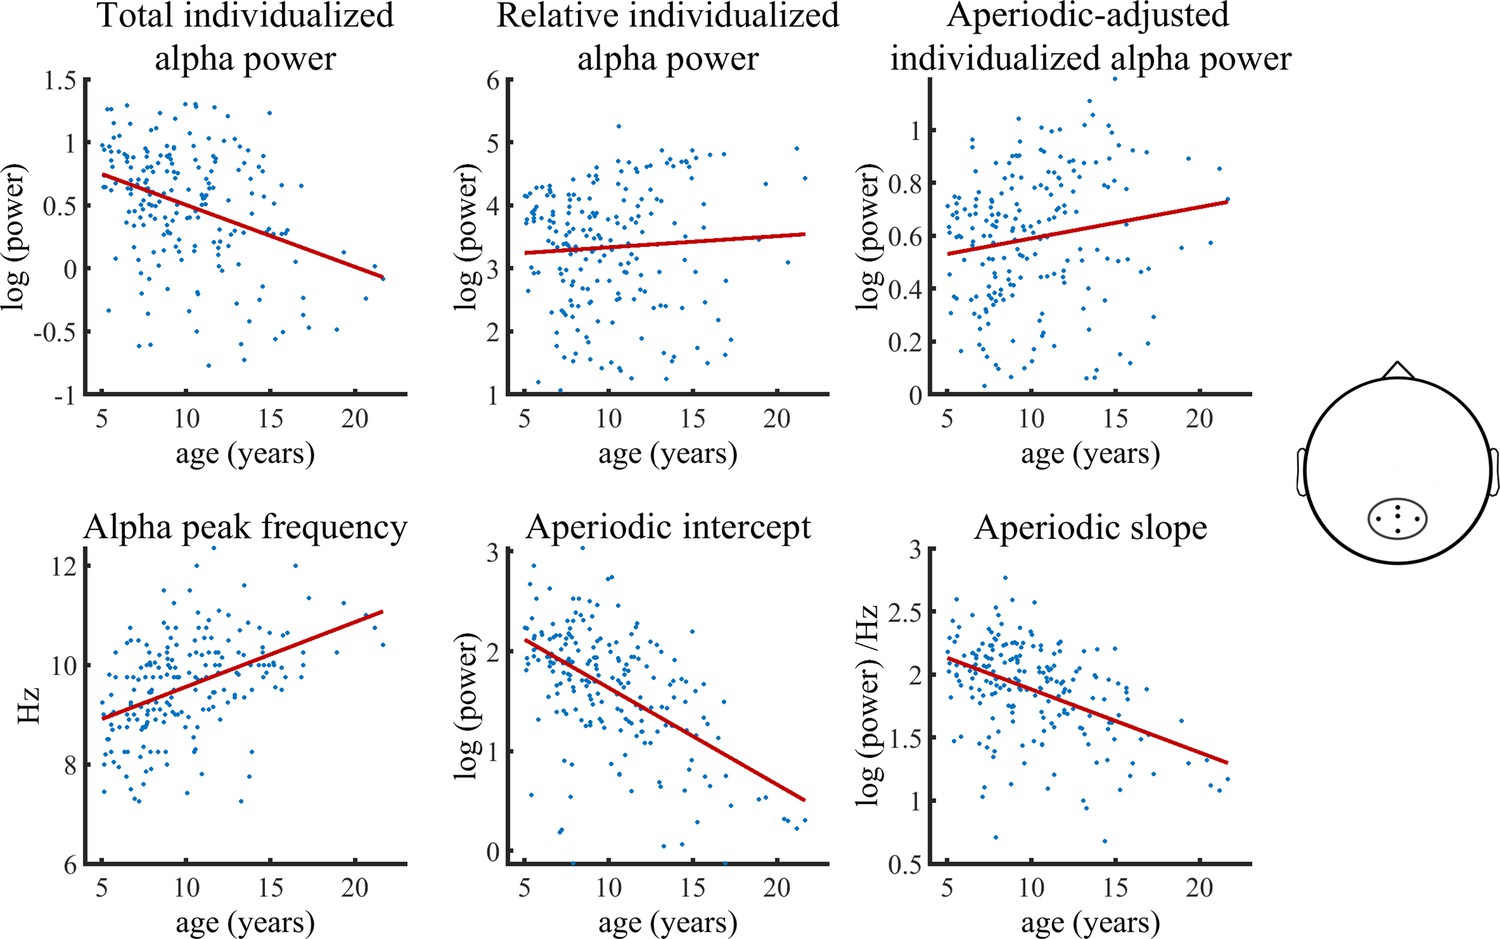
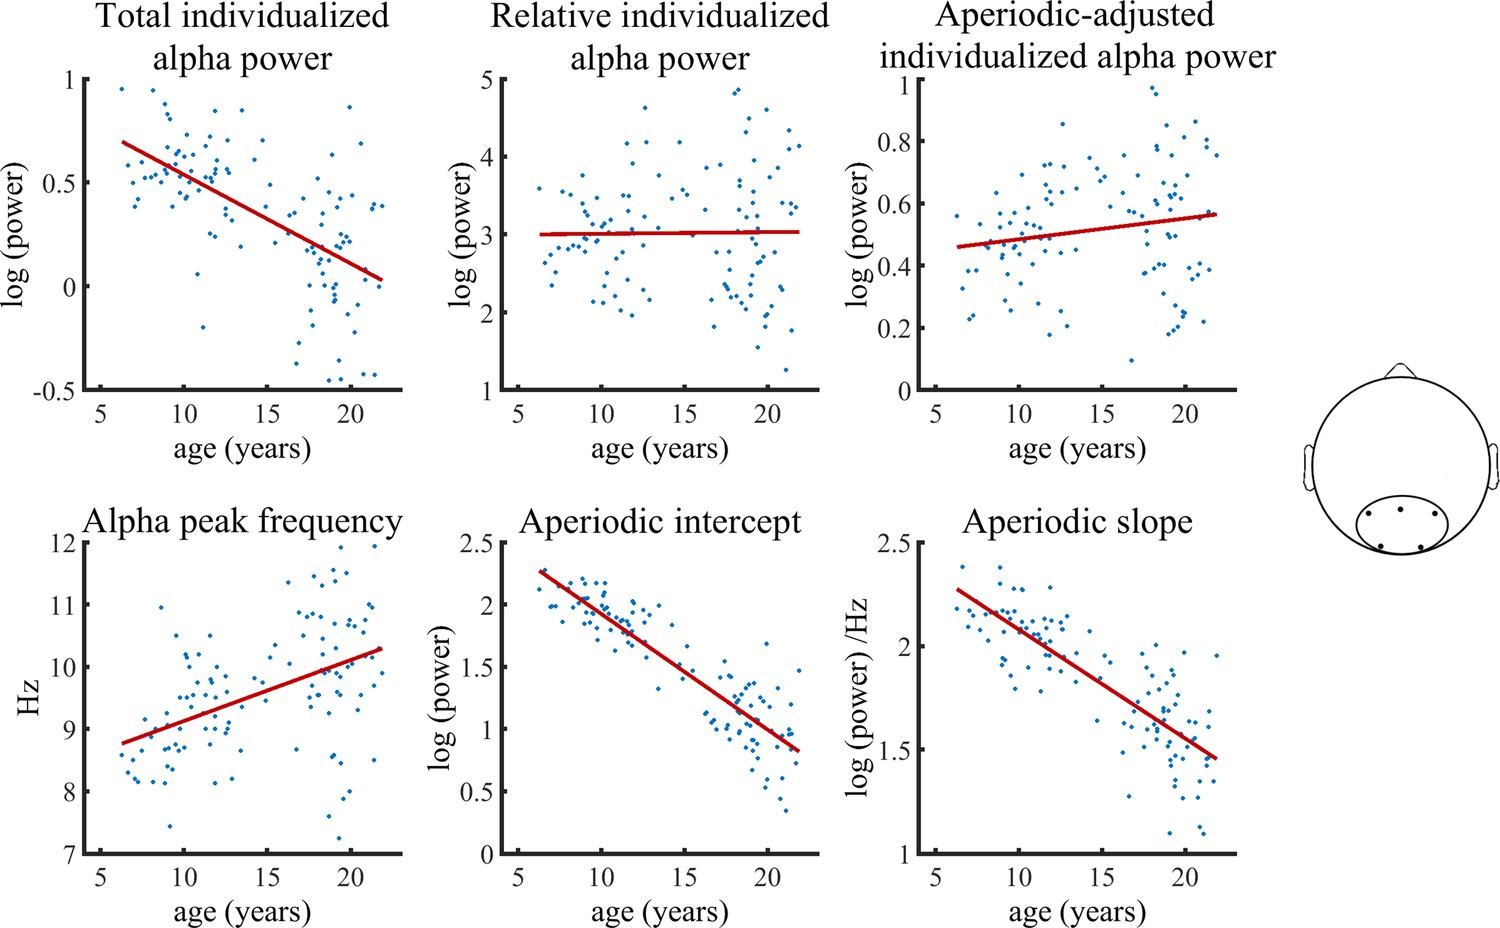
Visualization of data of the validation sample used in the Bayesian regression model.
Solid lines represent fitted regression lines. The schematic head on the right indicates the location of the electrode cluster from which data was aggregated.
-
Figure 3—source data 1
Numerical data for each scatterplot displayed in Figure 3.
- https://cdn.elifesciences.org/articles/77571/elife-77571-fig3-data1-v1.csv
Figure 3—figure supplement 1
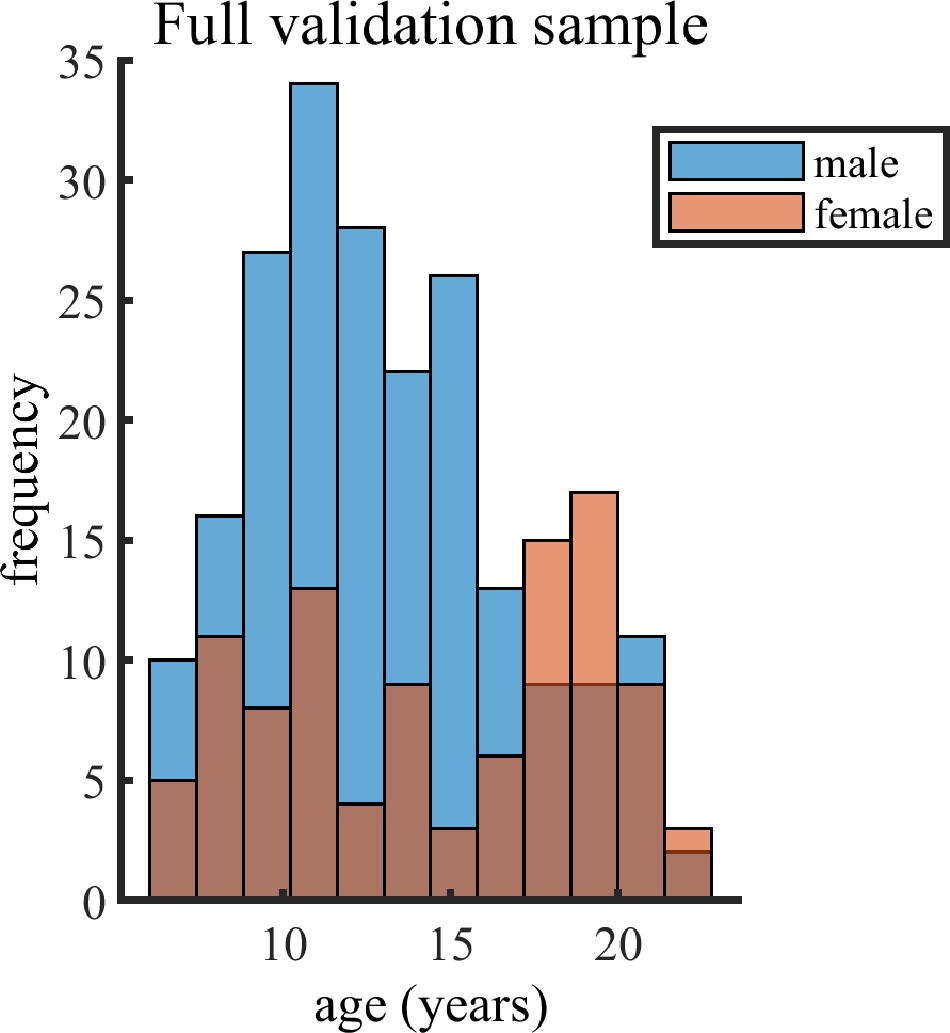
Distribution of age and gender in the final included validation sample plotted in Figure 3 and used for the statistical analyses.
Figure 3—figure supplement 2
Visualization of data of the healthy validation subsample used in the Bayesian regression models.
Solid lines represent fitted regression lines. The schematic head (right) indicates the location of the electrode cluster from which data was aggregated.
Figure 4
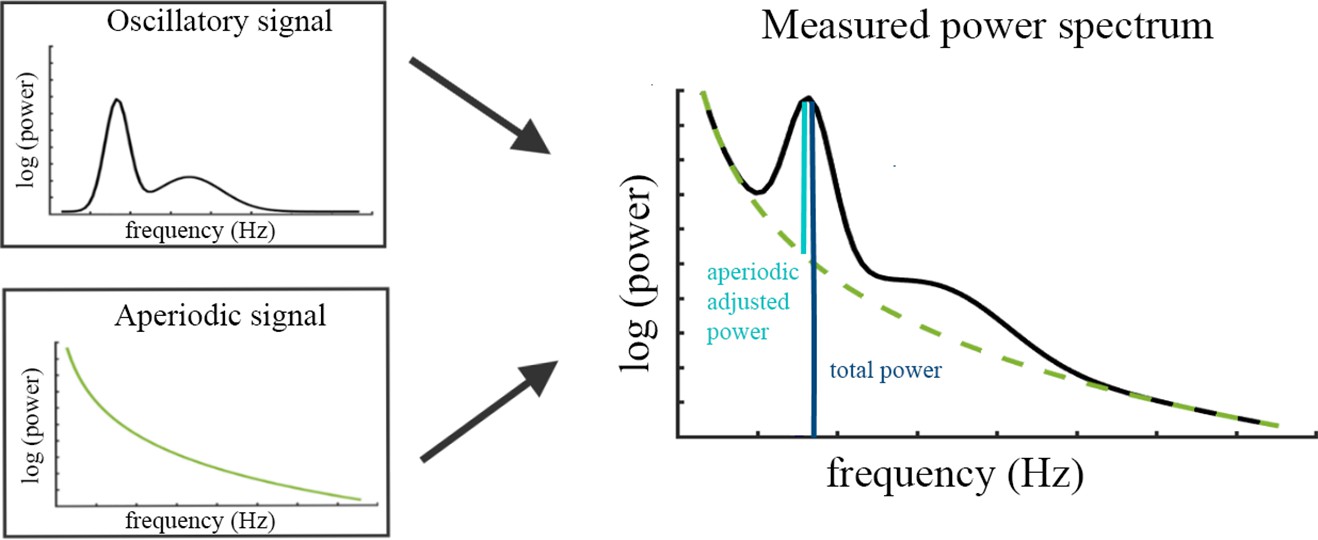
Illustration of the two components (left) superimposed in the measured neural power spectrum (right).
The dark blue bar (right) indicates how total power is assessed relative to the absolute zero. The light blue bar represents aperiodic-adjusted power, which is assessed relative to the aperiodic signal.
Appendix 1—figure 1
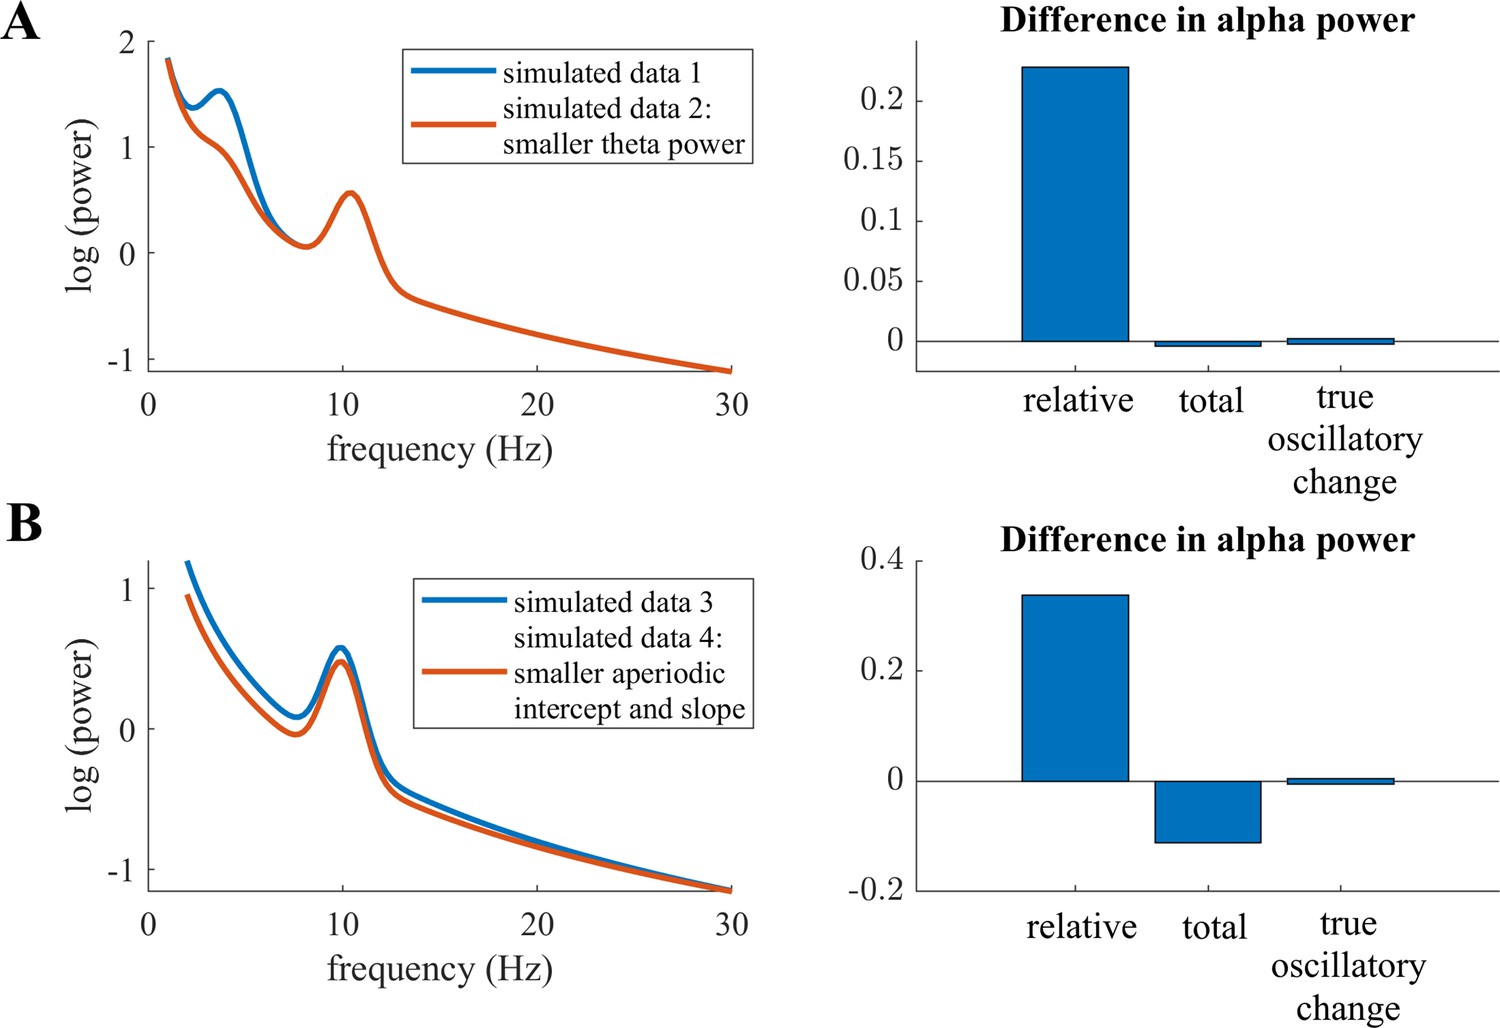
Visualizations of possible fallacies in total and relative power measures in simulated data.
Bar plots on the right indicate the difference in alpha power between simulated data 2 and simulated data 1 in A, and simulated data 4 to simulated data 3 in B. (A) Two simulated power spectra with identical true alpha oscillatory power. The high amplitude oscillation in the theta range (~5 Hz) in simulated data 1 conflates results in relative power differences in the alpha band. (B) Two simulated power spectra with identical alpha oscillatory power. Here, differences in the aperiodic intercept and slope between the two signals conflate results in total and relative power differences in the alpha band.
Appendix 2—figure 1
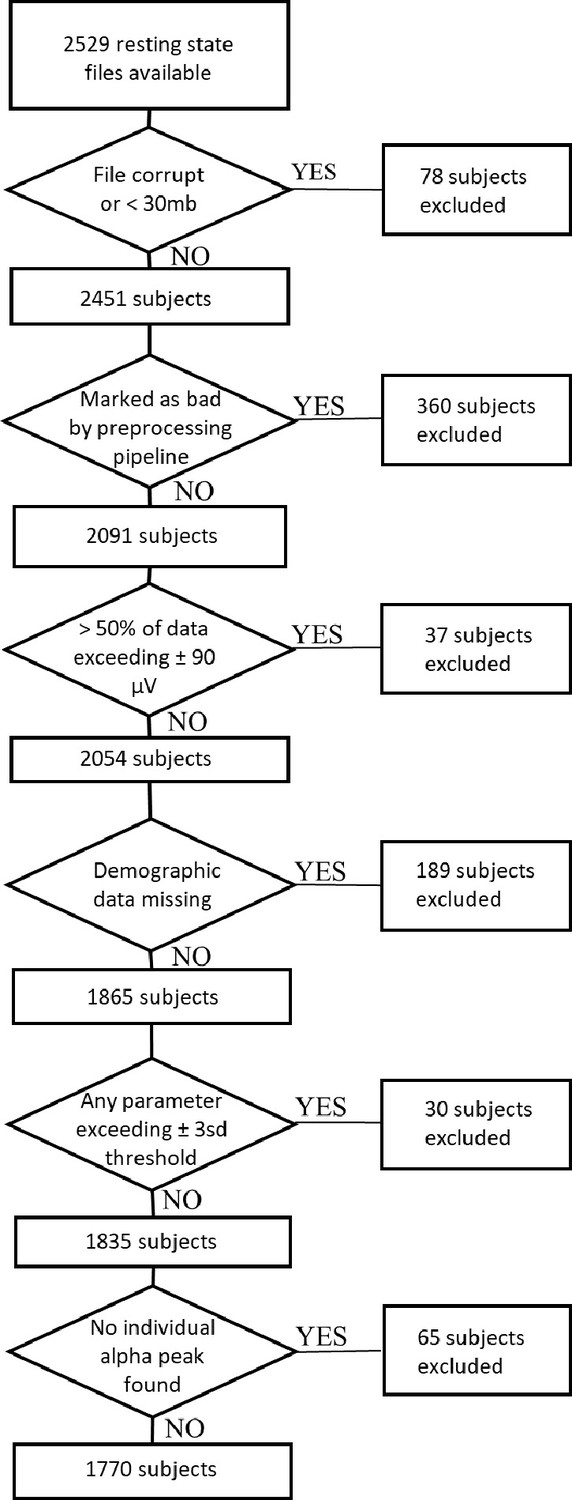
Flow chart of exclusion criteria applied to the main HBN dataset, yielding 1770 subjects plotted in Figure 1 and used for the statistical analyses.
Tables
Table 1
Bayesian regression model results of full sample with categorical diagnosis predictor.
| Outcome | βpredictor [CI] | ||||
|---|---|---|---|---|---|
| age | gender | diagnosis: ADHD | diagnosis: Other | age*gender | |
| alpha peak frequency | 0.42 [0.34 0.49] | –0.08 [–0.15 –0.02] | –0.09 [–0.19 0.01] | –0.07 [–0.17 0.04] | –0.04 [–0.15 0.08] |
| total individualized alpha power | –0.31 [–0.38 –0.24] | –0.37 [–0.43 –0.31] | 0.01 [–0.09 0.10] | 0.01 [–0.09 0.12] | 0.13 [0.01 0.25] |
| Relative individualized alpha power | 0.14 [0.06 0.22] | –0.35 [–0.41 –0.28] | –0.01 [–0.11 0.10] | 0.01 [–0.10 0.12] | –0.05 [–0.17 0.07] |
| aperiodic-adjusted individualized alpha power | 0.23 [0.16 0.30] | –0.39 [–0.45 –0.33] | –0.04 [–0.14 0.05] | –0.02 [–0.13 0.08] | –0.06 [–0.17 0.06] |
| aperiodic intercept | –0.54 [–0.61 –0.48] | –0.37 [–0.42 –0.32] | –0.02 [–0.10 0.07] | –0.02 [–0.10 0.08] | 0.08 [–0.02 0.19] |
| aperiodic slope | –0.44 [–0.51 –0.38] | –0.39 [–0.44 –0.33] | –0.04 [–0.12 0.05] | –0.03 [–0.12 0.06] | –0.05 [–0.15 0.06] |
-
Note: Credible Interval (CI)=99.17%.
-
Table 1—source data 1
Numerical values of the statistical values displayed in Table 1.
- https://cdn.elifesciences.org/articles/77571/elife-77571-table1-data1-v1.csv
Table 2
Pearson correlation coefficients between the measures of alpha power, aperiodic intercept and slope and age.
| Total individualized alpha power | Relative individualized alpha power | Aperiodic-adjusted individualized alpha power | Aperiodic intercept | Aperiodic slope | |
|---|---|---|---|---|---|
| Total individualized alpha power | 0.66 | 0.64 | 0.84 | 0.64 | |
| Relative individualized alpha power | 0.88 | 0.34 | 0.35 | ||
| Aperiodic- adjusted individualized alpha power | 0.34 | 0.36 | |||
| Aperiodic intercept | 0.89 |
-
Table 2—source data 1
Numerical values of the correlations displayed in Table 2.
- https://cdn.elifesciences.org/articles/77571/elife-77571-table2-data1-v1.csv
Table 3
Bayesian regression model results of the full validation sample with categorical ADHD predictor.
| Outcome | βpredictor [CI] | |||
|---|---|---|---|---|
| Age | Gender | ADHD diagnosis | Age*gender | |
| Alpha peak frequency | 0.34 [0.15 0.53] | –0.05 [–0.21 0.11] | –0.04 [–0.20 0.12] | 0.04 [–0.25 0.33] |
| Total individualized alpha power | –0.44 [–0.61 –0.27] | –0.05 [–0.19 0.11] | 0.04 [–0.11 0.19] | –0.07 [–0.33 0.30] |
| Relative individualized alpha power | 0.20 [0.00 0.39] | 0.05 [–0.12 0.22] | –0.02 [–0.18 0.15] | –0.10 [–0.40 0.20] |
| Aperiodic-adjusted individualized alpha power | 0.33 [0.14 0.52] | –0.02 [–0.18 0.13] | –0.04 [–0.21 0.12] | –0.06 [–0.35 0.24] |
| Aperiodic intercept | –0.76 [–0.88 –0.65] | –0.10 [–0.19 0.00] | 0.00 [–0.10 0.09] | –0.07 [–0.25 0.11] |
| Aperiodic slope | –0.60 [–0.77 –0.45] | –0.08 [–0.21 0.05] | –0.06 [–0.19 0.06] | –0.13 [–0.36 0.10] |
-
Note: CI = 98.97% Credible Interval, gender variable is dummy coded: 1=female, 0=male.
-
Table 3—source data 1
Numerical values of the statistical values displayed in Table 3.
- https://cdn.elifesciences.org/articles/77571/elife-77571-table3-data1-v1.csv
Table 4
Summary table of the Bayesian regression model results on the influence of anatomical thalamic measures on the three different measures of alpha power (total, relative and aperiodic-adjusted) and on aperiodic signal components.
| Outcome | βpredictor [CI] | |||||
|---|---|---|---|---|---|---|
| Left thalamic radiation | Right thalamic radiation | Thalamus volume | Total intracranial volume | Age | Gender | |
| Total individualized alpha power | 0.06 [–0.02 0.14] | 0.07 [–0.01 0.15] | 0.03 [–0.23 0.29] | –0.01 [–0.14 0.13] | –0.23 [–0.31 –0.15] | –0.35 [–0.43 –0.27] |
| Aperiodic-adjusted individualized alpha power | 0.15 [0.07 0.23] | 0.15 [0.07 0.23] | 0.07 [–0.19 0.33] | –0.04 [–0.18 0.10] | 0.22 [0.14 0.30] | –0.39 [–0.47 –0.31] |
| Relative alpha power | 0.11 [0.04 0.20] | 0.14 [ 0.06 0.22] | 0.00 [–0.27 0.27] | –0.01 [–0.15 0.13] | 0.14 [0.07 0.22] | –0.35 [–0.43 –0.27] |
| Aperiodic intercept | 0.04 [–0.04 0.10] | 0.02 [–0.05 0.09] | –0.01 [–0.24 0.23] | 0.03 [–0.09 0.15] | –0.51 [–0.58 –0.44] | –0.35 [–0.42 –0.28] |
| Aperiodic slope | 0.07 [0.00 0.14] | 0.03 [ –0.03 0.11] | –0.11 [–0.34 0.13] | –0.03 [–0.13 0.17] | –0.48 [–0.55 –0.41] | –0.39 [–0.45 –0.31] |
-
Note: CI = 98.52% Credible interval, gender variable is dummy coded: 1=female, 0=male. Credible intervals and β estimates of the covariates (total intracranial volume, age, and gender) showed minor deviations across the three models (see 4.4.3, models 4, 5 & 6), due to non-deterministic sampling in the Bayesian model estimation. Therefore, here they were averaged across the three models.
-
Table 4—source data 1
Numerical values of the statistical values displayed in Table 4.
- https://cdn.elifesciences.org/articles/77571/elife-77571-table4-data1-v1.csv
Table 5
Linear models determining the influence of Flanker total task scores on total, relative, and aperiodic-adjusted individualized alpha power.
| Outcome | standardized βpredictor (standard error) | ||
|---|---|---|---|
| Flanker total score | Age | Gender | |
| Aperiodic-adjusted individualized alpha power | 0.073 (0.022), p=0.001 | 0.23 (0.022), p<0.001 | –0.75 (0.045), p<0.001 |
| Total individualized alpha power | 0.044 (0.022), p=0.046 | –0.23 (0.022), p<0.001 | –0.74 (0.045), p<0.001 |
| Relative individualized alpha power | 0.068 (0.023), p=0.002 | 0.14 (0.023), p<0.001 | –0.68 (0.047), p<0.001 |
-
Adjusted significance level: P=0.0264.
-
Table 5—source data 1
Numerical values of the statistical values displayed in Table 5.
- https://cdn.elifesciences.org/articles/77571/elife-77571-table5-data1-v1.csv
Table 6
Characteristics of the final sample.
| Characteristic | HBN subsample without any given diagnosis | Full HBN sample | Healthy validation subsample | Full validation sample |
|---|---|---|---|---|
| Sample size | 190 | 1770 | 108 | 310 |
| Female | 86 | 632 | 62 | 103 |
| Male | 104 | 1138 | 46 | 207 |
| Mean age in years (sd) | 10.07 (3.39) | 10.81 (3.44) | 12.97 (3.75) | 13.51 (4.16) |
| Mean IQ (sd) | 106.16 (15.24) | 98.86 (16.55) | 107.95 (13.13) | 103.37 (14.77) |
-
Table 6—source data 1
Numerical values of the demographics displayed in Table 6.
- https://cdn.elifesciences.org/articles/77571/elife-77571-table6-data1-v1.csv
Table 7
Overview of extracted parameters.
| Parameter | Description |
|---|---|
| Individual alpha frequency (IAF) | Frequency at maximum power in search window 7–14 Hz |
| Total canonical alpha power | Averaged log power in the fixed-frequency window [8Hz–13Hz], extracted from the total power spectrum |
| Total individualized alpha power | Averaged log power in window [- 4 Hz to +2 Hz] relative to IAF, extracted from the total power spectrum |
| Relative canonical alpha power | Averaged power in the fixed-frequency window [8Hz–13Hz], divided by the average power of the full power spectrum (2–40 Hz), extracted from the total power spectrum |
| Relative individualized alpha power | Averaged power in window [- 4 Hz to +2 Hz] relative to IAF, divided by the average power of the full power spectrum (2–40 Hz), extracted from the total power spectrum |
| Aperiodic-adjusted canonical alpha power | Canonical alpha power, extracted from the aperiodic-adjusted log power spectrum |
| Aperiodic-adjusted individual alpha power | Individualized alpha power, extracted from the aperiodic-adjusted log power spectrum |
| Aperiodic intercept | Intercept parameter of the aperiodic signal extracted by specparam |
| Aperiodic exponent | Exponent parameter (i.e. negative slope) of the aperiodic signal extracted by specparam |
-
Note: The term total power spectrum refers to the power spectrum as extracted from the data using Welch’s algorithm. The aperiodic-adjusted power spectrum results from a subtraction of the aperiodic signal from the total power spectrum.
Appendix 4—table 1
Main HBN dataset: Bayesian regression model controlling for possible influence of the specParam model fit on effects of age, gender, and diagnosis on the outcome variables.
| Outcome | βpredictor [CI] | |||||
|---|---|---|---|---|---|---|
| Age | Gender | Diagnosis: ADHD | Diagnosis: Other | Age*gender | specParam model fit | |
| Alpha peak frequency | 0.41 [0.34 0.49] | –0.08 [–0.14 –0.02] | –0.07 [–0.17 0.02] | –0.06 [–0.16 0.04] | –0.04 [–0.16 0.08] | –0.04 [–0.10 0.02] |
| Total individualized alpha power | –0.30 [–0.37 –0.23] | –0.34 [–0.37 –0.23] | 0.02 [–0.08 0.11] | 0.01 [–0.09 0.12] | 0.15 [0.04 0.27] | 0.13 [0.07 0.19] |
| Relative individualized alpha power | 0.18 [0.10 0.25] | –0.31 [–0.38 –0.25] | 0.00 [–0.10 0.10] | 0.00 [–0.10 0.11] | –0.03 [–0.15 0.09] | 0.17 [ 0.11 0.23] |
| Aperiodic-adjusted individualized alpha power | 0.27 [0.20 0.34] | –0.35 [–0.41 –0.29] | –0.03 [–0.12 0.07] | –0.02 [–0.13 0.08] | –0.04 [–0.16 0.08] | 0.15 [ 0.09 0.20] |
| Aperiodic intercept | –0.54 [–0.60 –0.48] | –0.31 [–0.36 –0.26] | 0.00 [–0.08 0.09] | –0.01 [–0.09 0.08] | 0.11 [0.02 0.21] | 0.23 [0.18 0.27] |
| Aperiodic slope | –0.43 [–0.49 –0.37] | –0.31 [–0.36 –0.26] | –0.02 [–0.10 0.06] | –0.03 [–0.11 0.06] | –0.01 [–0.10 0.09] | 0.32 [ 0.27 0.37] |
-
Note: CI = 98.97% Credible Interval, gender variable is dummy coded: 1=female, 0=male.
Appendix 5—table 1
Bayesian regression model results of the main dataset.
Adjusted specParam fitting parameters (peak width limits: [1 8]; max number of peaks: 6; minimum peak height: 0.1; peak threshold: 2 sd above mean; aperiodic mode: fixed) and data exclusion criteria of specParam fit: MAE >0.1 or MAE <0.025.
| Outcome | βpredictor [CI] | ||||
|---|---|---|---|---|---|
| Age | Gender | Diagnosis: ADHD | Diagnosis: Other | Age*gender | |
| Alpha peak frequency | 0.42 [0.34 0.49] | –0.05 [–0.12 –0.01] | –0.07 [–0.16 0.04] | –0.06 [–0.16 0.05] | –0.01 [–0.15 0.10] |
| Total individualized alpha power | –0.33 [–0.40 –0.26] | –0.36 [–0.42 –0.30] | 0.01 [–0.09 0.10] | 0.02 [–0.08 0.12] | 0.14 [0.03 0.26] |
| Relative individualized alpha power | 0.15 [0.07 0.22] | –0.34 [–0.40 –0.28] | –0.01 [–0.11 0.09] | 0.01 [–0.09 0.11] | –0.04 [–0.16 0.09] |
| Aperiodic-adjusted individualized alpha power | 0.24 [0.17 0.32] | –0.37 [–0.43 –0.31] | –0.03 [–0.13 0.07] | –0.02 [–0.11 0.08] | –0.04 [–0.16 0.08] |
| Aperiodic intercept | –0.57 [–0.63 –0.518] | –0.35 [–0.40 –0.30] | –0.01 [–0.09 0.07] | –0.01 [–0.10 0.07] | 0.09 [–0.01 0.19] |
| Aperiodic slope | –0.47 [–0.53 –0.40] | –0.37 [–0.42 –0.32] | –0.03 [–0.12 0.05] | –0.04 [–0.13 0.05] | –0.04 [–0.15 0.06] |
-
Note: Credible Interval (CI)=99.17%
Appendix 6—table 1
Bayesian regression model results of the main HBN dataset, using the specParam periodic alpha peak parameter.
| Outcome | βpredictor [CI] | |||
|---|---|---|---|---|
| Age | Gender | ADHD diagnosis | Age*gender | |
| Alpha peak frequency | 0.42 [0.35 0.49] | –0.07 [–0.14 –0.02] | –0.07 [–0.17 0.02] | –0.04 [–0.15 0.08] |
| Total individualized alpha power | –0.31 [–0.39 –0.24] | –0.37 [–0.42 –0.30] | 0.02 [–0.08 0.11] | 0.14 [0.02 0.25] |
| Relative individualized alpha power | 0.16 [0.08 0.23] | –0.34 [–0.41 –0.28] | –0.01 [–0.11 0.09] | –0.05 [–0.17 0.07] |
| specParam periodic alpha peak power | 0.20 [0.12 0.27] | –0.30 [–0.37 –0.24] | –0.01 [–0.11 0.08] | –0.05 [–0.17 0.07] |
| Aperiodic intercept | –0.56 [–0.62 –0.50] | –0.35 [–0.41 –0.30] | 0.00 [–0.09 0.08] | 0.09 [–0.01 0.19] |
| Aperiodic slope | –0.38 [–0.43 –0.33] | –0.03 [–0.11 0.06] | –0.04 [–0.15 0.06] | |
-
Note: CI = 99.17% Credible Interval; gender variable is dummy coded: 1=female, 0=male.
Author response table 1
Pearson correlation coefficients between the different measures of α power, aperiodic intercept and slope and age.
| Total α power | Relative α power | Aperiodic- adjusted α power | Aperiodic intercept | Aperiodic slope | |
|---|---|---|---|---|---|
| Total α power | 0.66 | 0.64 | 0.84 | 0.64 | |
| Relative α power | 0.88 | 0.34 | 0.35 | ||
| Aperiodic- adjusted α power | 0.34 | 0.36 | |||
| Aperiodic intercept | 0.89 |
Additional files
-
Supplementary file 1
Supplementary table presenting model comparison results for the main statistical analysis of the HBN sample.
- https://cdn.elifesciences.org/articles/77571/elife-77571-supp1-v1.docx
-
Supplementary file 2
Supplementary statistics tables of the main dataset.
A: Bayesian regression model results of HBN subsample of subjects without any given diagnosis.B: Bayesian regression model results of full HBN sample with categorical sub-diagnosis predictor.C: Bayesian regression model results for canonical alpha power measures in the full HBN sample.
- https://cdn.elifesciences.org/articles/77571/elife-77571-supp2-v1.docx
-
Supplementary file 3
Supplementary statistics tables of the validation dataset.
A: Validation study: Bayesian regression model results of subjects without any given diagnosis, using uninformative priors.B: Validation study: Bayesian regression model results using informative priors extracted from the main HBN analysis.
- https://cdn.elifesciences.org/articles/77571/elife-77571-supp3-v1.docx
-
Supplementary file 4
Supplementary analysis results on global white matter integrity extracted from DTI.
Bayesian regression model investigating the influence of global white matter integrity on aperiodic signal parameters in the HBN dataset.
- https://cdn.elifesciences.org/articles/77571/elife-77571-supp4-v1.docx
-
Transparent reporting form
- https://cdn.elifesciences.org/articles/77571/elife-77571-transrepform1-v1.pdf
Download links
A two-part list of links to download the article, or parts of the article, in various formats.
Downloads (link to download the article as PDF)
Open citations (links to open the citations from this article in various online reference manager services)
Cite this article (links to download the citations from this article in formats compatible with various reference manager tools)
Decomposing the role of alpha oscillations during brain maturation
eLife 11:e77571.
https://doi.org/10.7554/eLife.77571


