Early life stressful experiences escalate aggressive behavior in adulthood via changes in transthyretin expression and function
- CSIR-Institute of Genomics & Integrative Biology, India
- Academy of Scientific and Innovative Research (AcSIR), India
- All India Institute of Medical Sciences, India
- Institute of Health Sciences, Presidency University, India
Figures
Figure 1 with 10 supplements

Brain-region-specific transcriptional responses in peripubertal stress induced adult males showing escalated aggression.
(A) Experimental timeline of peripubertal stress (PPS) exposure, resident intruder (RI) behavioral paradigm, brain dissection and transcriptome analysis. (B) Phenotypic behavioral screening post RI scoring in control mice without PPS exposure (Ctrl-RI; N=60) and experimental mice with PPS exposure (PPS-RI; N=60) Histogram represents non-aggressive (Nagg; N=57) and less aggressive (Lagg; N=3) mice in the Ctrl-RI cohort. PPS-RI cohort comprises of escalated aggressive (Eagg; N=32), hyper-aggressive (Hagg; N=15), moderate-aggressive (Magg; N=8) and less-aggressive (Lagg; N=5) mice (C) Attack latency of Eagg, Hagg and Magg mice of PPS-RI cohort. (D) X-Y plot depicting the log 2 fold changes of differentially expressed genes (DEGs) in prefrontal cortex (PFC) in X-axis and hypothalamus (Hypo) in Y-axis and their overlap. (E) Heatmap of DEGs in Ctrl-RI (Control) vs PPS-RI escalated aggressive (SEagg) males Hypo and PFC and (F) KEGG gene enrichment analysis. RNA sequencing libraries were prepared from N=3 mice/biological replicates per group.
-
Figure 1—source data 1
Data points for attack latency.
- https://cdn.elifesciences.org/articles/77968/elife-77968-fig1-data1-v2.xlsx
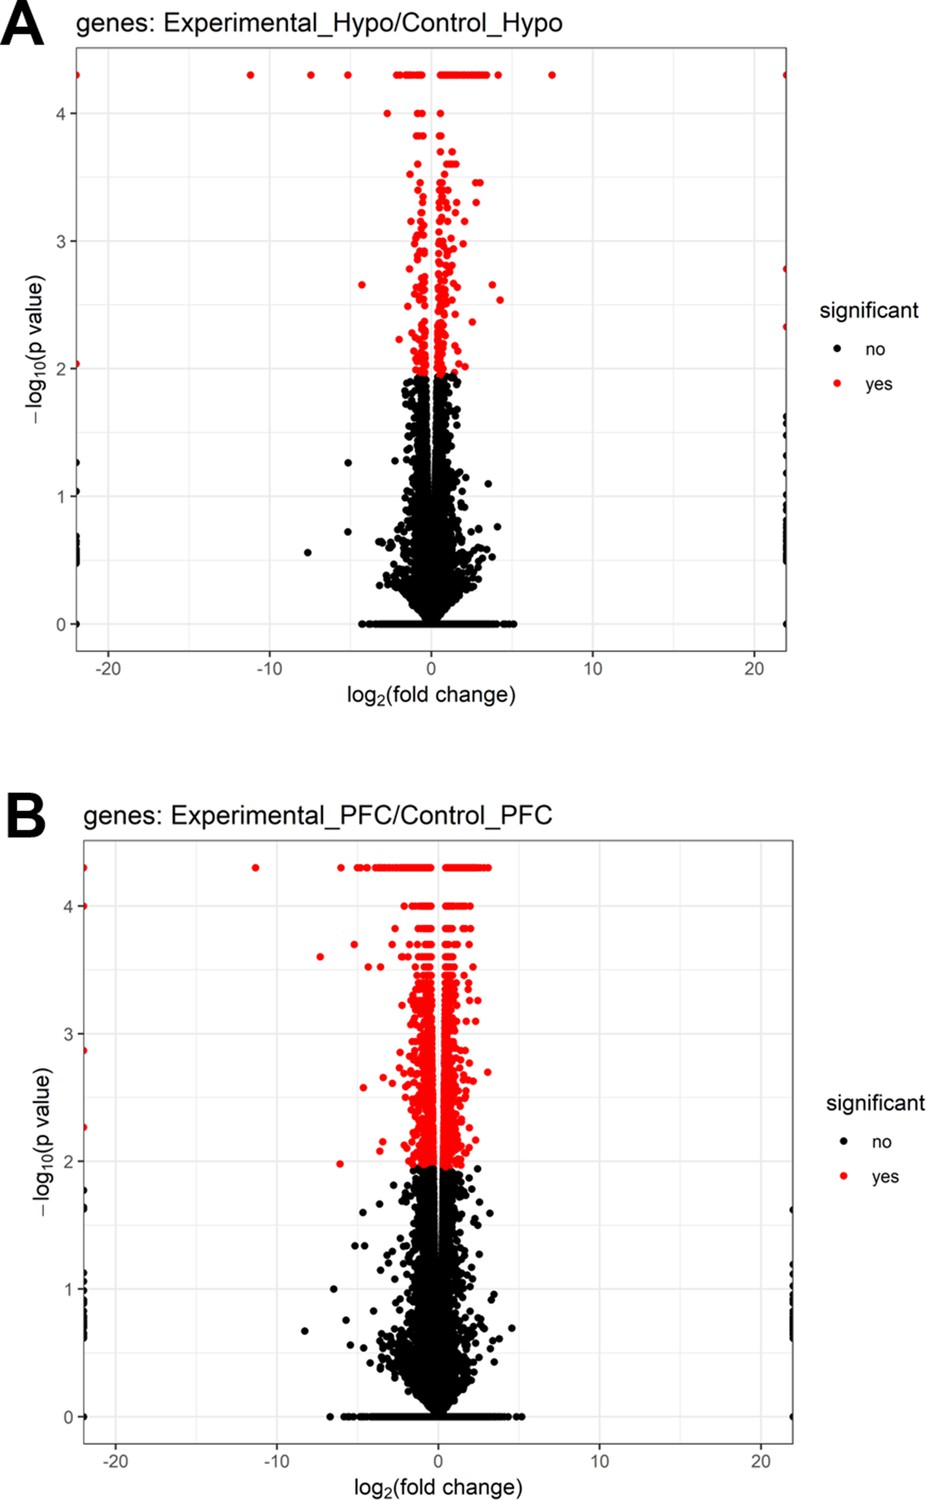
Figure 1—figure supplement 1
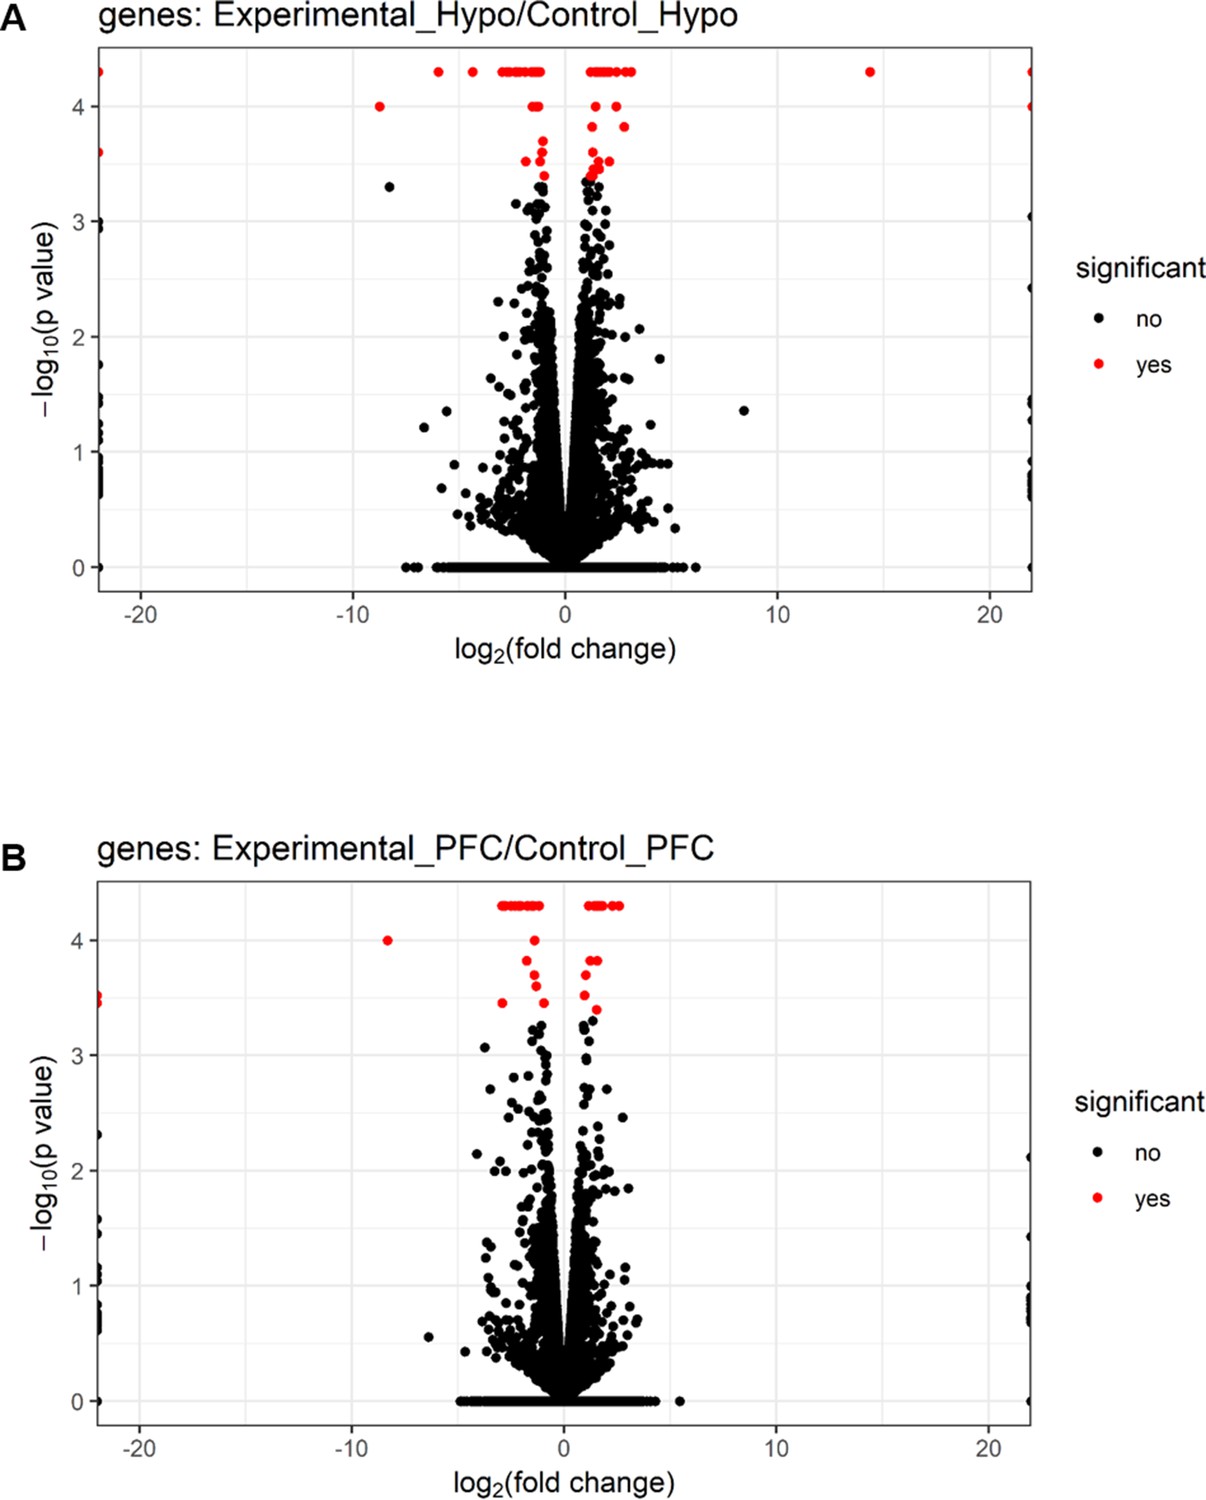
Volcano plots of differentially expressed genes in brain regions of male mice.
Volcano plots showing log2 fold change (x-axis) and −log10 p-value (y-axis) of differentially expressed genes in (A) hypothalamus-Hypo and (B) prefrontal cortex-PFC of adult PPS-induced escalated aggressive males (experimental) vs adult non-stressed males (control).
Figure 1—figure supplement 2
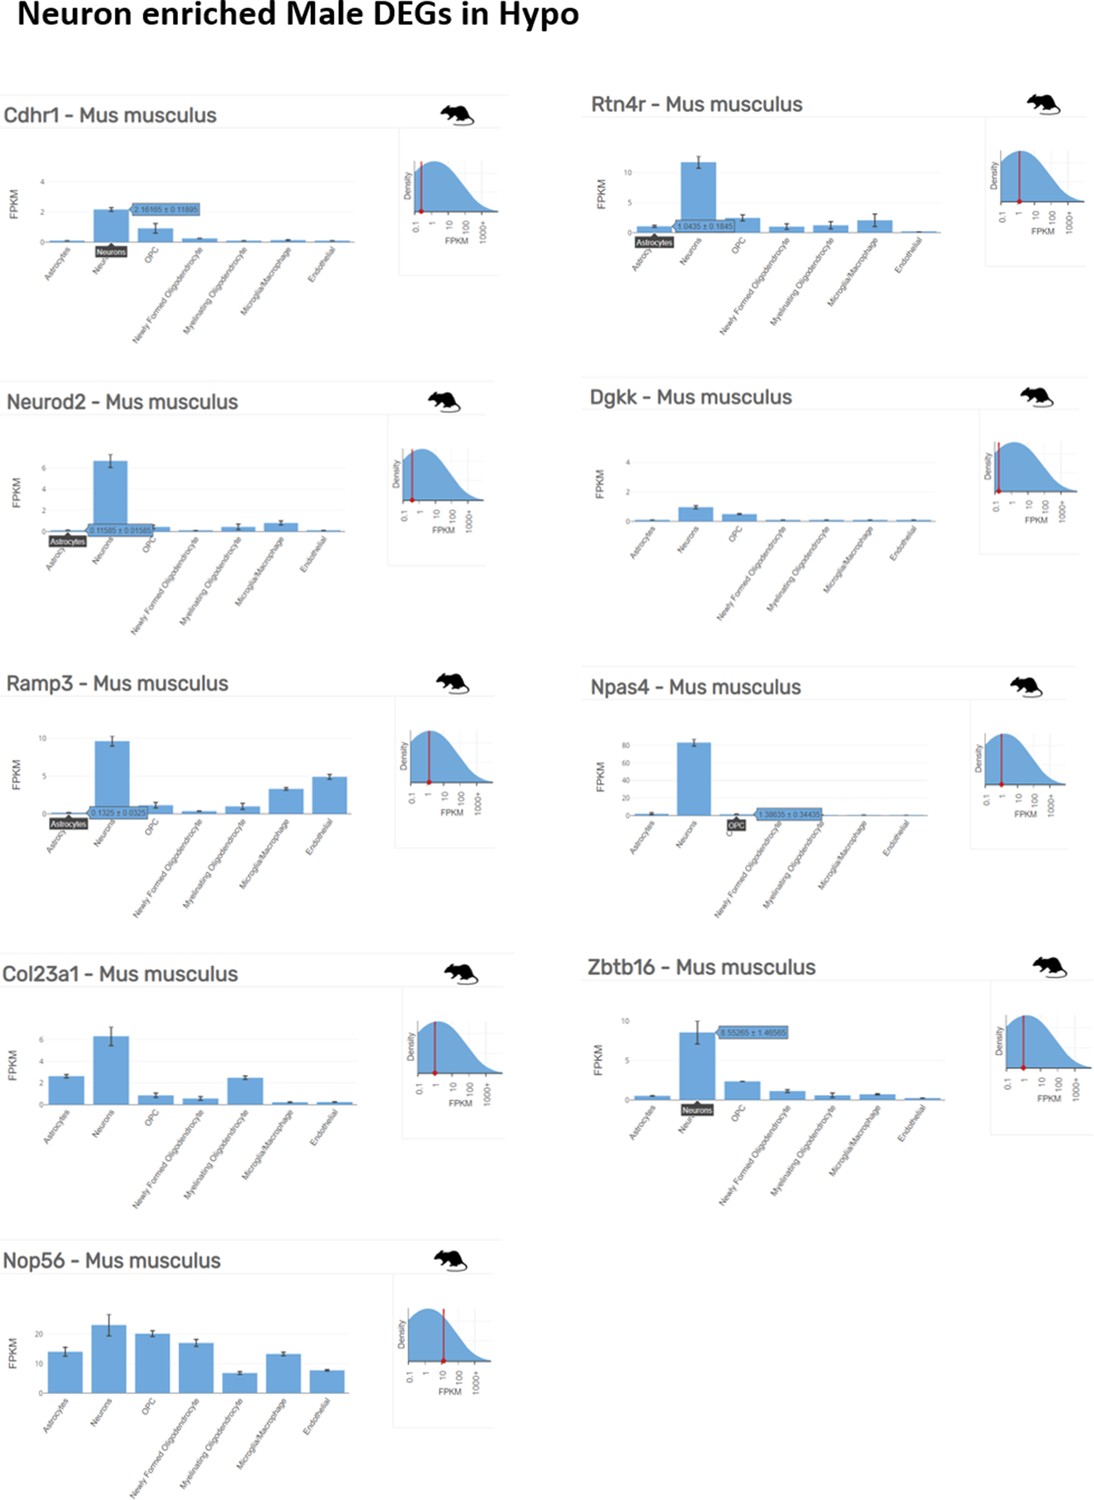
Neuron enriched top ranking differentially expressed genes (DEGs) in male hypothalamus (Hypo) determined by Barres Lab data base (https://www.brainrnaseq.org/) for cell-type-specific analysis of FPKM levels of genes in mouse brain.
Figure 1—figure supplement 3
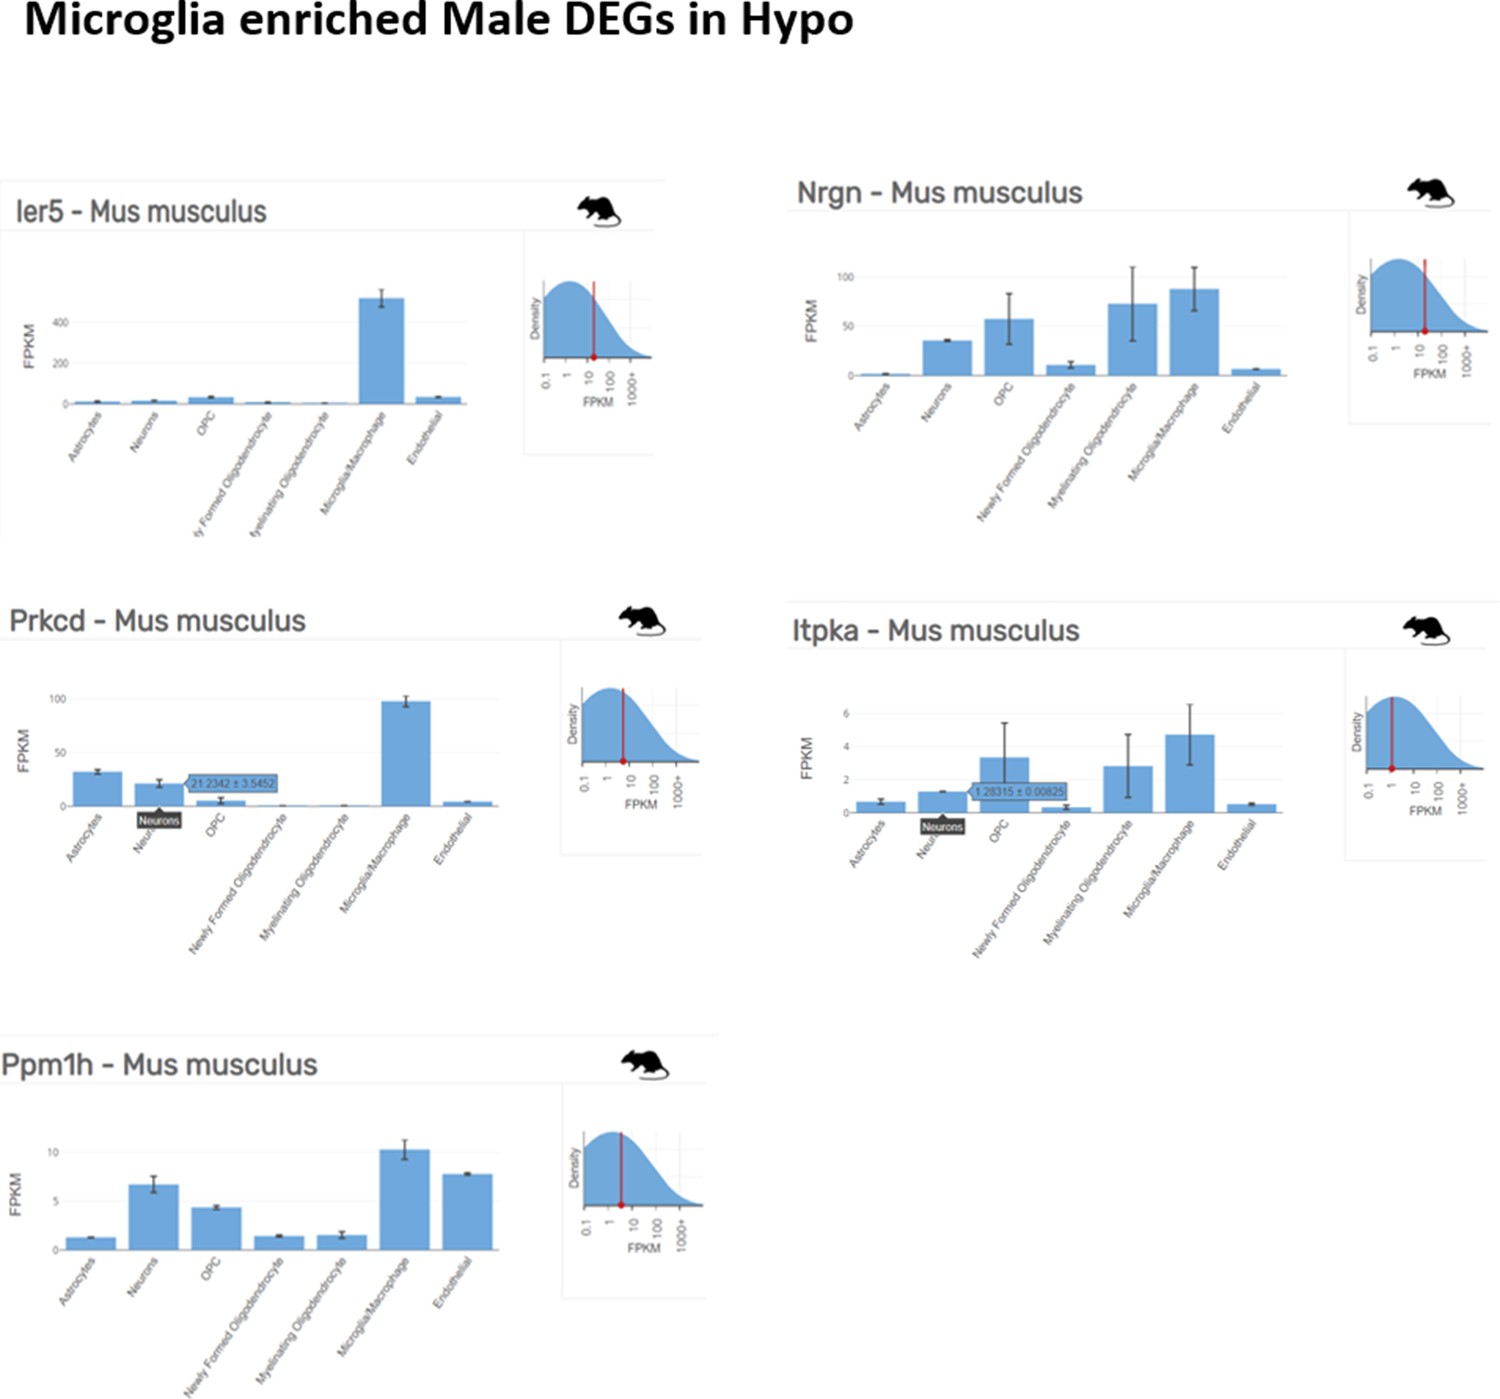
Microglia enriched top ranking differentially expressed genes (DEGs) in male hypothalamus (Hypo) determined by Barres Lab data base (https://www.brainrnaseq.org/) for cell-type-specific analysis of FPKM levels of genes in mouse brain.
Figure 1—figure supplement 4
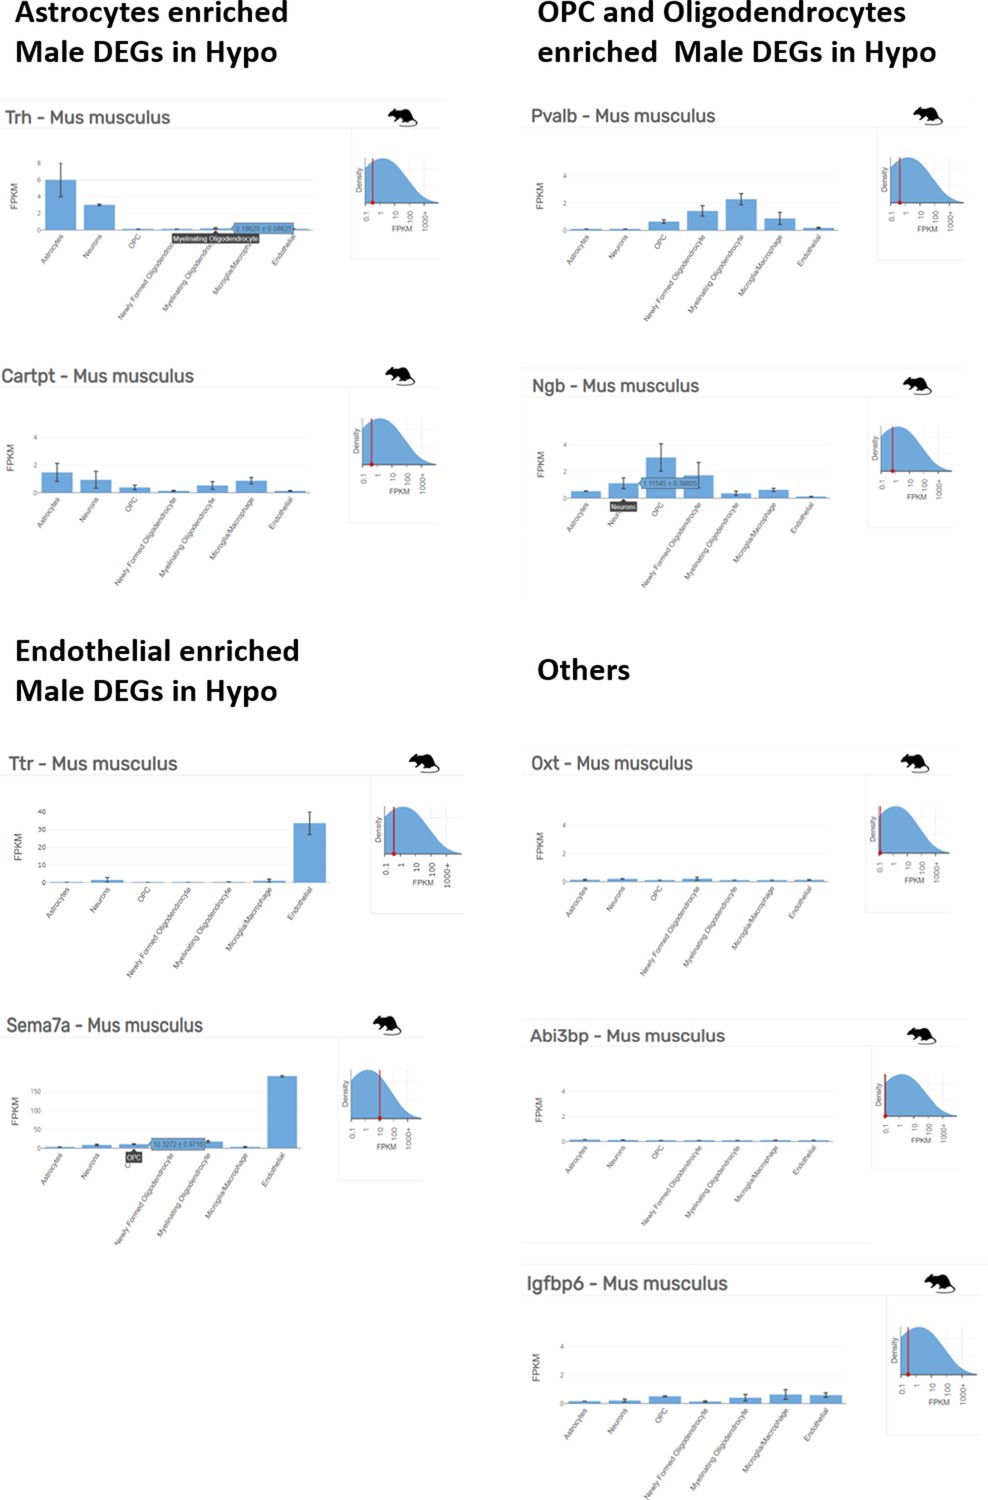
Non-neuronal cell enriched top ranking differentially expressed genes in hypothalamus of male mice.
Astrocyte, OPC, oligodendrocyte and endothelial enriched top ranking differentially expressed genes (DEGs) in male hypothalamus (Hypo) determined by Barres Lab data base (https://www.brainrnaseq.org/) for cell-type-specific analysis of FPKM levels of genes in mouse brain.
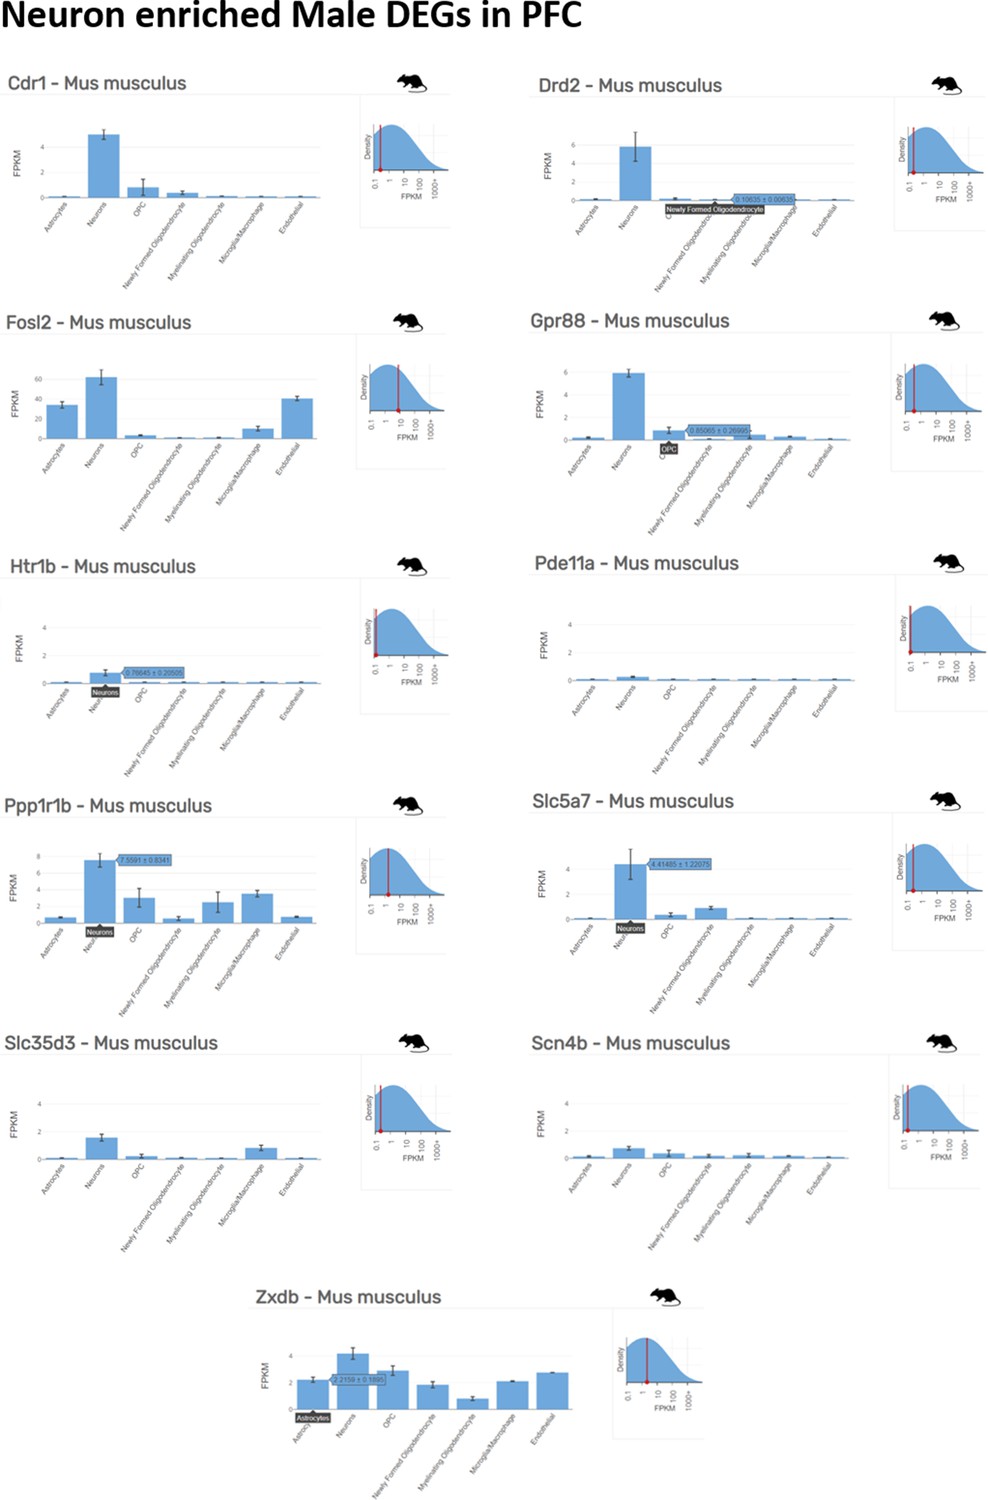
Figure 1—figure supplement 5
Neuron enriched top ranking differentially expressed genes (DEGs) in male prefrontal cortex (PFC) determined by Barres Lab data base (https://www.brainrnaseq.org/) for cell-type-specific analysis of FPKM levels of genes in mouse brain.
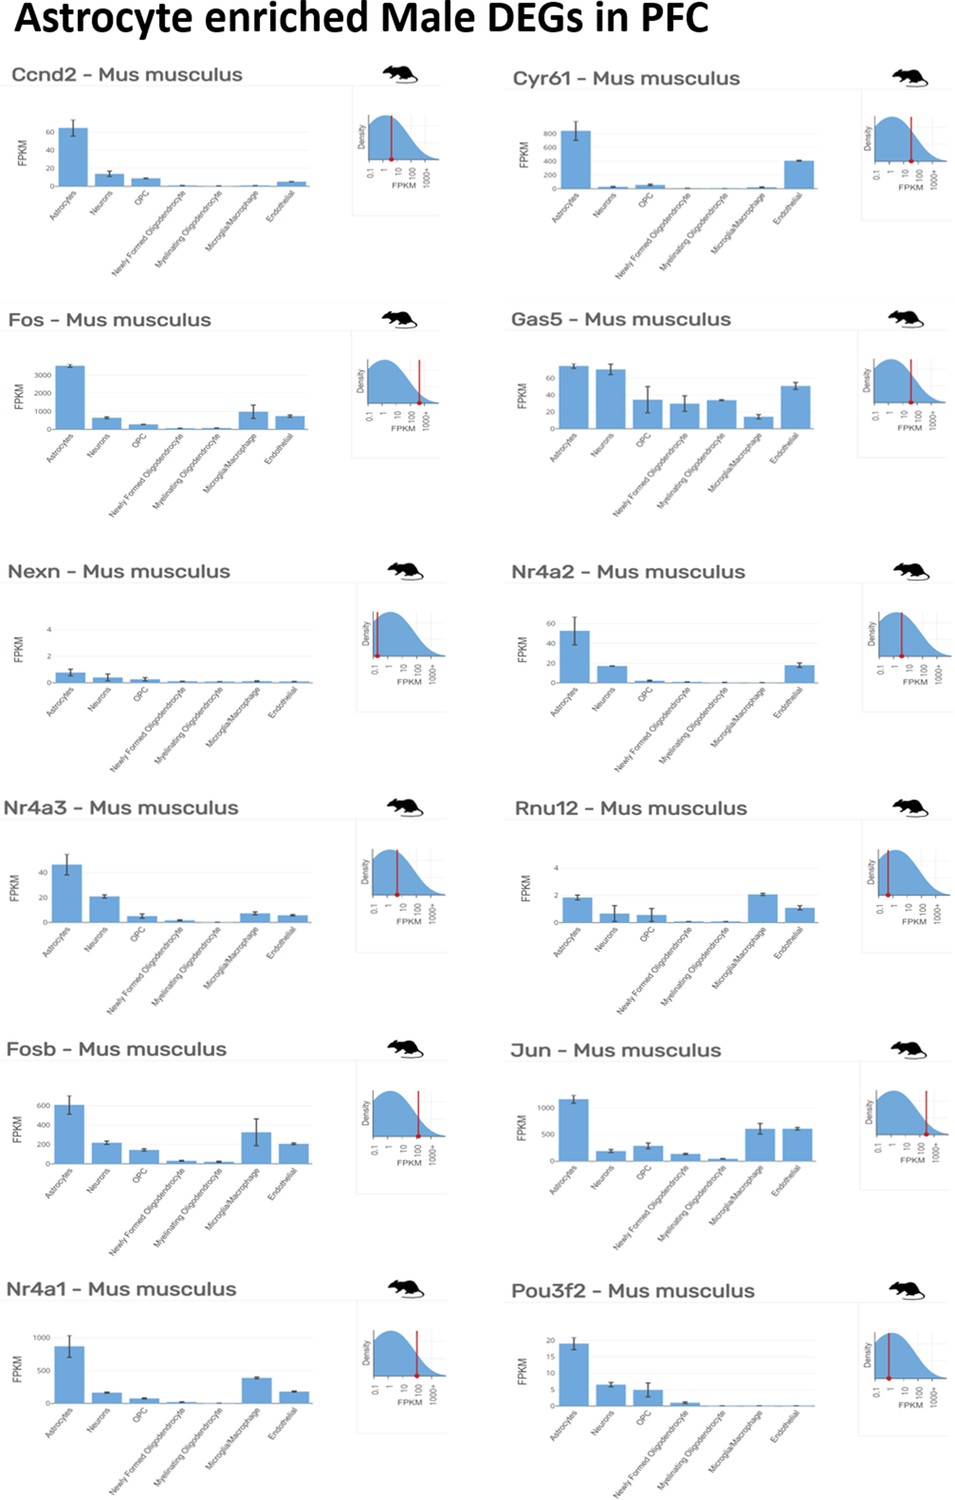
Figure 1—figure supplement 6
Astrocyte enriched top ranking differentially expressed genes (DEGs) in male prefrontal cortex (PFC) determined by Barres Lab data base (https://www.brainrnaseq.org/) for cell-type-specific analysis of FPKM levels of genes in mouse brain.
Figure 1—figure supplement 7
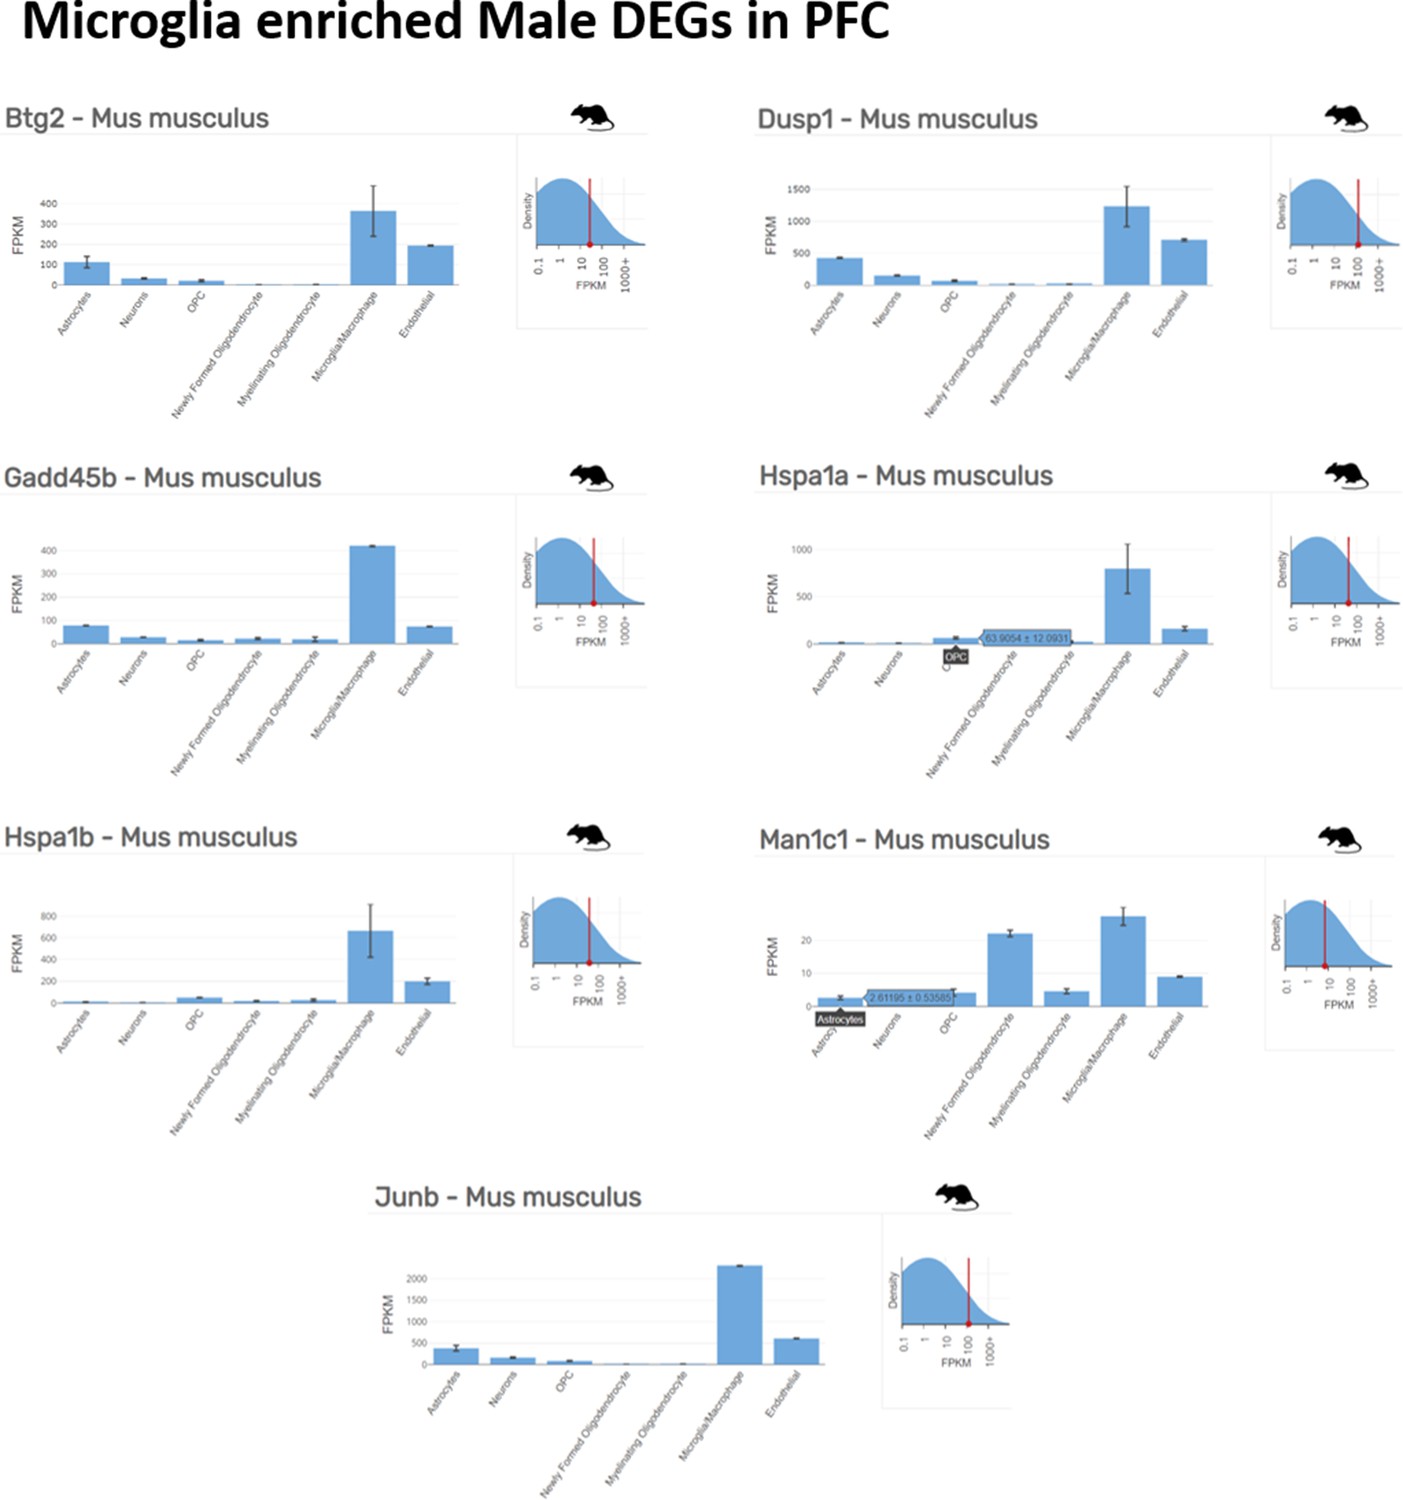
Microglia enriched top ranking differentially expressed genes (DEGs) in male prefrontal cortex (PFC) determined by Barres Lab data base (https://www.brainrnaseq.org/) for cell-type-specific analysis of FPKM levels of genes in mouse brain.
Figure 1—figure supplement 8
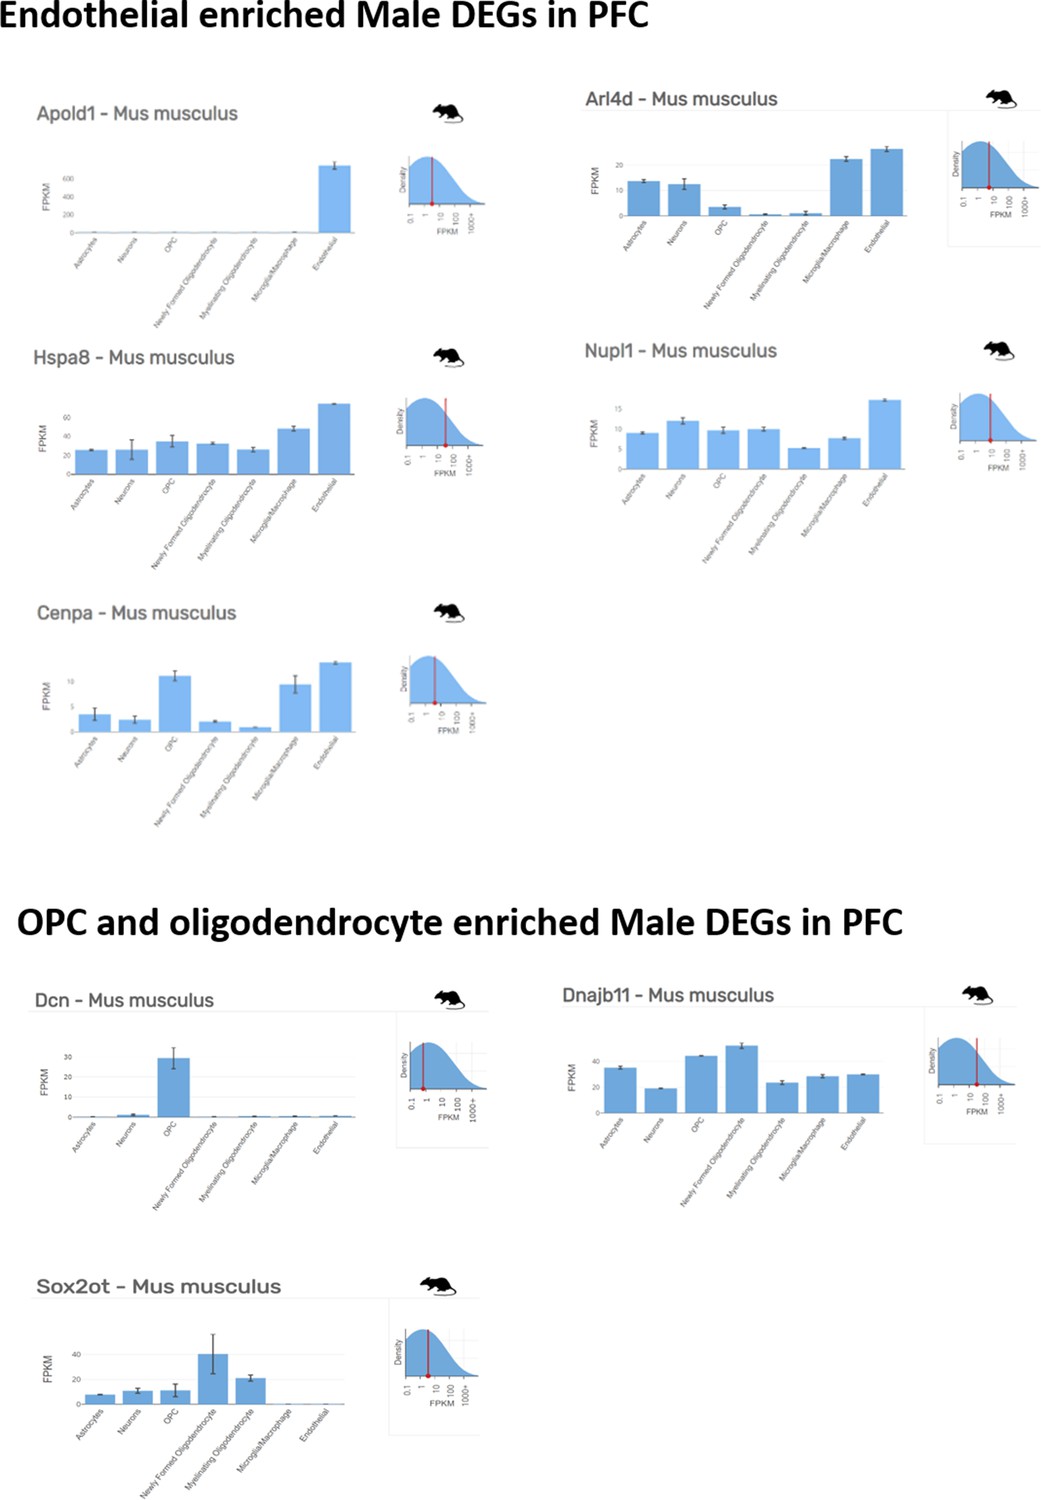
Non-neuronal cell enriched top ranking differentially expressed genes in prefrontal cortex of male mice.
Endothelial, OPC and oligodendrocyte enriched top ranking differentially expressed genes (DEGs) in male prefrontal cortex (PFC) determined by Barres Lab data base (https://www.brainrnaseq.org/) for cell-type-specific analysis of FPKM levels of genes in mouse brain.
Figure 1—figure supplement 9
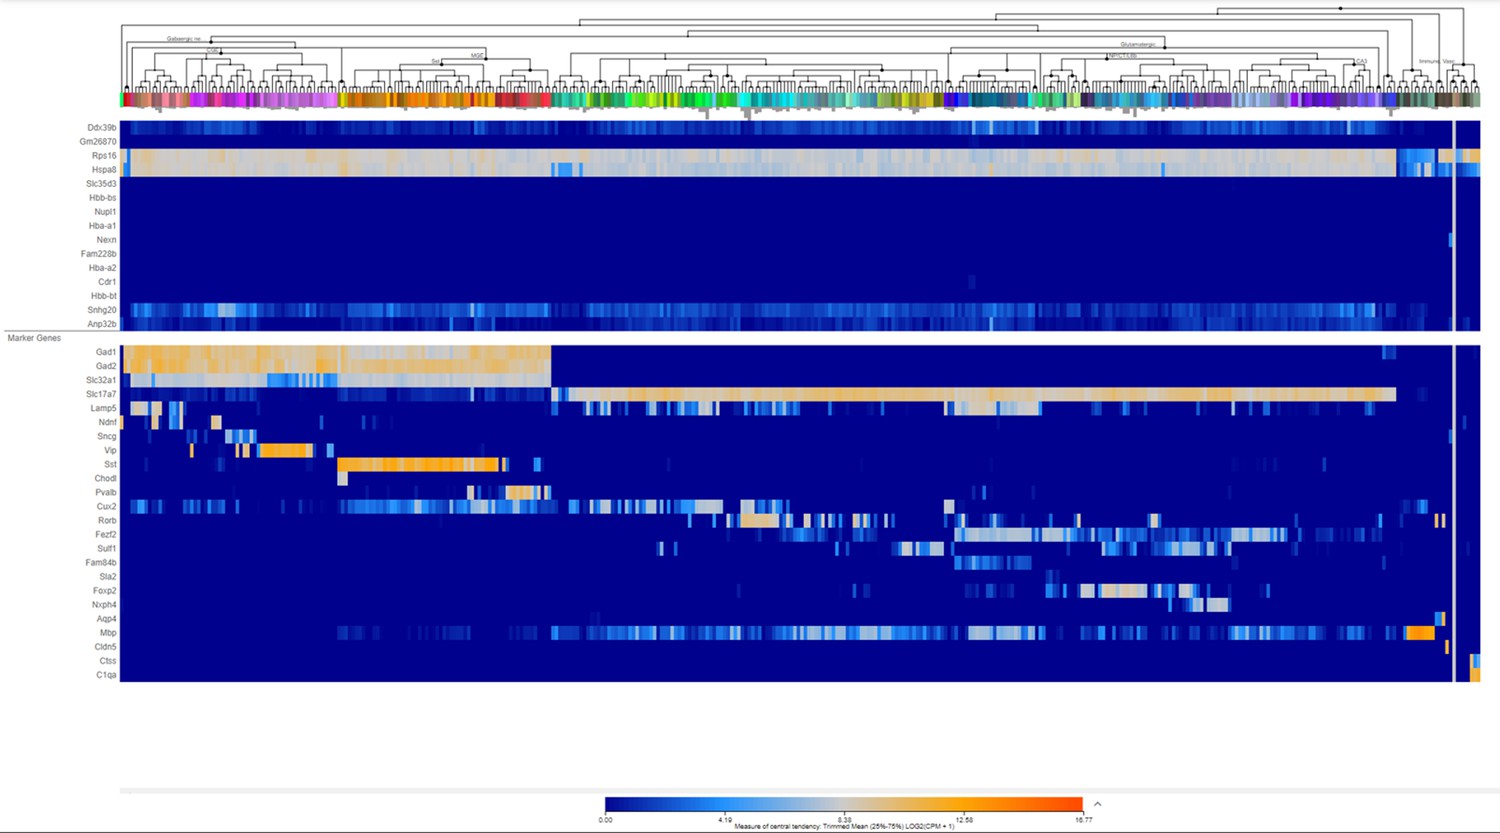
Heatmap of few top ranking differentially expressed genes (DEGs) in male prefrontal cortex (PFC) along with cell-type-specific markers using Allen Brain Transcriptomic atlas.
Figure 1—figure supplement 10
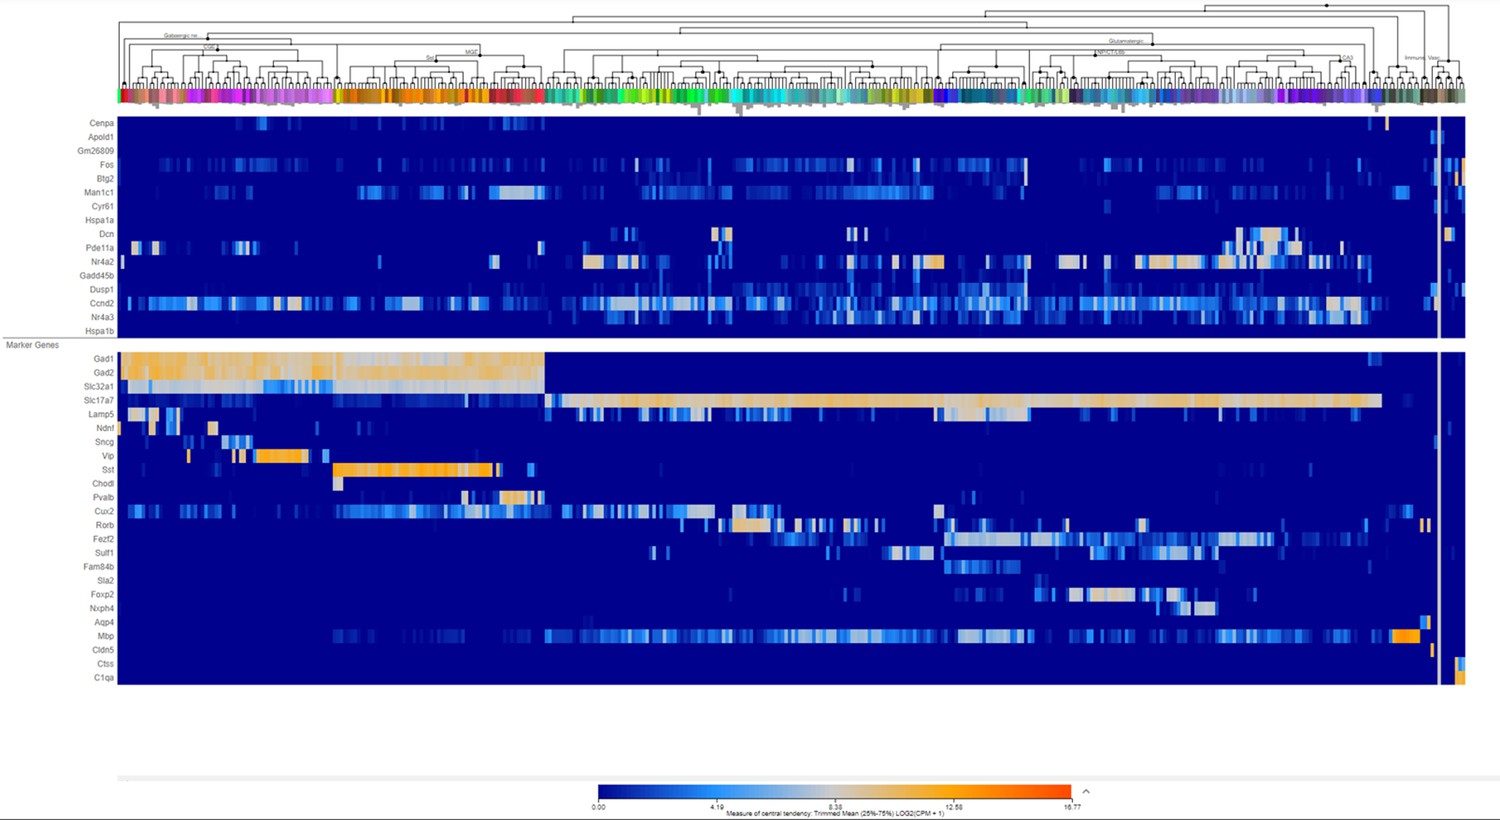
Heatmap of few top ranking differentially expressed genes (DEGs) in male prefrontal cortex (PFC) along with cell-type-specific markers using Allen Brain Transcriptomic atlas.
Figure 2 with 4 supplements

Brain-region-specific transcriptional responses in peripubertal stress induced adult resilient females.
(A) X-Y plot depicting the log 2 fold changes of differentially expressed genes (DEGs) in prefrontal cortex (PFC) in X-axis and hypothalamus (Hypo) in Y-axis and their overlap. (B) Heatmap of DEGs in Ctrl-RI (Control) vs PPS-RI Non aggressive (SNAgg) females in Hypo and PFC and (C) KEGG analysis and (D) Venn diagram of Hypo and PFC specific overlapping DEGs between SEagg males and SNAgg females. RNA sequencing analyses were performed on N=2 mice/biological replicates per group.
Figure 2—figure supplement 1
Volcano plots of differentially expressed genes in brain regions of female mice.
Volcano plots showing log2 fold change (x-axis) and −log10 p-value (y-axis) of differentially expressed genes in (A) hypothalamus-Hypo and (B) prefrontal cortex-PFC of adult PPS-induced non-aggressive females (experimental) vs adult non-stressed females (control).
Figure 2—figure supplement 2
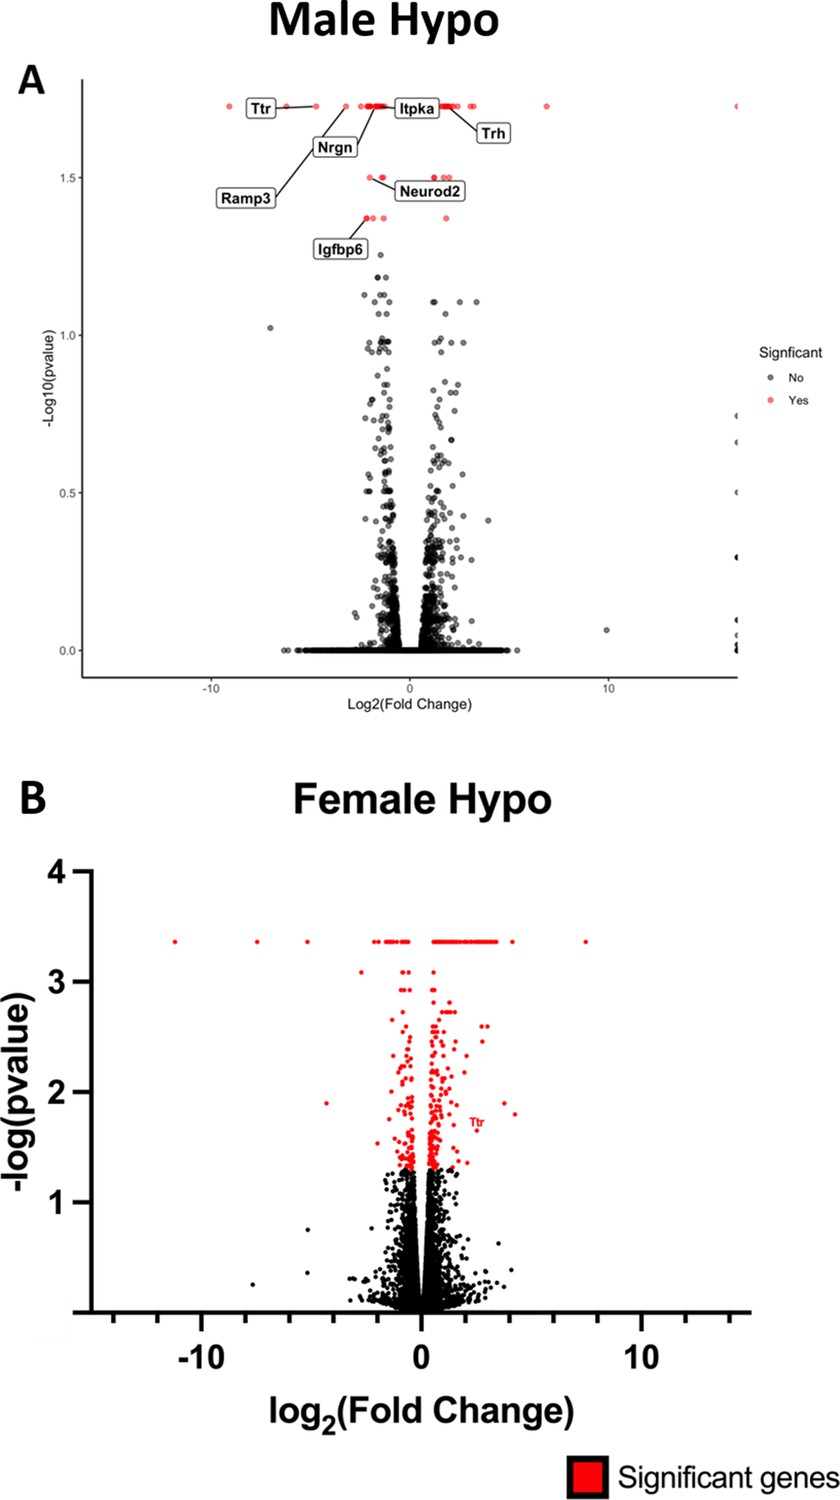
Volcano plot showing Ttr and other top ranking differentially expressed genes in hypothalamus.
(A) Volcano plot showing top ranking differentially expressed genes (Ttr, Trh, Nrgn) in hypothalamus of adult PPS-induced escalated aggressive males vs adult non-stressed control males (B) Volcano plot showing differentially expressed Ttr in opposite direction in hypothalamus of adult PPS-induced non-aggressive females vs adult non-stressed control females.
Figure 2—figure supplement 3
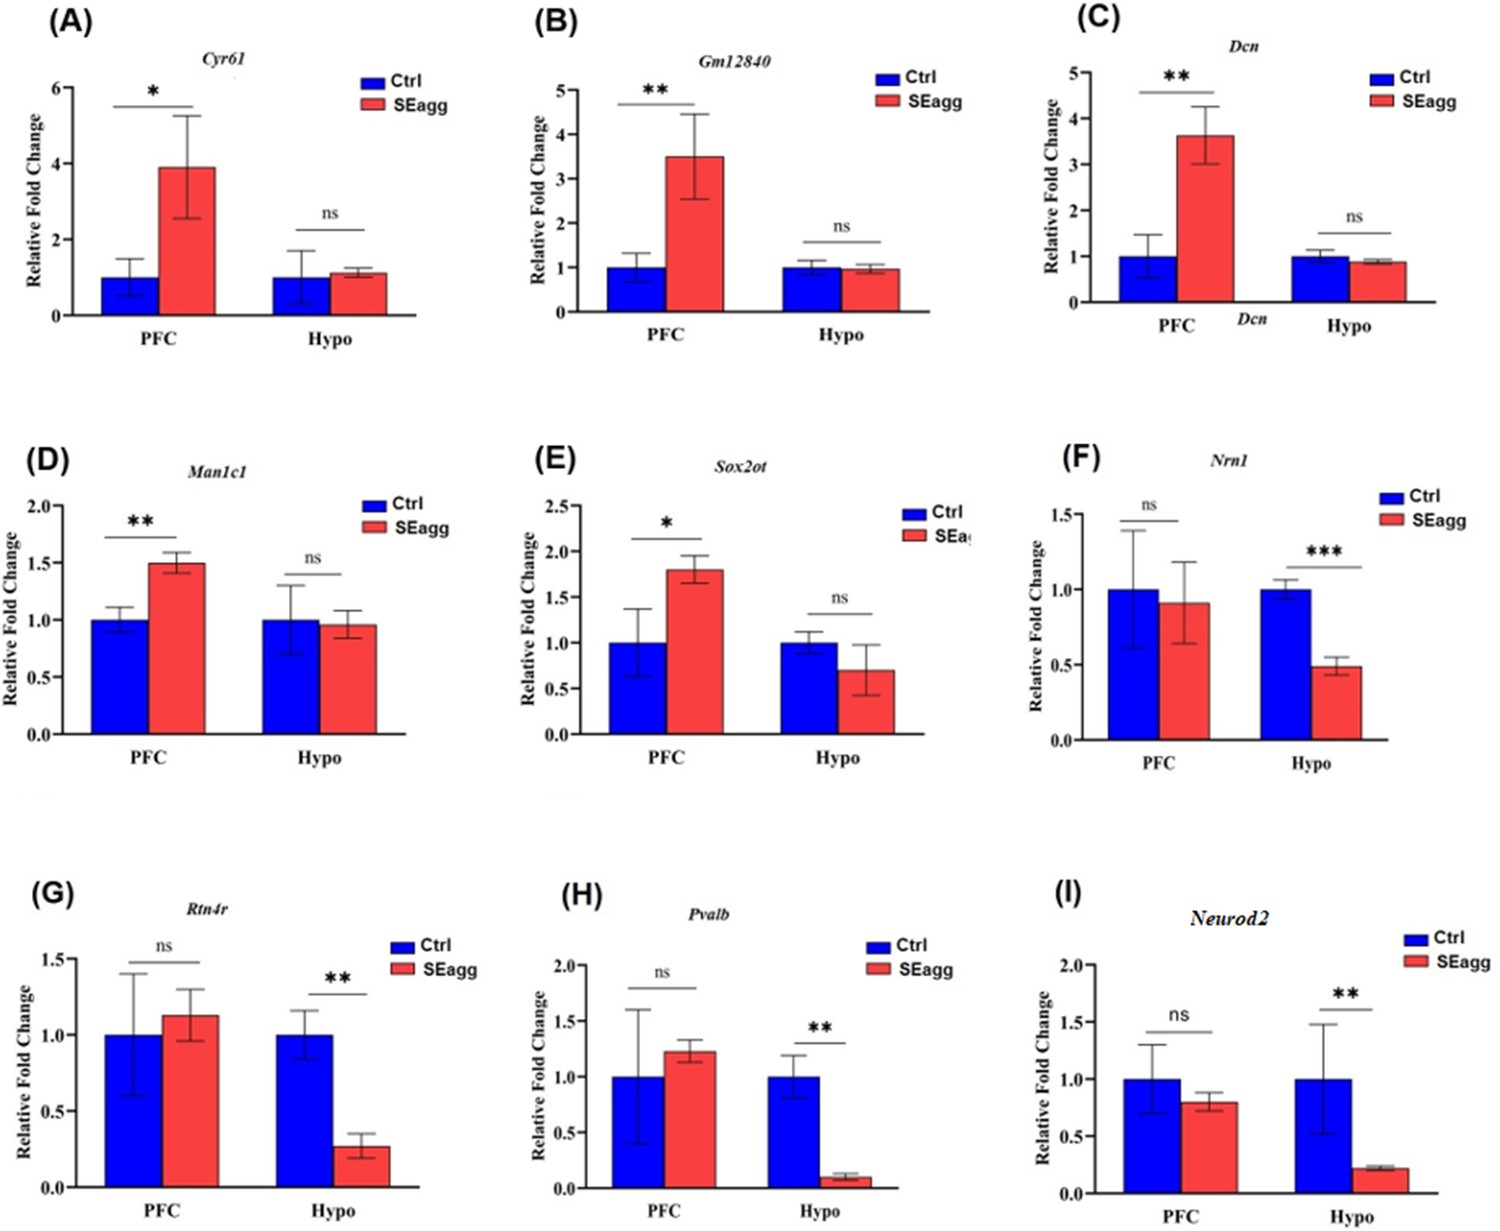
RT-PCR validation of differentially expressed genes (set1) in prefrontal cortex (PFC) and hypothalamus (Hypo) of adult PPS-induced escalated aggressive males (SEagg) vs adult non-stressed control males (Ctrl).
Figure 2—figure supplement 4
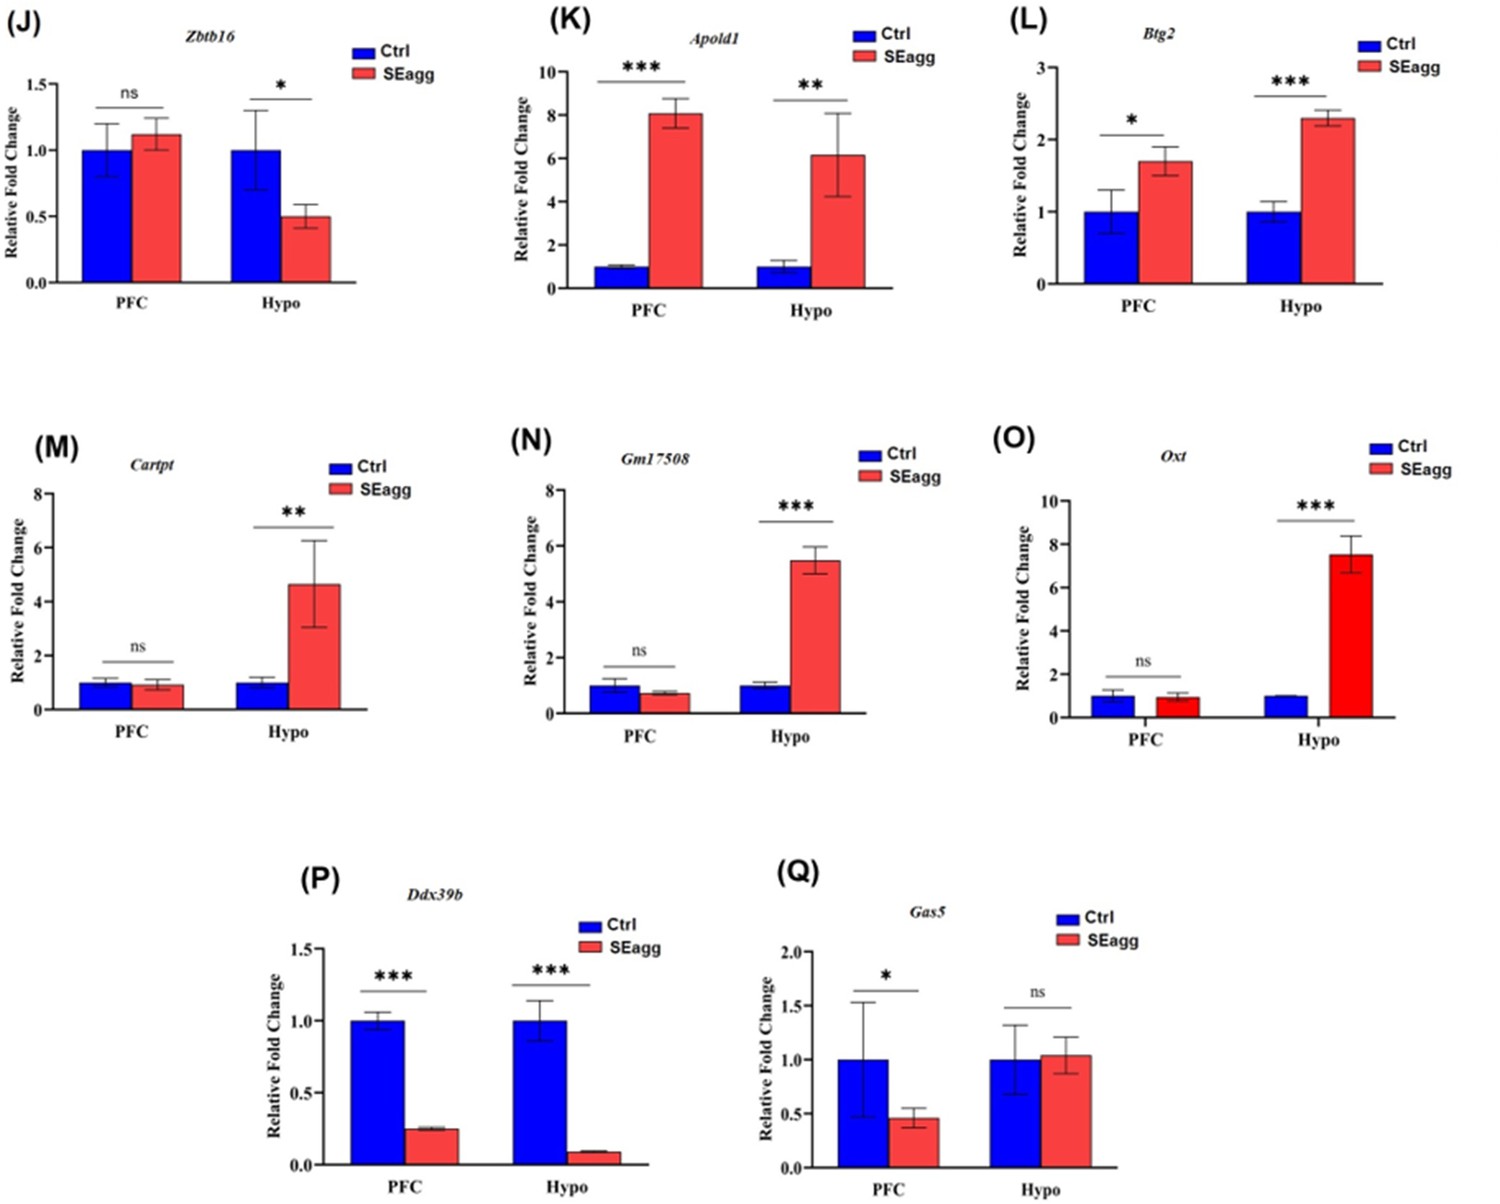
RT-PCR validation of differentially expressed genes (set2) in PFC and Hypo of adult PPS induced escalated aggressive males (SEagg) vs adult non-stressed control males (Ctrl).
Figure 3 with 1 supplement
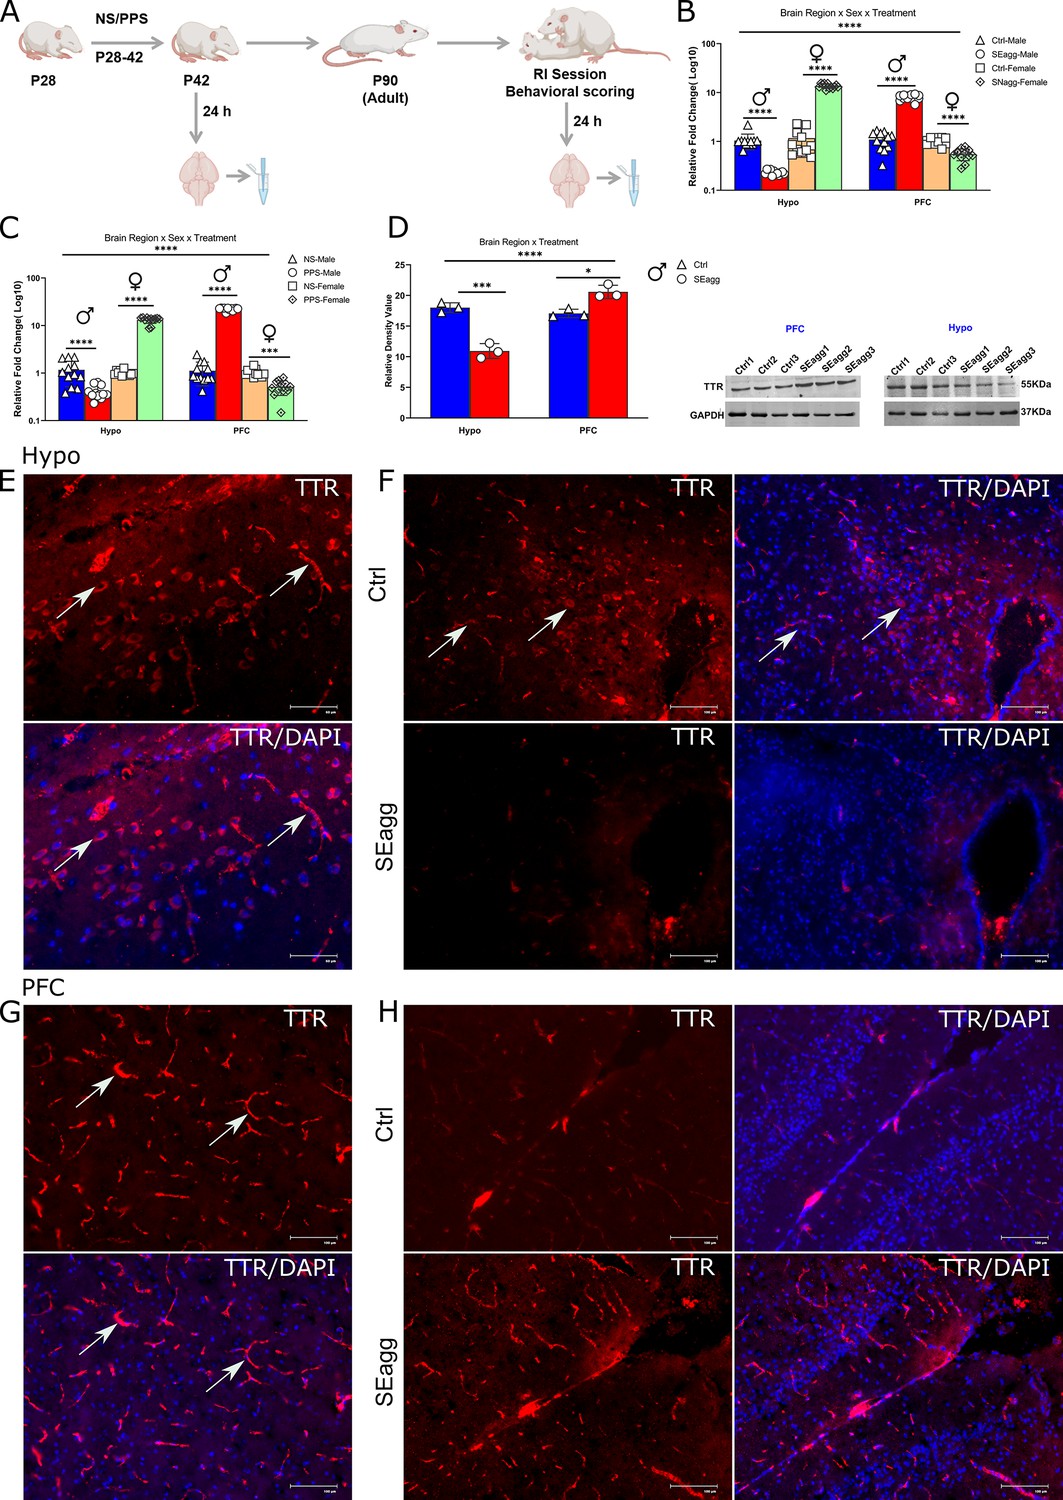
Peripubertal stress induced long term changes in TTR expression in brain-region and sex-specific diametrically opposed pattern.
(A) Experimental timeline for TTR expression analysis. Ttr mRNA expression profile in (B) Hypo and PFC of peripubertal stress exposed (PPS) adult male (SEagg) and female (SNAgg) mice with control (Ctrl), 24 hr after RI session and (C) Hypo and PFC of peripubertal male and female mice 24 hr after stress exposure (PPS) with control [no stress exposure (NS)] counterparts. (N=12 mice/biological replicates per group). Data are presented as mean (± SD) and analyzed by three-way ANOVA followed by Bonferroni’s post hoc test (**** p<0.0001). (D) Representative immunoblot of TTR protein levels with N=3 mice/biological replicates per group. Data are presented as mean (± SD) and analyzed by two-way ANOVA followed by Bonferroni’s post hoc test (**** p<0.0001, ***p=0.0001, *p<0.05). Immunofluorescence analysis (N=3 mice/ biological replicates per group) with left panels showing TTR immunoreactive cells (arrowheads) in Hypo (E) and PFC (G) and right panel showing TTR immunoreactivity in Hypo (F) and PFC (H) of Ctrl and SEagg mice.
-
Figure 3—source data 1
Uncropped immunoblot of TTR and GAPDH.
- https://cdn.elifesciences.org/articles/77968/elife-77968-fig3-data1-v2.zip
Figure 3—figure supplement 1
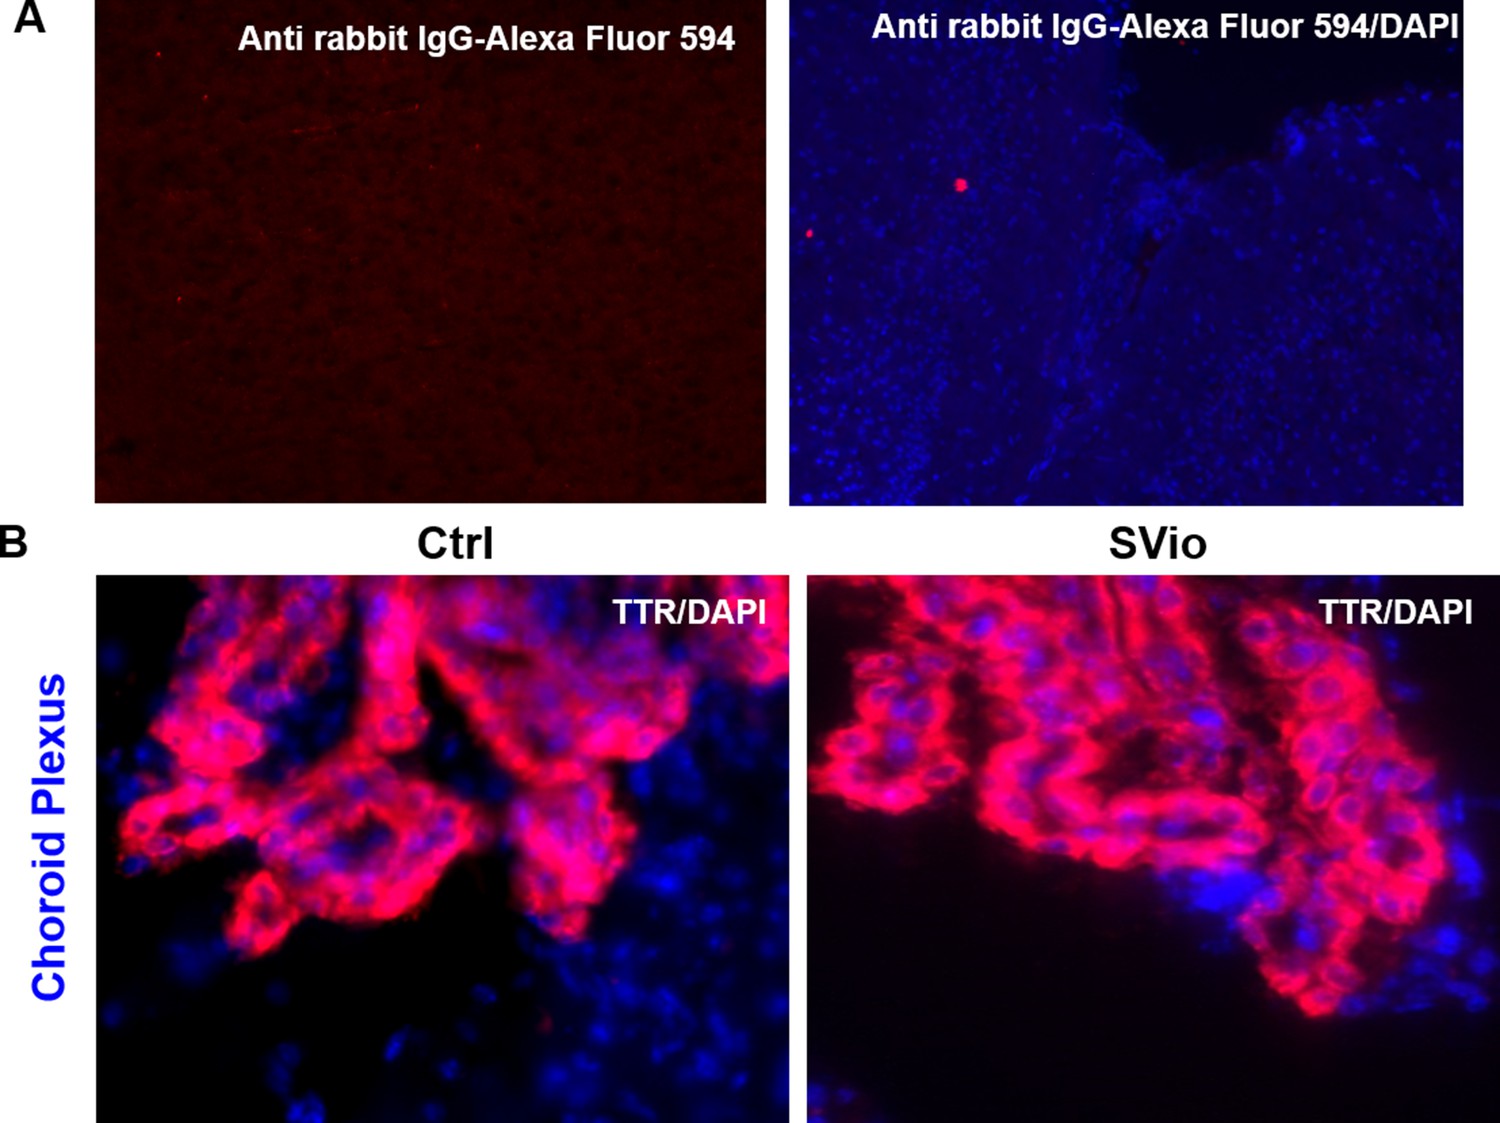
TTR immunofluorescence in mouse brain.
(A) No primary TTR antibody negative control immunofluorescence images showing two different mouse brain sections stained with Alexa Fluor 594 goat anti-rabbit secondary antibody alone(left) and counterstained with DAPI (right) (B) TTR protein expression in choroid plexus of adult non-stressed control (Ctrl) and adult PPS-induced escalated aggressive (SEagg) males.
Figure 4 with 1 supplement

Peripubertal stress-induced long-term perturbation of thyroid hormone availability in the brain of escalated aggressive males with concomitant changes in target gene expression.
(A) Experimental timeline. T4 (B) and T3 (C) level in serum of peripubertal stress exposed (SEagg) and control (Ctrl) adult males 24 hr after RI session. T4 (D) and T3 (E) level in serum of peripubertal males 24 hr after stress exposure (PPS) with control [no stress exposure (NS)] counterparts. Data are presented as mean (± SD) and analyzed by unpaired Student’s t-test ns (p> 0.05). T4 (F) and T3 (G) level in Hypo and PFC of peripubertal stress exposed (SEagg) and control (Ctrl) adult males 24 hr after RI session. T4 (H) and T3 (I) level in Hypo and PFC of peripubertal males 24 hr after stress exposure (PPS) with control [no stress exposure (NS)] counterparts. All the above ELISA assays ‘B-I’ were performed in N=5 mice/biological replicates per group. Trh mRNA (J) and Nrgn mRNA (K) expression profile in Hypo and PFC of Ctrl and SEagg males (N=9 mice/biological replicates per group). NRGN protein expression (L) profile in Hypo and PFC of Ctrl and SEagg males and representative immunoblot with N=3 mice/biological replicates per group. Data are presented as mean (± SD) and analyzed by two-way ANOVA followed by Bonferroni’s post hoc test (**** p<0.0001, **p<0.01 and ns p>0.05).
-
Figure 4—source data 1
Data points for T4 and T3 ELISA.
- https://cdn.elifesciences.org/articles/77968/elife-77968-fig4-data1-v2.xlsx
-
Figure 4—source data 2
Uncropped immunoblot of NRGN and GAPDH protein.
- https://cdn.elifesciences.org/articles/77968/elife-77968-fig4-data2-v2.zip
Figure 4—figure supplement 1
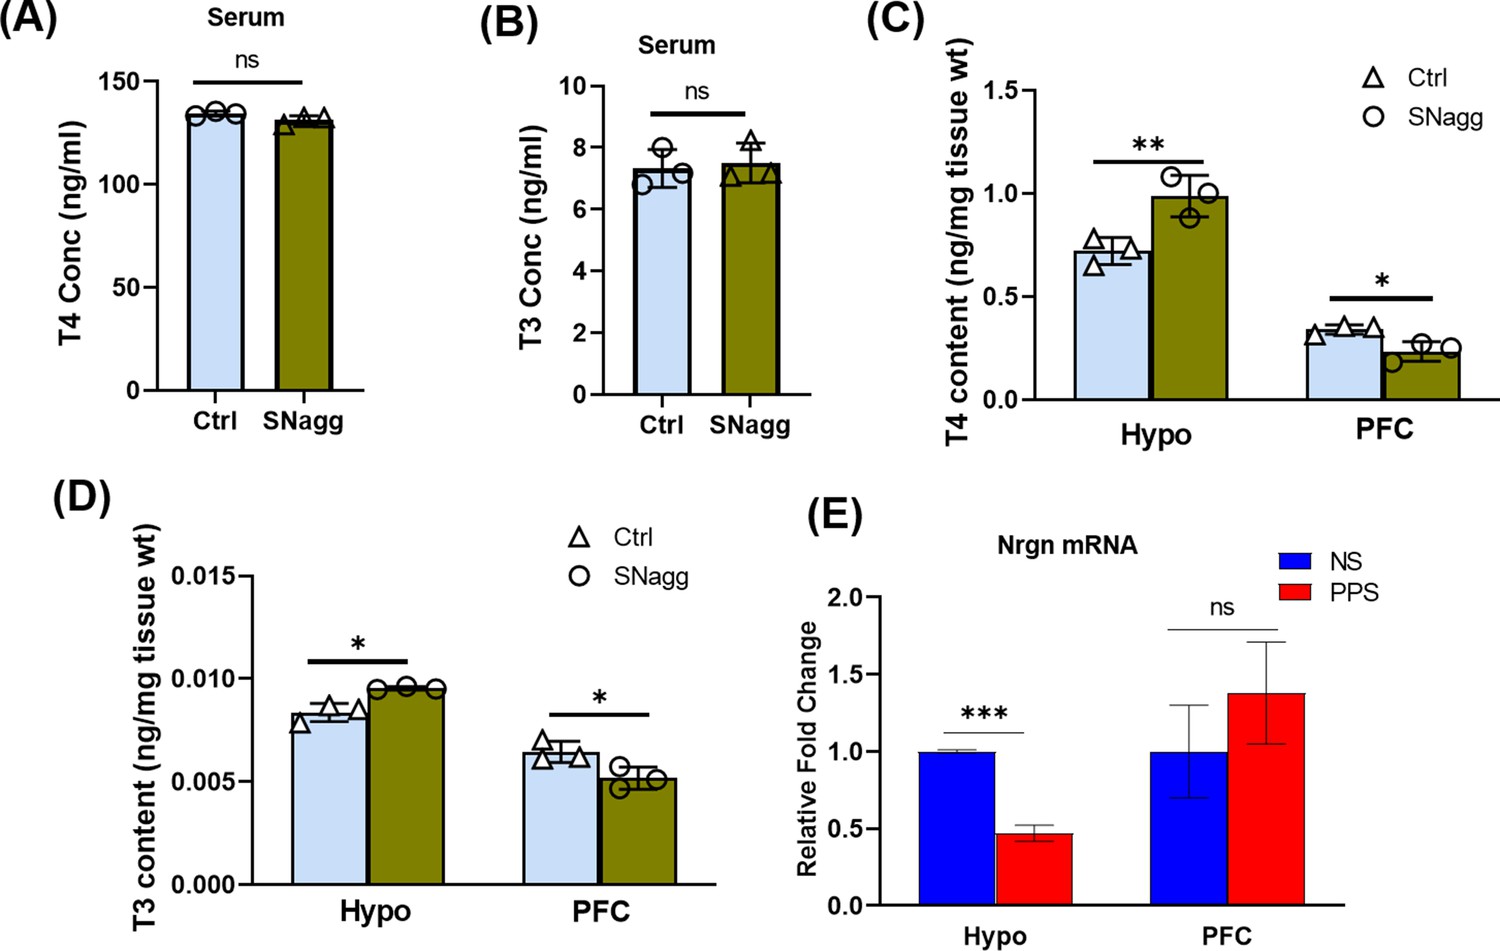
Thyroid hormone and Nrgn mRNA levels in the serum and brain of peripubertal stress exposed mice.
(A) T4 and (B) T3 levels in serum and in brain regions, PFC and Hypo (C,D) of adult control (Ctrl) and adult PPS-induced non-aggressive (SNagg) females. (E) Nrgn mRNA expression in NS and PPS males.
Figure 5 with 1 supplement

Ttr knockdown in hypothalamus resulting in escalated aggression and reduced thyroid hormone levels.
(A) Experimental strategy of stereotaxic surgeries followed by behavioral and molecular experiments (B) Comparative analysis of behavioural profile during RI session between hypothalamus injected Ttr esiRNA (N=16 mice/biological replicates per group) and scrambled siRNA (Scr) males (N=15 mice/biological replicates per group).
(C) T3 content in hypothalamus (Hypo) of Ttr esiRNA (N=7 mice per group) and Scr males (N=6 mice/biological replicates per group). (D) Ttr mRNA, Nrgn mRNA, Hr mRNA and Trh mRNA expression analysis in Hypo of Ttr esiRNA and Scr males (N=9 mice/ biological replicates per group). Data are presented as mean (± SD) and analysed by unpaired Student’s t-test [*** (p< 0.001)] between Scr vs Ttr esiRNA group.
-
Figure 5—source data 1
Data points for RI behavioral scoring.
- https://cdn.elifesciences.org/articles/77968/elife-77968-fig5-data1-v2.xlsx
-
Figure 5—source data 2
Data points for T3 ELISA.
- https://cdn.elifesciences.org/articles/77968/elife-77968-fig5-data2-v2.xlsx
Figure 5—figure supplement 1
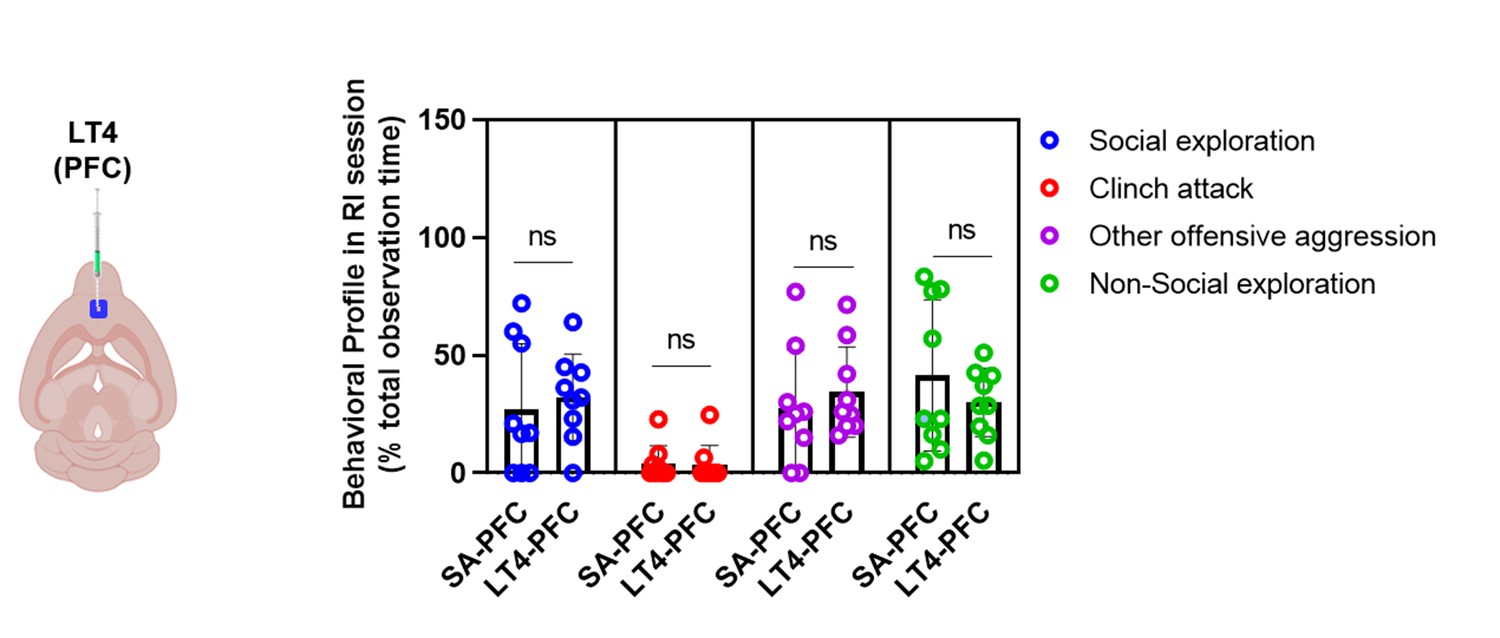
Comparative analysis of behavioral profile during RI session between saline injected group in PFC (SA-PFC; N=9) and levothyroxine, LT4 injected in PFC (LT4-PFC;N=9).
Histogram represents mean of the data (± SD) Statistical analysis were performed using unpaired Student’s t-test [ns (p> 0.05)] between SA-PFC vs LT4-PFC group.
Figure 6
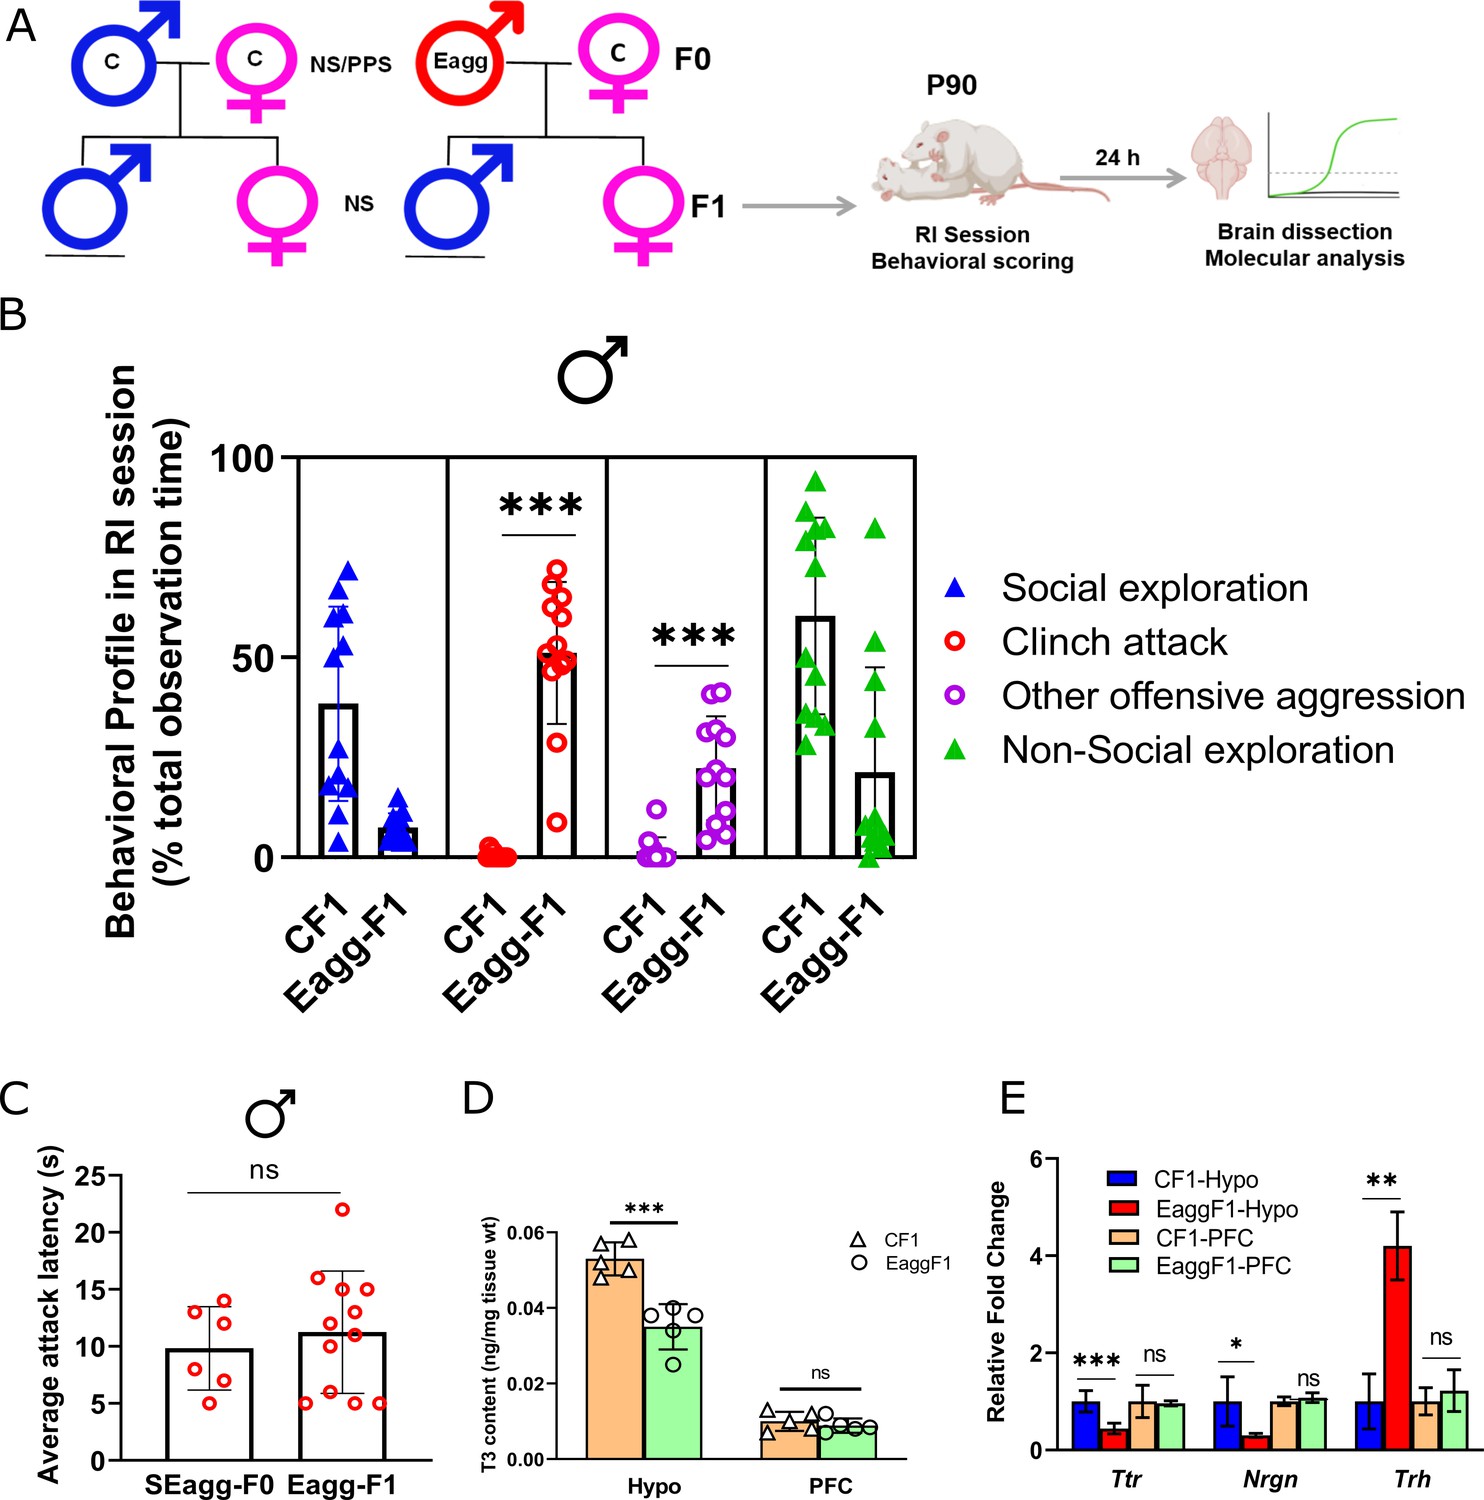
F1 male progenies showed escalated aggression with concomitant changes in Ttr gene expression and thyroid hormone signaling.
(A) Breeding pairs and experimental timeline. (B) Comparative analysis of behavioral profile during RI session between F1 males originating from control males crossed with control females (CF1) and F1 males originating from peripubertal stress exposed SEagg-F0 males crossed with control females (Eagg-F1) males (N=12 mice/biological replicates per group). (C) Attack latency comparison between parent SEagg-F0 (N=6 mice) and Eagg-F1 males (N=12 mice). (D) T3 content in Hypo and PFC of CF1 and Eagg-F1 males (N=5 mice/biological replicates per group). (E) Ttr, Nrgn and Trh mRNA expression analysis in Hypo and PFC of CF1 and Eagg-F1 males (N=6 mice/biological replicates per group). Data are presented as mean (± SD) and analyzed by unpaired Student’s t-test {ns (p> 0.05),* (p< 0.05), ** (p< 0.01), and *** (P<0.001)} between CF1 and Eagg-F1 groups or SEagg-F0 vs EaggF1.
-
Figure 6—source data 1
Data points for RI behavioral scoring and attack latency.
- https://cdn.elifesciences.org/articles/77968/elife-77968-fig6-data1-v2.xlsx
-
Figure 6—source data 2
Data points for T3 ELISA.
- https://cdn.elifesciences.org/articles/77968/elife-77968-fig6-data2-v2.xlsx
Figure 7
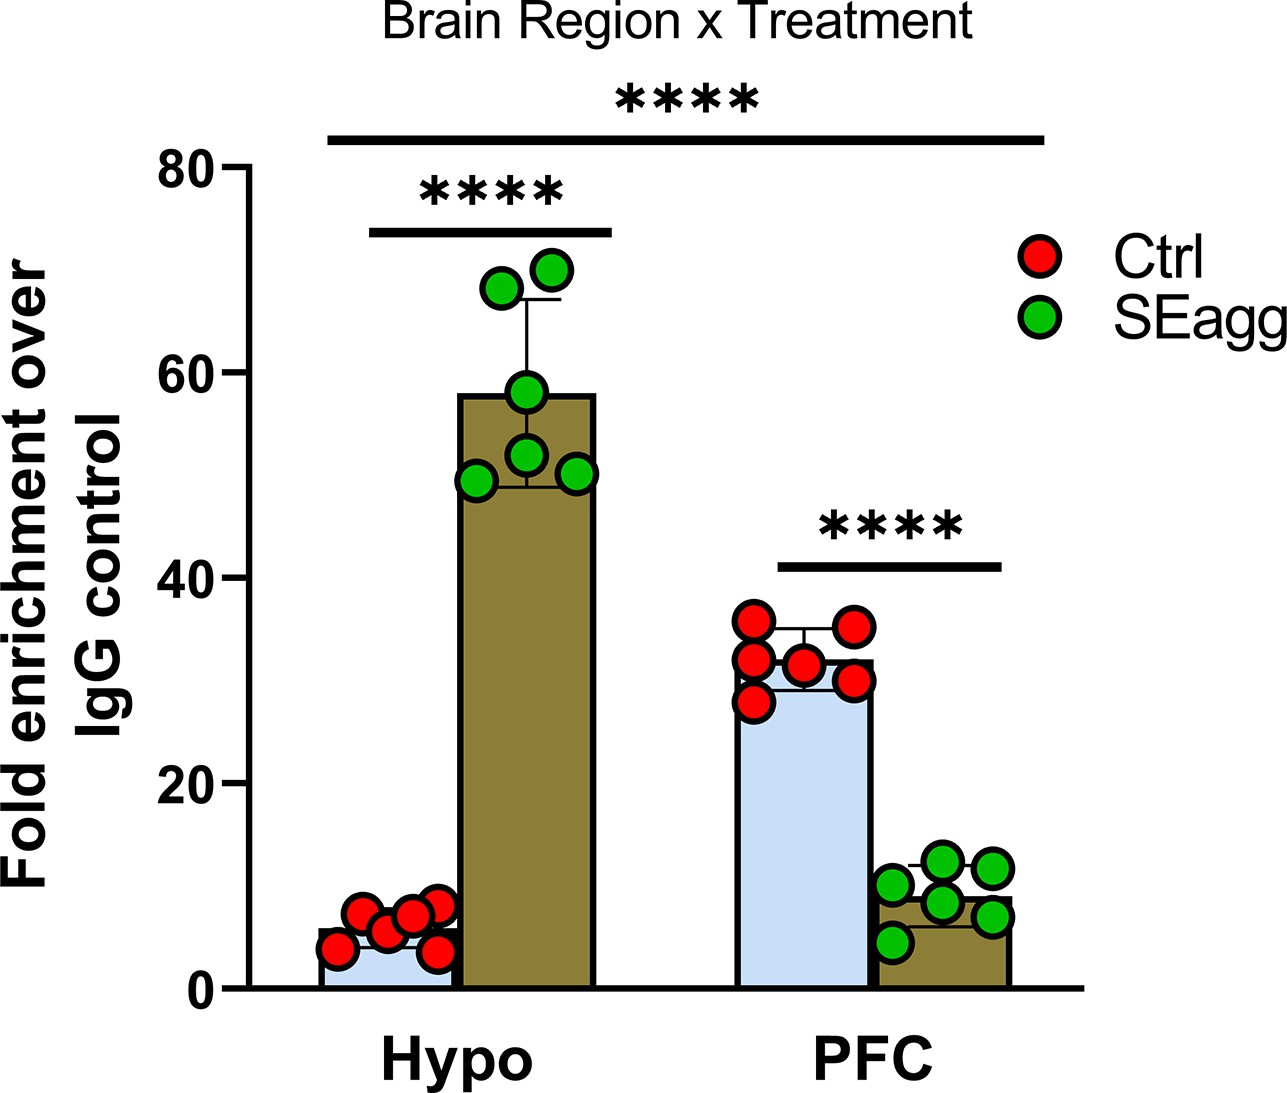
Ttr promoter methylation changes in PPS-induced escalated aggressive males.
Methylated DNA immunoprecipitation analysis showing 5-methylcytosine fold enrichment in Ttr promoter in Hypo and PFC of Control male mice (Ctrl) and PPS-induced male mice showing escalated aggression (SEagg) (N=6 mice/biological replicates per group). Data are presented as mean (± SD). Two way ANOVA revealed significant interaction between brain region and treatment (****p<0.0001). Bonferroni’s multiple comparisons test showed significant difference between Ctrl and SEagg group in both Hypo and PFC region (****p<0.0001).
-
Figure 7—source data 1
Data points for Ttr promoter 5-methylcytosine fold enrichment.
- https://cdn.elifesciences.org/articles/77968/elife-77968-fig7-data1-v2.xlsx
Videos
Video 1
Video showing resident intruder behavioural session in which resident mouse (legs marked) is scrambled siRNA injected in hypothalamus and intruder is a control mouse of lesser body weight.
Scrambled injected mouse did not show any sign of offensive aggression and clinch attack.
Video 2
Video showing resident intruder behavioural session in which resident mouse (body marked) is Ttr siRNA injected in hypothalamus and intruder is a control mouse of lesser body weight.
Ttr siRNA injected mouse showed escalated aggression spending maximum time in clinch attack and biting during the entire behavioural session.
Tables
Table 1
ANOVA analysis of the results shown in Figure 3B.
| A. Three-way ANOVA analysis of the results shown in Figure 3B. | |||||
|---|---|---|---|---|---|
| ANOVA table | SS | DF | MS | F (DFn, DFd) | p value |
| Brain Region | 401 | 1 | 401 | F (1, 88)=1913 | p<0.0001 |
| Sex | 134.2 | 1 | 134.2 | F (1, 88)=640.3 | p<0.0001 |
| Treatment | 20.65 | 1 | 20.65 | F (1, 88)=98.53 | p<0.0001 |
| Brain Region x Sex | 5.531 | 1 | 5.531 | F (1, 88)=26.39 | p<0.0001 |
| Brain Region x Treatment | 0.2857 | 1 | 0.2857 | F (1, 88)=1.363 | p=0.2462 |
| Sex x Treatment | 5.853 | 1 | 5.853 | F (1, 88)=27.93 | p<0.0001 |
| Brain Region x Sex x Treatment | 143.6 | 1 | 143.6 | F (1, 88)=685.0 | p<0.0001 |
| Residual | 18.44 | 88 | 0.2096 | ||
| B. Two-way ANOVA analysis of the results shown in Figure 3B in males. | |||||
| ANOVA table | SS | DF | MS | F (DFn, DFd) | p value |
| Interaction | 78.33 | 1 | 78.33 | F (1, 44)=447.3 | p<0.0001 |
| Brain Region | 156.2 | 1 | 156.2 | F (1, 44)=891.7 | p<0.0001 |
| Treatment | 2.258 | 1 | 2.258 | F (1, 44)=12.89 | p=0.0008 |
| Residual | 7.706 | 44 | 0.1751 | ||
| C. Two-way ANOVA analysis of the results shown in Figure 3B in females. | |||||
| ANOVA table | SS | DF | MS | F (DFn, DFd) | p value |
| Interaction | 65.52 | 1 | 65.52 | F (1, 44)=268.5 | p<0.0001 |
| Brain Region | 250.3 | 1 | 250.3 | F (1, 44)=1,026 | p<0.0001 |
| Treatment | 24.24 | 1 | 24.24 | F (1, 44)=99.36 | p<0.0001 |
| Residual | 10.74 | 44 | 0.244 | ||
Table 2
ANOVA analysis of the results shown in Figure 3C.
| A. Three-way ANOVA analysis of the results shown in Figure 3C. | |||||
|---|---|---|---|---|---|
| ANOVA table | SS | DF | MS | F (DFn, DFd) | p value |
| Brain Region | 305.7 | 1 | 305.7 | F (1, 88)=1,215 | p<0.0001 |
| Sex | 143.5 | 1 | 143.5 | F (1, 88)=570.1 | p<0.0001 |
| Treatment | 49.35 | 1 | 49.35 | F (1, 88)=196.1 | p<0.0001 |
| Brain Region x Sex | 34.57 | 1 | 34.57 | F (1, 88)=137.4 | p<0.0001 |
| Brain Region x Treatment | 1.736 | 1 | 1.736 | F (1, 88)=6.898 | p=0.0102 |
| Sex x Treatment | 0.3444 | 1 | 0.3444 | F (1, 88)=1.368 | p=0.2452 |
| Brain Region x Sex x Treatment | 168.5 | 1 | 168.5 | F (1, 88)=669.5 | p<0.0001 |
| Residual | 22.15 | 88 | 0.2517 | ||
| B. Two-way ANOVA analysis of the results shown in Figure 3C in males. | |||||
| ANOVA table | SS | DF | MS | F (DFn, DFd) | p value |
| Interaction | 102.2 | 1 | 102.2 | F (1, 44)=280.4 | p<0.0001 |
| Brain Region | 67.33 | 1 | 67.33 | F (1, 44)=184.6 | p<0.0001 |
| Treatment | 28.97 | 1 | 28.97 | F (1, 44)=79.45 | p<0.0001 |
| Residual | 16.04 | 44 | 0.3646 | ||
| C. Two-way ANOVA analysis of the results shown in Figure 3C in females. | |||||
| ANOVA table | SS | DF | MS | F (DFn, DFd) | p value |
| Interaction | 68.02 | 1 | 68.02 | F (1, 44)=490.3 | p<0.0001 |
| Brain Region | 272.9 | 1 | 272.9 | F (1, 44)=1967 | p<0.0001 |
| Treatment | 20.72 | 1 | 20.72 | F (1, 44)=149.4 | p<0.0001 |
| Residual | 6.104 | 44 | 0.1387 | ||
Table 3
Two-way ANOVA analysis of the results shown in Figure 3D.
| ANOVA table | SS | DF | MS | F (DFn, DFd) | p value |
|---|---|---|---|---|---|
| Interaction | 84.19 | 1 | 84.19 | F (1, 8)=90.32 | p<0.0001 |
| Brain Region | 56.74 | 1 | 56.74 | F (1, 8)=60.87 | p<0.0001 |
| Treatment | 9.481 | 1 | 9.481 | F (1, 8)=10.17 | p=0.0128 |
| Residual | 7.457 | 8 | 0.9322 |
Table 4
Two-way ANOVA analysis of the results shown in Figure 4F.
| ANOVA table | SS | DF | MS | F (DFn, DFd) | p value |
|---|---|---|---|---|---|
| Interaction | 0.7605 | 1 | 0.7605 | F (1, 16)=408.3 | p<0.0001 |
| Brain Region | 0.002 | 1 | 0.002 | F (1, 16)=1.074 | p=0.3155 |
| Treatment | 0.0125 | 1 | 0.0125 | F (1, 16)=6.711 | p=0.0197 |
| Residual | 0.0298 | 16 | 0.001863 |
Table 5
Two-way ANOVA analysis of the results shown in Figure 4G.
| ANOVA table | SS | DF | MS | F (DFn, DFd) | p value |
|---|---|---|---|---|---|
| Interaction | 0.001748 | 1 | 0.001748 | F (1, 16)=200.5 | p<0.0001 |
| Brain Region | 0.003721 | 1 | 0.003721 | F (1, 16)=426.7 | p<0.0001 |
| Treatment | 0.0008738 | 1 | 0.000874 | F (1, 16)=100.2 | p<0.0001 |
| Residual | 0.0001395 | 16 | 8.72E-06 |
Table 6
Two-way ANOVA analysis of the results shown in Figure 4H.
| ANOVA table | SS | DF | MS | F (DFn, DFd) | p value |
|---|---|---|---|---|---|
| Interaction | 2.003 | 1 | 2.003 | F (1, 16)=1,209 | p<0.0001 |
| Brain Region | 6.786 | 1 | 6.786 | F (1, 16)=4,097 | p<0.0001 |
| Treatment | 0.616 | 1 | 0.616 | F (1, 16)=371.9 | p<0.0001 |
| Residual | 0.0265 | 16 | 0.001657 |
Table 7
Two-way ANOVA analysis of the results shown in Figure 4I.
| ANOVA table | SS | DF | MS | F (DFn, DFd) | p value |
|---|---|---|---|---|---|
| Interaction | 0.000133 | 1 | 0.000133 | F (1, 16)=189.1 | p<0.0001 |
| Brain Region | 5.95E-05 | 1 | 5.95E-05 | F (1, 16)=84.87 | p<0.0001 |
| Treatment | 1.05E-05 | 1 | 1.05E-05 | F (1, 16)=14.99 | p=0.0014 |
| Residual | 1.12E-05 | 16 | 7.01E-07 |
Table 8
Two-way ANOVA analysis of the results shown in Figure 4J.
| ANOVA table | SS | DF | MS | F (DFn, DFd) | p value |
|---|---|---|---|---|---|
| Interaction | 10.14 | 1 | 10.14 | F (1, 32)=282.9 | p<0.0001 |
| Brain Region | 8.99 | 1 | 8.99 | F (1, 32)=250.7 | p<0.0001 |
| Treatment | 14.33 | 1 | 14.33 | F (1, 32)=399.6 | p<0.0001 |
| Residual | 1.147 | 32 | 0.03586 |
Table 9
Two-way ANOVA analysis of the results shown in Figure 4K.
| ANOVA table | SS | DF | MS | F (DFn, DFd) | p value |
|---|---|---|---|---|---|
| Interaction | 5.722 | 1 | 5.722 | F (1, 32)=74.27 | p<0.0001 |
| Brain Region | 3.969 | 1 | 3.969 | F (1, 32)=51.51 | p<0.0001 |
| Treatment | 2.617 | 1 | 2.617 | F (1, 32)=33.97 | p<0.0001 |
| Residual | 2.465 | 32 | 0.07705 |
Table 10
Two-way ANOVA analysis of the results shown in Figure 4L.
| ANOVA table | SS | DF | MS | F (DFn, DFd) | P value |
|---|---|---|---|---|---|
| Interaction | 85.6 | 1 | 85.6 | F (1, 8)=14.71 | P=0.0050 |
| Brain Region | 469.1 | 1 | 469.1 | F (1, 8)=80.63 | P<0.0001 |
| Treatment | 0.1639 | 1 | 0.1639 | F (1, 8)=0.02817 | P=0.8709 |
| Residual | 46.55 | 8 | 5.818 |
Table 11
Two-way ANOVA analysis of the results shown in Figure 7.
| ANOVA table | SS | DF | MS | F (DFn, DFd) | p value |
|---|---|---|---|---|---|
| Interaction | 8469 | 1 | 8469 | F (1, 20)=321.7 | p<0.0001 |
| Brain Region | 781.5 | 1 | 781.5 | F (1, 20)=29.68 | p<0.0001 |
| Treatment | 1263 | 1 | 1263 | F (1, 20)=47.97 | p<0.0001 |
| Residual | 526.6 | 20 | 26.33 |
Key resources table
| Reagent type (species) or resource | Designation | Source or reference | Identifiers | Additional information |
|---|---|---|---|---|
| Antibody | anti-TTR (rabbit polyclonal) | Thermo Fisher Scientific | Cat# PA5-80196 | WB (1:1000) IF (1:300) |
| Antibody | anti-Nrgn (goat polyclonal) | Abcam | Cat#ab99269 | WB (1:1000) |
| Antibody | anti-GAPDH (mouse monoclonal) | Santa Cruz | Cat#: sc32233 | WB (1:5000) |
| Antibody | anti-5-methyl cytosine (mouse monoclonal) | Epigentek | Cat#: A-1014–050 | MeDIP (1 µg per reaction) |
| Chemical compound, drug | in vivo-jetPEI | Polyplus Transfection | Cat#: 201–10 G | Transfection reagent for in vivo delivery of nucleic acids |
| Chemical compound, drug | 2,4,5-Trimethylthiazole | Sigma-Aldrich | Cat#:W332518 | |
| Chemical compound, drug | L-Thyroxine | Sigma-Aldrich | Cat#:T2376-100MG | |
| Commercial assay or kit | EliKine TM Thyroxine (T4) ELISA Kit | Abbkine | Cat#: KET007 | |
| Commercial assay or kit | EliKineTM Triiodothyronine (T3) ELISA Kit | Abbkine | Cat#: KET006 | |
| Sequence-based reagent | Ttr esiRNA (esiRNA targeting mouse Ttr) | Sigma-Aldrich | Cat#: EMU030721 |
Additional files
-
Supplementary file 1
List of differentially expressed genes (DEGs) in Hypo and PFC of Males and Females.
- https://cdn.elifesciences.org/articles/77968/elife-77968-supp1-v2.xlsx
-
Supplementary file 2
- https://cdn.elifesciences.org/articles/77968/elife-77968-supp2-v2.xlsx
-
Supplementary file 3
Primers used for qRT-PCR and MeDIP-qPCR.
- https://cdn.elifesciences.org/articles/77968/elife-77968-supp3-v2.xlsx
-
Transparent reporting form
- https://cdn.elifesciences.org/articles/77968/elife-77968-transrepform1-v2.docx
Download links
A two-part list of links to download the article, or parts of the article, in various formats.
Downloads (link to download the article as PDF)
Open citations (links to open the citations from this article in various online reference manager services)
Cite this article (links to download the citations from this article in formats compatible with various reference manager tools)
Early life stressful experiences escalate aggressive behavior in adulthood via changes in transthyretin expression and function
eLife 11:e77968.
https://doi.org/10.7554/eLife.77968


