A modelling approach to estimate the transmissibility of SARS-CoV-2 during periods of high, low, and zero case incidence
- Telethon Kids Institute, Australia
- Curtin University, Australia
- Peter Doherty Institute for Infection and Immunity, The Royal Melbourne Hospital and The University of Melbourne, Australia
- Melbourne School of Population and Global Health, The University of Melbourne, Australia
- School of Ecosystem and Forest Sciences, The University of Melbourne, Australia
- Murdoch Childrens Research Institute, The Royal Children’s Hospital, Australia
- School of Mathematics and Statistics, The University of Melbourne, Australia
Figures
Figure 1
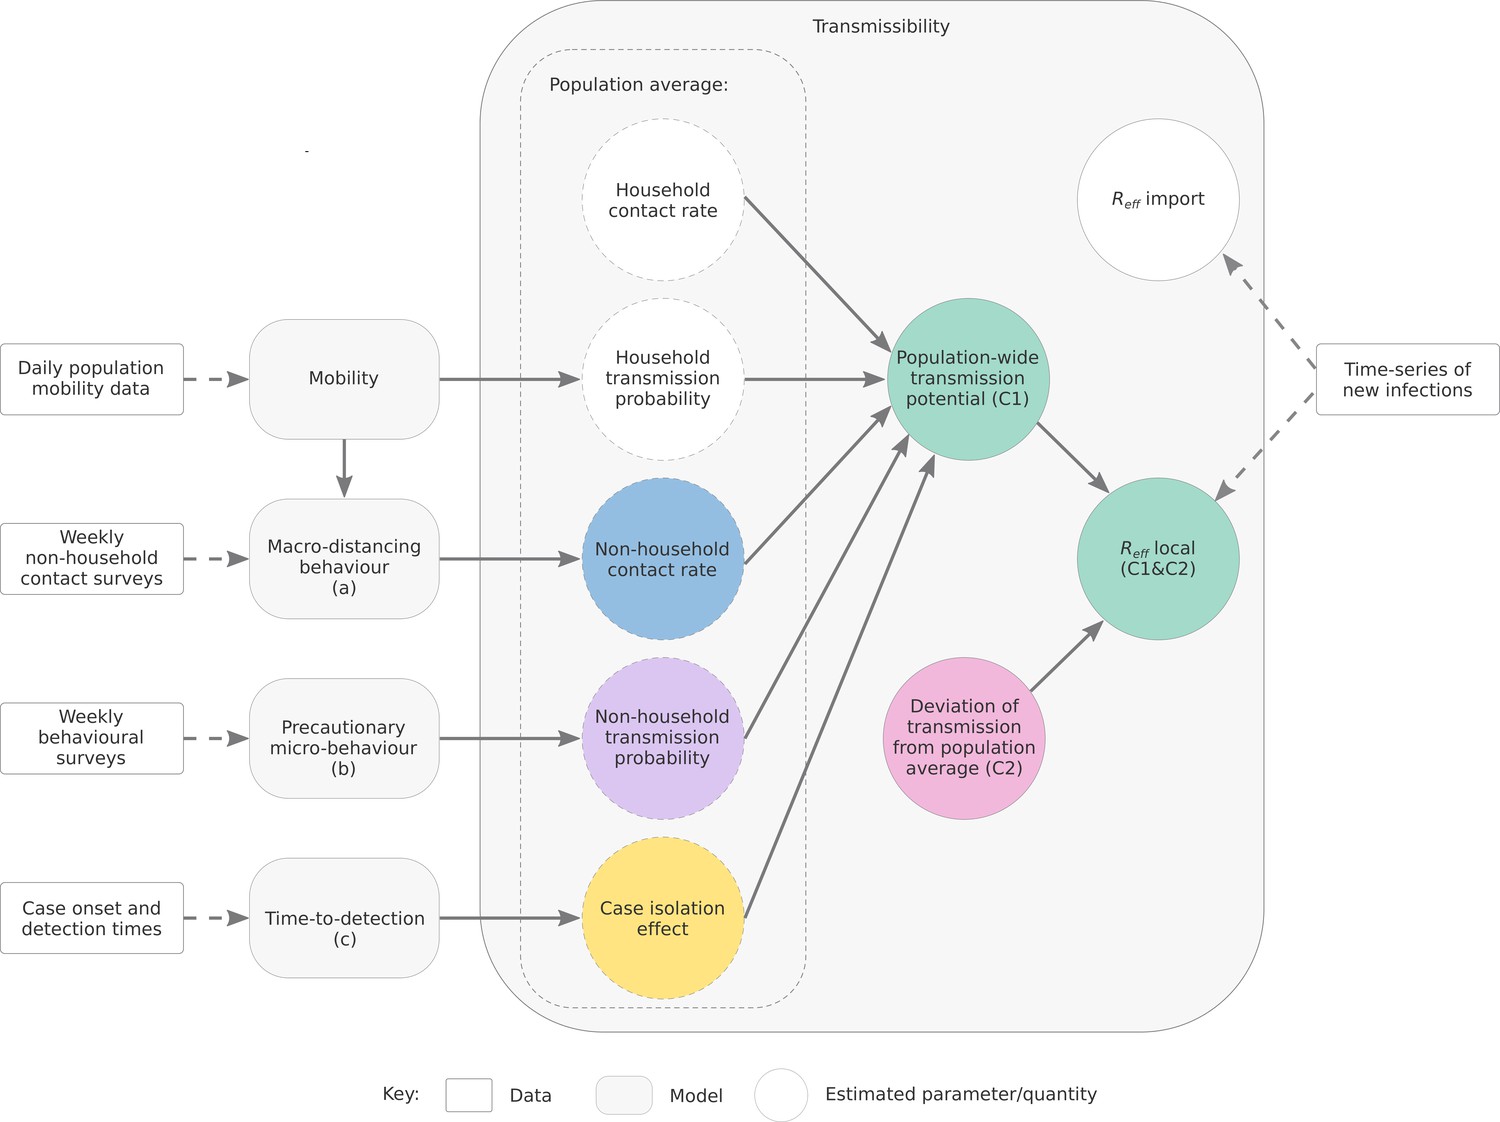
Depiction of the relationship between data sources, model components, and reported quantities.
Figure 2 with 4 supplements
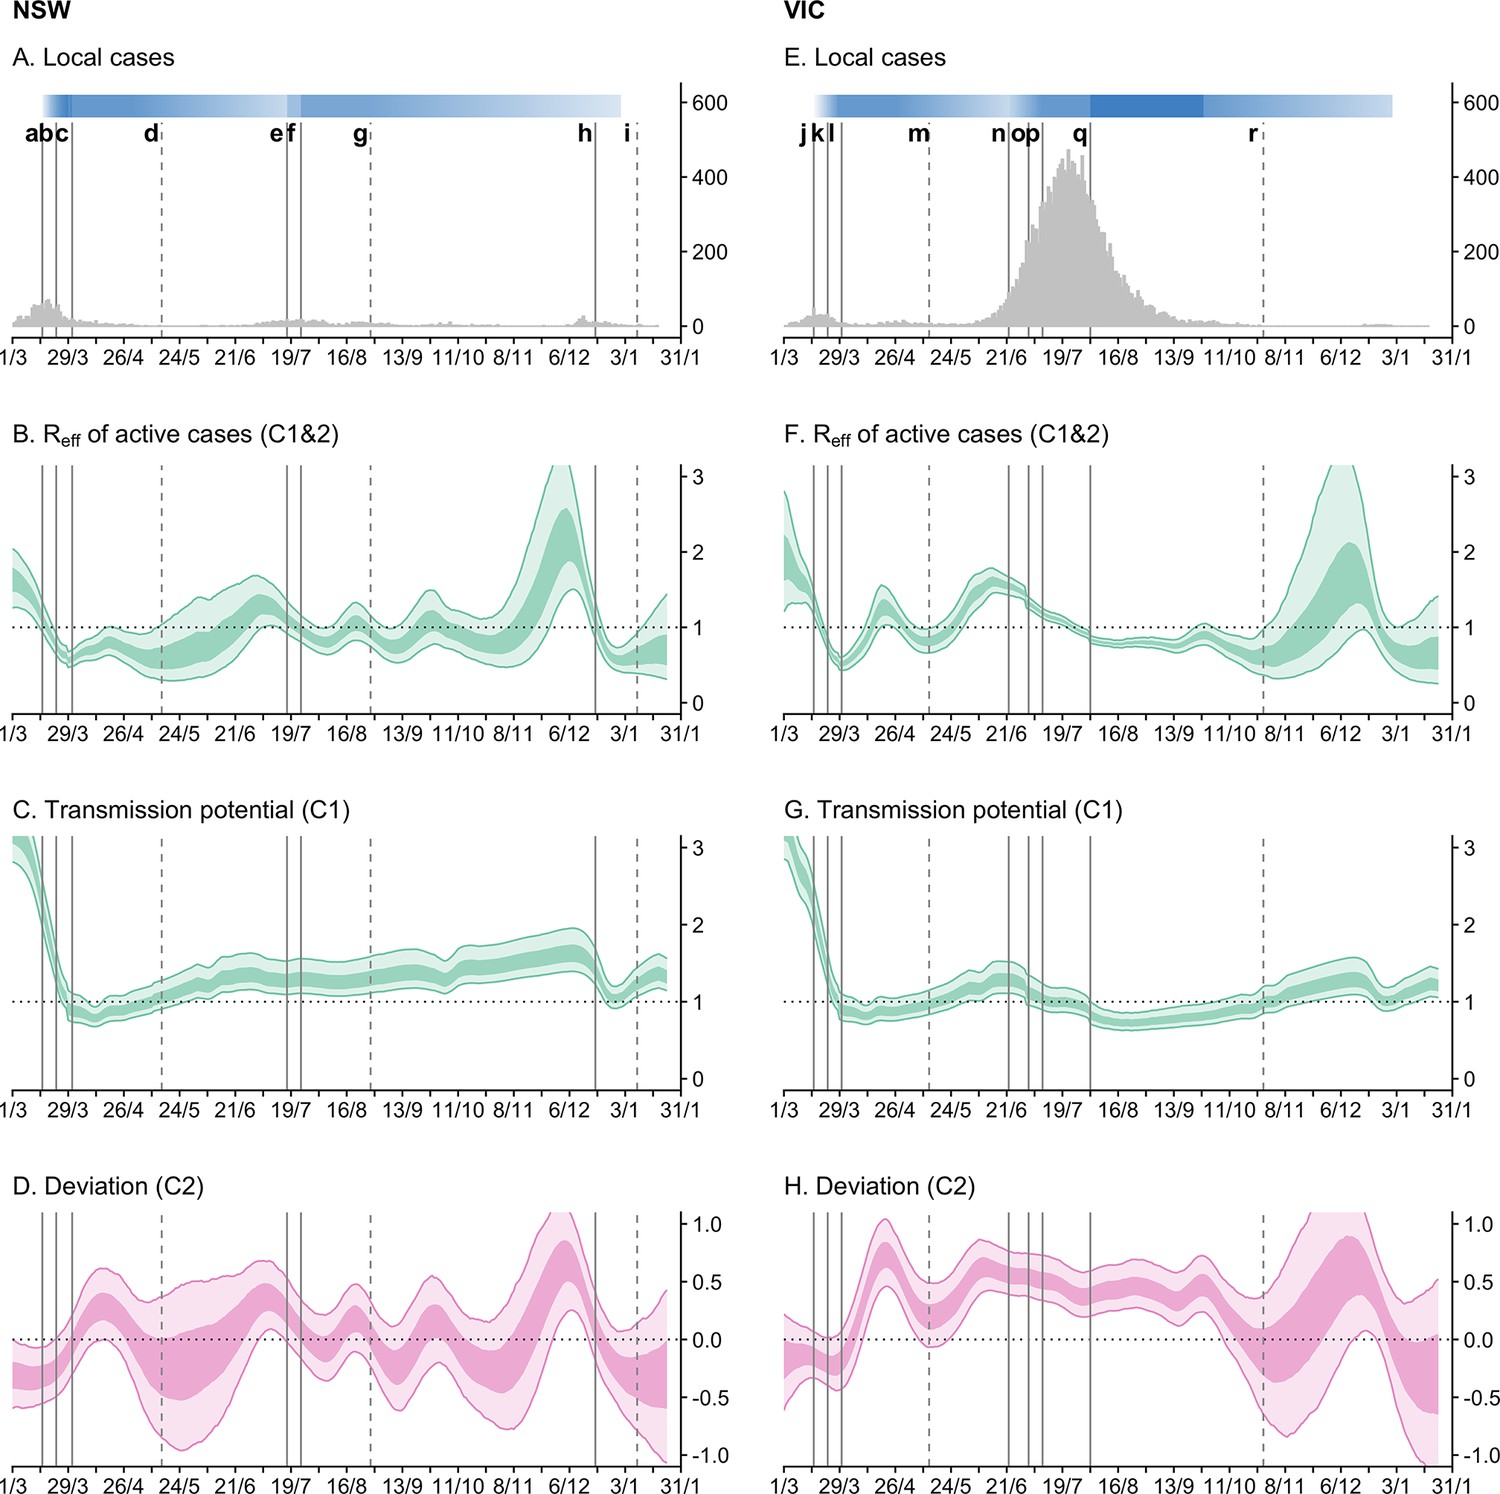
Time-series of daily local cases and transmissibility model components for the states of New South Wales (NSW) and Victoria (VIC) from 1 March 2020 to 24 January 2021.
Light ribbons = 90% credible intervals; dark ribbons = 50% credible intervals. Vertical lines represent dates of key changes in restrictions on gatherings and movement, detailed in Supplementary file 1 (solid lines = tightening of restrictions; dashed lines = easing of restrictions). The blue bar is shaded according to the level of restrictions (lighter blue = less restrictions; darker blue = more restrictions). (A and E) Daily new local cases by inferred infection date. (B and F) State-wide local transmission potential (Component 1). C and G: of local active cases (Component 1&2). (D and H) Deviation between transmission potential and (Component 2).
Figure 2—figure supplement 1
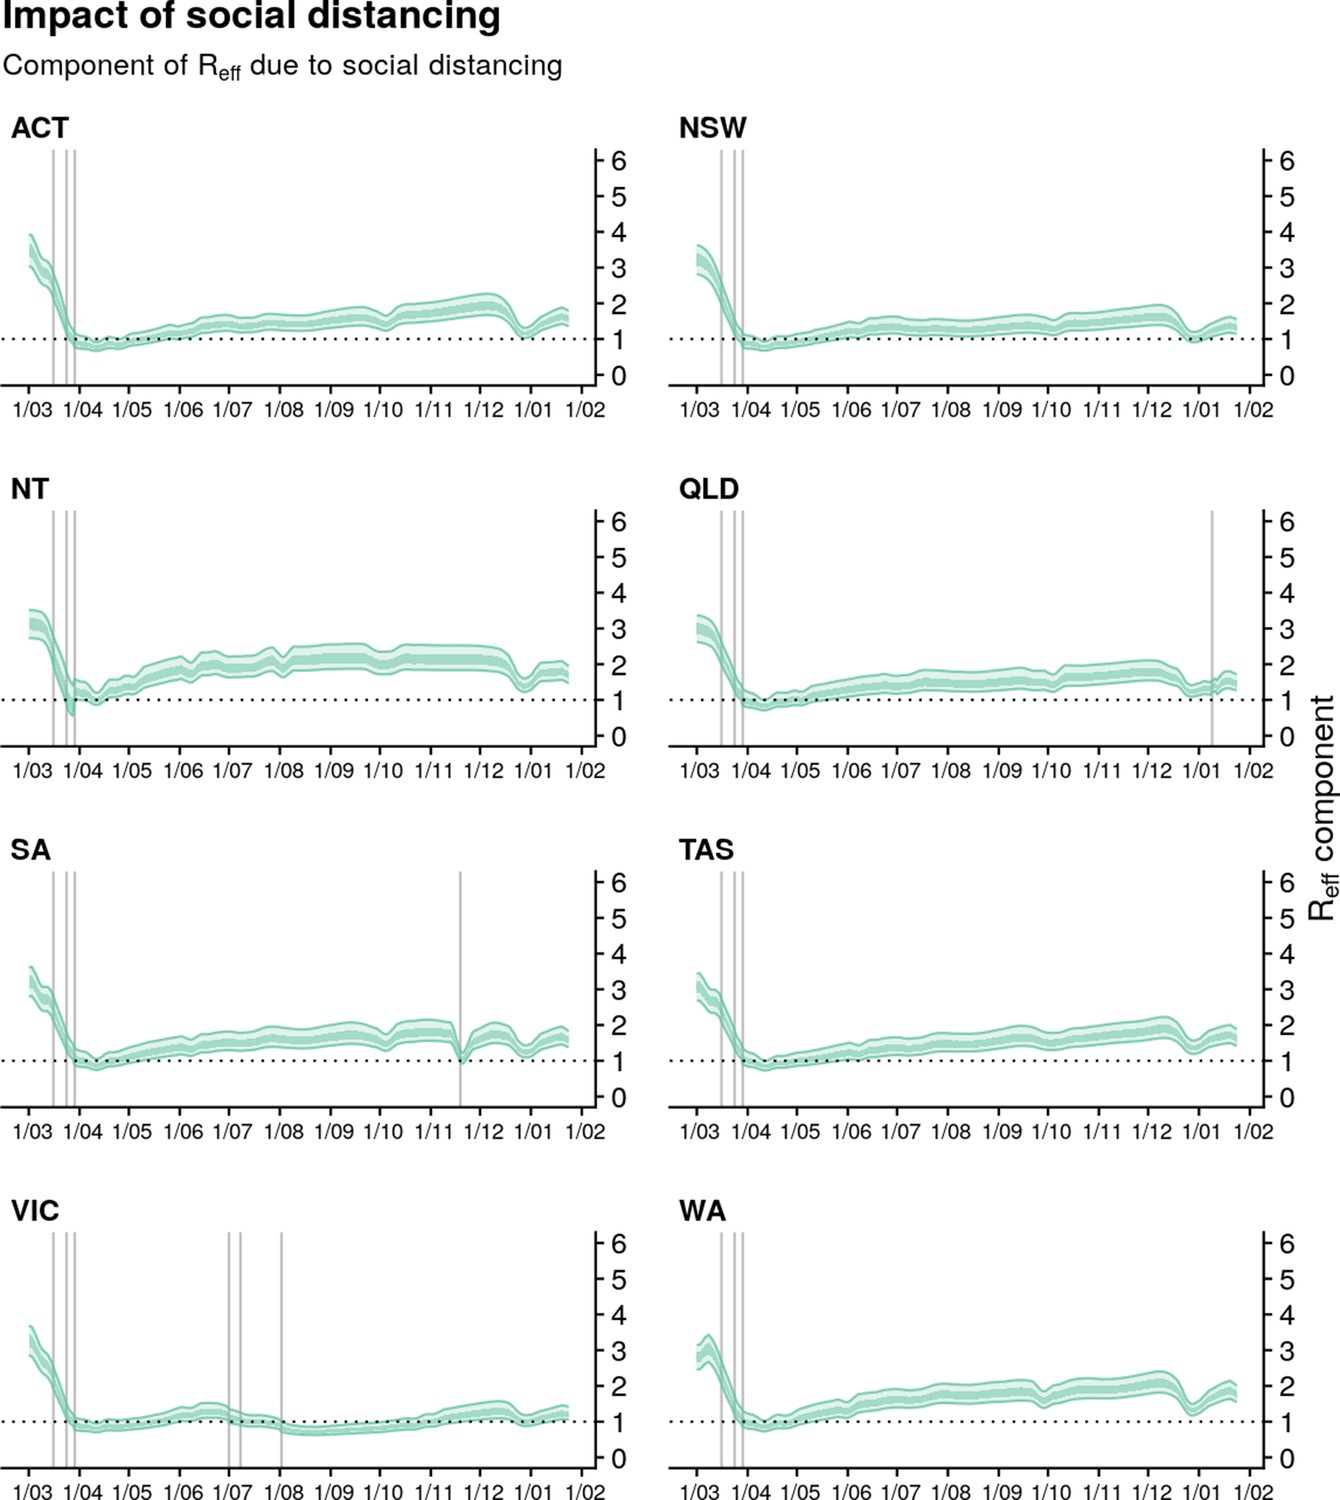
Estimates of state-wide transmission potential (Component 1) by state/territory from 1 March 2020 up to 24 January 2021 (lighter ribbons = 90% credible intervals; darker ribbons = 50% credible interval).
Solid grey vertical lines indicate key dates of implementation of various physical distancing policies.
Figure 2—figure supplement 2
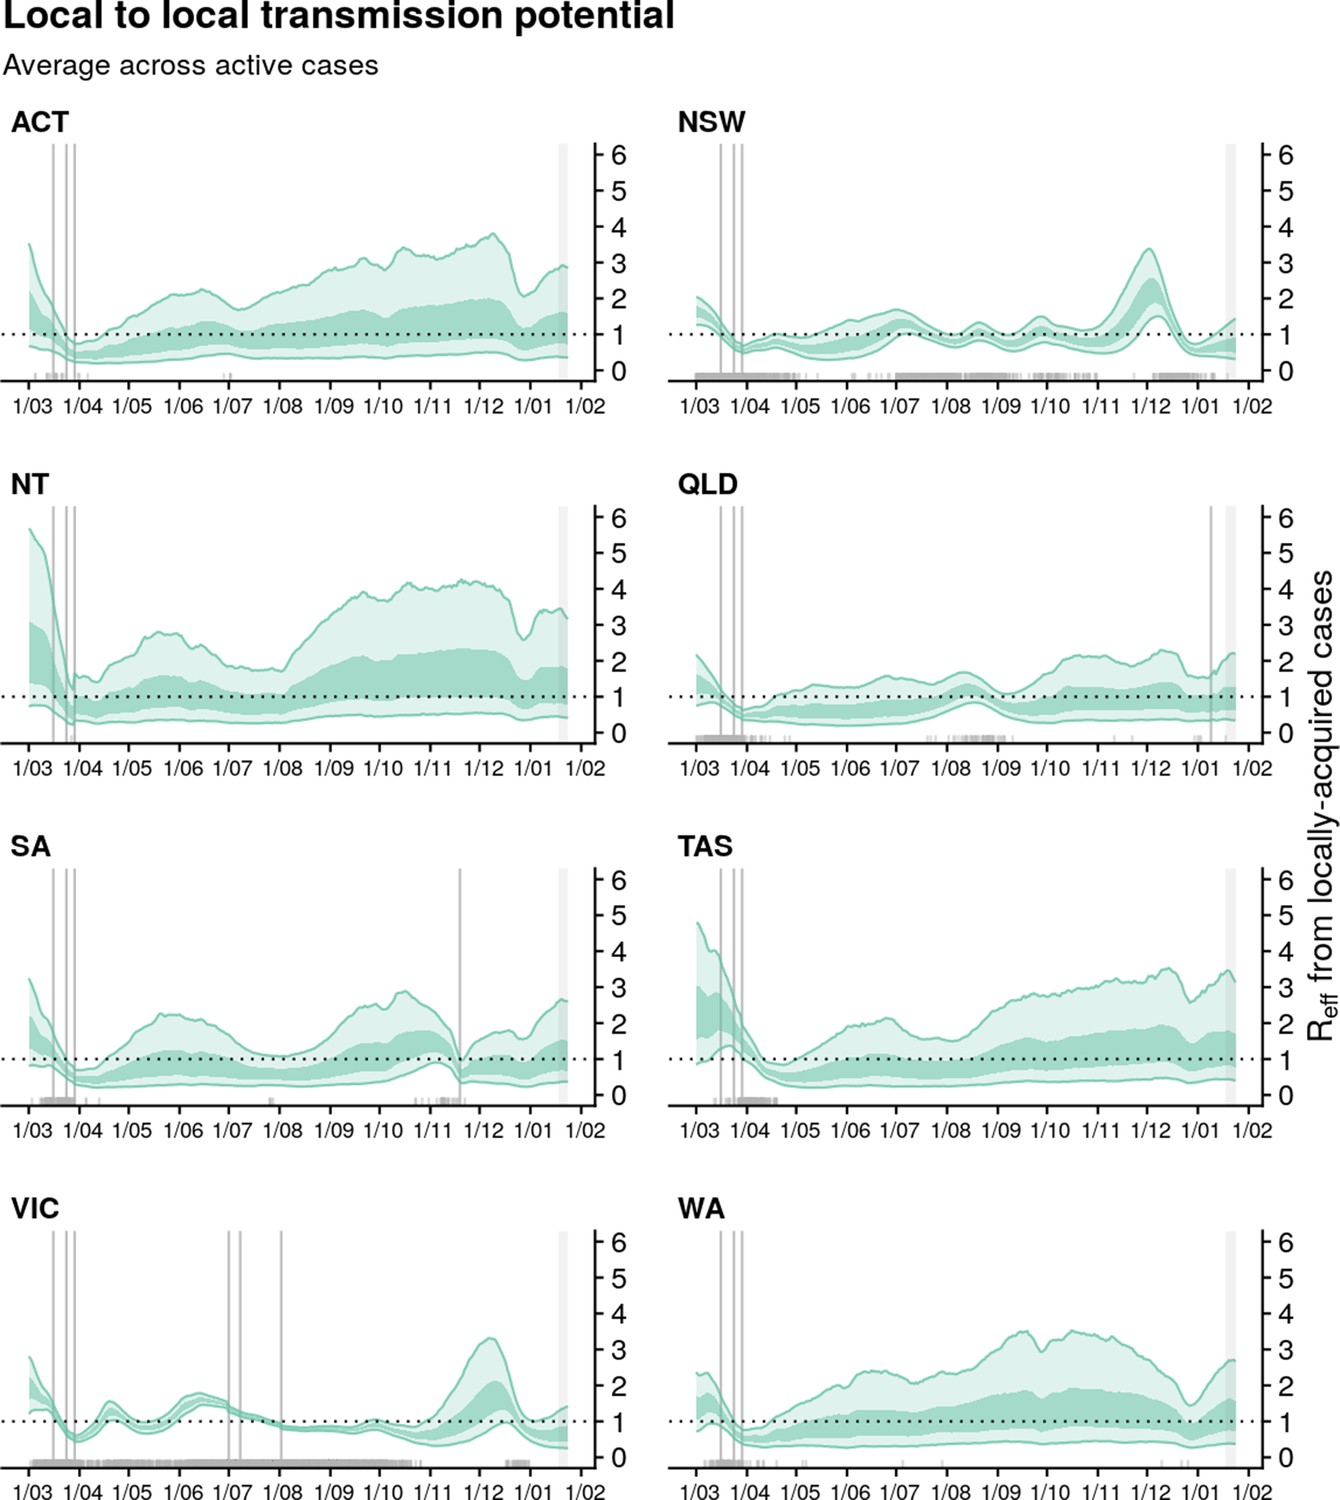
Estimates of for local active cases (model Component 1&2) for each state/territory (light green ribbon = 90% credible interval; dark green ribbon = 50% credible interval).
Estimates are made from 1 March 2020 up to 24 January 2021 based on cases with inferred infection dates up to and including 18 January (due to a delay from infection to reporting, the trend in estimates after 18 January is informed by our estimates of up to 18 January and transmission potential). Solid grey vertical lines indicate key dates of implementation of various physical distancing policies. Black dotted line indicates the target value of 1 for the effective reproduction number required for control. Local cases by inferred date of infection are indicated by grey ticks on the x-axis. For states/territories with very low numbers of local active cases, the estimates of for active cases is highly uncertain. The state-wide transmission potential should be referred to when assessing the risk of an epidemic becoming established given a seeding event.
Figure 2—figure supplement 3
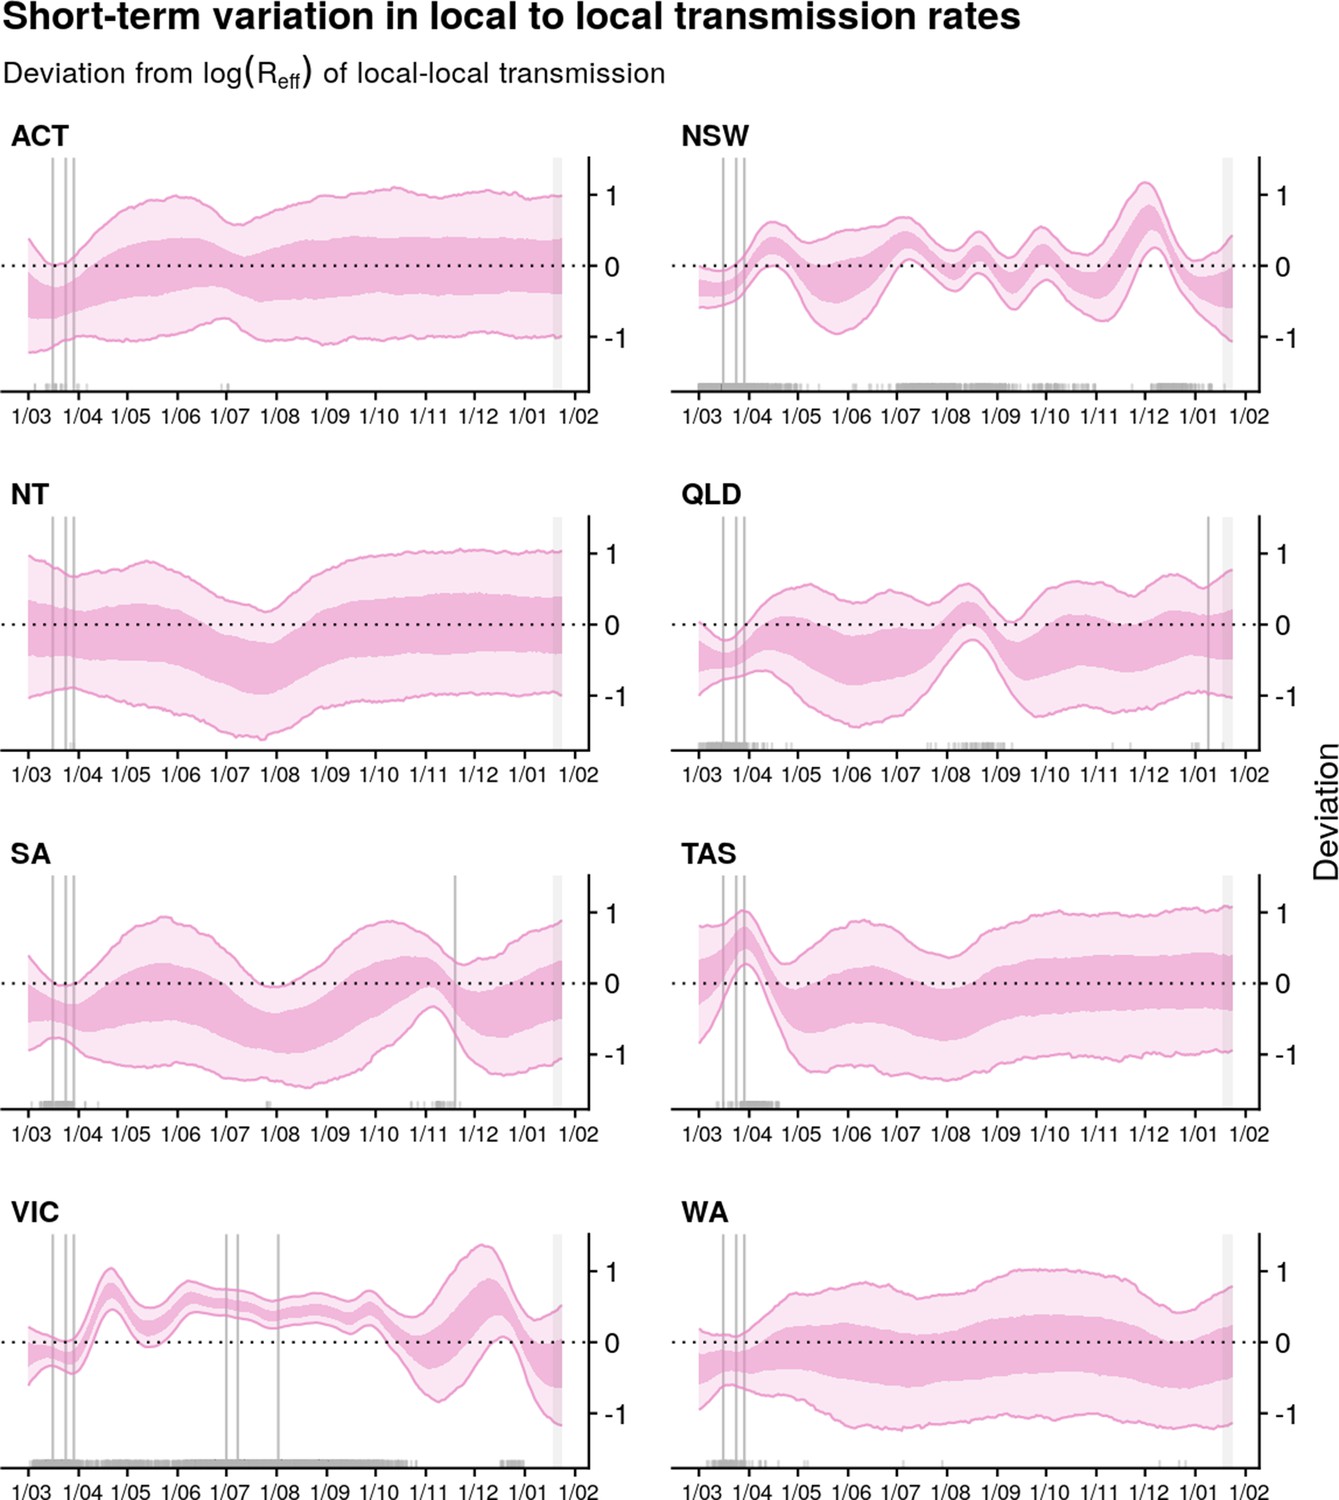
Deviation between of active cases and state-level local transmission potential (Component 2) for each state/territory (light pink ribbon = 90% credible interval; dark pink ribbon = 50% credible interval).
Estimates are made from 1 March 2020 up to 24 January 2021 based on cases with inferred infection dates up to and including 18 January (due to a delay from infection to reporting, the trend in estimates after 18 January reflects the average range of deviations for that state, indicated by the grey shading). Solid grey vertical lines indicate key dates of implementation of various physical distancing policies. Local cases by inferred date of infection are indicated by grey ticks on the x-axis.
Figure 2—figure supplement 4
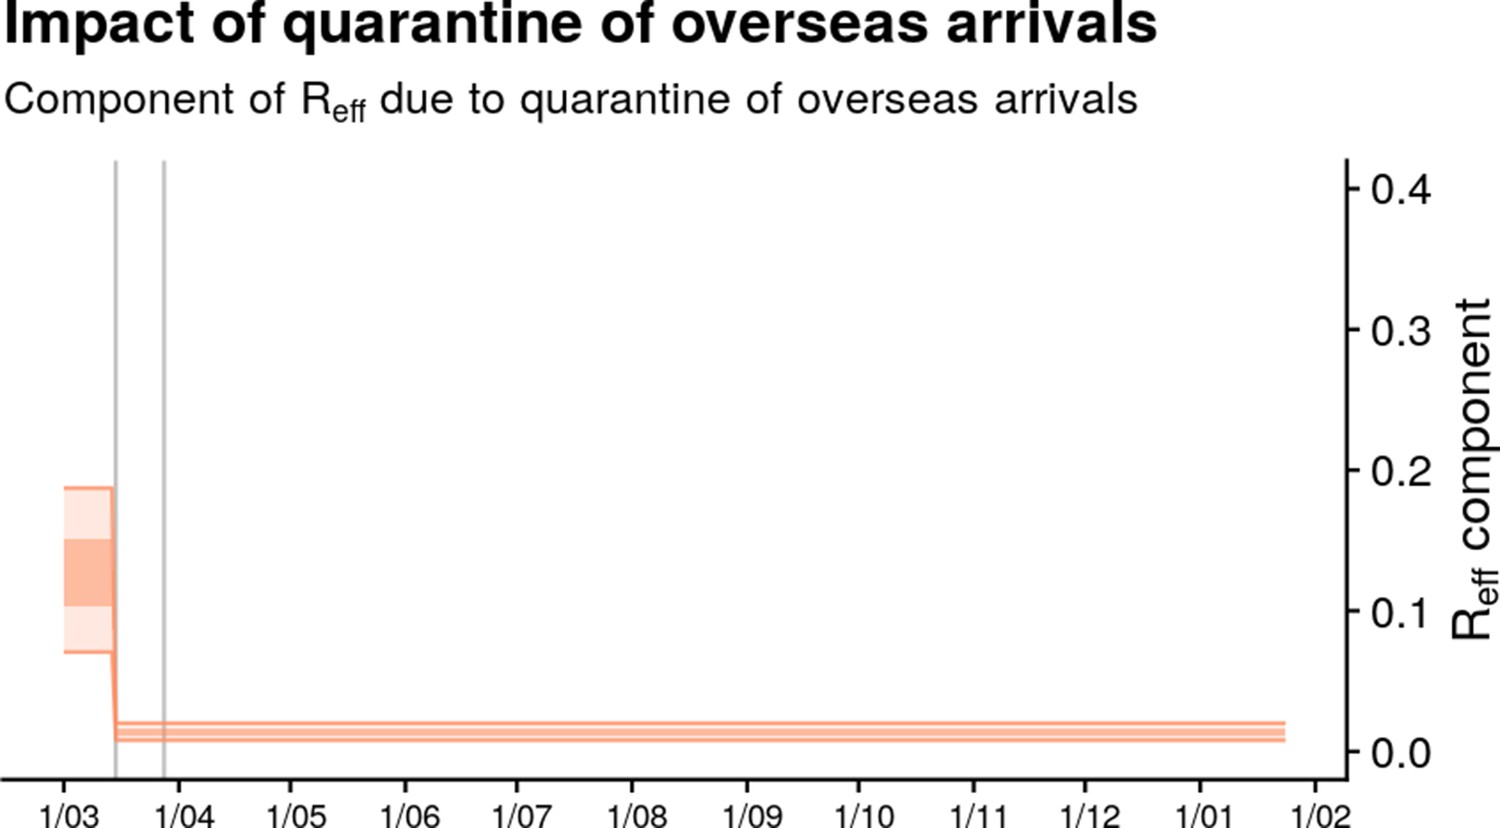
Nationwide average reduction in that is due to quarantine of overseas arrivals estimated from the model (light orange ribbon=90% credible interval; dark orange ribbon = 50% credible interval).
Note that this trend does not capture time-varying fluctuations in in each state/territory. Solid grey vertical lines indicate key dates of implementation of key response policies. Note: A simple but naïve upper bound on import can be computed by assuming that all locally acquired cases arose from imported cases, and therefore computing the ratio of the numbers of local and imported cases. This results in a maximum possible value of the average import of 0.57.
Figure 3 with 4 supplements
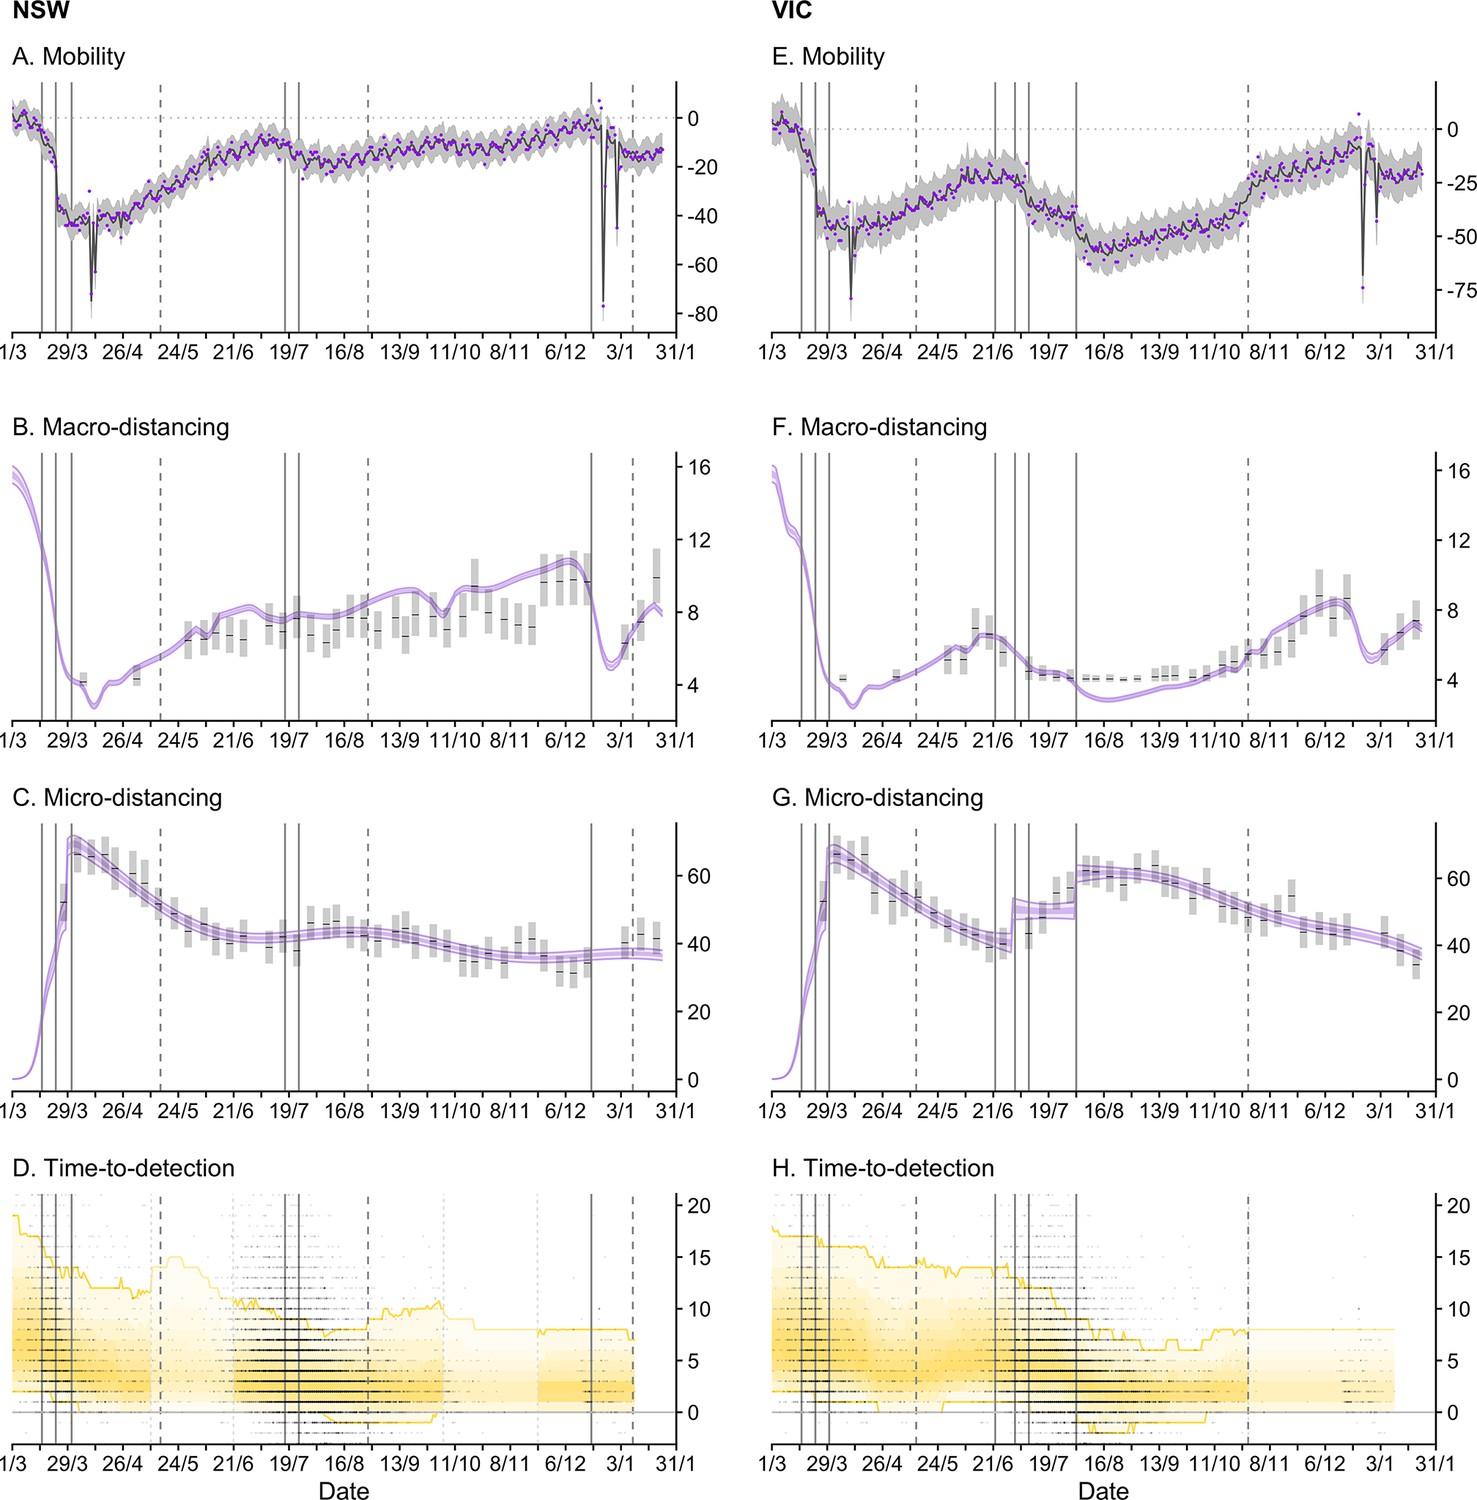
Time-series of each sub-model of transmission potential (Component 1) for New South Wales (NSW) and Victoria (VIC) from 1 March 2020 to 24 January 2021.
Vertical lines represent dates of key changes in restrictions on gatherings and movement, detailed in Supplementary file 1 (solid lines = tighteningof restrictions; dashed lines = easing of restrictions). The blue bar is shaded according to the level of restrictions (lighter blue = less restrictions; darker blue = more restrictions). (A and E) Percentage change compared to a pre-COVID-19 baseline of one key population mobility data stream ‘Google: time a retail and recreation’. Purple dots are data stream values (percentage change on baseline). Solid lines and grey shaded regions are the estimated trend and 95% error interval estimated by our model. (B and F) Estimated trends in macro-distancing behaviour, that is, reduction in the daily rate of non-household contacts (dark purple ribbons = 50% credible intervals; light purple ribbons = 90% credible intervals). Estimates are informed by state-level data from nationwide weekly surveys (indicated by the black lines and grey rectangles) and population mobility data. (C and G) Estimated trends in precautionary micro-behaviour, that is, reduction in transmission probability per non-household contact (dark purple ribbons = 50% credible intervals, light purple ribbons = 90% credible intervals). Estimates are informed by state-level data from nationwide weekly surveys (indicated by the black lines and grey boxes). (D and H) Estimated trend in distributions of time from symptom onset to notification for locally acquired cases (black line = median; yellow ribbons = 90% distribution quantiles; black dots = time-to-notification of each case). Faded regions indicate where a national trend is used due to low case counts.
Figure 3—figure supplement 1
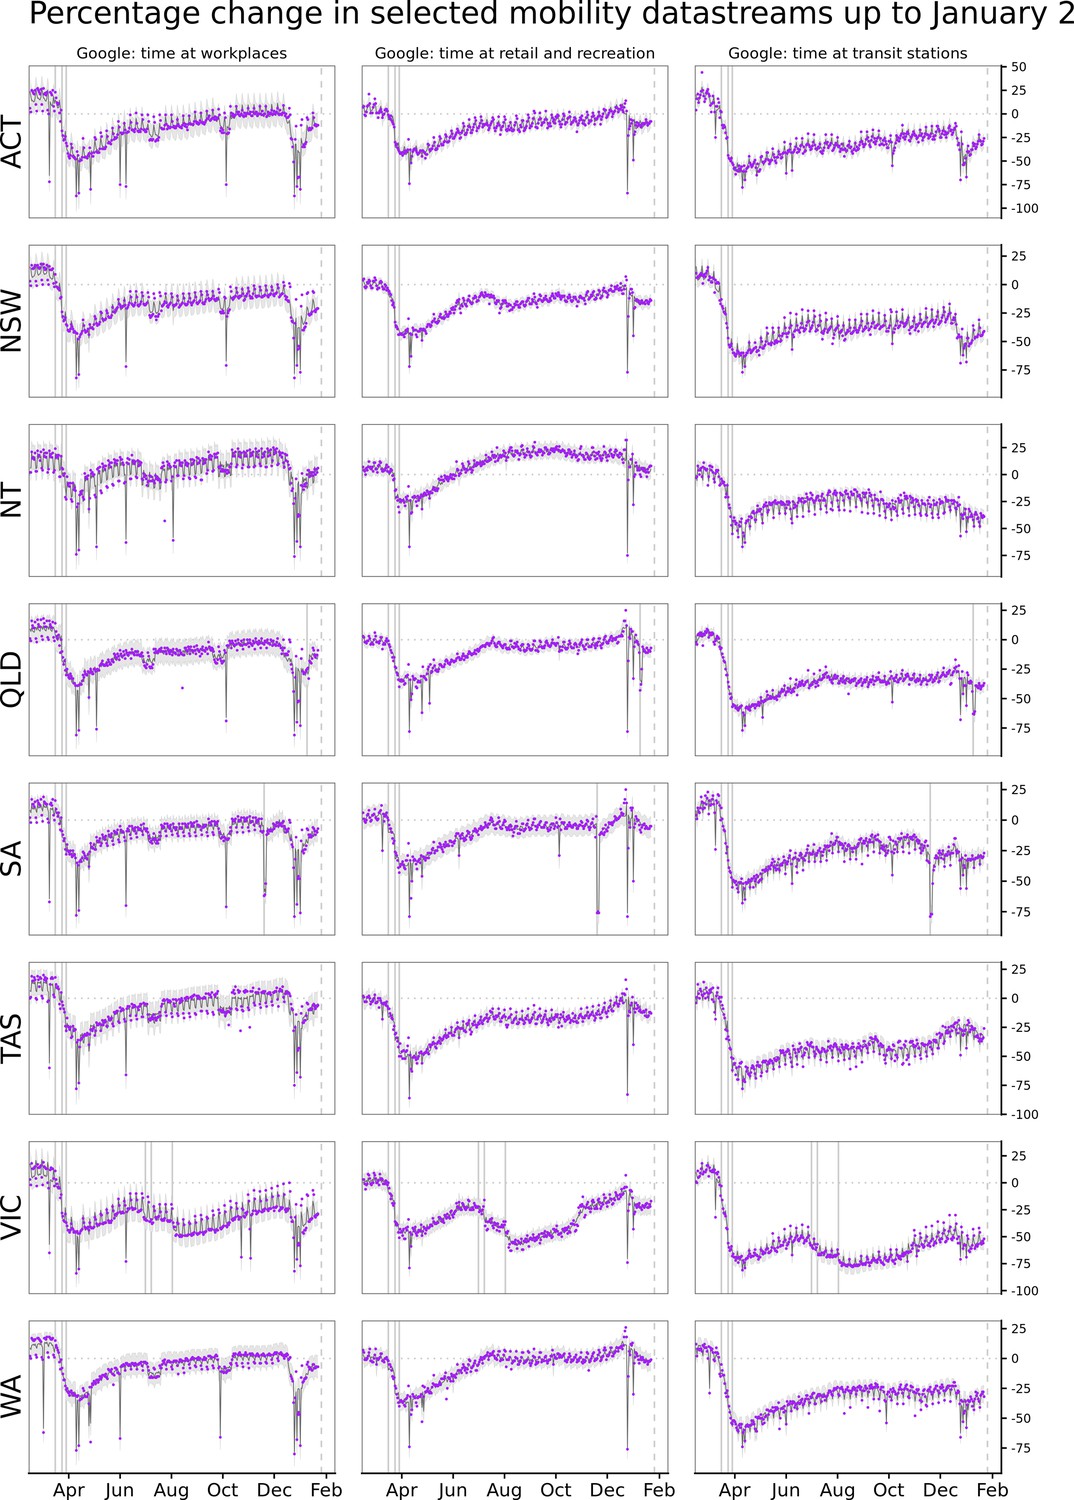
Percentage change compared to a pre-COVID-19 baseline of three key mobility data streams in each Australian state and territory from 1 March up to 24 January 2021.
Solid vertical lines indicate dates of implementation of key physical distancing measures. Purple dots in each panel are data stream values (percentage change on baseline). Solid lines and grey shaded regions are the estimated trend and 95% error interval estimated by our model.
Figure 3—figure supplement 2
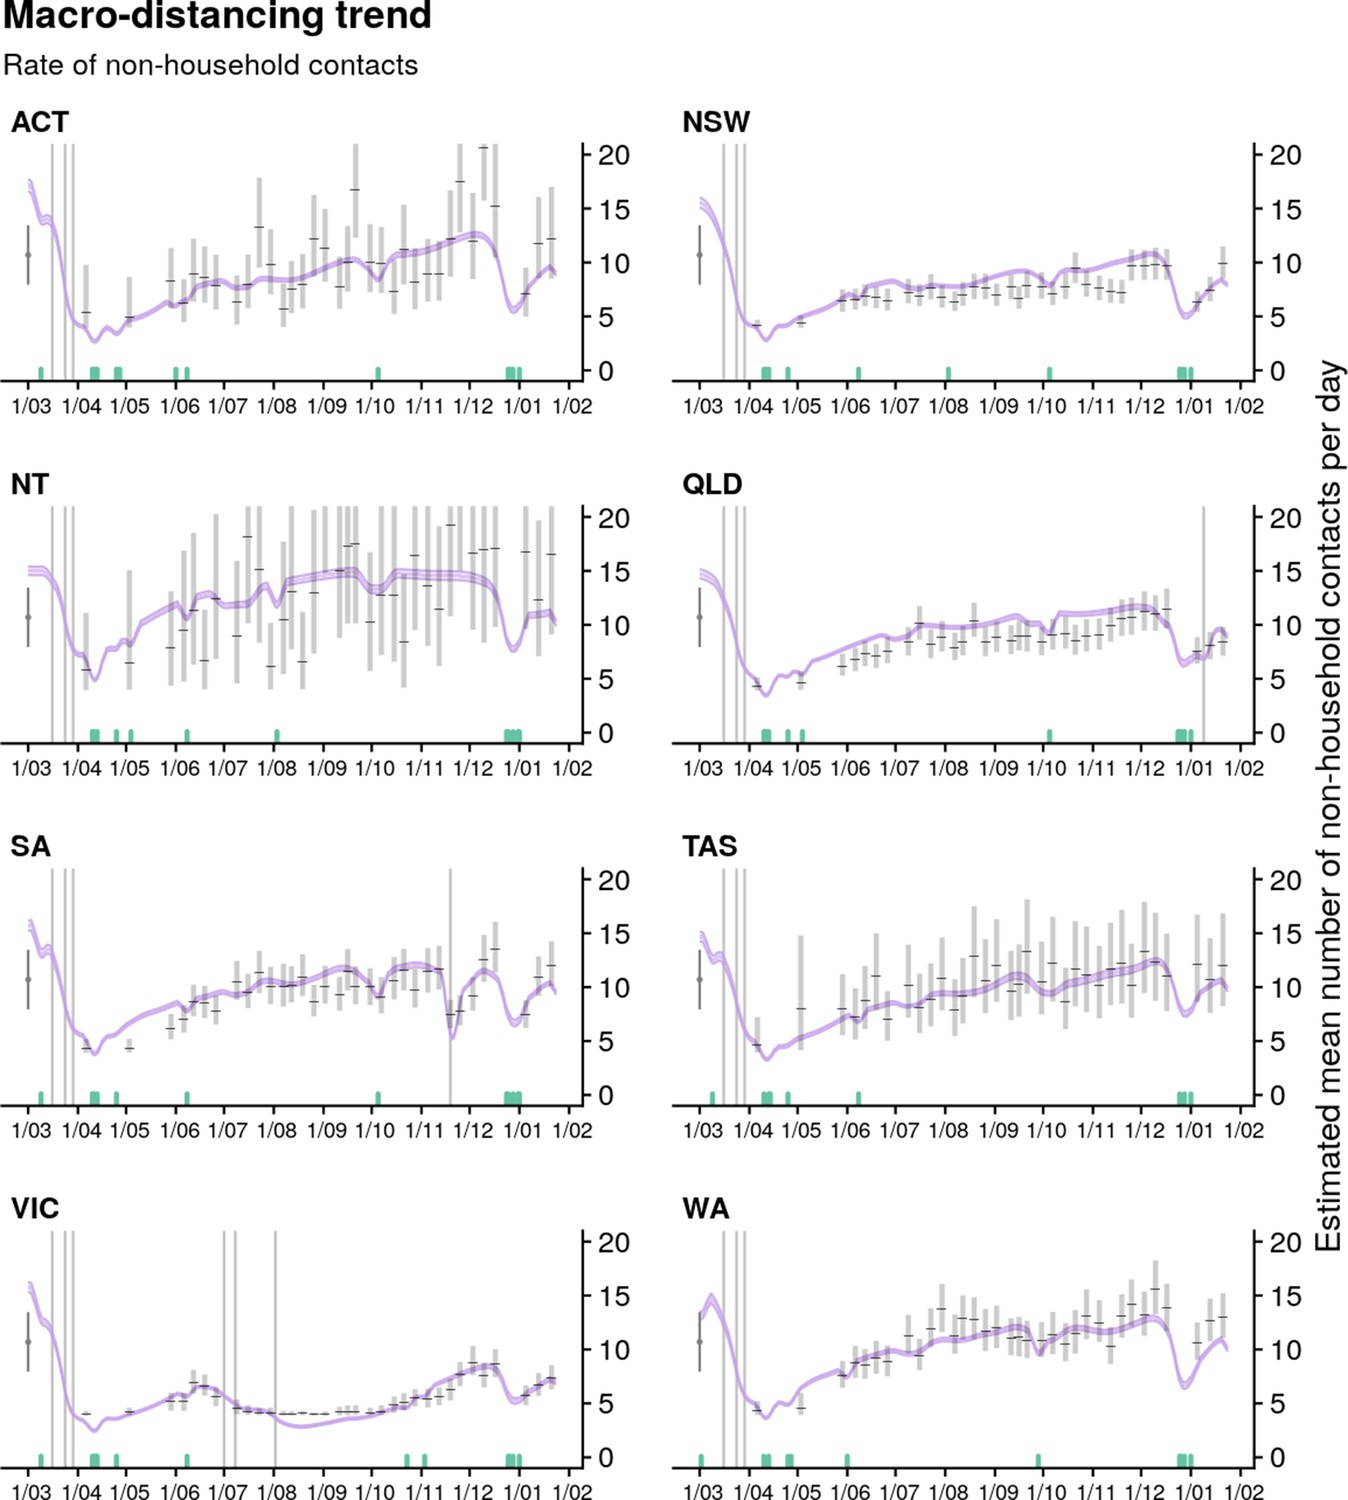
Estimated trend in macro-distancing behaviour, that is, reduction in the daily rate of non-household contacts, in each Australian state/territory from 1 March 2020 up to 24 January 2021 (light purple ribbons = 90% credible intervals; dark purple ribbons = 50% credible intervals).
Estimates are informed by state-level data from nationwide surveys and population mobility data. The point wise estimates for each survey round (represented as black lines and grey rectangles) are the outputs of a separate statistical model that does not include the mobility data covariates, and is intended as a visual illustration of the level of data sparsity and variability, rather than a way of estimating fit to data, since the raw data for each week is subject to significant skew. Green ticks indicate the dates that public holidays coincided with surveys (when people tend to stay home, biasing down the number of non-household contacts reported on those days).
Figure 3—figure supplement 3
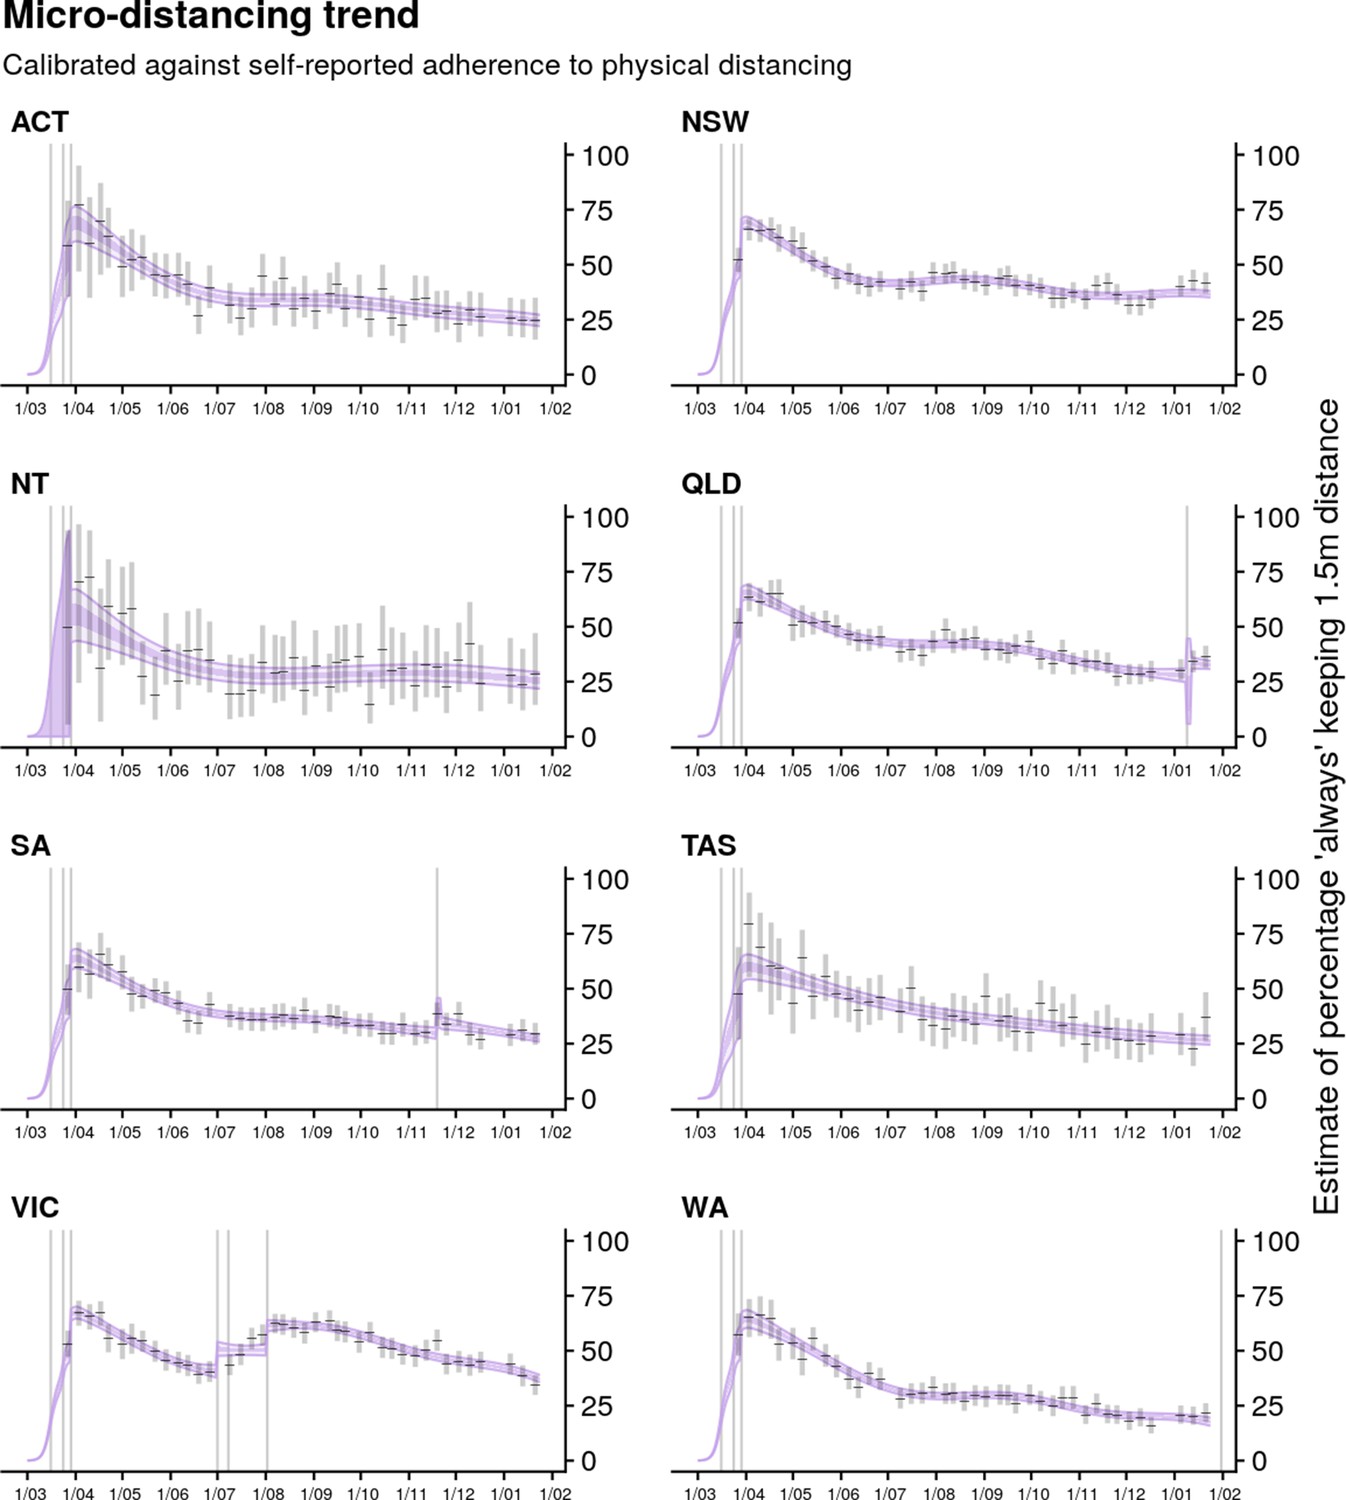
Estimated trend in precautionary micro-behaviour, that is reduction in transmission probability per non-household contact, in each Australian state/territory from 1 March 2020 up to 24 January 2021 (light purple ribbons = 90% credible intervals; dark purple ribbons = 50% credible intervals).
Estimates are informed by state-level data from nationwide weekly surveys since March 2020 (indicated by the black lines and grey boxes).
Figure 3—figure supplement 4
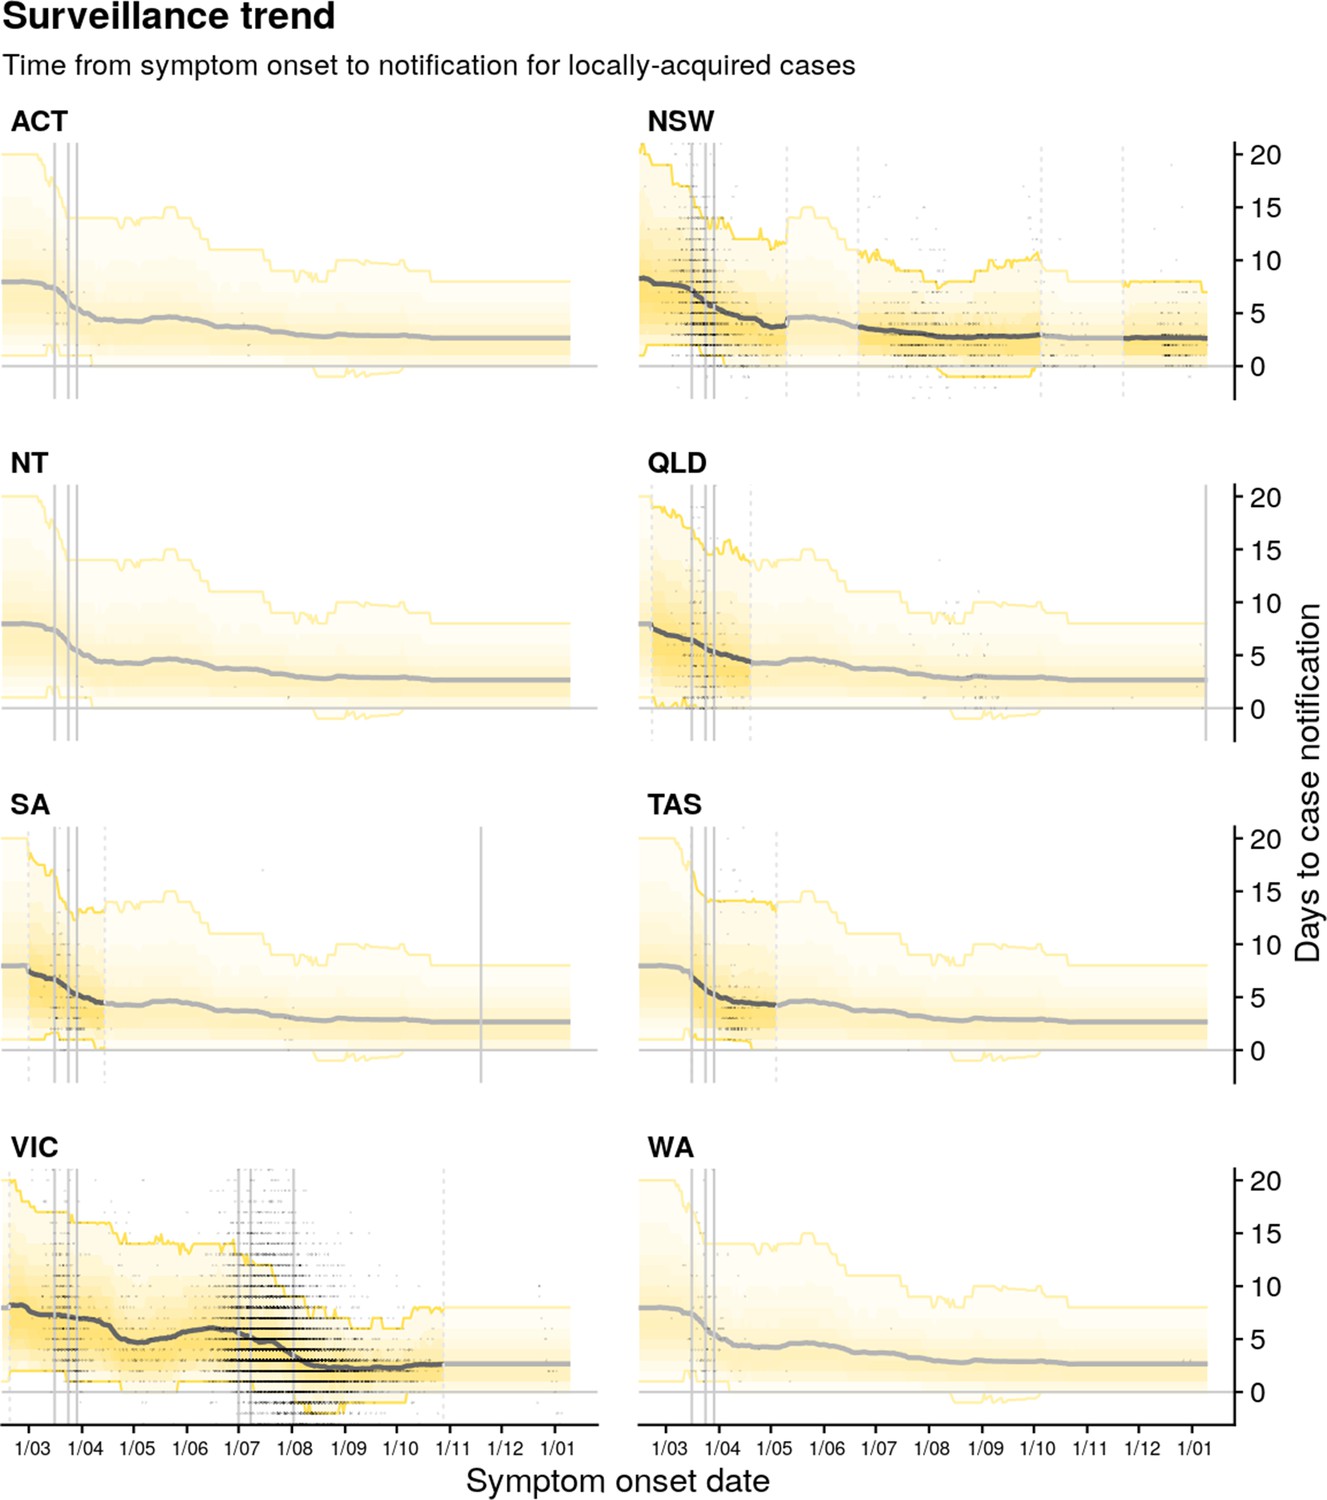
Estimated trend in distributions of time from symptom onset to notification for locally acquired cases for each Australian state/territory from 1 March 2020 to 12 January 2021 (black line = median; yellow ribbons = 90% distribution quantiles; black dots = time-to-notification of each case).
Faded regions indicate where a national trend is used due to low case counts.
Tables
Table 1
Definitions and interpretation of key estimated quantities from the model of SARS-CoV-2 transmissibility in different epidemiological contexts.
= the effective reproduction number. TP = transmission potential. C2=model component 2.
| Interpretation | |||
|---|---|---|---|
| Metric | Definition | Community transmission | No transmission |
| TP | Expected reproduction number of a pathogen in the general population | If established in the general population, whether the epidemic is expected to grow (TP > 1) or decline (TP < 1) | Suitability for the pathogen, if it were present, to establish and maintain community transmission (TP > 1) or otherwise (TP < 1). |
| Average number of new infections caused by an infectious individual drawn from the active cases | Whether the epidemic is growing ( > 1) or in decline ( < 1) | Not applicable | |
| C2 | Deviation between TP and | Whether the virus is spreading faster (C2 positively biased) or slower (C2 negatively biased) among active cases than expected | Not applicable |
Additional files
-
MDAR checklist
- https://cdn.elifesciences.org/articles/78089/elife-78089-mdarchecklist1-v2.pdf
-
Supplementary file 1
Dates of key changes in restrictions on gatherings and movement for New South Wales and Victoria, as shown in Figures 2 and 3.
- https://cdn.elifesciences.org/articles/78089/elife-78089-supp1-v2.tex
-
Supplementary file 2
Parameters in the semi-mechanistic part of the time-varying model of .
Prior on weights for ω correspond to Google mobility metrics in the following order: parks, residential, retail and recreation, transit stations, workplaces.
- https://cdn.elifesciences.org/articles/78089/elife-78089-supp2-v2.tex
-
Supplementary file 3
Fixed parameters in the semi-mechanistic part of the time-varying model of .
- https://cdn.elifesciences.org/articles/78089/elife-78089-supp3-v2.tex
-
Supplementary file 4
Parameters used in the time-series part of the time-varying model of .
- https://cdn.elifesciences.org/articles/78089/elife-78089-supp4-v2.tex
Download links
A two-part list of links to download the article, or parts of the article, in various formats.
Downloads (link to download the article as PDF)
Open citations (links to open the citations from this article in various online reference manager services)
Cite this article (links to download the citations from this article in formats compatible with various reference manager tools)
A modelling approach to estimate the transmissibility of SARS-CoV-2 during periods of high, low, and zero case incidence
eLife 12:e78089.
https://doi.org/10.7554/eLife.78089


