Drosophila gustatory projections are segregated by taste modality and connectivity
- University of California, Berkeley, United States
- Janelia Research Campus, Howard Hughes Medical Institute, United States
Figures
Figure 1 with 1 supplement
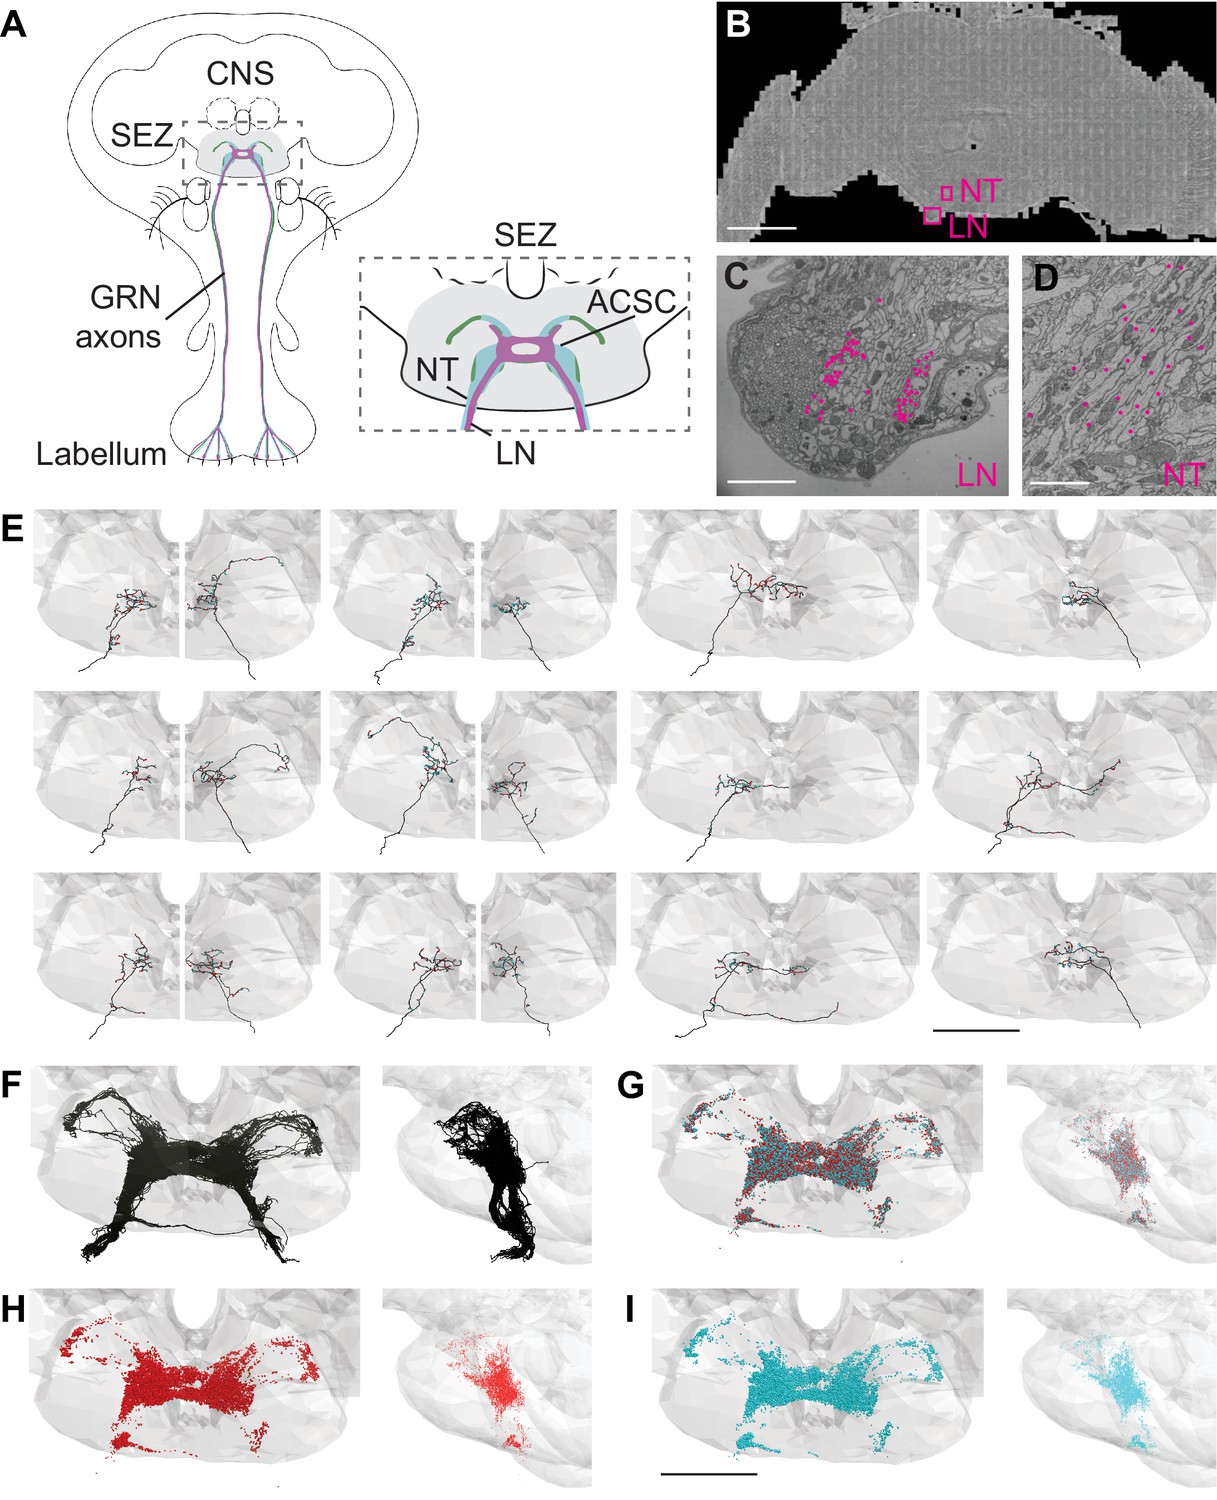
Electron microscopy (EM)-based reconstructions of gustatory receptor neurons (GRNs) and synaptic sites.
(A) Schematic showing GRNs in the proboscis labellum and their axons terminating in the subesophageal zone (SEZ) (gray) in the central nervous system (CNS) (left). Close-up of SEZ (boxed region on left) (gray), noting the labial nerve (LN) and GRN neural tract (NT). GRNs that detect bitter (magenta), sugar (green), and water (blue) terminate in the anterior central sensory center (ACSC) region of the SEZ. (B) Location of the LN and NT containing GRNs of the right hemisphere in the FAFB dataset (Z slice 3320, scale bar = 100 µM). (C) Cross-section of the labial nerve with traced GRNs indicated by asterisks (Z slice 3320, scale bar = 5 µM). (D) Neural tract with traced GRNs indicated by asterisks (Z slice 2770, scale bar = 5 µM). (E) Examples of reconstructed GRNs with presynaptic (red) and postsynaptic (blue) sites, scale bar = 50 µM. (F–I) Frontal and sagittal views of all reconstructed GRN axons (F), all presynaptic (red) and postsynaptic (blue) sites (G), presynaptic sites alone (H), and postsynaptic sites alone (I) Scale bar = 50 µM.
Figure 1—figure supplement 1
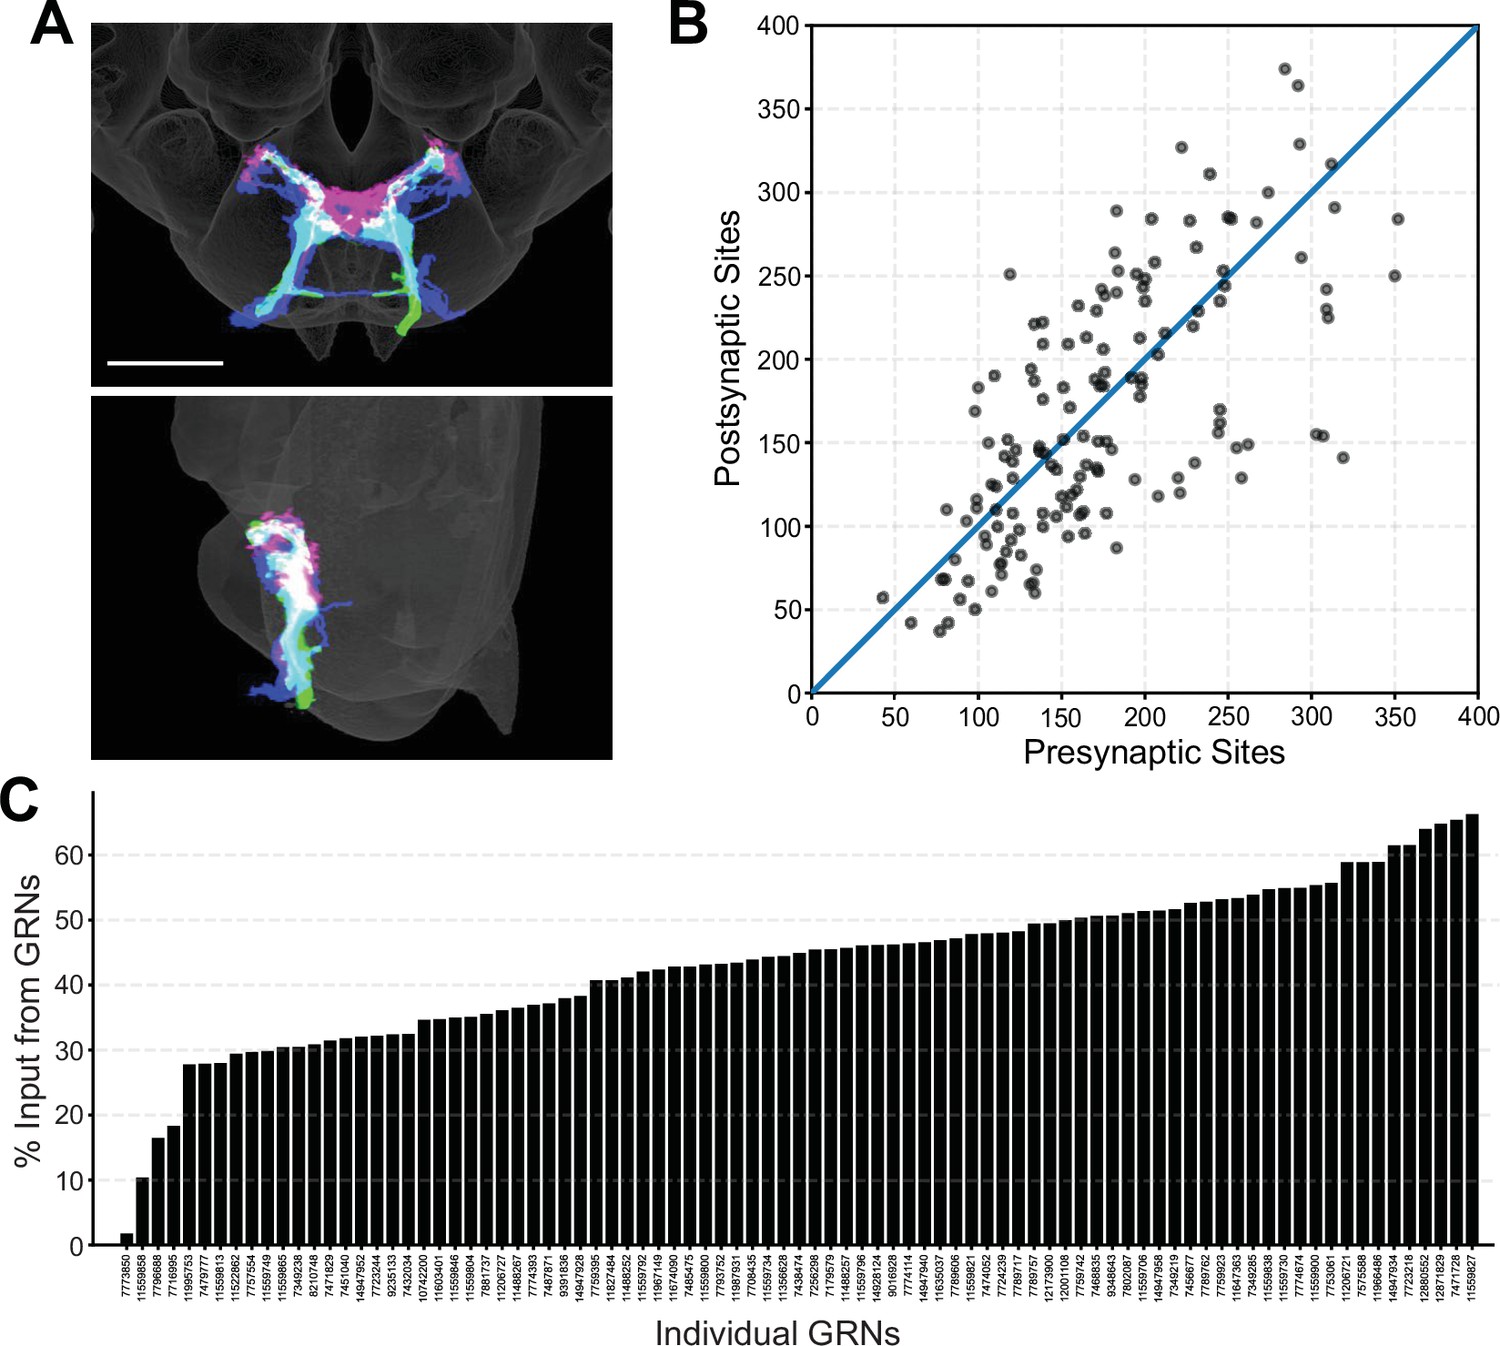
Morphology and connectivity of reconstructed gustatory receptor neuron (GRN) skeletons.
(A) Overlap of reconstructed GRNs (dark blue) with the projection patterns of bitter (magenta) and sugar (green) GRNs in the 2018U template brain, frontal view (top) and sagittal view (bottom), scale bar = 50 µM. (B) Plot of pre- and postsynaptic sites for individual GRNs of the right hemisphere, denoted by gray circles. Diagonal line indicates one-to-one relationship of pre- and postsynaptic sites. (C) Percentage of GRN inputs to each GRN, for GRNs of the right hemisphere.
Figure 2 with 1 supplement
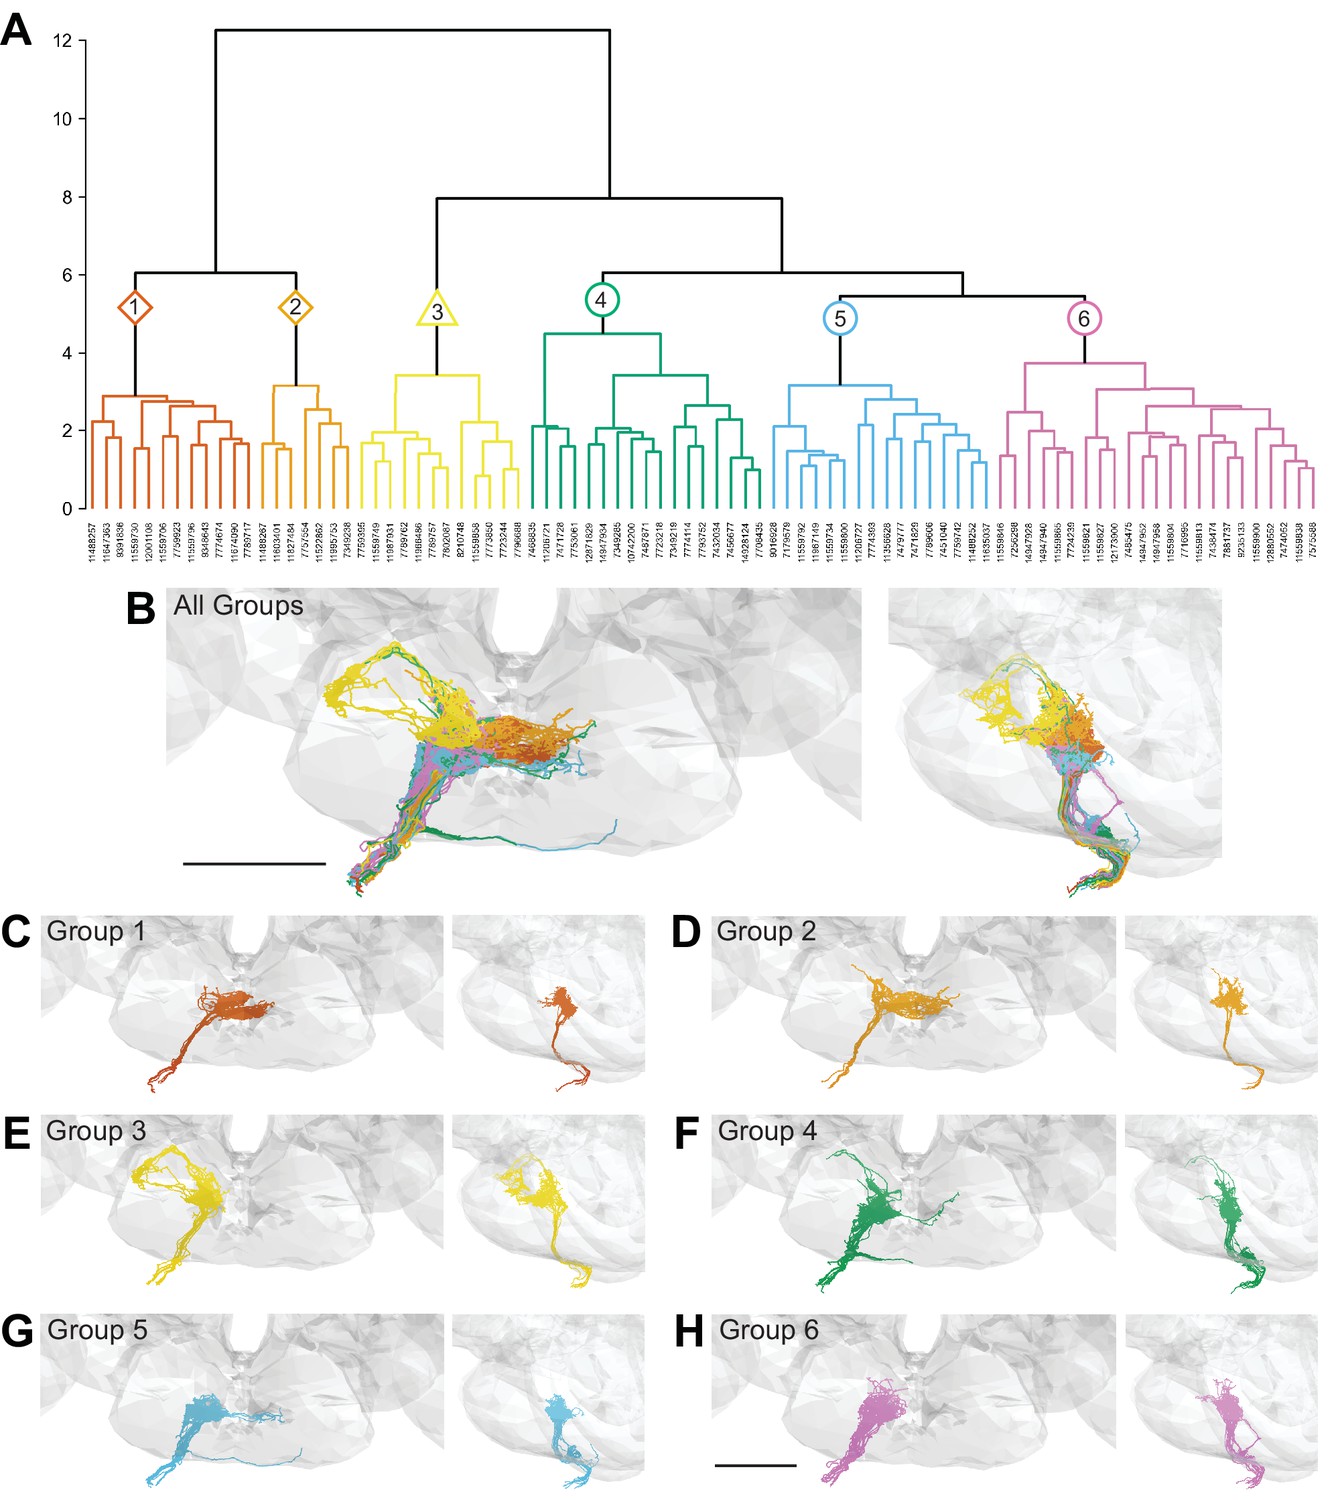
Morphology- and connectivity-based clustering generates distinct groups of gustatory receptor neurons (GRNs).
(A) Tree denoting relative similarity of GRNs based on morphology and connectivity of GRNs in the right hemisphere. (B) Frontal and sagittal views of all GRN groups, colored according to (A). (C–H) Frontal and sagittal views of group 1–6 GRNs, scale bar = 50 µM.
Figure 2—figure supplement 1

Ward’s joining cost and the differential of Ward’s joining cost for hierarchical clustering of gustatory receptor neurons (GRNs) in the right hemisphere.
(Top) Ward’s joining cost for clustering into groups. Ward’s joining cost declines sharply when clustering with six groups compared to clustering with fewer than six groups. (Bottom) Differential of Ward’s joining cost for clustering into groups. The differential is high when clustering into five groups or fewer but does not decline notably after six groups are reached.
Figure 3 with 2 supplements
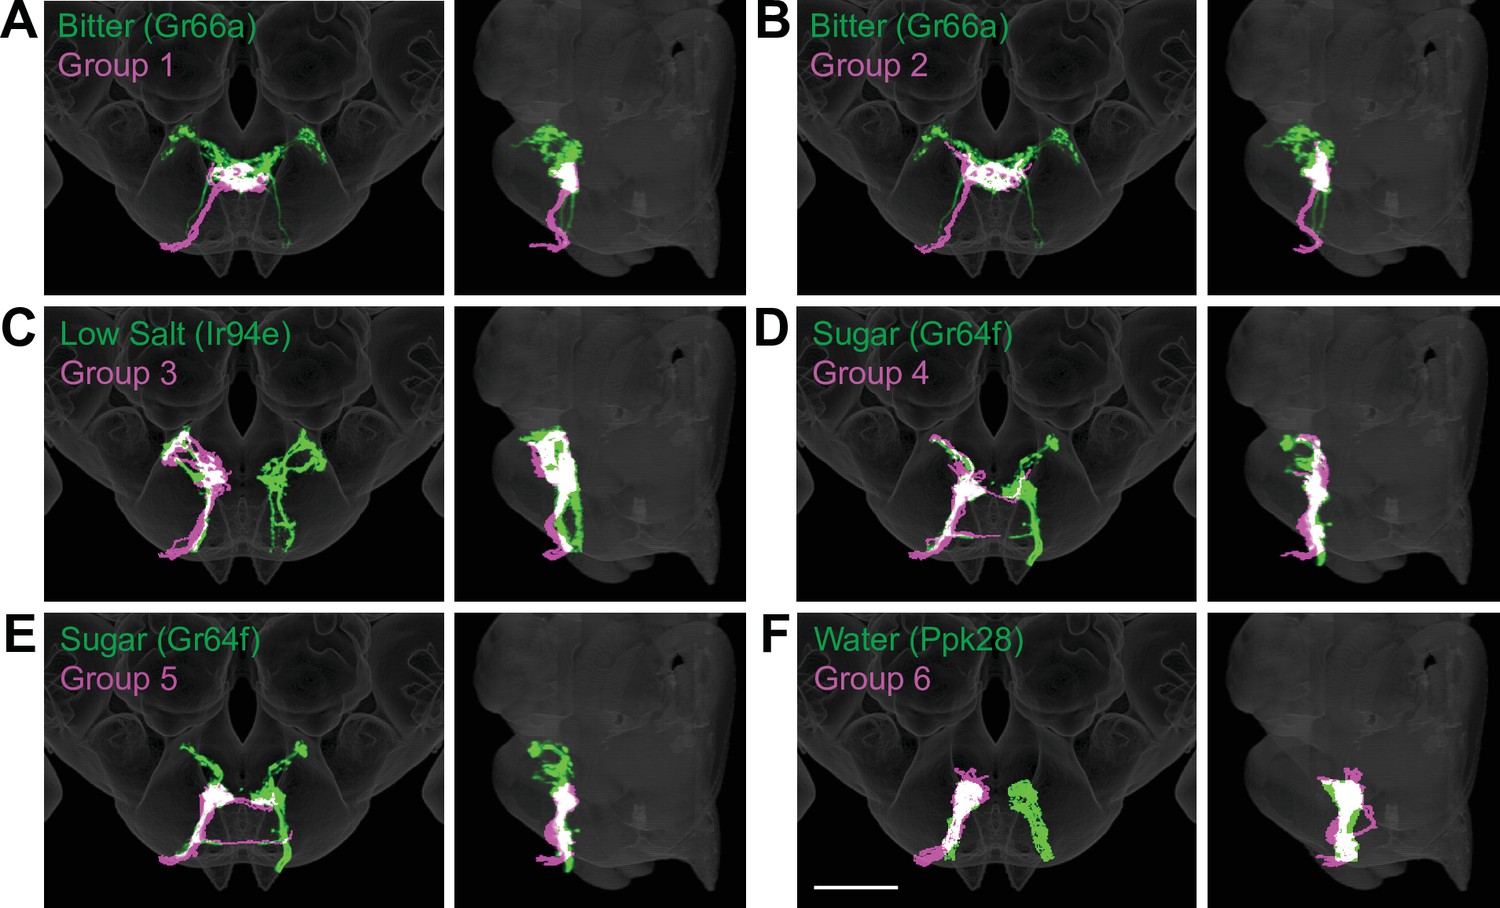
Anatomy of different gustatory receptor neuron (GRN) groups overlays with GRNs of different taste categories.
NBLAST comparisons yielded best matches of electron microscopy (EM) groups and GRNs of different taste classes. (A–F) Overlain are EM groups 1–6 (magenta) and best NBLAST match of GRN class (immunohistochemistry, green), frontal view (left), and sagittal view (right), scale bar = 50 µM.
Figure 3—figure supplement 1
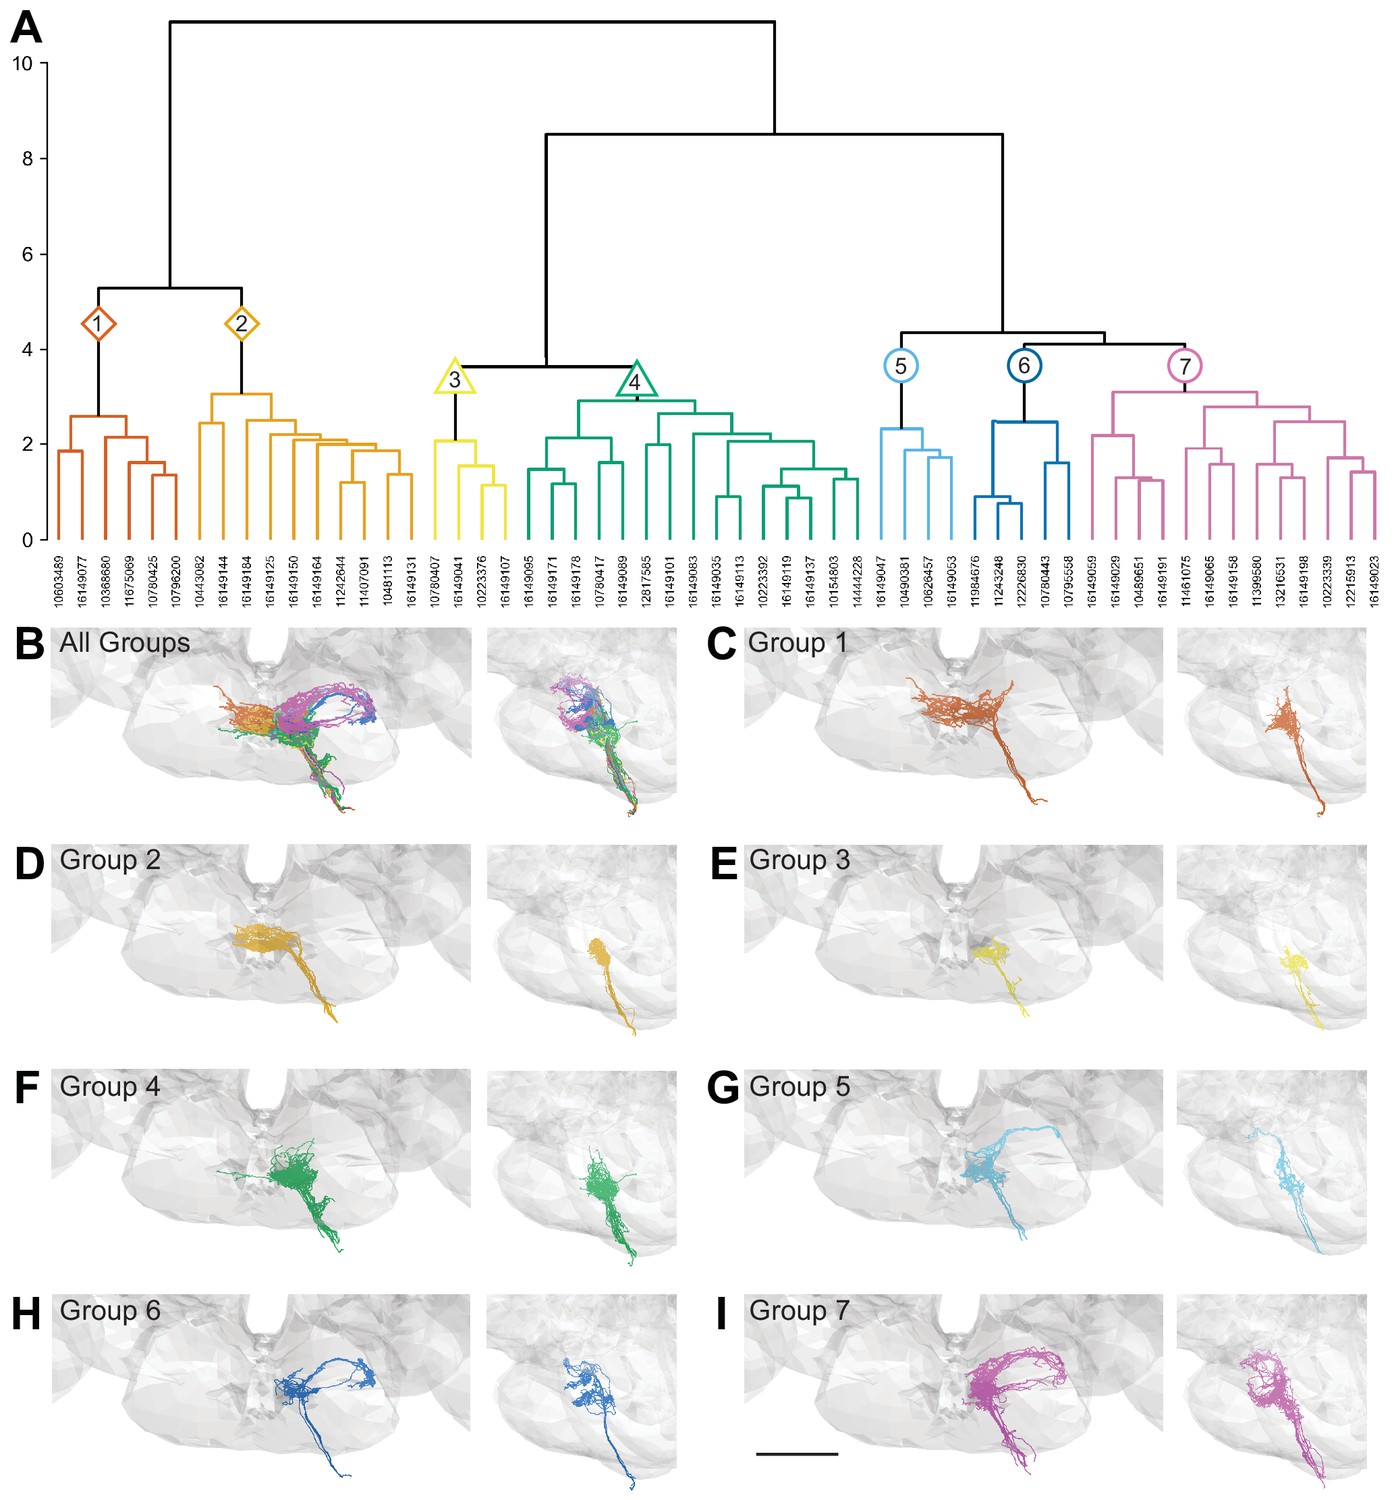
Morphology- and connectivity-based clustering generates distinct groups of gustatory receptor neurons (GRNs).
(A) Tree denoting relative similarity of GRNs based on morphology and connectivity of GRNs in the left hemisphere. (B) Frontal and sagittal views of all GRN groups, colored according to (A). (C–I) Frontal and sagittal views of group 1–7 GRNs, scale bar = 50 µM.
Figure 3—figure supplement 2
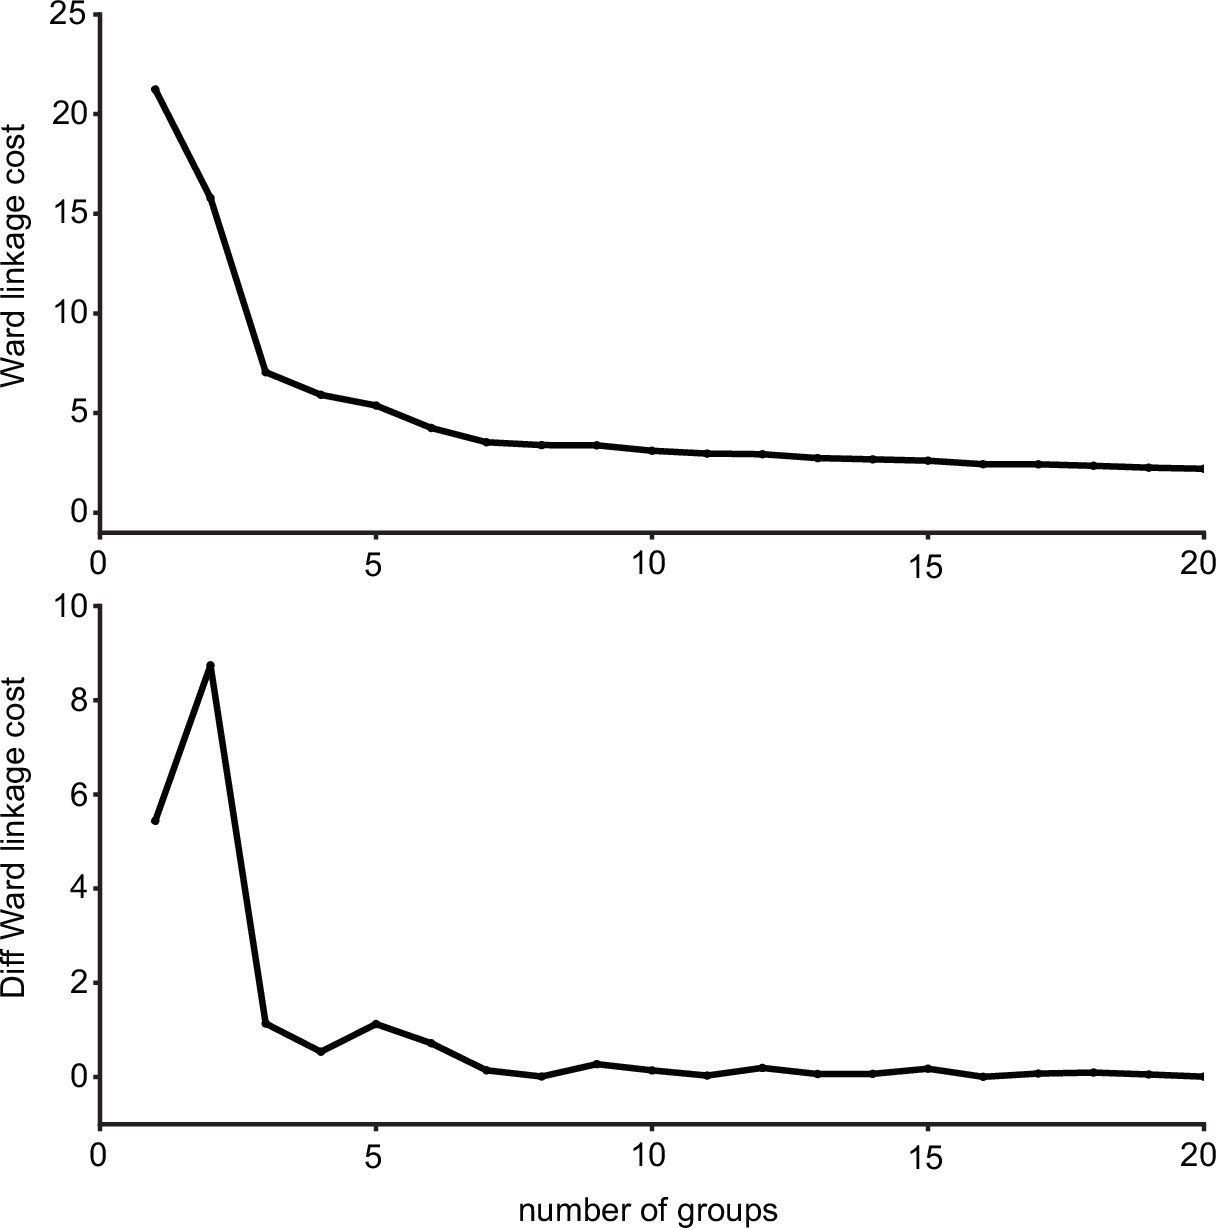
Ward’s joining cost and the differential of Ward’s joining cost for hierarchical clustering of gustatory receptor neurons (GRNs) in the left hemisphere.
(Top) Ward’s joining cost for clustering into groups. Ward’s joining cost declines sharply when clustering with seven groups compared to clustering with fewer than seven groups. (Bottom) Differential of Ward’s joining cost for clustering into groups. The differential is high when clustering into six groups or fewer but does not decline notably after seven groups are reached.
Figure 4 with 2 supplements

Gustatory receptor neurons (GRNs) are highly interconnected via chemical synapses.
(A) Connectivity matrix of GRNs in the right hemisphere. GRN groups are color-coded and ordered according to Figure 2, with number of GRNs/group in parentheses. Color coding within the matrix indicates the number of synapses from the pre- to the postsynaptic neuron, indicated in the legend. (B) Connectivity between GRN groups. Colors correspond to groups in Figure 2. Arrow thickness scales with the number of synapses, indicated in red. (C) Connectivity between GRN groups as in (B), showing only connections of five or more synapses. Group # and corresponding taste category are noted on the right.
Figure 4—figure supplement 1
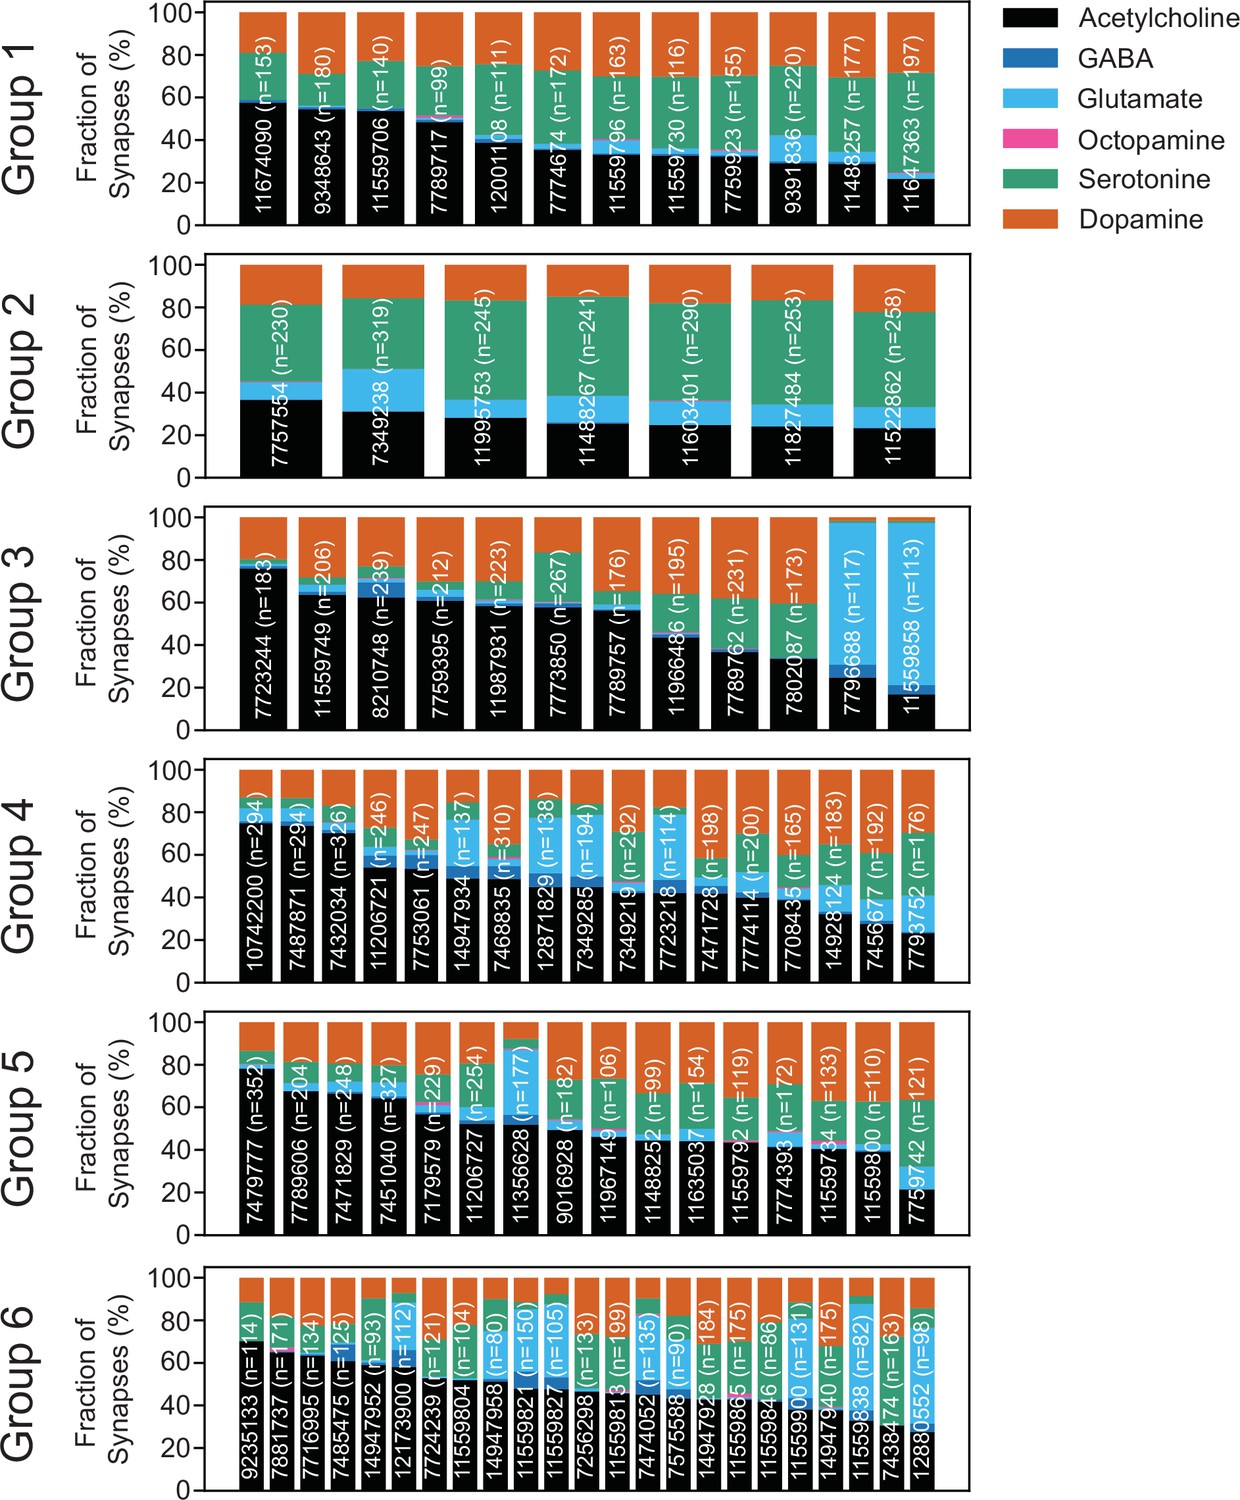
Predicted neurotransmitters expressed by gustatory receptor neurons (GRNs) of the right hemisphere.
Neurotransmitter predictions for each neuron (groups in Figure 2). The fraction of synapses predicted to contain each neurotransmitter is indicated by color.
Figure 4—figure supplement 2
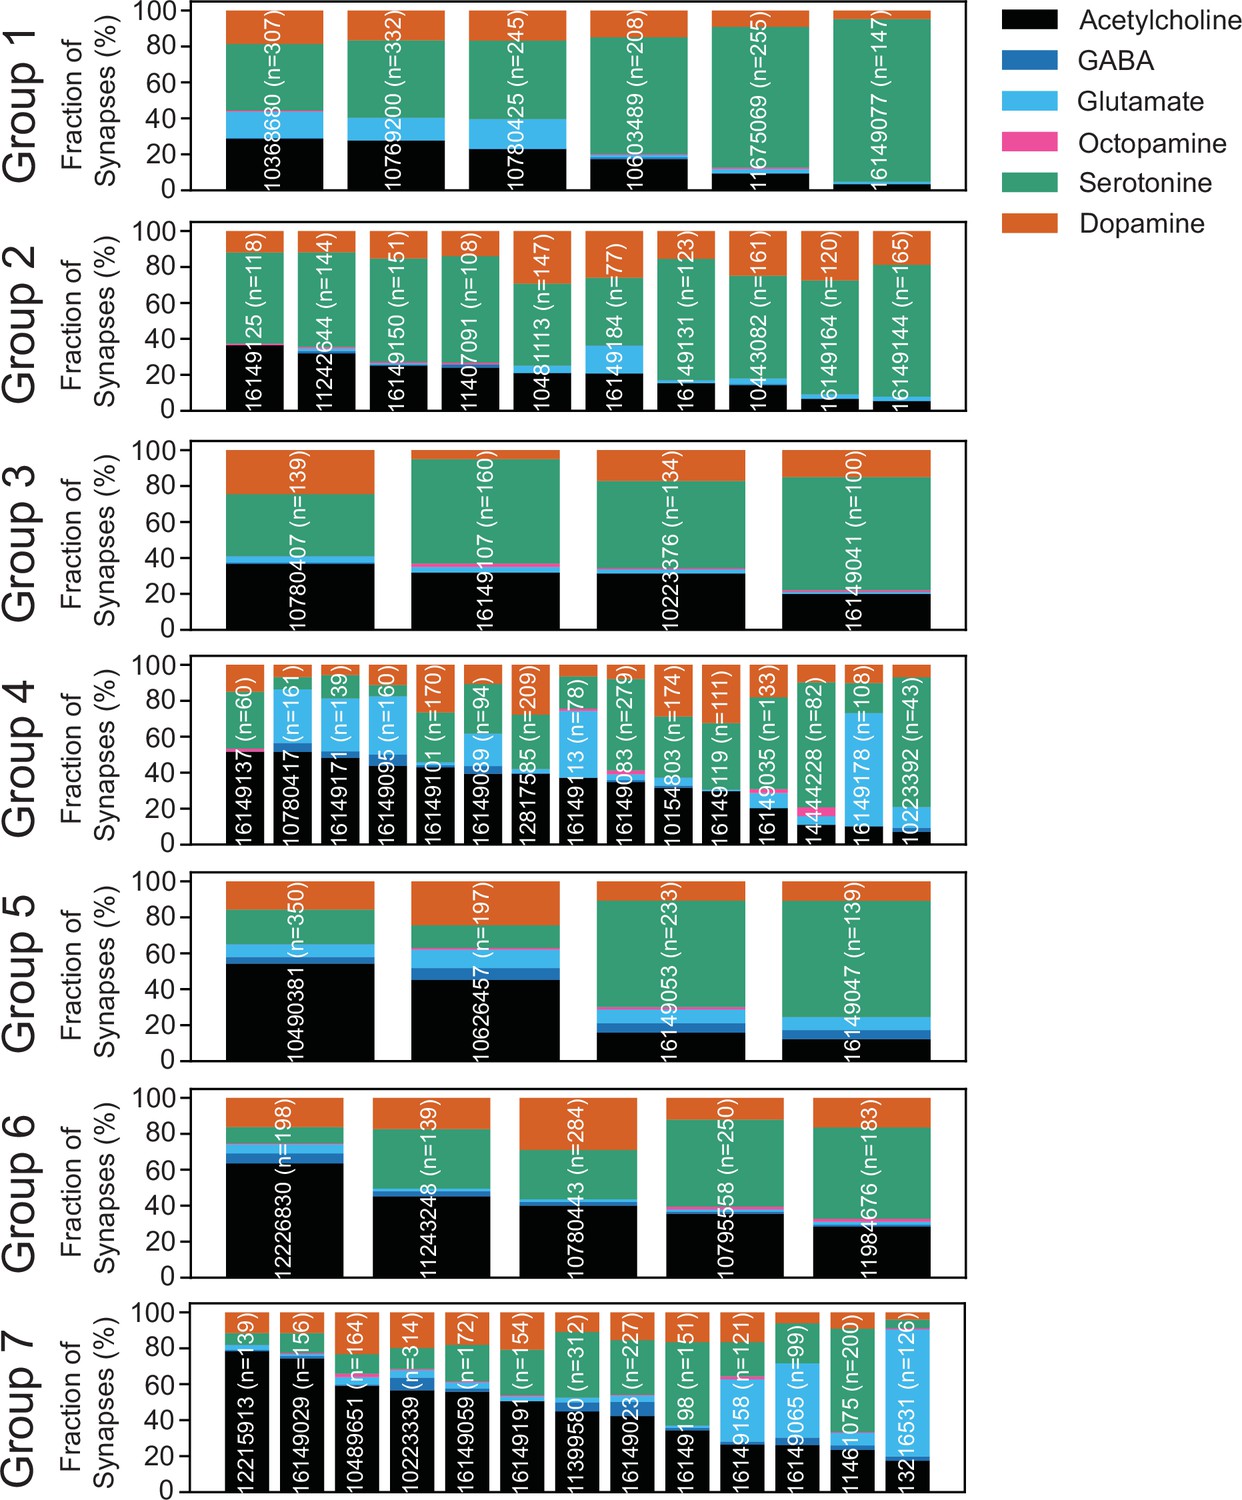
Predicted neurotransmitters expressed by gustatory receptor neurons (GRNs) of the left hemisphere.
Neurotransmitter predictions for each neuron (groups in Figure 3—figure supplement 1). The fraction of synapses predicted to contain each neurotransmitter is indicated by color.
Figure 5 with 7 supplements

Sugar and water gustatory receptor neurons (GRNs) do not activate each other.
(A, B) Calcium responses of sugar GRNs expressing P2X2 and GCaMP6s to proboscis presentation of PEG as a negative control, ATP to activate P2X2, or sucrose as a positive control. GCaMP6s fluorescence traces (ΔF/F) (A) and maximum ΔF/F post-stimulus presentation (B), n = 5. Sugar GRNs responded to ATP, but the response to subsequent sucrose presentation was attenuated. (C, D) GCaMP6s responses of sugar GRNs in flies expressing P2X2 in water GRNs to PEG, ATP, and sucrose delivery, ΔF/F traces (C), and maximum ΔF/F graph (D), n = 11. (E, F) ArcLight responses of sugar GRNs in flies expressing P2X2 in water GRNs, ΔF/F traces (E), and maximum ΔF/F graph (F), n = 6. (G, H) Calcium responses of water GRNs expressing P2X2 and GCaMP6s to proboscis delivery of PEG (negative control), ATP, and water (positive control), ΔF/F traces (G), and maximum ΔF/F graph (H), n = 5. Water GRNs responded to ATP presentation, but the subsequent response to water was diminished. (I, J) GCaMP6s responses of water GRNs in flies expressing P2X2 in sugar GRNs to PEG, ATP, and water, ΔF/F traces (I), and maximum ΔF/F graph (J), n = 6. (K, L) ArcLight responses of water GRNs in flies expressing P2X2 in sugar GRNs to PEG, ATP, and water, ΔF/F traces (K), and maximum ΔF/F graph (L), n = 9. For all traces, stimulus presentation is indicated by shaded bars. Traces of individual flies to the first of three taste stimulations (shown in Figure 5—figure supplement 2, Figure 5—figure supplement 3, and Figure 5—figure supplement 7) are shown in gray, the average in black, with the SEM indicated by the gray shaded area. Repeated-measures ANOVA with Tukey’s multiple-comparisons test, *p<0.05, **p<0.01, ***p<0.001.
Figure 5—figure supplement 1
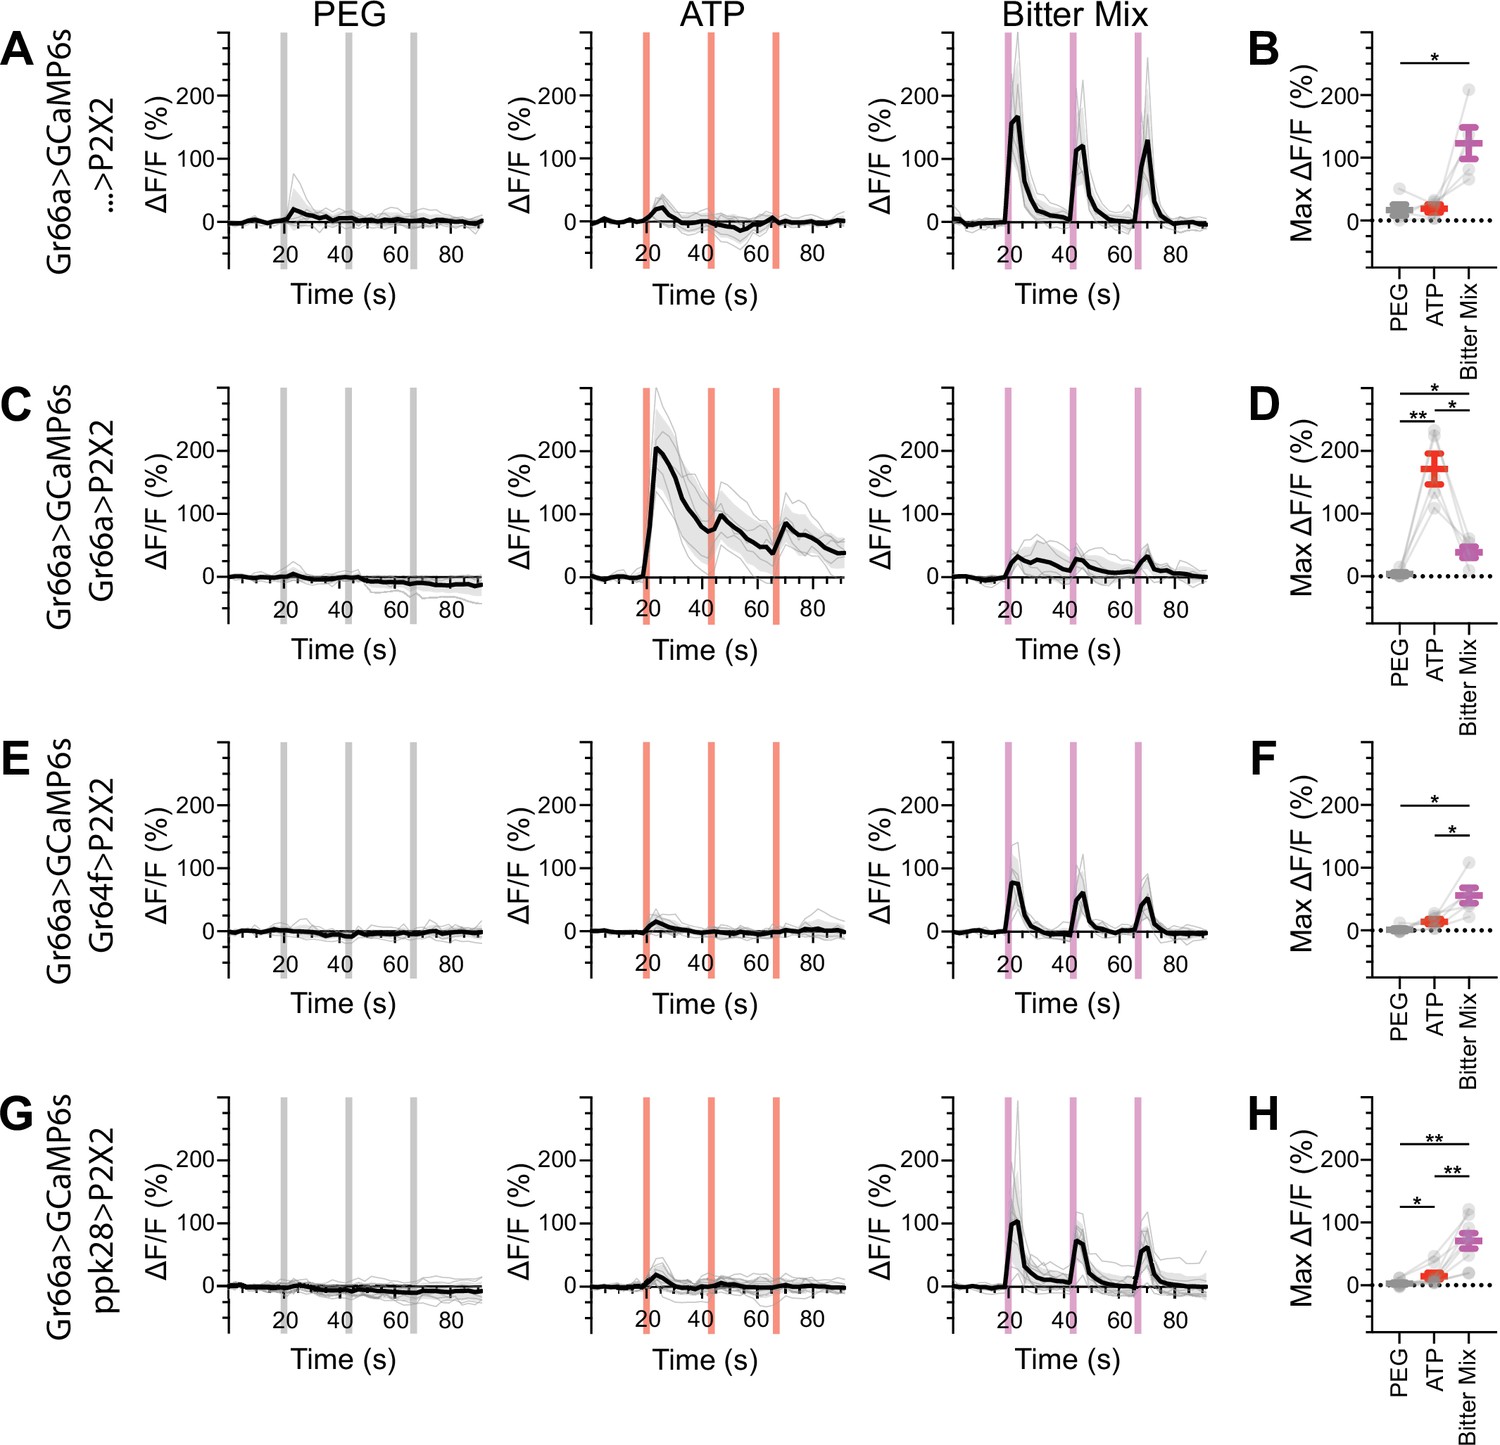
Bitter gustatory receptor neurons (GRNs) do not respond to the activation of other GRN classes in fed flies.
(A, B) Calcium responses of bitter GRNs expressing GCaMP6s in a UAS-P2X2 background to proboscis presentation of PEG as a negative control, ATP, or a mixture of denatonium and caffeine, which are bitter compounds, as a positive control, GCaMP6s ΔF/F traces (A), and maximum ΔF/F graph (B), n = 5. (C, D) Calcium responses of bitter GRNs expressing GCaMP6s and P2X2 to PEG, ATP, or bitter delivery, ΔF/F traces (C), and maximum ΔF/F graph (D), n = 5. (E, F) GCaMP6s responses of bitter GRNs in flies expressing P2X2 in sugar GRNs to PEG, ATP, and bitter, ΔF/F traces (E), and maximum ΔF/F graph (F), n = 6. (G, H) GCaMP6s responses of bitter GRNs in flies expressing P2X2 in water GRNs to delivery of PEG, ATP, or bitter to the proboscis, ΔF/F traces (G), and maximum ΔF/F graph (H), n = 9. Period of stimulus presentation is indicated by shaded bars, three stimulations/fly. Traces of individual flies are shown in gray, the average in black, with the SEM indicated by the gray shaded area. Repeated-measures ANOVA with Tukey’s multiple-comparisons test, *p<0.05, **p<0.01.
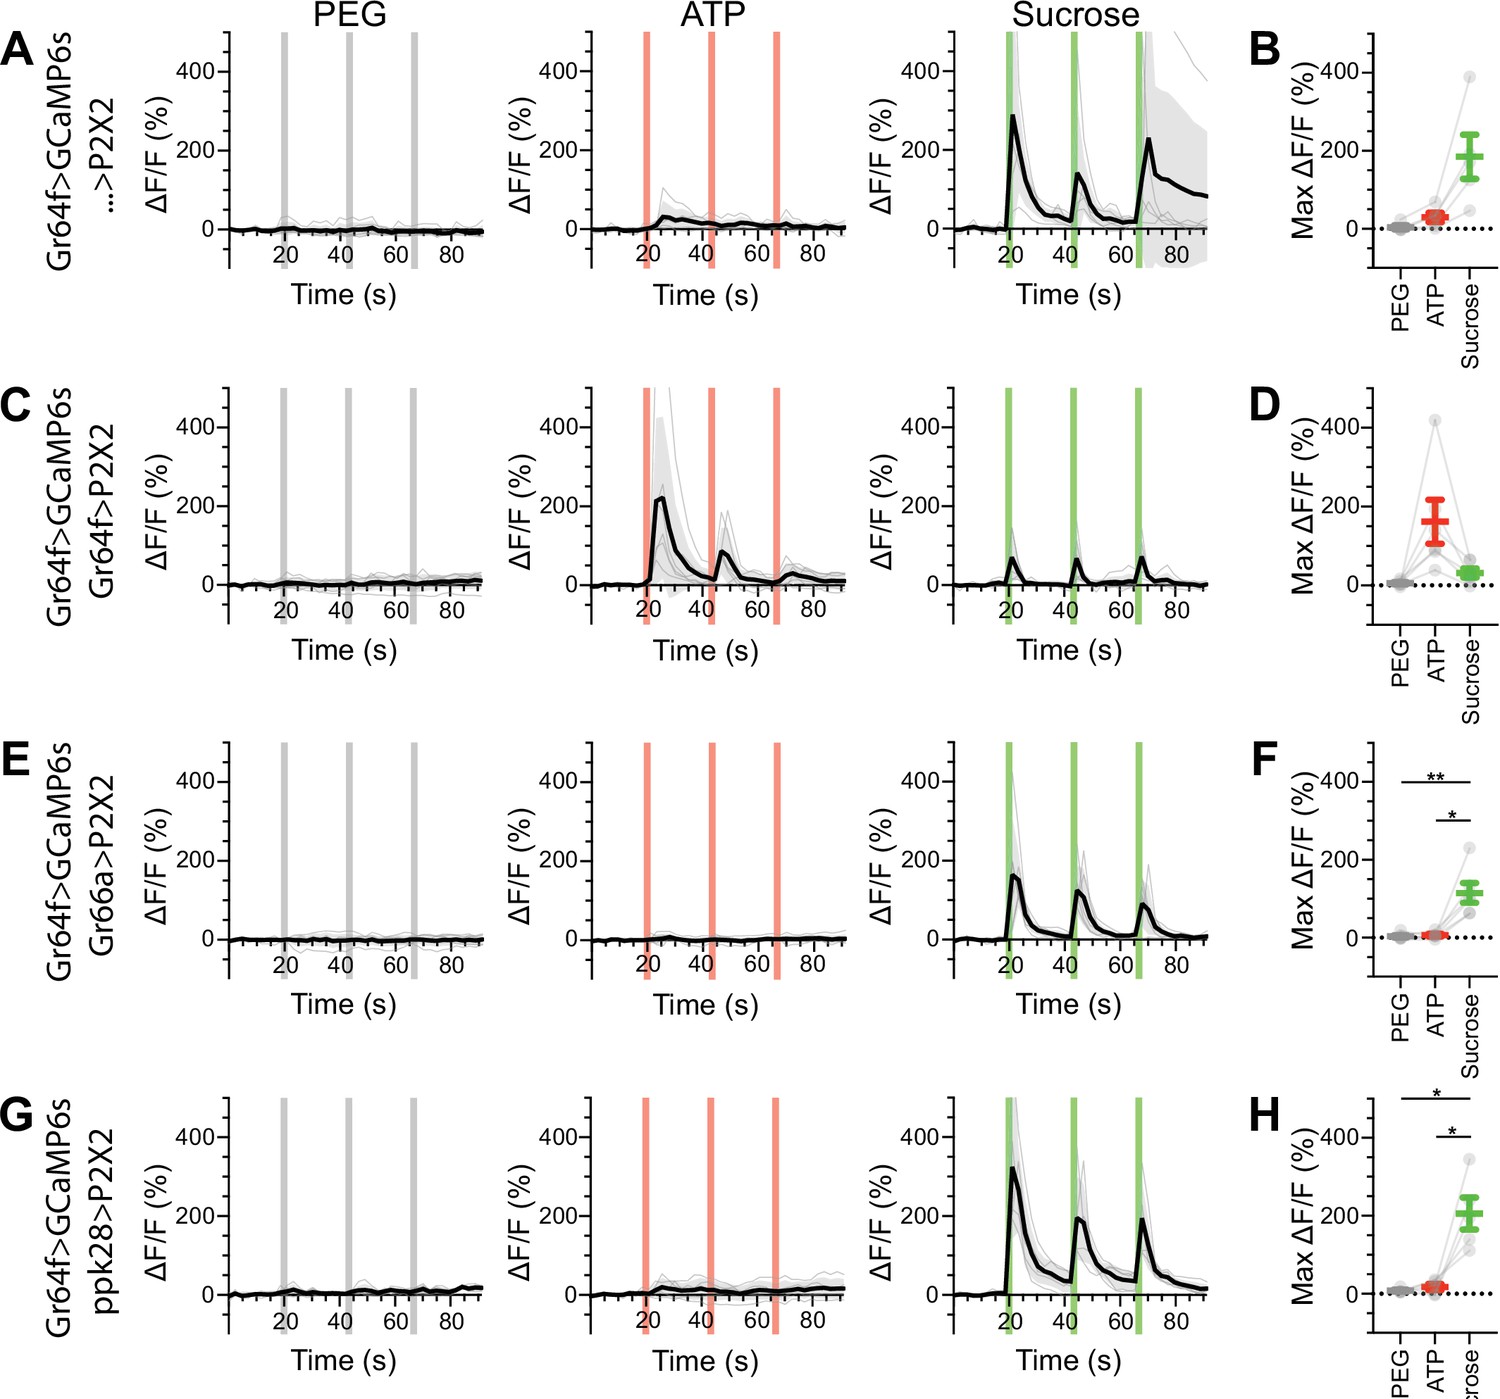
Figure 5—figure supplement 2
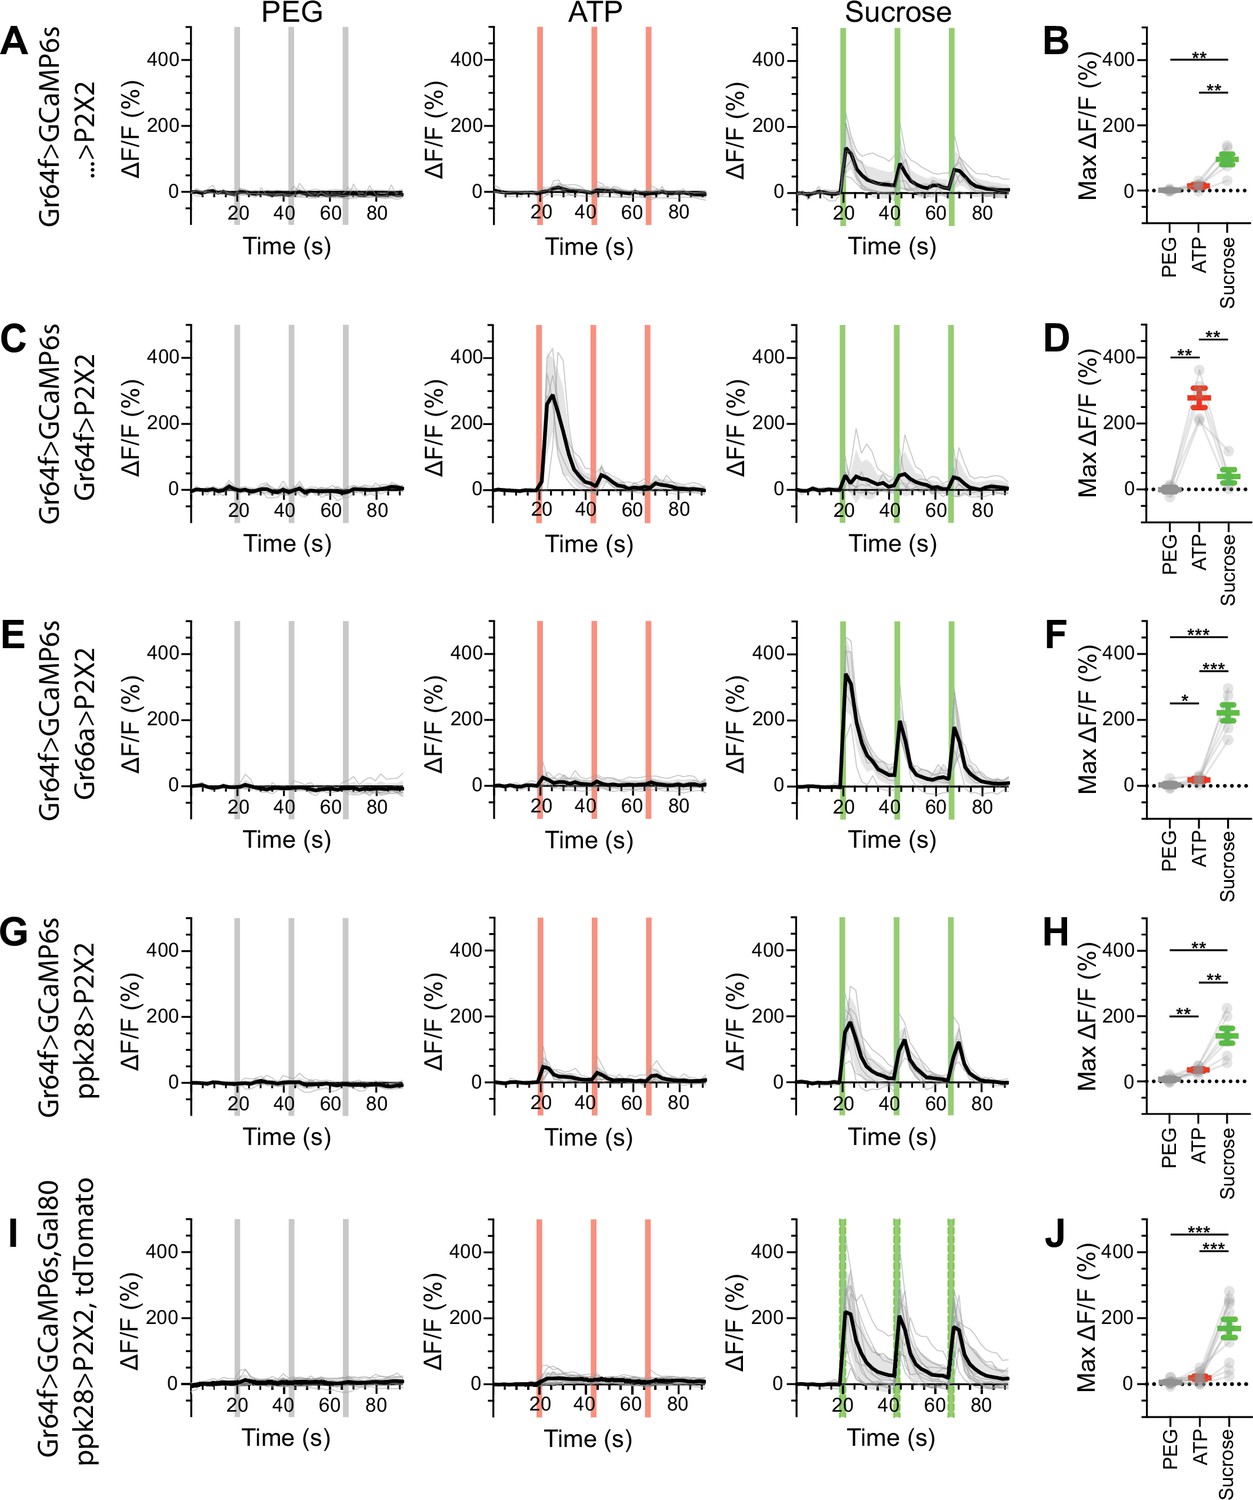
Sugar gustatory receptor neurons (GRNs) do not respond to the activation of other GRN classes in fed flies.
(A, B) Calcium responses of sugar GRNs expressing GCaMP6s in a UAS-P2X2 background to proboscis presentation of PEG as a negative control, ATP, or sucrose as a positive control, GCaMP6s ΔF/F traces (A), and maximum ΔF/F graph (B), n = 6. (C, D) Calcium responses of sugar GRNs expressing GCaMP6s and P2X2 to PEG, ATP, or sucrose delivery, ΔF/F traces (C), and maximum ΔF/F graph (D), n = 5. (E, F) GCaMP6s responses of sugar GRNs in flies expressing P2X2 in bitter GRNs to PEG, ATP, and sucrose, ΔF/F traces (E), and maximum ΔF/F graph (F), n = 6. (G, H) GCaMP6s responses of sugar GRNs in flies expressing P2X2 in water GRNs to PEG, ATP, or sucrose presentation, ΔF/F traces (G), and maximum ΔF/F graph (H), n = 7. (I, J) GCaMP6s responses of sugar GRNs in flies expressing P2X2 in water GRNs and Gal80 in sugar GRNs to inhibit P2X2 misexpression to PEG, ATP, or sucrose presentation, ΔF/F traces (I), and maximum ΔF/F plots (J), n = 11. Period of stimulus presentation is indicated by shaded bars, three stimulations/fly. Data from first stimulation of (C) and (K) is shown in Figure 4A–D. Traces of individual flies are shown in gray, the average in black, with the SEM indicated by the gray shaded area. Repeated-measures ANOVA with Tukey’s multiple-comparisons test, *p<0.05, **p<0.01, ***p<0.001.
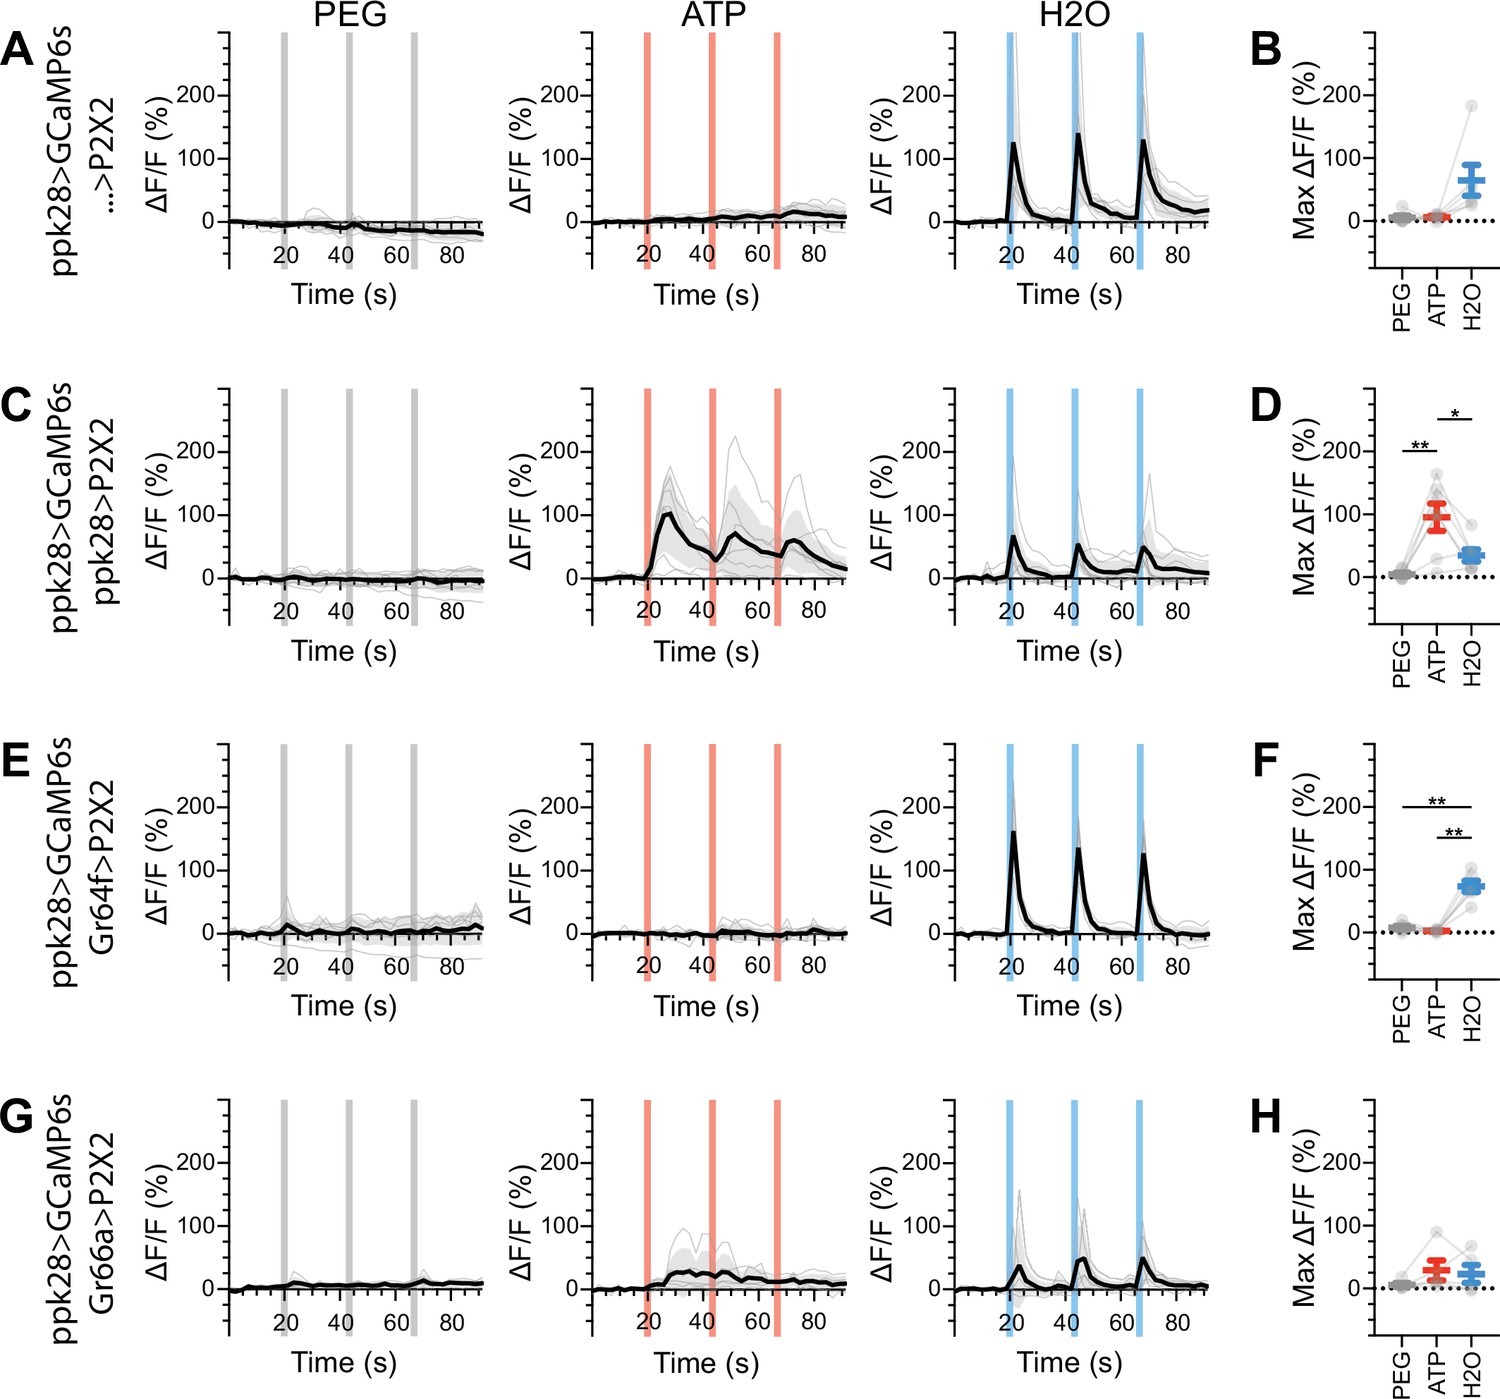
Figure 5—figure supplement 3
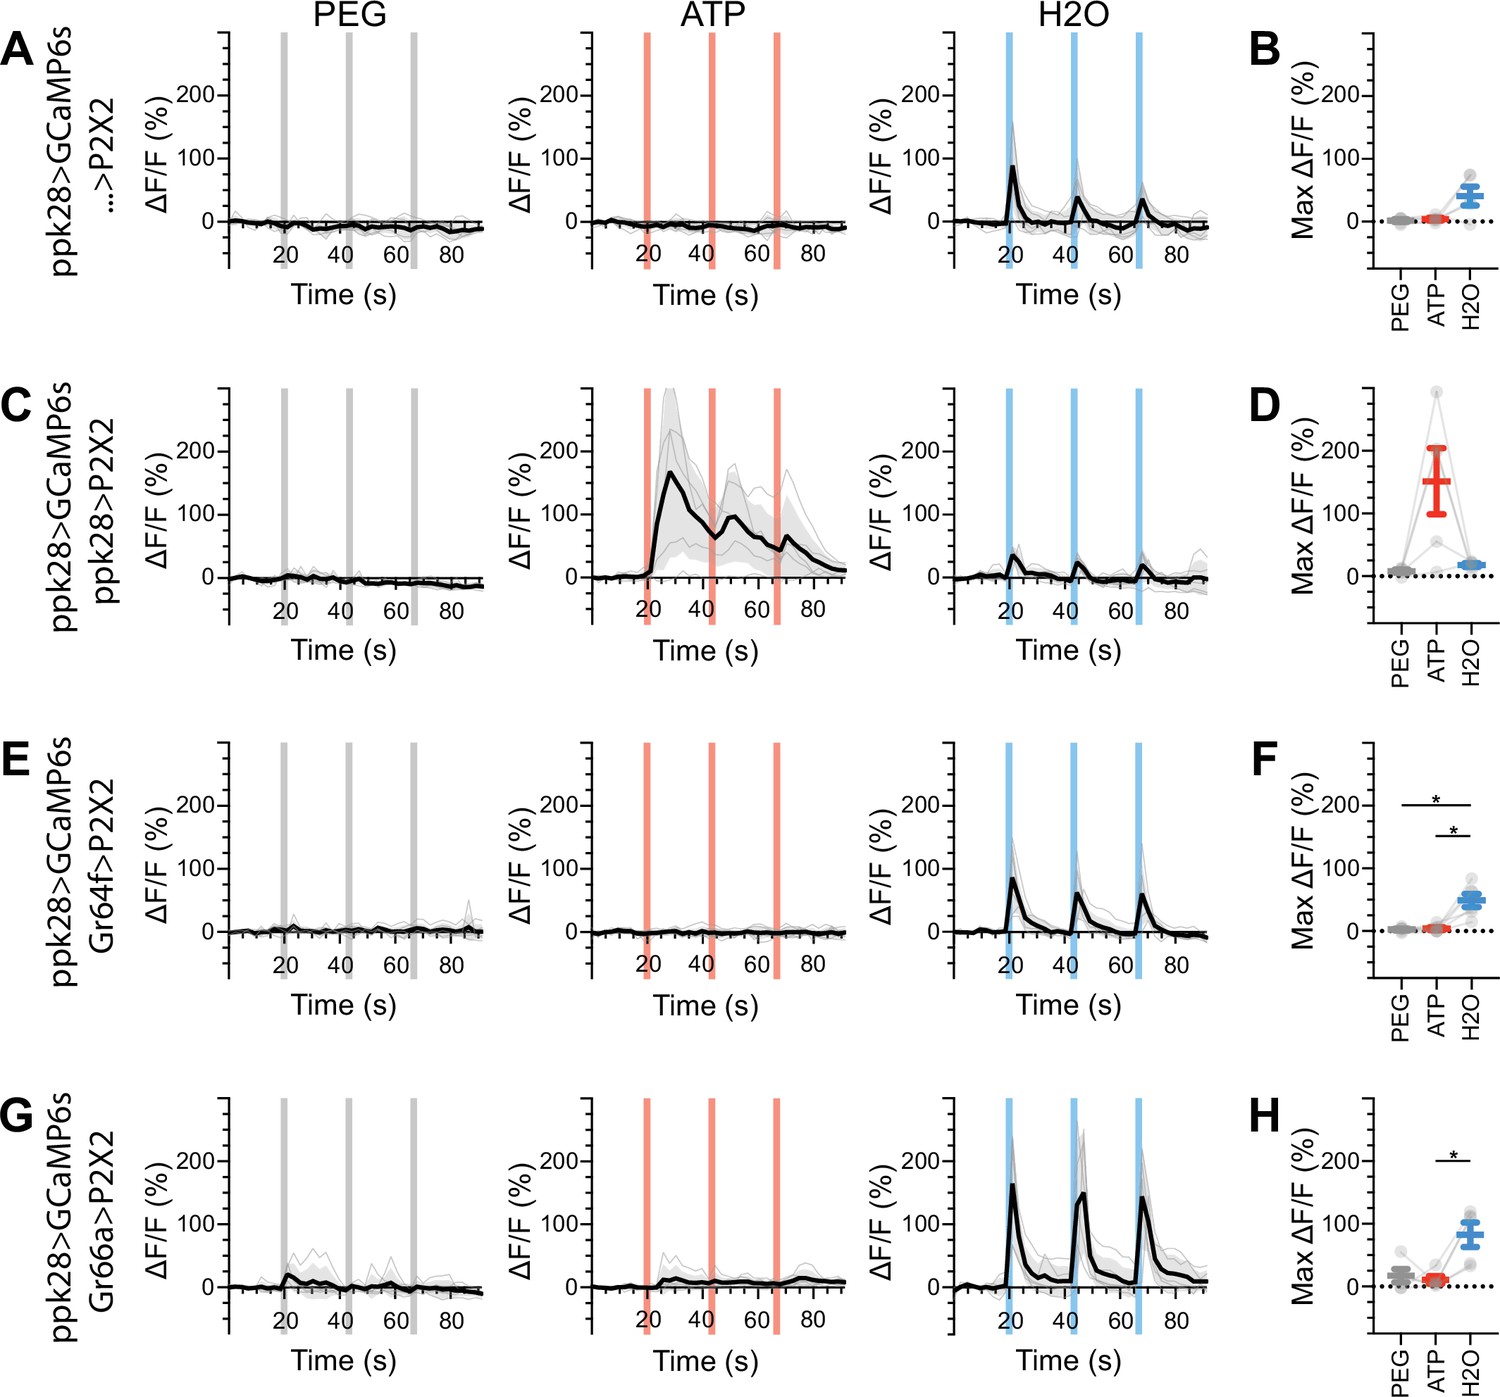
Water gustatory receptor neurons (GRNs) do not respond to the activation of other GRN classes in fed flies.
(A, B) Calcium responses of water GRNs expressing GCaMP6s in a UAS-P2X2 background to proboscis presentation of PEG as a negative control, ATP, or water as a positive control, GCaMP6s ΔF/F traces (A), and maximum ΔF/F graph (B), n = 5. (C, D) Calcium responses of water GRNs expressing GCaMP6s and P2X2 to PEG, ATP, or water delivery, ΔF/F traces (C), and maximum ΔF/F graph (D), n = 5. (E, F) GCaMP6s responses of water GRNs in flies expressing P2X2 in sugar GRNs to PEG, ATP, and water, ΔF/F traces (E), and maximum ΔF/F graph (F), n = 6. (G, H) GCaMP6s responses of water GRNs in flies expressing P2X2 in bitter GRNs upon PEG, ATP, or water presentation, ΔF/F traces (G), and maximum ΔF/F graph (H), n = 5. Period of stimulus presentation is indicated by shaded bars, three stimulations/fly. The first response in (C) and (E) is shown in Figure 4G–J. Traces of individual flies are shown in gray, the average in black, with the SEM indicated by the gray shaded area. Repeated-measures ANOVA with Tukey’s multiple-comparisons test, *p<0.05.
Figure 5—figure supplement 4
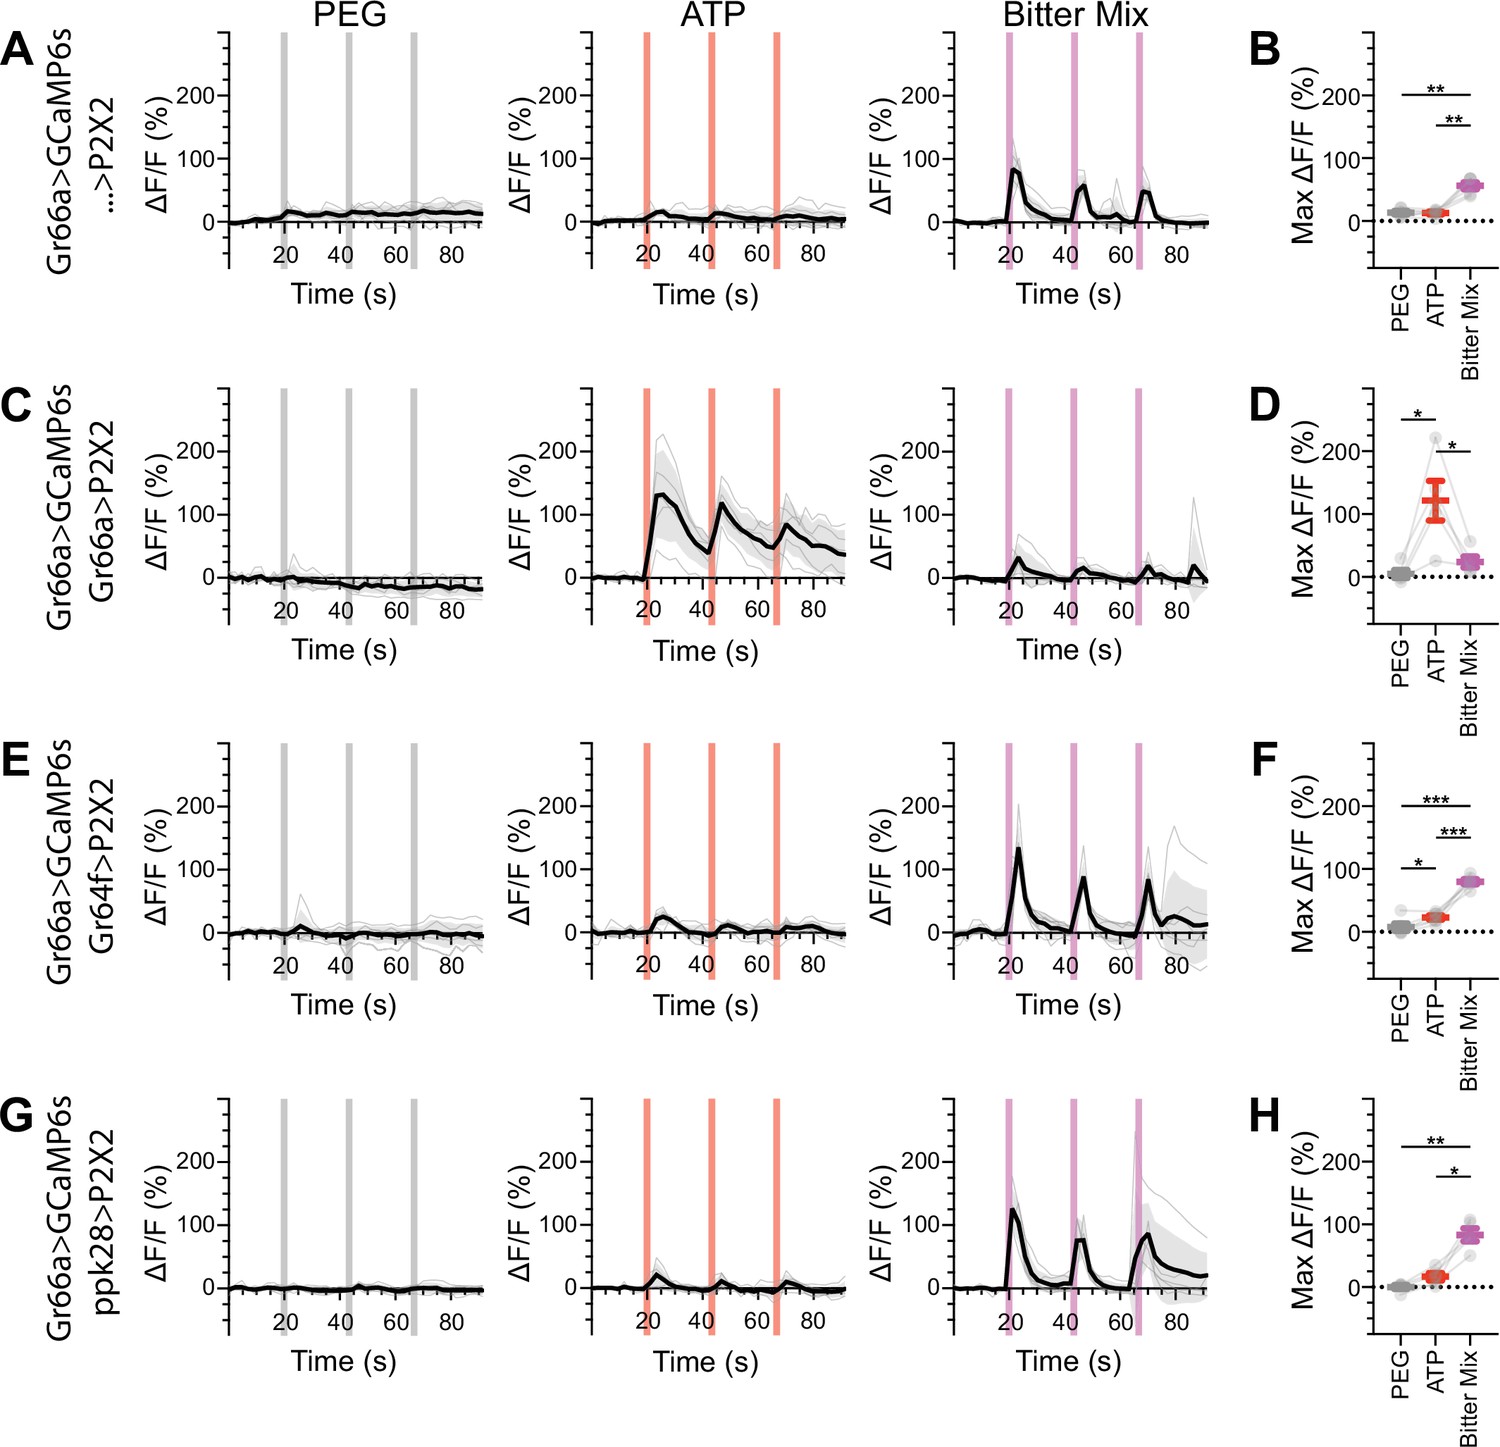
Bitter gustatory receptor neurons (GRNs) do not respond to the activation of other GRN classes in food-deprived flies.
(A, B) Calcium responses of bitter GRNs expressing GCaMP6s in a UAS-P2X2 background to proboscis presentation of PEG as a negative control, ATP, or a mixture of the bitter compounds denatonium and caffeine as a positive control, GCaMP6s ΔF/F traces (A), and maximum ΔF/F graph (B), n = 6. (C, D) Calcium responses of bitter GRNs expressing GCaMP6s and P2X2 to PEG, ATP, or bitter delivery, ΔF/F traces (C), and maximum ΔF/F graph (D), n = 5. (E, F) GCaMP6s responses of bitter GRNs in flies expressing P2X2 in sugar GRNs to PEG, ATP, and bitter, ΔF/F traces (E), and maximum ΔF/F graph (F), n = 6. (G, H) GCaMP6s responses of bitter GRNs in flies expressing P2X2 in water GRNs to delivery of PEG, ATP, or bitter, ΔF/F traces (G), and maximum ΔF/F graph (H), n = 5. Period of stimulus presentation is indicated by shaded bars, three stimulations/fly. Flies were food-deprived for 23–26 hr. Traces of individual flies are shown in gray, the average in black, with the SEM indicated by the gray shaded area. Repeated-measures ANOVA with Tukey’s multiple-comparisons test, *p<0.05, **p<0.01, ***p<0.001.
Figure 5—figure supplement 5
Sugar gustatory receptor neurons (GRNs) do not respond to the activation of other GRN classes in food-deprived flies.
(A, B) Calcium responses of sugar GRNs expressing GCaMP6s in a UAS-P2X2 background to proboscis presentation of PEG as a negative control, ATP, or sucrose as a positive control, GCaMP6s ΔF/F traces (A), and maximum ΔF/F graph (B), n = 5. (C, D) Calcium responses of sugar GRNs expressing GCaMP6s and P2X2 to PEG, ATP, or sucrose delivery, ΔF/F traces (C), and maximum ΔF/F graph (D), n = 6. (E, F) GCaMP6s responses of sugar GRNs in flies expressing P2X2 in bitter GRNs to PEG, ATP, and sucrose, ΔF/F traces (E), and maximum ΔF/F graph (F), n = 6. (G, H) GCaMP6s responses of sugar GRNs in flies expressing P2X2 in water GRNs to PEG, ATP, and sucrose presentation to the proboscis, ΔF/F traces (G), and maximum ΔF/F graph (H), n = 5. Period of stimulus presentation is indicated by shaded bars, three stimulations/fly. Flies were food-deprived for 23–26 hr. Traces of individual flies are shown in gray, the average in black, with the SEM indicated by the gray shaded area. Repeated-measures ANOVA with Tukey’s multiple-comparisons test, *p<0.05, **p<0.01.
Figure 5—figure supplement 6
Water gustatory receptor neurons (GRNs) do not respond to the activation of other GRN classes in food-deprived flies.
(A, B) Calcium responses of water GRNs expressing GCaMP6s in a UAS-P2X2 background to proboscis presentation of PEG as a negative control, ATP, or water as a positive control, GCaMP6s ΔF/F traces (A), and maximum ΔF/F graph (B), n = 6. (C, D) Calcium responses of water GRNs expressing GCaMP6s and P2X2 to PEG, ATP, or water delivery, ΔF/F traces (C), and maximum ΔF/F graph (D), n = 7. (E, F) GCaMP6s responses of water GRNs in flies expressing P2X2 in sugar GRNs to PEG, ATP, and water, ΔF/F traces (E), and maximum ΔF/F graph (F), n = 6. (G, H) GCaMP6s responses of water GRNs in flies expressing P2X2 in bitter GRNs to PEG, ATP, and water delivery, ΔF/F traces (G), and maximum ΔF/F graph (H), n = 5. Period of stimulus presentation is indicated by shaded bars, three stimulations/fly. Flies were food-deprived for 23–26 hr. Traces of individual flies are shown in gray, the average in black, with the SEM indicated by the gray shaded area. Repeated-measures ANOVA with Tukey’s multiple-comparisons test, *p<0.05, **p<0.01.
Figure 5—figure supplement 7
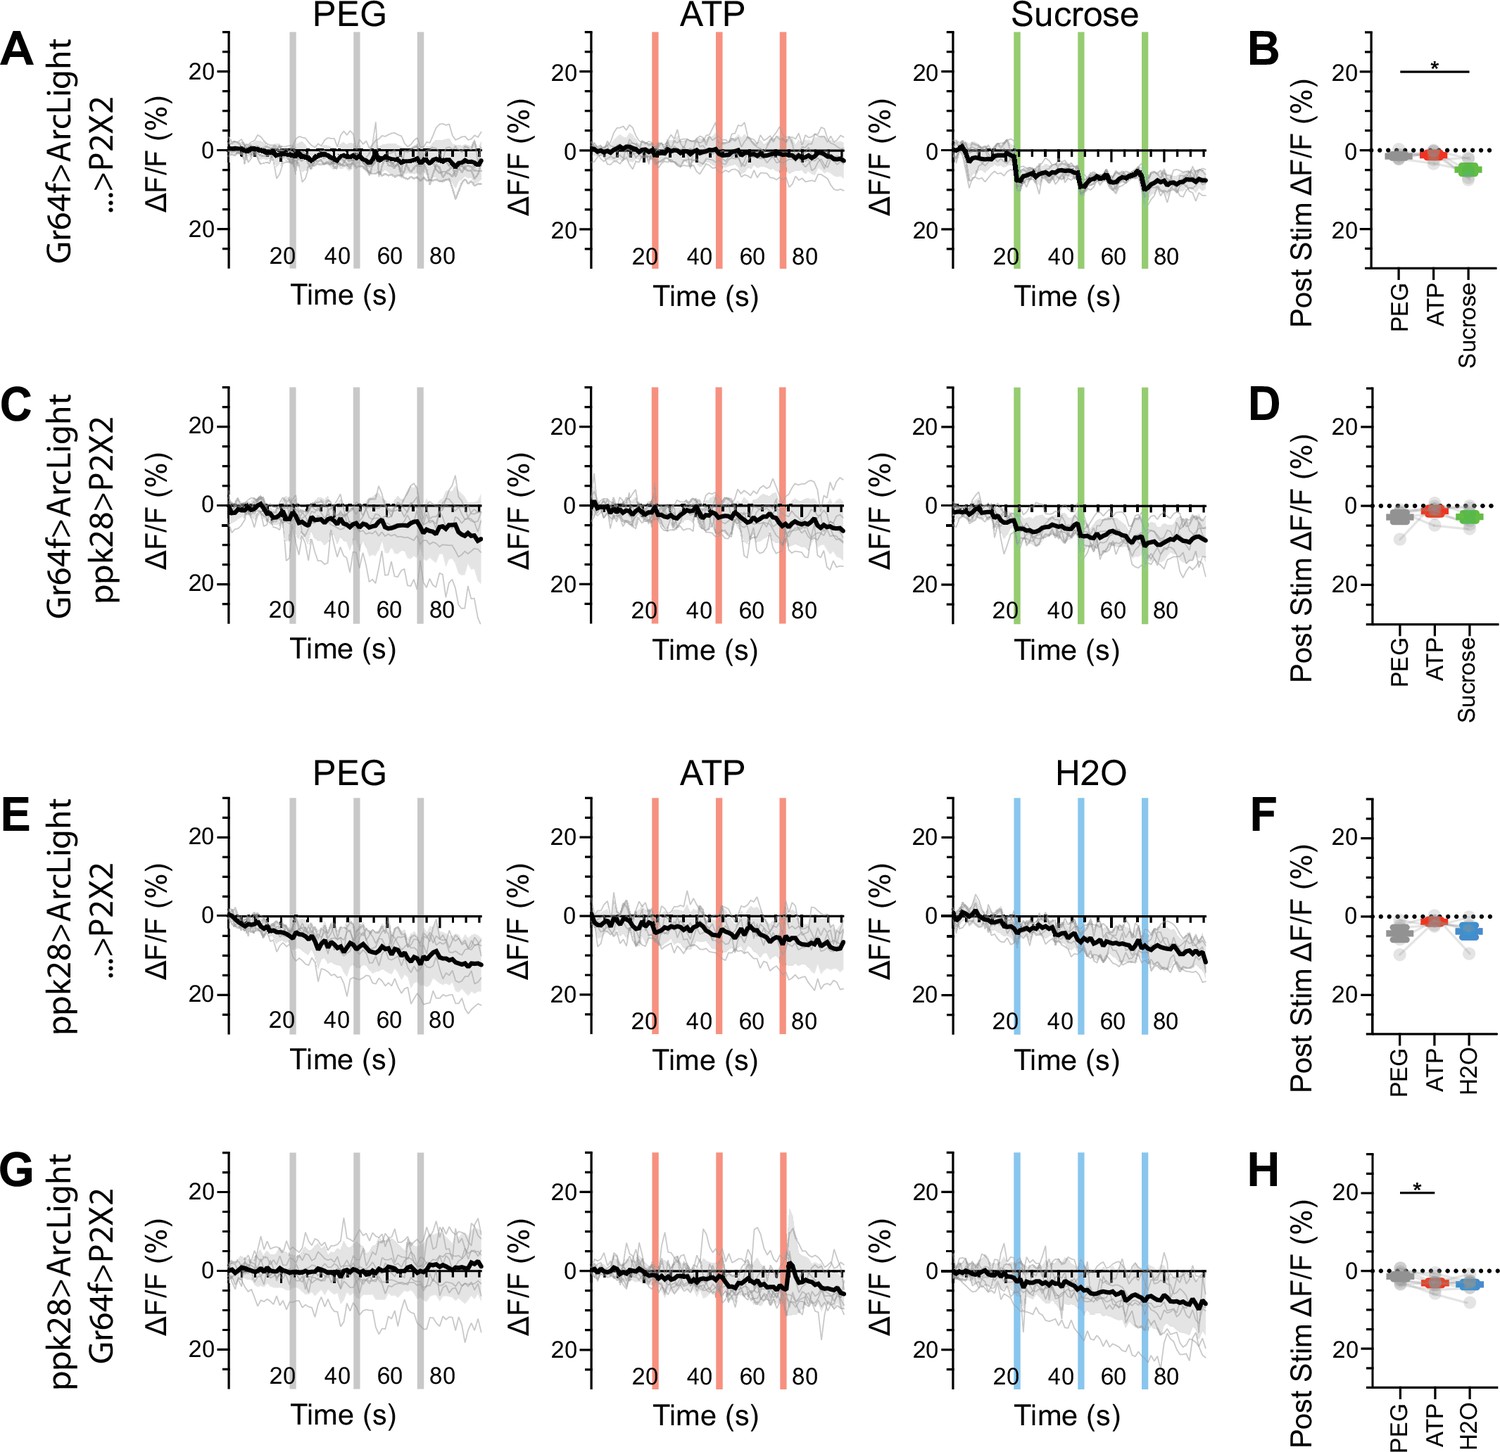
Sugar and water gustatory receptor neurons (GRNs) do not show voltage responses upon reciprocal activation.
(A, B) ArcLight responses of sugar GRNs in a UAS-P2X2 background to proboscis presentation of PEG as a negative control, ATP, or sucrose as a positive control. ArcLight fluorescence traces (ΔF/F) (A), and maximum ΔF/F post stimulus presentation (B), n = 6. (C, D) ArcLight responses of sugar GRNs in flies expressing P2X2 in water GRNs to PEG, ATP, and sucrose delivery, ΔF/F traces (C), and maximum ΔF/F graph (D), n = 6. (E, F) ArcLight responses of water GRNs in a UAS-P2X2 background to proboscis delivery of PEG, ATP, and water (positive control), ΔF/F traces (E), and maximum ΔF/F graph (F), n = 5. (G, H) ArcLight responses of water GRNs in flies expressing P2X2 in sugar GRNs to PEG, ATP, and water delivery, ΔF/F traces (G), and maximum ΔF/F graph (H), n = 9. Period of stimulus presentation is indicated by shaded bars, three stimulations/fly. The first response in (C) and (G) is shown in Figures 2—4. Traces of individual flies to three taste stimulations are shown in gray, the average in black, with the SEM indicated by the gray shaded area. Repeated-measures ANOVA with Tukey’s multiple-comparisons test, *P<0.05.
Tables
Key resources table
| Reagent type (species) or resource | Designation | Source or reference | Identifiers | Additional information |
|---|---|---|---|---|
| Genetic reagent (Drosophila melanogaster) | Gr64f-Gal4 (II) | Kwon et al., 2011 | BDSC:57669; FLYB:FBti0162679 | |
| Genetic reagent (D. melanogaster) | Gr64f-Gal4 (III) | Kwon et al., 2011 | BDSC:57668; FLYB: FBti0162678 | |
| Genetic reagent (D. melanogaster) | Gr64f-LexA (III) | Miyamoto et al., 2012 | ||
| Genetic reagent (D. melanogaster) | Gr66a-Gal4 (II) | Scott et al., 2001 | ||
| Genetic reagent (D. melanogaster) | Gr66a-LexA (III) | Thistle et al., 2012 | ||
| Genetic reagent (D. melanogaster) | Ppk28-Gal4 (II) | Cameron et al., 2010 | ||
| Genetic reagent (D. melanogaster) | Ppk28-LexA (III) | Thistle et al., 2012 | ||
| Genetic reagent (D. melanogaster) | Ir94e-Gal4 (attp2) | Croset et al., 2016 | BDSC:81246; FLYB:FBti0202323 | |
| Genetic reagent (D. melanogaster) | csChrimsonReporter/Optogenetic effector,20xUAS- csChrimson::mVenus in attP18 | Klapoetke et al., 2014 | BDSC:55134; FLYB:FBst0055134 | |
| Genetic reagent (D. melanogaster) | UAS-Syt-HA;; | Robinson et al., 2002 | ||
| Genetic reagent (D. melanogaster) | UAS-P2X2 (chr III) | Lima and Miesenböck, 2005 | BDSC:91222; FLYB:FBst0091222 | |
| Genetic reagent (D. melanogaster) | UAS-ArcLight (attp2) | Cao et al., 2013 | BDSC:51056; FLYB:FBst0051056 | |
| Genetic reagent (D. melanogaster) | LexAop-GCaMP6s (attp5) | Chen et al., 2013 | BDSC:44589; FLYB:FBst0044589 | |
| Genetic reagent (D. melanogaster) | LexAop-GCaMP6s (attp1) | Chen et al., 2013 | BDSC:44588; FLYB:FBst0044588 | |
| Genetic reagent (D. melanogaster) | LexAop-Gal80 (X) | Thistle et al., 2012 | ||
| Genetic reagent (D. melanogaster) | UAS-CD8::tdTomato (chr X) | Thistle et al., 2012 | ||
| Genetic reagent (D. melanogaster) | UAS-CD8::tdTomato (II) | Thistle et al., 2012 | ||
| Antibody | Anti-Brp (mouse monoclonal) | DSHB, University of Iowa, USA | DSHB:Cat# nc82; RRID:AB_2314866 | 1/500 |
| Antibody | Anti-GFP (rabbit polyclonal) | Thermo Fisher Scientific | Thermo Fisher Scientific:Cat# A11122; RRID:AB_221569 | 1/1000 |
| Antibody | Anti-GFP (chicken polyclonal) | Thermo Fisher Scientific | Thermo Fisher Scientific:Cat# A10262; RRID:AB_2534023 | 1/1000 |
| Antibody | Anti-dsRed (rabbit polyclonal) | Takara Bio | Takara Bio:Cat# 632496; RRID: AB_10013483 | 1/1000 |
| Antibody | Anti-rabbit Alexa Fluor 488 (goat polyclonal) | Thermo Fisher Scientific | Thermo Fisher Scientific:Cat# A11034; RRID:AB_2576217 | 1/100 |
| Antibody | Anti-chicken Alexa Fluor 488 (goat polyclonal) | Thermo Fisher Scientific | Thermo Fisher Scientific:Cat# A11039; RRID:AB_2534096 | 1/100 |
| Antibody | Anti-rabbit Alexa Fluor 568 (goat polyclonal) | Thermo Fisher Scientific | Thermo Fisher Scientific:Cat# A11036; RRID:AB_10563566 | 1/100 |
| Antibody | Anti-mouse Alexa Fluor 647 (goat polyclonal) | Thermo Fisher Scientific | Thermo Fisher Scientific:Cat# A21236; RRID:AB_2535805 | 1/100 |
| Chemical compound, drug | Denatonium benzoate | MilliporeSigma | MilliporeSigma:Cat# D5765; CAS:3734-33-6 | |
| Chemical compound, drug | Caffeine | MilliporeSigma | MilliporeSigma:Cat# C53; CAS:58-08-2 | |
| Chemical compound, drug | Sucrose | Thermo Fisher Scientific | Thermo Fisher Scientific:Cat# AAA1558336; CAS:57-50-1 | |
| Chemical compound, drug | Polyethylene glycol (MW 3350) | MilliporeSigma | MilliporeSigma:Cat# P4338; CAS:25322-68-3 | |
| Chemical compound, drug | All-trans-retinal | MilliporeSigma | MilliporeSigma:Cat# R2500; CAS:116-31-4 | |
| Software, algorithm | Fiji | Schindelin et al., 2012 | RRID:SCR_002285 | http://fiji.sc/ |
| Software, algorithm | CATMAID | Schneider-Mizell et al., 2016 | RRID:SCR_006278 | https://catmaid.readthedocs.io/ |
| Software, algorithm | R Project for Statistical Computing | R Development Core Team, 2018 | RRID:SCR_001905 | https://www.r-project.org/ |
| Software, algorithm | NeuroAnatomy Toolbox | Jefferis and Manton, 2017 | RRID:SCR_017248 | https://github.com/jefferis/nat |
| Software, algorithm | Python | Python Software Foundation | RRID:SCR_008394 | https://www.python.org/ |
| Software, algorithm | Jupyter Notebook | Project Jupyter | RRID:SCR_018315 | https://jupyter.org/ |
| Software, algorithm | Slidebook | Intelligent Imaging Innovations | RRID:SCR_014300 | https://www.intelligent-imaging.com/slidebook |
| Software, algorithm | GraphPad Prism | GraphPad Software | RRID:SCR_002798 | https://www.graphpad.com/ |
| Software, algorithm | Cytoscape | Shannon et al., 2003 | RRID:SCR_003032 | https://cytoscape.org/ |
| Software, algorithm | Computational Morphometry Toolkit | Rohlfing and Maurer, 2003 | RRID:SCR_002234 | https://www.nitrc.org/projects/cmtk/ |
Additional files
Download links
A two-part list of links to download the article, or parts of the article, in various formats.
Downloads (link to download the article as PDF)
Open citations (links to open the citations from this article in various online reference manager services)
Cite this article (links to download the citations from this article in formats compatible with various reference manager tools)
Drosophila gustatory projections are segregated by taste modality and connectivity
eLife 11:e78110.
https://doi.org/10.7554/eLife.78110


