Neural defensive circuits underlie helping under threat in humans
- Department of Psychology, Faculty of Health and Life Sciences, University of Exeter, United Kingdom
- Department of Clinical Neuroscience, Karolinska Institutet, Sweden
Figures
Figure 1
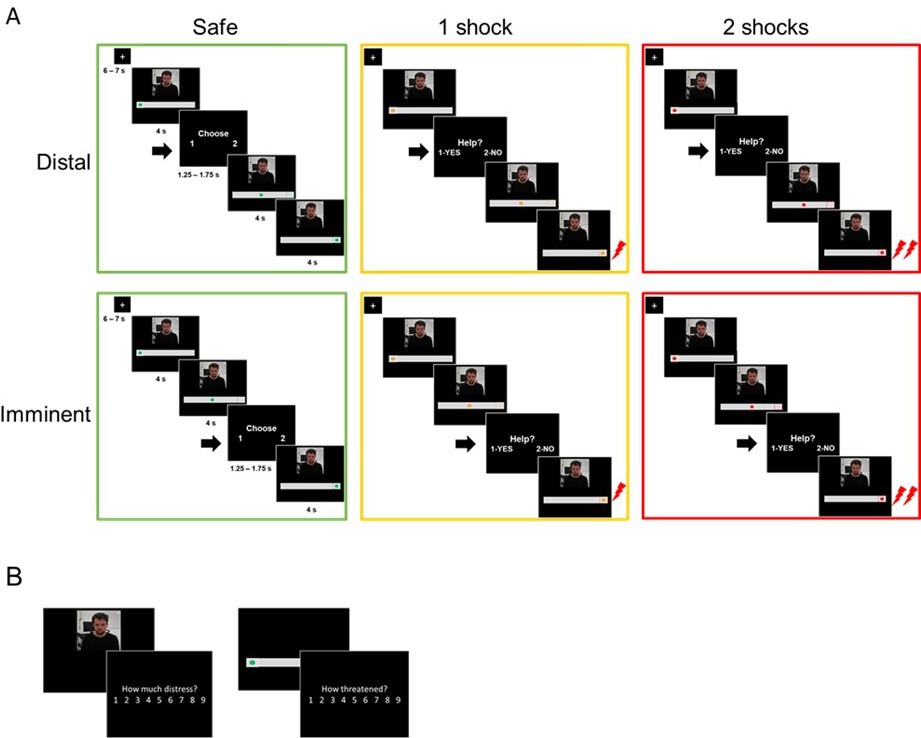
Outline of the experimental tasks.
(A) fMRI helping under threat task. Participants saw the co-participant on the screen, together with a visual cue signaling threat (an upcoming shock). There were three threat levels: safe (0 shocks, green circle), moderate threat (1 shock, yellow circle), and high threat (2 shocks, red circle). In each trial of the task, the circle started static on the left (4 s), and then moved to the right (4 s). Participants were prompted to decide whether they wanted to help the co-participant or not (1.25–1.75 s) either in the beginning of trial (distal) or right before the moment of shock delivery (imminent). Therefore, the available time to make a decision was identical in distal and imminent threats. If participants decided to help, there was a 70% chance both themselves and co-participant would receive shocks; if they decided not to help, the co-participant would always receive a shock, and the participant would not. Decisions prompted on safe trials were to arbitrarily choose to press 1 or 2, since no shocks would be administered. (B) After the fMRI task, outside the scanner, participants re-watched clips of the co-participant presented during the scan, and were asked to rate how much ‘discomfort, anxiety or uneasiness’ he was experiencing in each clip on a 9-point scale. They also presented images of the threat cues and asked to rate, on the same scale, how threatened they felt themselves when they saw those images during the scan.
Figure 2
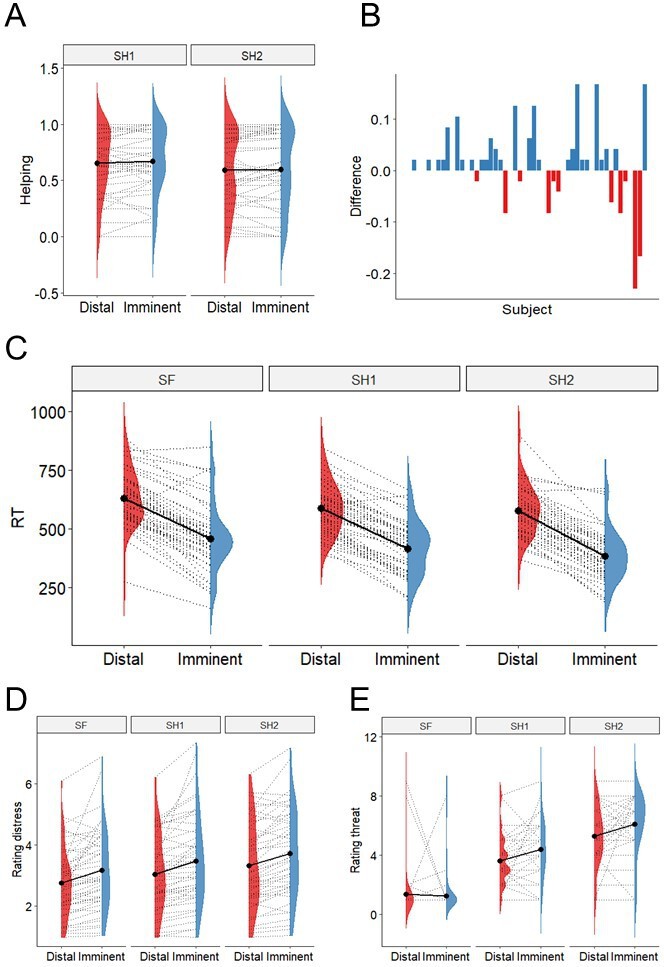
Behavioural results.
(A). There was no evidence of differential helping during imminent and distal threats, nor during 1-shock and 2-shock trials. (B) Difference between proportion of helping in imminent and distal trials (y axis) across subjects (x axis); 27 participants helped more during imminent than distal threats, 11 helped more during distal, and 11 helped the same amount. (C) Responses were faster during imminent than distal trials across threat levels. (D) Participants rated the co-participant’s distress as higher during imminent than distal trials, and as progressively higher across the three threat levels. (E) Participants reported feeling more threatened when watching 2-shock cues (red circle), followed by 1-shock cues (yellow circle), and safe cues (green circle), and when watching cues signaling imminent than distal threat.
Figure 3
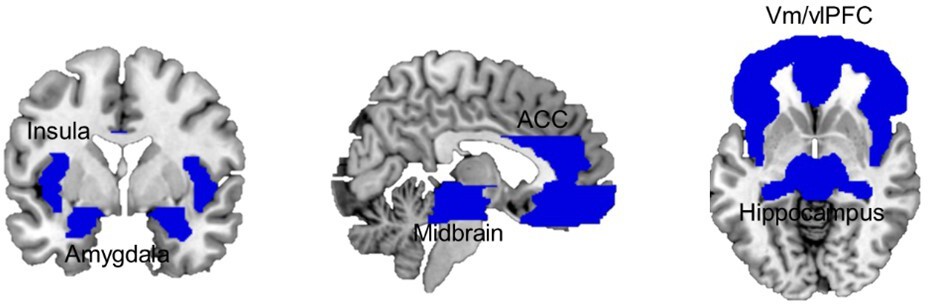
Combined ROI mask including bilateral ventral and lateral medial frontal cortex, dorsal ACC, insula, hippocampus, amygdala, and midbrain.
ACC, anterior cingulate cortex; ROI, region of interest.
Figure 4
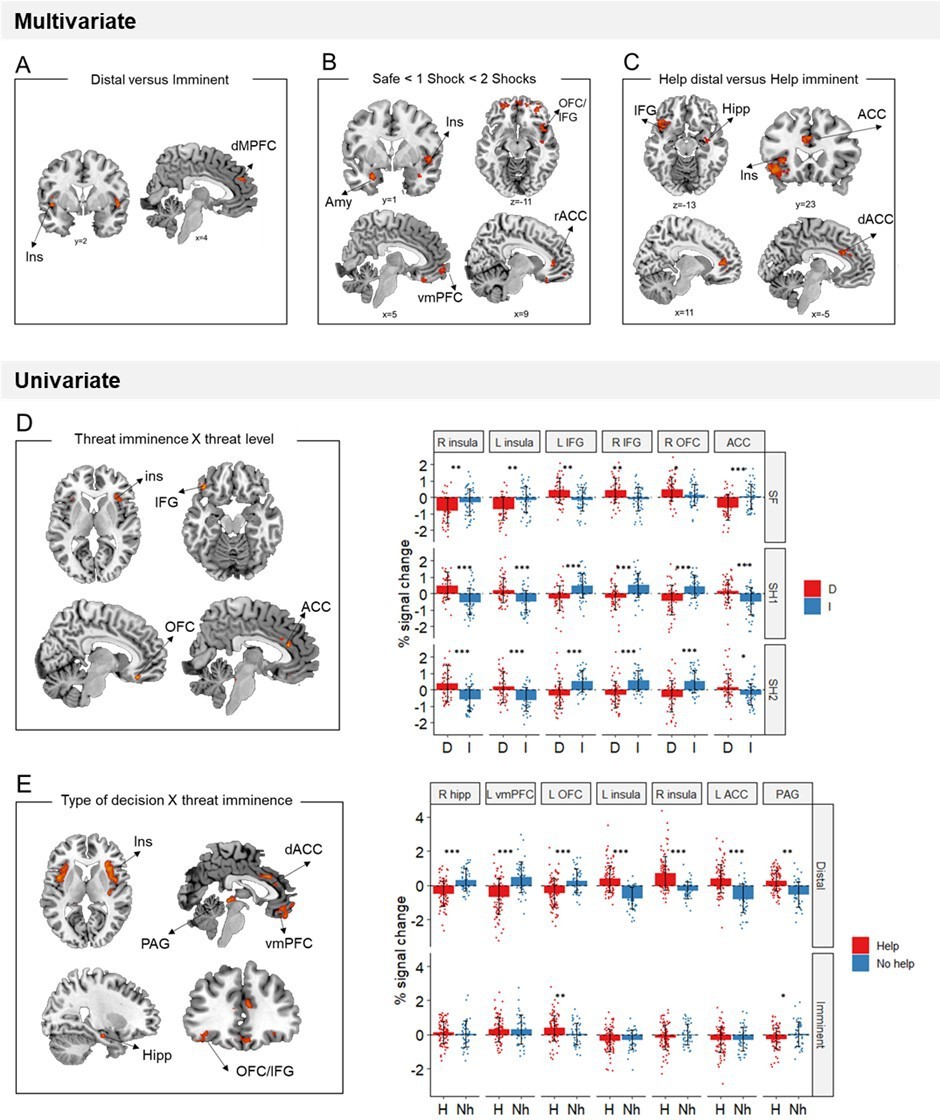
Multivariate and univariate fMRI results.
(A) Local multivoxel activation patterns (identified by searchlight analysis) in the insula and dmPFC were distinguishable between distal and imminent threats, irrespective of helping decisions. (B) Local multivoxel activation patterns (identified by support vector regression) in the amygdala, insula, OFC/IFG, vmPFC, and ACC were linearly associated with varying threat level. (C) Local multivoxel activation patterns (identified by searchlight) in the insula, IFG, hippocampus, and ACC were distinguishable when making helping decisions under distal and imminent threat. (D) Clusters in the insula, IFG, OFC, and ACC displayed a significant threat imminence*threat level interaction. (E) Clusters in the insula, ACC, IFG/OFC, vmPFC, hippocampus, and PAG displayed a significant type of decision*threat imminence interaction. ACC, anterior cingulate cortex; AMY, amygdala; dmPFC, dorsomedial prefrontal cortex; Hipp, hippocampus; IFG, inferior frontal gyrus; Ins, insula; OFC, orbitofrontal cortex; PAG, periaqueductal gray; vmPFC, ventromedial prefrontal cortex. *p<0.05, **p<0.01, ***p<0.001.
Figure 5
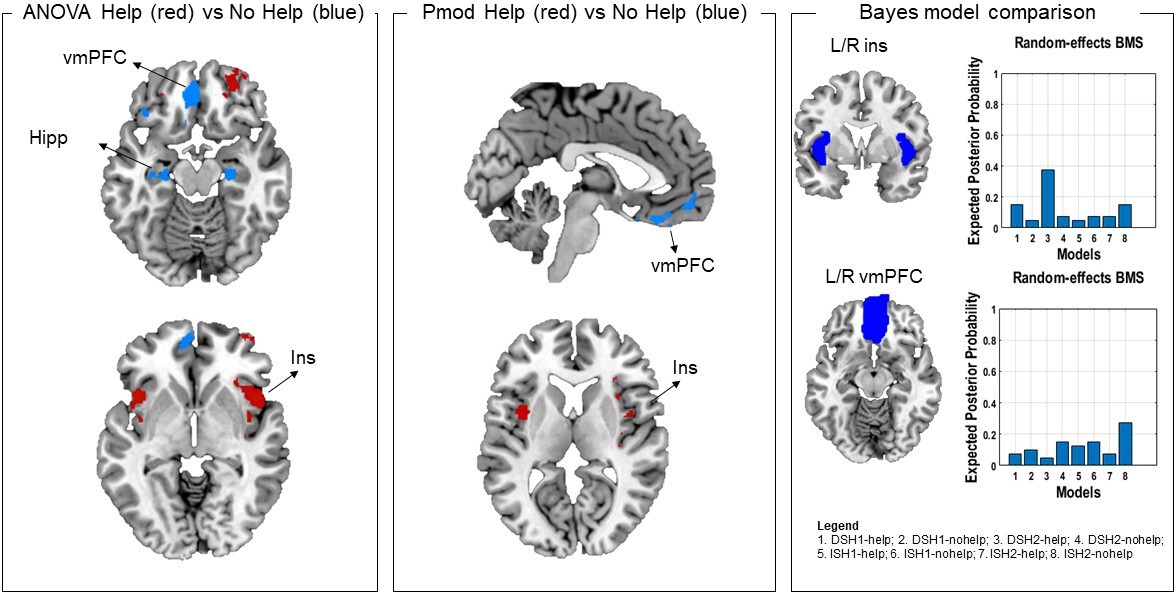
In the left and middle panels, comparison of ANOVA and parametric modulation activation maps.
Since results of these two analyses suggested the effects were driven by the distal condition, here we selected the distal help versus no help (no help+safe) contrast from the ANOVA (left) and the help and no help maps from the parametric modulator regressors. Commonalities were found in the insula (activation associated with helping decisions) and in the vmPFC (associated with not helping decisions). Red denotes higher activation during help decisions, and blue denotes higher activation during not help decisions. In the right panel, results of the Bayesian model selection (BMS; following Bayesian first-level analysis). Resulting model evidence maps were thresholded at 0.75 (BF of approx. 8). ROI masks were then applied for model comparison. Results showed stronger evidence for help models for the insula, and no help models for the vmPFC, in line with the frequentist analyses. Note that results from the parametric modulation and Bayesian analysis are inherently noisier, given the smaller number of participants and trials. ROI, region of interest; vmPFC, ventromedial prefrontal cortex.
Figure 6
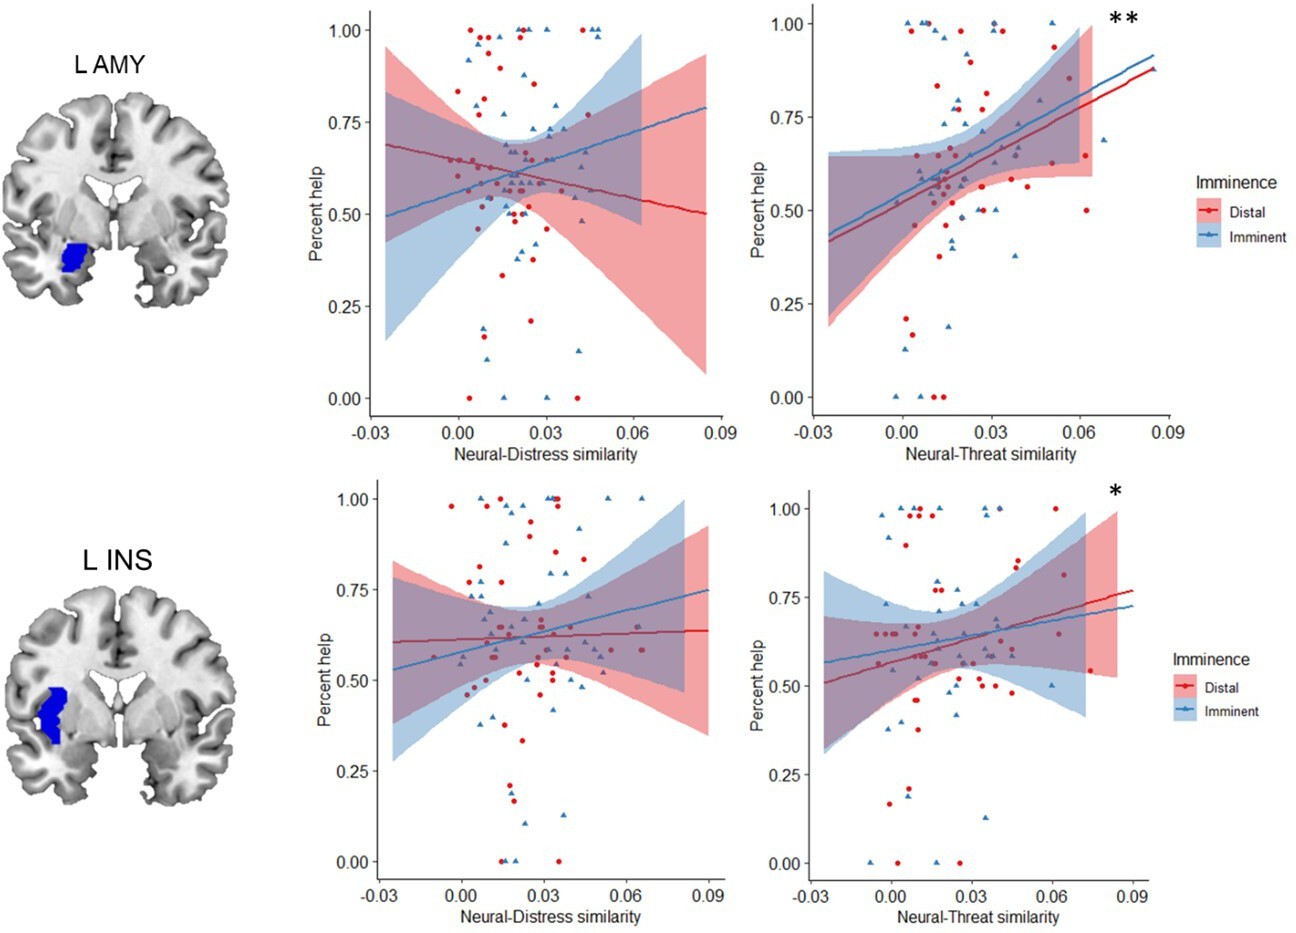
Regardless of threat imminence, the similarity between neural and threat RDMs in the left amygdala and insula predicted higher frequency of helping decisions.
*p=0.047; **p=0.006. RDM, representational dissimilarity matrix.
Figure 7
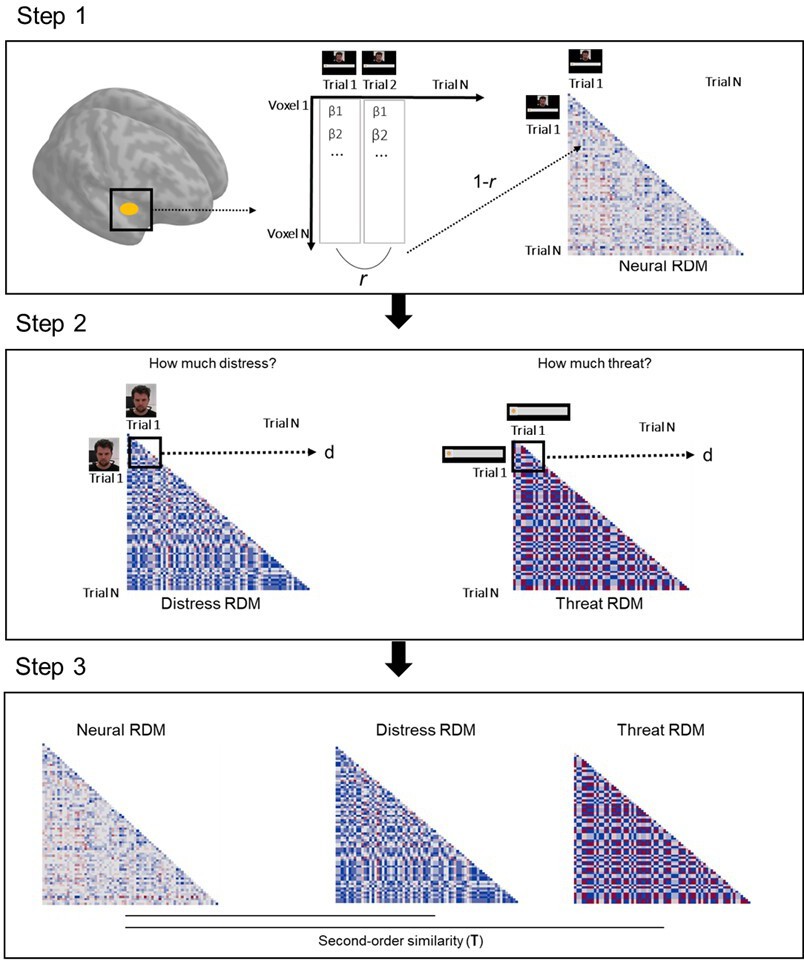
Schematic of the RSA pipeline.
On step 1, we extracted the vector of trial-by-trial betas for each voxel in a given ROI. We then calculated the correlation (Pearson r) between all trial pairs. These correlation values were inverted (1−r) and used to create a trial-by-trial matrix, wherein each cell represents how correlated activation across all voxels of the ROI was in each trial pair (neural representational dissimilarity matrix, RDM). On step 2, post-scan ratings of the co-participant’s distress in each unique clip were used to construct a trial-by-trial matrix, wherein each cell contained the Euclidean distance between the rating of each pair of clips (distress RDM). A similar method was used with the ratings of threat to the participant (threat RDM). On step 3, the second-order similarity between the neural RDM and distress RDM, and between the neural RDM and threat RDM were calculated using a ranked correlation method (Kendall’s tau). ROI, region of interest; RSA, representational similarity analysis.
Appendix 1—figure 1
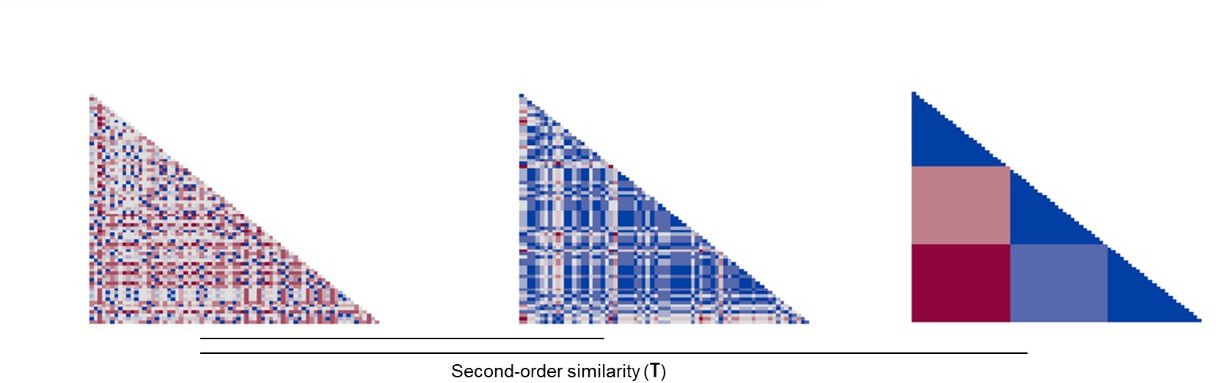
Example RDMs (Neural, Distress and Threat) sorted by threat level.
Appendix 1—figure 2
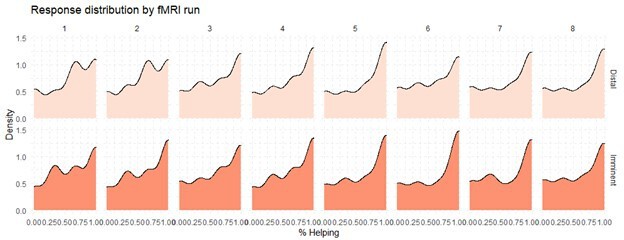
Response distributions per fMRI run.
Appendix 1—figure 3
Cross-validation.
Tables
Table 1
Multivariate results based on threat imminence (distal—imminent) and level (safe, 1 shock, 2 shocks; FWE<0.05).
| Searchlight distal versus Imminent | |||||
|---|---|---|---|---|---|
| R/L | k | x, y, z | T | BA | |
| Insula, superior temporal gyrus | R | 40 | 46, –4, –8 | 7.43 | 22 |
| Insula | L | 17 | –46, 2, –4 | 6.64 | 13 |
| 18 | –42, 4, 8 | 7.15 | |||
| Medial prefrontal cortex | R | 20 | 10, 48, 28 | 7.13 | 9 |
| SVM regression SF – 1 SH – 2SH | |||||
| Hippocampus | R | 12 | 24, –10, –20 | 7.56 | |
| Insula | R | 25 | 42, –8, –8 | 8.34 | 13 |
| Rolandic operculum | R | 139 | 52, 0, 0 | 7.12 | 22, 47 |
| Superior temporal gyrus, amygdala | R | 11 | 38, 2, –24 | 7.73 | |
| Amygdala | L | 37 | –24, 4, –24 | 7.96 | |
| Rectus | R | 12 | 6, 30, –24 | 7.07 | 11 |
| Anterior cingulate | R | 13 | 8, 38, 8 | 7.02 | |
| Middle orbital frontal gyrus | R | 42 | 32, 44, –14 | 7.32 | 11 |
| Middle orbital frontal gyrus | L | 11 | –4, 48, –10 | 6.75 | 11 |
| 44 | –28, 54, –10 | 7.59 | |||
| 41 | 40, 56, –4 | 7.18 | |||
| Superior frontal orbital gyrus | R | 19 | 16, 54, –14 | 6.78 | 10 |
| Medial frontal gyrus | R | 30 | 6, 58, –8 | 6.97 | 10 |
| Searchlight help during distal versus imminent threats | |||||
| R | 29 | 36, –8, –16 | 8.04 | ||
| Hippocampus | R | 21 | 50, 4, –2 | 7.01 | 22 |
| Insula | R | 23 | 32, 14, 14 | 7.18 | 13 |
| Inferior frontal gyrus | L | 207 | –48, 20, –6 | 8.81 | 47, 38, 22, 13, 45 |
| Mid cingulate, dorsal anterior cingulate | R | 43 | 2, 22, 30 | 7.25 | 32, 9, 24, 6 |
| Insula | L | 45 | –32, 26, 0 | 7.83 | 47, 13, 45 |
| Anterior cingulate | R | 53 | 10, 40, 8 | 7.92 | 32, 10 |
Table 2
Results of the univariate ANOVAS (FWE<0.05).
| Univariate threat level*imminence interaction | ||||||||||
|---|---|---|---|---|---|---|---|---|---|---|
| R/L | k | x, y, z | F | BA | ||||||
| Insula | R | 768 | 38, 20, 6 | 28.14 | 13 | |||||
| Insula | L | 521 | –30, 24, –4 | 20.58 | 13 | |||||
| IFG, OFC | L | 593 | –40, 32, –16 | 23.72 | 11 | |||||
| OFC | R | 407 | 8, 32, –20 | 23.43 | 11 | |||||
| ACC | R | 278 | 4, 32, 20 | 18.29 | 24 | |||||
| OFC, IFG | R | 52 | 34, 40, –12 | 13.18 | 11, 47 | |||||
| Type of decision*imminence interaction | ||||||||||
| R/L | k | x, y, z | F | BA | ||||||
| Midbrain | 60 | 2, –32, –4 | 16.85 | |||||||
| Insula | R | 192 | 38, –16, –2 | 20.62 | 13, 47, 22, 44, 6, 45, 21 | |||||
| Hippocampus | R | 38 | 30, –14, –20 | 15.03 | ||||||
| Insula | L | 595 | −36, –8, –4 | 18.68 | 13, 22, 44, 6, 47, 45 | |||||
| Dorsal anterior cingulate | L | 151 | –2, 14, 30 | 16.13 | 24, 6, 32, 5, 4 | |||||
| Insula | R | 748 | 30, 20, –8 | 18.18 | 47, 13, 22, 44, 6, 45, 21 | |||||
| Inferior frontal/orbital gyrus | L | 46 | –34, 36, –10 | 11.47 | 11 | |||||
| Rectus, ventral medial frontal gyrus | L | 238 | 0, 46, –20 | 19.94 | 11, 10, 25 | |||||
Table 3
Results of the parametric modulation analysis.
| Distal 1 shock | |||||
|---|---|---|---|---|---|
| R/L | k | x, y, z | T | BA | |
| (Neg) vmPFC, rectus | L | 125 | –4, 30, –22 | 6.55 | 11 |
| Distal 2 shocks | |||||
| R/L | k | x, y, z | T | BA | |
| (Pos) Insula | R | 110 | 44, 2, 4 | 5.76 | 13 |
| (Pos) Insula | L | 150 | –38, 0, 8 | 5.56 | 13 |
| (Neg) vmPFC, medial frontal orb | L | 64 | –4, 54, –12 | 5.13 | 11 |
Appendix 1—table 1
Threat imminence X Threat level Anova.
| Main effect of threat imminence | ||||||
|---|---|---|---|---|---|---|
| R/L | k | x, y, z | F | BA | ||
| Insula | R | 36 | 42, 2,–6 | 12.76 | 13 | |
| Insula | L | 113 | –28, 12,–20 | 16.29 | 47 | |
| IFG | R | 1410 | 50, 20,–10 | 25.43 | 47 | |
| vmPFC | L | 334 | –8, 32,–16 | 17.43 | 11, 25, 10 | |
| OFC | L | 37 | –18, 56,–8 | 12.62 | 11 | |
| Main effect of threat level | ||||||
| R/L | k | x, y, z | F | BA | ||
| IFG | R | 72 | 36, 24, 8 | 20.25 | 13, 45, 47, 44, | |
| vmPFC | L | 443 | 0, 34,–16 | 27.35 | 10, 11, 32, 25, 9 | |
| Threat imminence*level | ||||||
| R/L | k | x, y, z | F | BA | ||
| Insula | R | 768 | 38, 20, 6 | 28.14 | 13 | |
| Insula | L | 521 | –30, 24,–4 | 20.58 | 13 | |
| IFG, OFC | L | 593 | –40, 32,–16 | 23.72 | 11 | |
| OFC | R | 407 | 8, 32,–20 | 23.43 | 11 | |
| ACC | R | 278 | 4, 32, 20 | 18.29 | 24 | |
| OFC, IFG | R | 52 | 34, 40,–12 | 13.18 | 11, 47 | |
Appendix 1—table 2
Type of decision X Threat imminence Anova.
| Main effect of type of decision | ||||||
|---|---|---|---|---|---|---|
| R/L | k | x, y, z | F | BA | ||
| Hippocampus | L | 128 | −32,–18, –14 | 17.85 | ||
| Hippocampus | R | 58 | 28,–16, –16 | 16.01 | ||
| Insula | L | 638 | –40, 8, 6 | 24.10 | 13, 47, 44, 45, 22 | |
| Insula | R | 949 | 46, 14,–2 | 30.43 | 13, 47, 44, 45, 22 | |
| ACC | R | 218 | 2, 22, 28 | 24.33 | 32, 6, 24, 8 | |
| IFG | L | 104 | –38, 28,–14 | 12.38 | 21, 38, 47, 22 | |
| vmPFC | L | 768 | 0, 44,–18 | 24.74 | 11, 25, 10, 32 | |
| OFC | R | 129 | 36, 54,–14 | 14.50 | 11, 10 | |
| Main effect of threat imminence | ||||||
| R/L | k | x, y, z | F | BA | ||
| Insula | R | 40 | 36,–20, 8 | 21.07 | 13 | |
| 56 | 38, 8, 4 | 17.93 | 13 | |||
| 45 | 32, 20, 14 | 17.09 | 13, 45 | |||
| IFG | L | 211 | –50, 42,–8 | 29.37 | 47, 10 | |
| vmPFC | L | 447 | –2, 54,–14 | 36.39 | 11 | |
| Type of decision*threat imminence | ||||||
| R/L | k | x, y, z | F | BA | ||
| Midbrain | 60 | 2,–32, –4 | 16.85 | |||
| Insula | R | 192 | 38,–16, –2 | 20.62 | 13, 47, 22, 44, 6, 45, 21 | |
| Hippocampus | R | 38 | 30,–14, –20 | 15.03 | ||
| Insula | L | 595 | −36,–8, –4 | 18.68 | 13, 22, 44, 6, 47, 45 | |
| Dorsal anterior cingulate | L | 151 | –2, 14, 30 | 16.13 | 24, 6, 32, 5, 4 | |
| Insula | R | 748 | 30, 20,–8 | 18.18 | 47, 13, 22, 44, 6, 45, 21 | |
| IFG/orbital gyrus | L | 46 | –34, 36,–10 | 11.47 | 11 | |
| Ventral med frontal gyrus | L | 238 | 0, 46,–20 | 19.94 | 11, 10, 25 | |
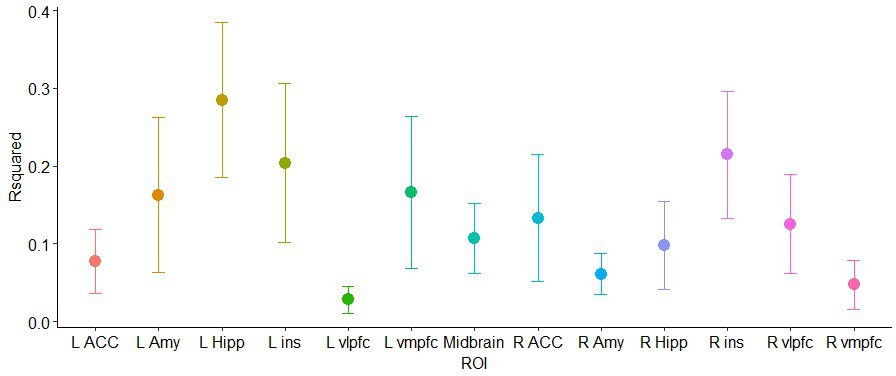
Appendix 1—table 3
Estimates from models for each ROI, predicting helping percentage throughout the scan as a function of neural-distress similarity, neural-threat similarity, and threat imminence (all p values across all models were FDR-corrected).
| Estimate | Std. Error | t value | p (FDR-corrected) | |
|---|---|---|---|---|
| L amygdala | ||||
| Intercept | 0.536 | 0.054 | 9.823 | <.00001 |
| Threat | 4.407 | 1.348 | 3.269 | .006* |
| Distress | –1.292 | 2.049 | –0.630 | .887 |
| Imminence | 0.040 | 0.055 | 0.731 | .837 |
| L insula | ||||
| Intercept | 0.531 | 0.059 | 8.883 | <.00001 |
| Threat | 2.461 | 0.974 | 2.525 | .047* |
| Distress | 1.286 | 1.552 | 0.828 | .837 |
| Imminence | 0.0129 | 0.052 | 0.246 | .887 |
| L ACC | ||||
| Intercept | 0.649 | 0.057 | 11.257 | <.00001 |
| Threat | 0.216 | 0.940 | 0.230 | .887 |
| Distress | –1.339 | 1.304 | –1.026 | .742 |
| Imminence | 0.018 | 0.054 | 0.348 | .887 |
| L hippocampus | ||||
| Intercept | 0.620 | 0.067 | 9.233 | <.00001 |
| Threat | 0.042 | 1.564 | 0.027 | .978 |
| Distress | 0.104 | 1.642 | 0.063 | .968 |
| Imminence | 0.017 | 0.054 | 0.324 | .887 |
| Midbrain | ||||
| Intercept | 0.722 | 0.066 | 10.936 | <.00001 |
| Threat | –2.196 | 1.694 | –1.296 | .573 |
| Distress | –2.622 | 1.753 | –1.495 | .451 |
| Imminence | 0.040 | 0.055 | 0.736 | .837 |
| L vmPFC | ||||
| Intercept | 0.589 | 0.059 | 9.842 | <.00001 |
| Threat | 0.752 | 1.010 | 0.744 | .837 |
| Distress | 0.627 | 1.495 | 0.419 | .887 |
| Imminence | 0.017 | 0.054 | 0.316 | .887 |
| L vlPFC | ||||
| Intercept | 0.589 | 0.059 | 9.842 | <.00001 |
| Threat | 0.752 | 1.010 | 0.744 | .837 |
| Distress | 0.627 | 1.495 | 0.419 | .887 |
| Imminence | 0.017 | 0.054 | 0.316 | .887 |
| R amygdala | ||||
| Intercept | 0.695 | 0.062 | 11.170 | <.00001 |
| Threat | –1.651 | 1.584 | –1.042 | .742 |
| Distress | –1.319 | 1.411 | –0.935 | .797 |
| Imminence | 0.017 | 0.053 | 0.332 | .887 |
| R insula | ||||
| Intercept | 0.603 | 0.060 | 10.015 | <.00001 |
| Threat | 0.436 | 0.976 | 0.447 | .887 |
| Distress | 0.189 | 1.676 | 0.113 | .946 |
| Imminence | 0.020 | 0.054 | 0.376 | .887 |
| R ACC | ||||
| Intercept | 0.541 | 0.060 | 8.883 | <.00001 |
| Threat | 1.781 | 1.279 | 1.392 | .512 |
| Distress | 1.617 | 1.456 | 1.110 | .739 |
| Imminence | 0.014 | 0.053 | 0.276 | .887 |
| R hippocampus | ||||
| Intercept | 0.677 | 0.063 | 10.677 | <.00001 |
| Threat | –1.451 | 1.432 | –1.012 | .742 |
| Distress | –0.704 | 1.350 | –0.521 | .887 |
| Imminence | 0.017 | 0.054 | 0.326 | .887 |
| R vmPFC | ||||
| Intercept | 0.612 | 0.058 | 10.490 | <.00001 |
| Threat | 0.933 | 1.055 | 0.884 | .820 |
| Distress | –0.467 | 1.345 | –0.347 | .887 |
| Imminence | 0.012 | 0.047 | 0.272 | .887 |
| R vlPFC | ||||
| Intercept | 0.603 | 0.066 | 9.134 | <.00001 |
| Threat | –0.242 | 1.405 | –0.172 | .916 |
| Distress | 1.118 | 1.670 | 0.669 | .876 |
| Imminence | 0.0207 | 0.054 | 0.381 | .887 |
Appendix 1—table 4
Exploratory examination of association between neural-distress and neural-threat similarity, and helping in the temporo-parietal junction (TPJ) (anatomically defined ROI based on aal, including supramarginal and angula gyri).
Estimates from linear models for left and right TPJ.
| Estimate | Std. Error | t value | p | |
|---|---|---|---|---|
| L TPJ | ||||
| Intercept | 0.552 | 0.051 | 10.756 | <.00001 |
| Threat | 1.669 | 0.967 | 1.725 | 0.088 |
| Distress | 1.103 | 1.492 | 0.739 | 0.462 |
| Imminence | 0.014 | 0.053 | 0.269 | 0.789 |
| R TPJ | ||||
| Intercept | 0.559 | 0.057 | 9.859 | <.00001 |
| Threat | 1.407 | 0.842 | 1.671 | 0.098 |
| Distress | 0.585 | 1.491 | 0.392 | 0.696 |
| Imminence | 0.018 | 0.054 | 0.339 | 0.735 |
Appendix 1—table 5
Comparison of Neural-Distress similarity, and Neural-Threat similarity, for distal and imminent threats, in each ROI.
| Distal | Imminent | |
|---|---|---|
| L Acc | z=–0.039, P=0.969 | z=–0.028, P=0.978 |
| L Amy | z=–0.047, P=0.963 | z=0.014, P=0.989 |
| L Insula | z=–0.003, P=0.997 | z=0.0064 p=0.995 |
| L Vlpfc | z=–0.073, P=0.941 | z=–0.036, P=0.971 |
| L Vmpfc | z=–0.029, P=0.977 | z=–0.036, P=0.971 |
| L Hippocampus | z=0.001, P=0.999 | z=0.002, P=0.998 |
| Midbrain | z=–0.004, P=0.997 | z=0.026, P=0.979 |
| R Acc | z=–0.030, P=0.976 | z=–0.005, P=0.996 |
| R Amy | z=0.004, P=0.997 | z=0.004, P=0.997 |
| R Insula | z=–0.061, P=0.951 | z=–0.039, P=0.969 |
| R Vlpfc | z=–0.005, P=0.996 | z=–0.027, P=0.978 |
| R Vmpfc | z=0.002, P=0.998 | z=–0.028, P=0.978 |
| R Hippocampus | z=–0.010, P=0.992 | z=0.010, P=0.992 |
Additional files
Download links
A two-part list of links to download the article, or parts of the article, in various formats.
Downloads (link to download the article as PDF)
Open citations (links to open the citations from this article in various online reference manager services)
Cite this article (links to download the citations from this article in formats compatible with various reference manager tools)
Neural defensive circuits underlie helping under threat in humans
eLife 11:e78162.
https://doi.org/10.7554/eLife.78162


