Integration of visual and antennal mechanosensory feedback during head stabilization in hawkmoths
- National Centre for Biological Sciences, Tata Institute of Fundamental Research, India
Figures
Figure 1 with 1 supplement
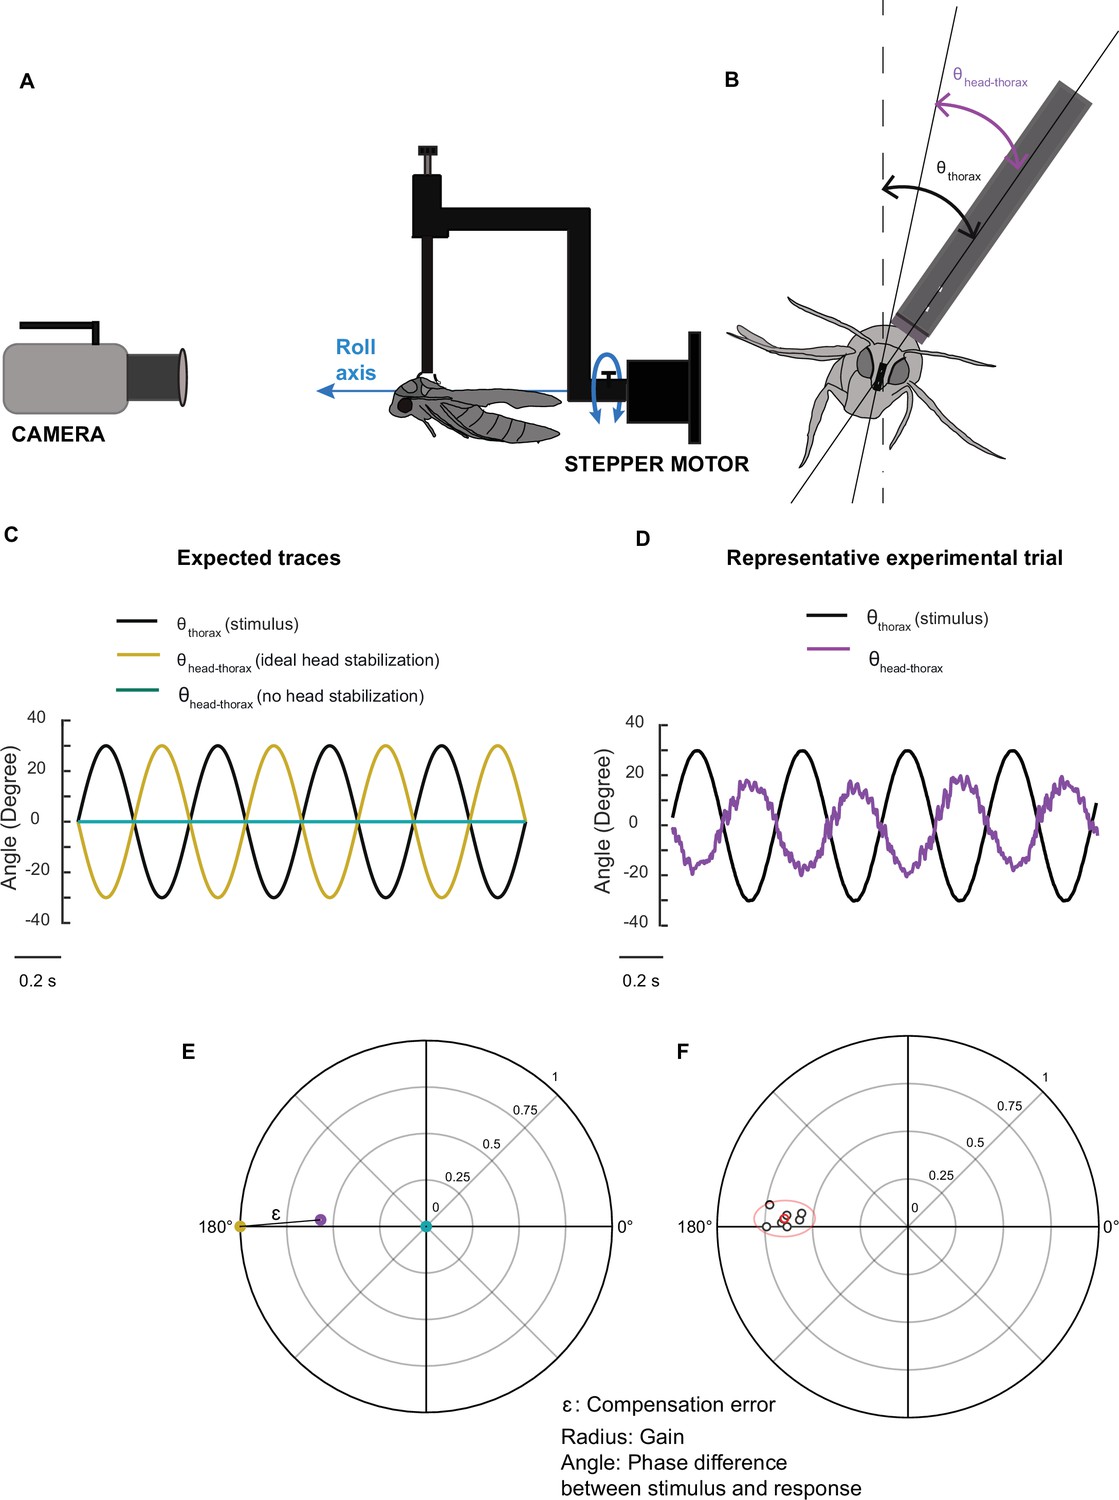
Methods and representation of experiments.
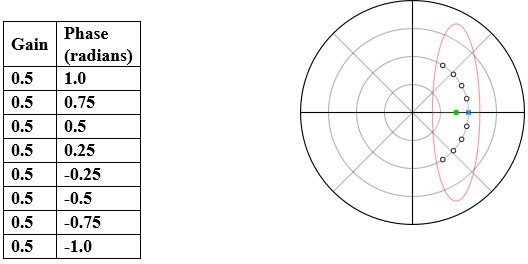
(A) A schematic of the experimental setup illustrating the relative positions of the stepper motor, tethered moth, and camera. (B) Front view of the moth with lines drawn through the digitized points and the angles used for analysis. θthorax is the angle between the tether position and the vertical and θhead-thorax represents angle between head and thorax. (C) Traces representing ideal head stabilization (θhead-thorax: yellow) and no head stabilization (θhead-thorax: cyan) in response to an imposed roll stimulus of amplitude ±30° and frequency of 2 Hz (θthorax: black). (D) Representative experimental trial showing head roll rotations that do not fully compensate the forced body rotations in moths (violet trace, θhead-thorax). (E) Polar plot representing gain and phase of the different conditions in (C) and (D). Each point represents gain in the radial axis and phase in the circular axis. The points are color-coded with reference to the plots in (C) and (D). Compensation error (labelled ɛ in the figure, also see Supplementary methods) is the distance between a representative point (purple) and the ideal head stabilization (yellow). The case of zero gain (blue) indicates the absence of any response. (F) A cluster of points belonging to a sample treatment is enclosed by a 95% confidence ellipse and the mean of the points is highlighted in red.
Figure 1—figure supplement 1
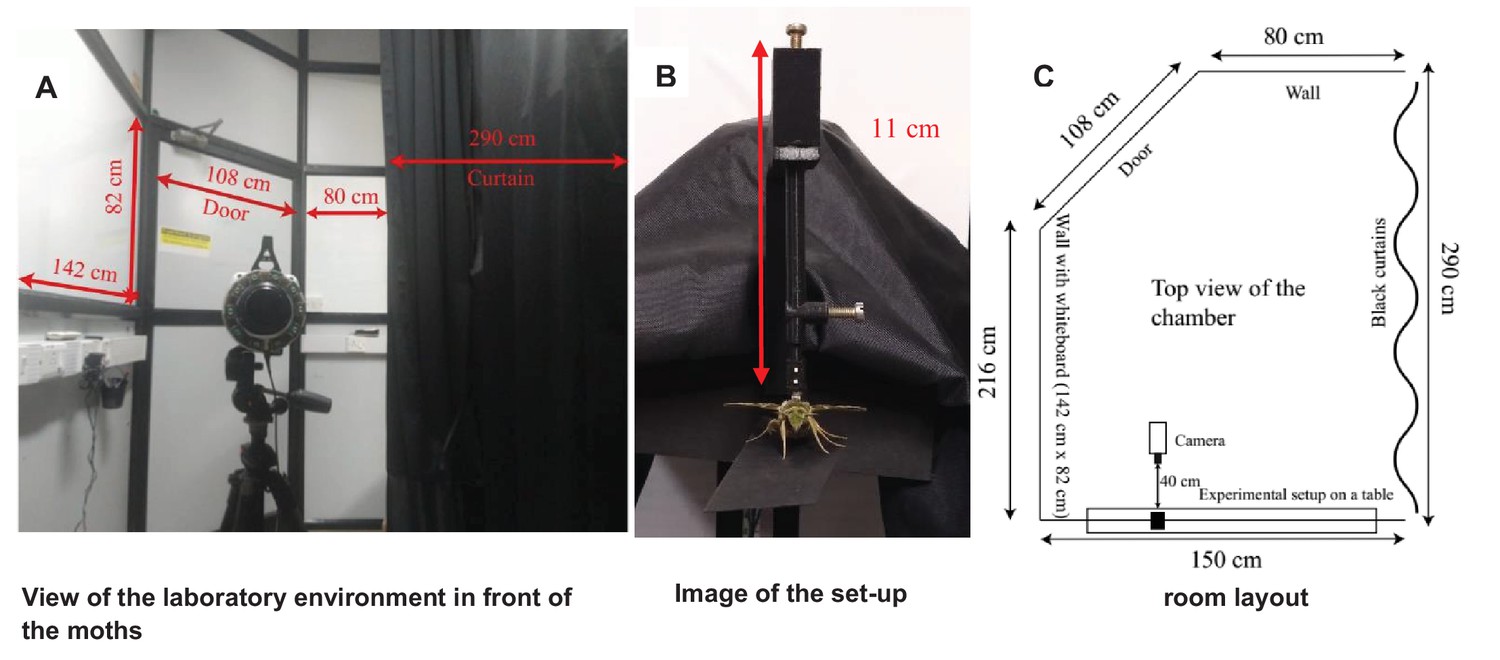
The visual environment of the tethered moth.
(A) An image of the laboratory environment in front of the moth with the room dimensions. (B) Image of the hawkmoth on the rotating tether. (C) Overall room layout.
Figure 2 with 3 supplements
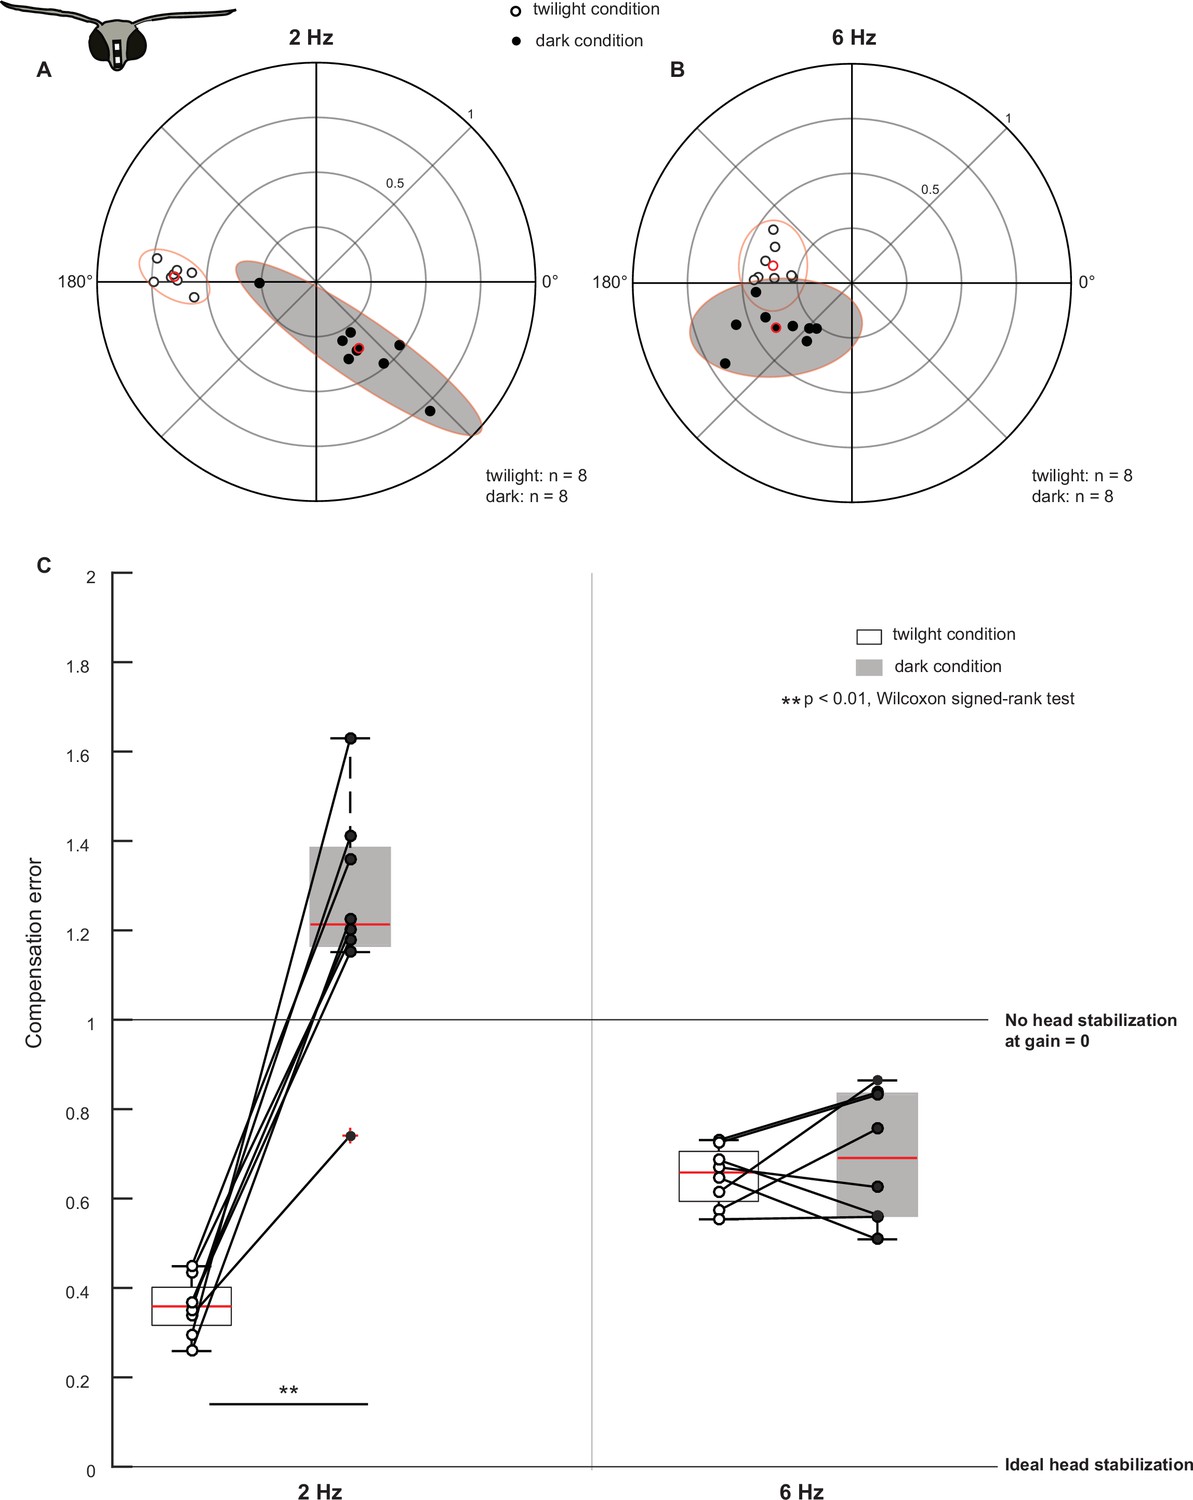
Visual feedback mediates head stabilization.
(A, B) Polar scatter plots (with 95% confidence ellipses) of head roll response to body roll frequency of 2 Hz (A) and 6 Hz (B) in control moths. In each plot, the datapoints of the twilight condition are marked by open circles, the datapoints of the dark condition are marked by filled circles and their mean is highlighted in red. (C) Boxplots comparing compensation error between twilight and dark (filled boxplots) trials at 2 Hz (left two boxplots) and 6 Hz (right two boxplots). The datapoints are scattered on the plots. Datapoints representing the same animal in twilight and dark trials are connected with lines.
Figure 2—figure supplement 1
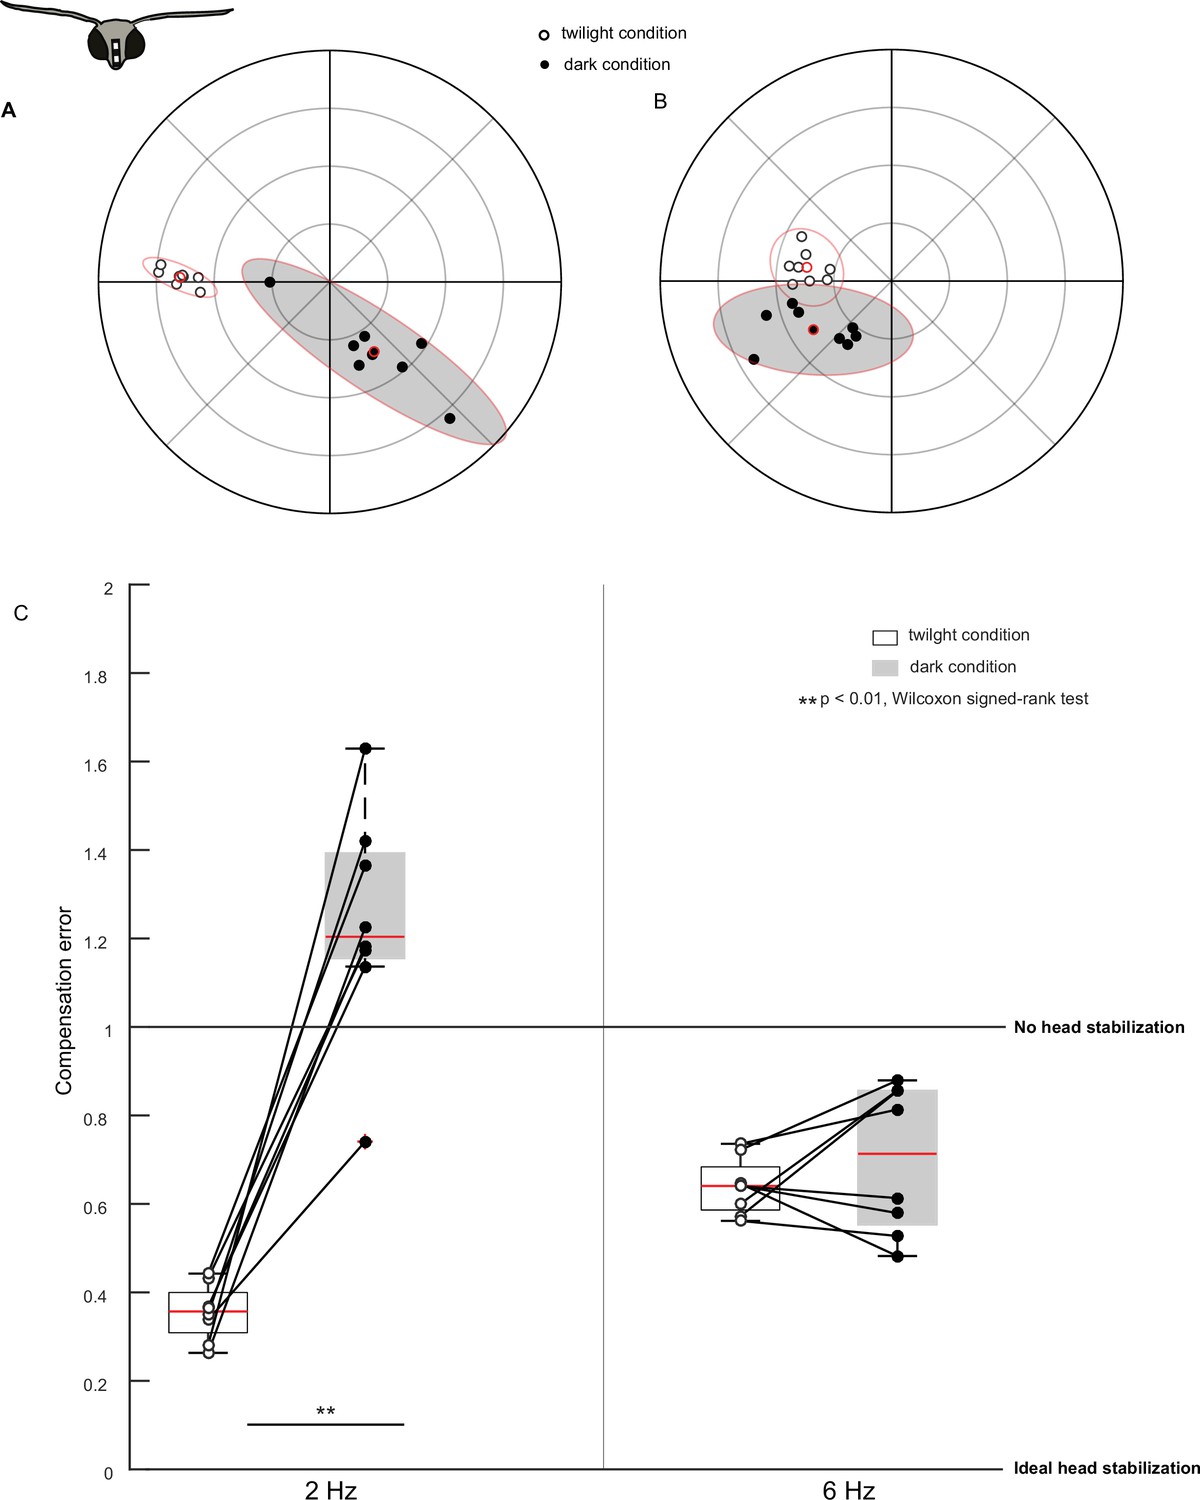
Figure 2 is repeated with an alternative way of phase computation.
The results from Figure 2 remain unaltered using this way of phase estimation.
Figure 2—figure supplement 2
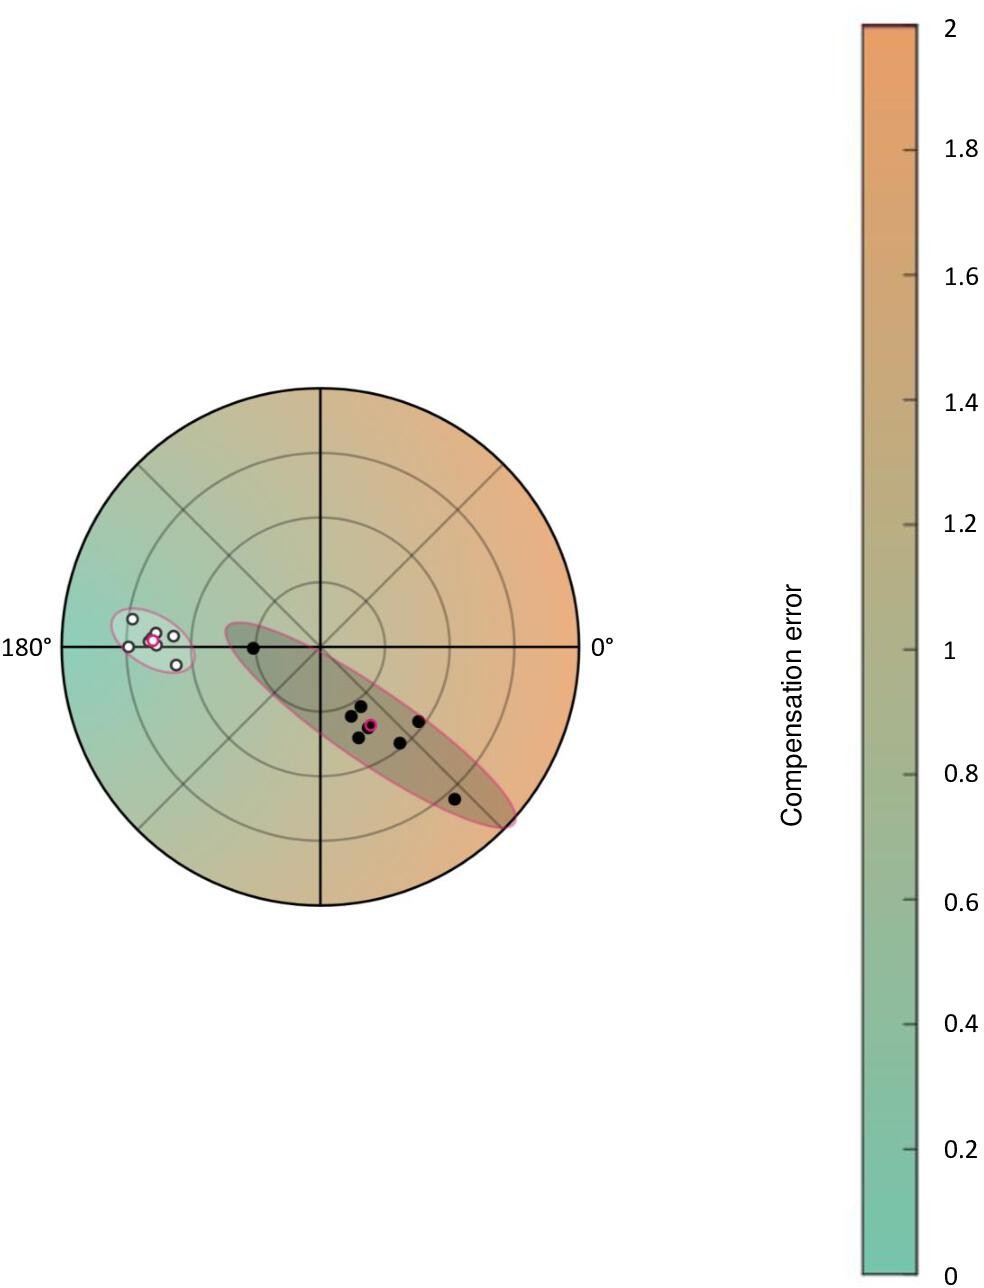
Figure 2A is replotted with color gradient of compensation error.
Figure 2—figure supplement 3
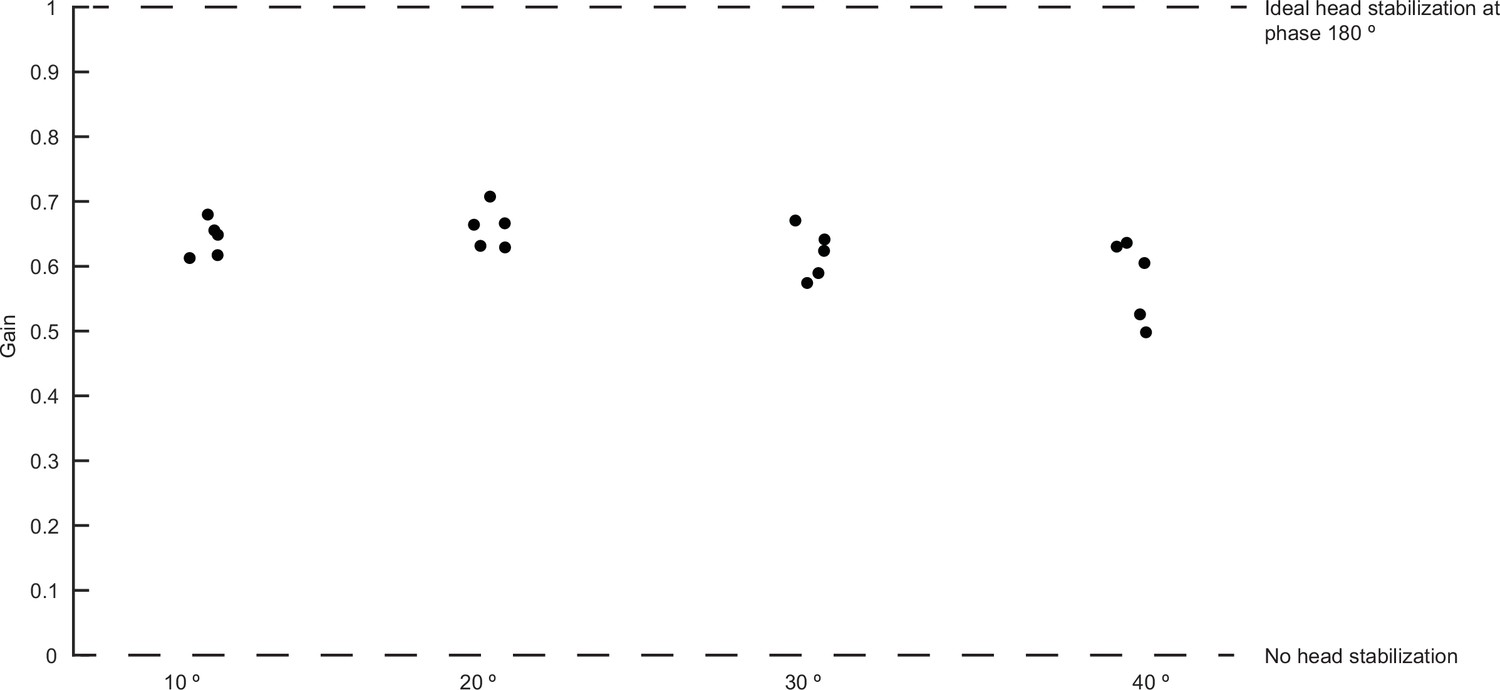
Scatterplots of gain at different stimulus amplitudes.
The gain does not differ between the different stimulus amplitudes.
Figure 3 with 3 supplements
Antennal feedback is required for head stabilization.
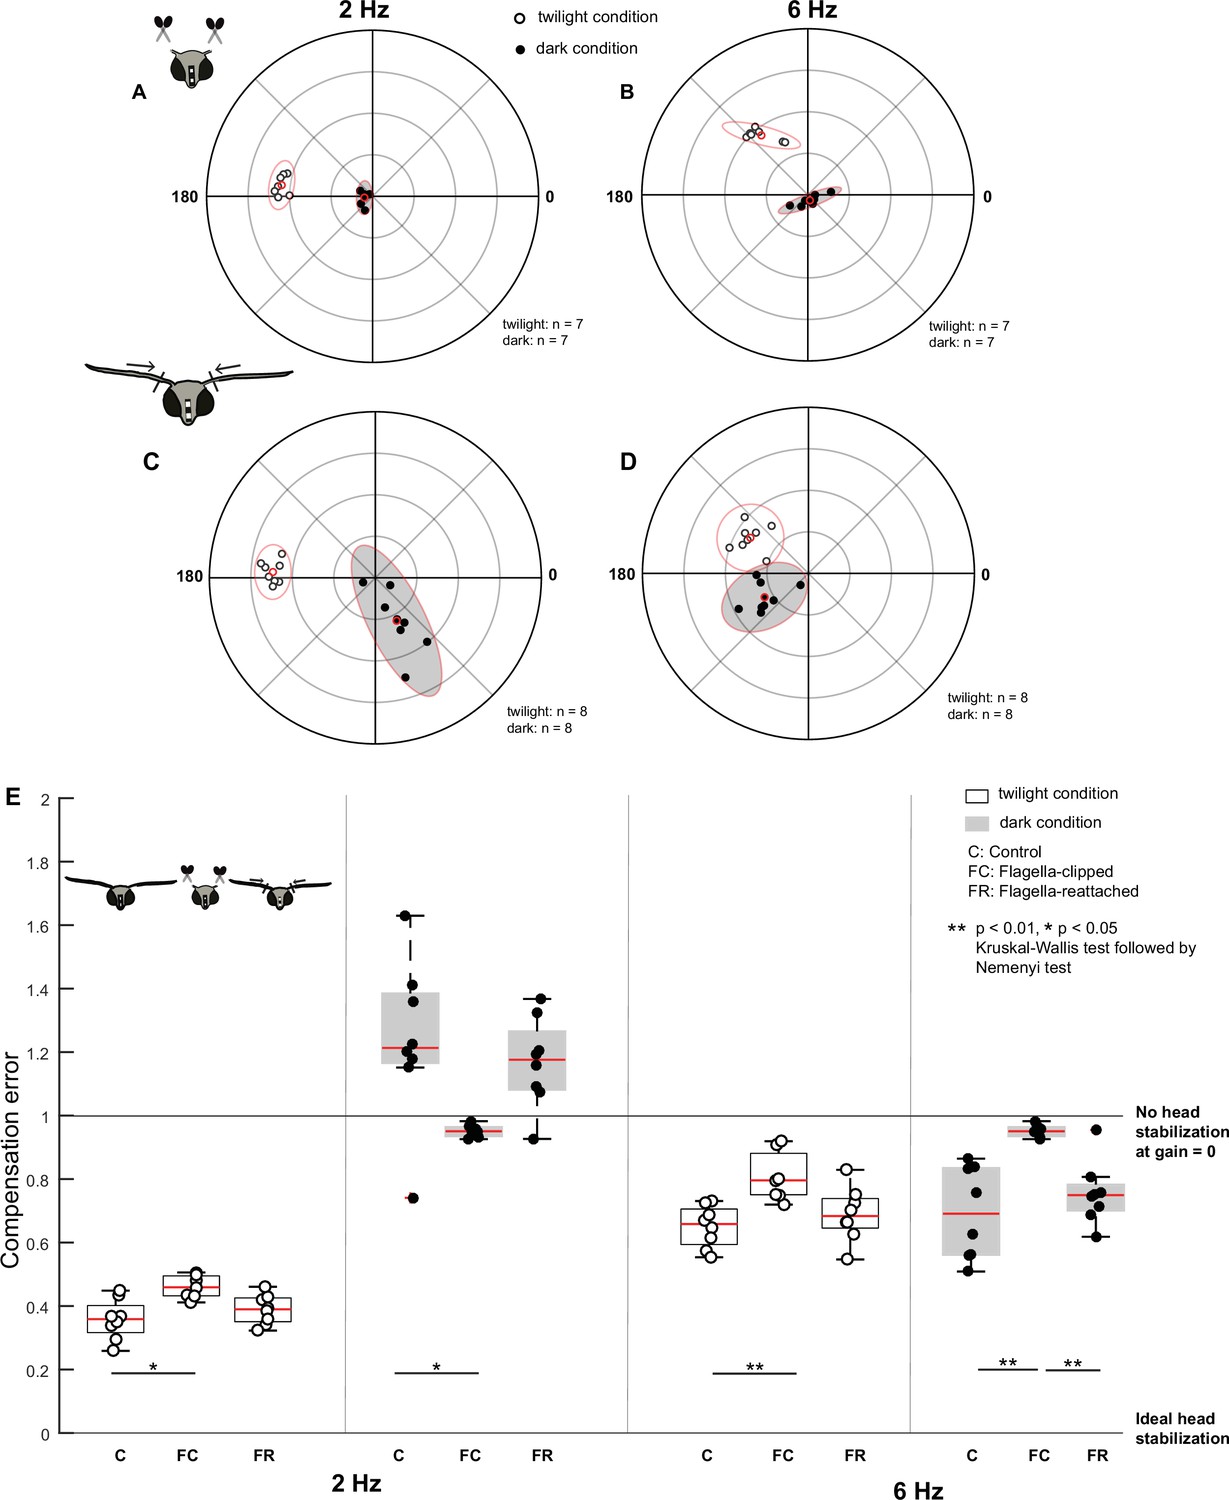
(A–D) Polar scatter plots (with 95% confidence ellipses) of 2 Hz (A, C) and 6 Hz (B, D) roll frequencies in flagella-clipped (A, B) and flagella-reattached moths (C, D). In each plot, the datapoints of the twilight condition are marked by open circles, the datapoints of the dark condition is marked by filled circles, and the mean is highlighted in red. (E) Boxplots comparing compensation error between control (C), flagella-clipped (FC) and flagella-reattached (FR) moths for twilight and dark (filled boxplots) trials at 2 Hz (left six boxplots) and 6 Hz (right six boxplots). Note that the control dataset in this plot is used from the previous experiment (Figure 2C).
Figure 3—figure supplement 1
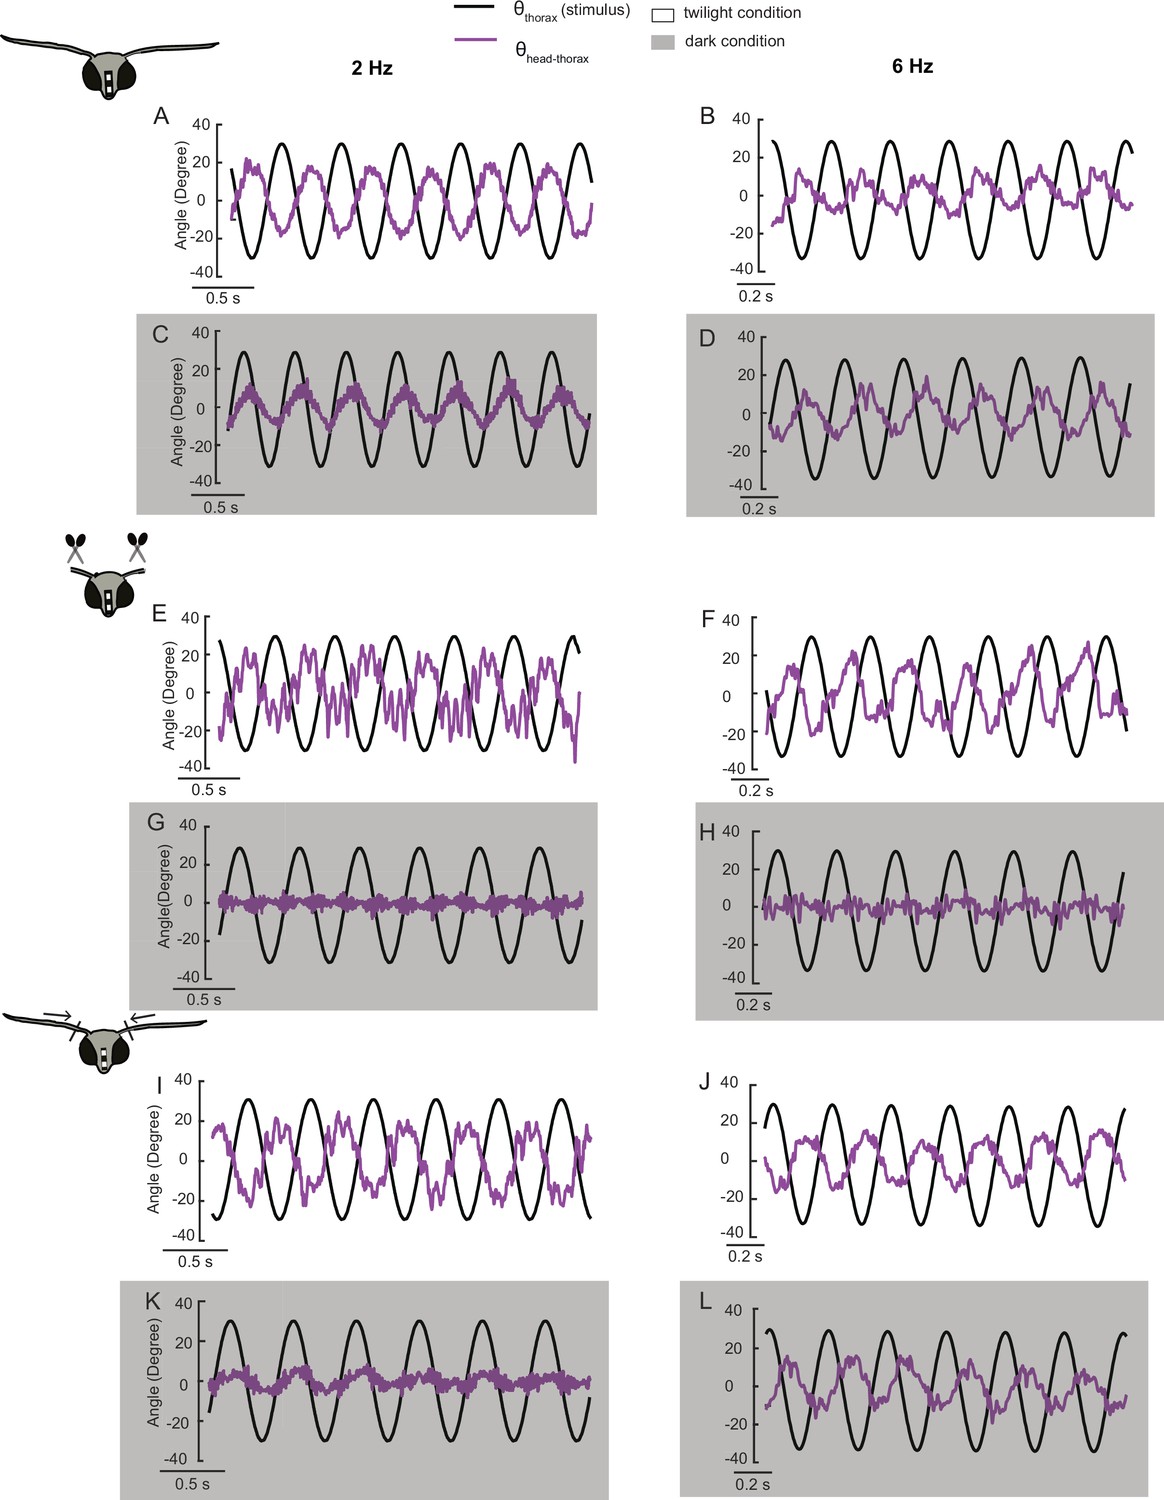
Representative time-domain plots in twilight and dark conditions (gray shaded) at 2 Hz (left column) and 6 Hz (right column) in flagella-intact (A–D), flagella-clipped (E–H), and flagella-reattached (I–L) groups.
Figure 3—figure supplement 2
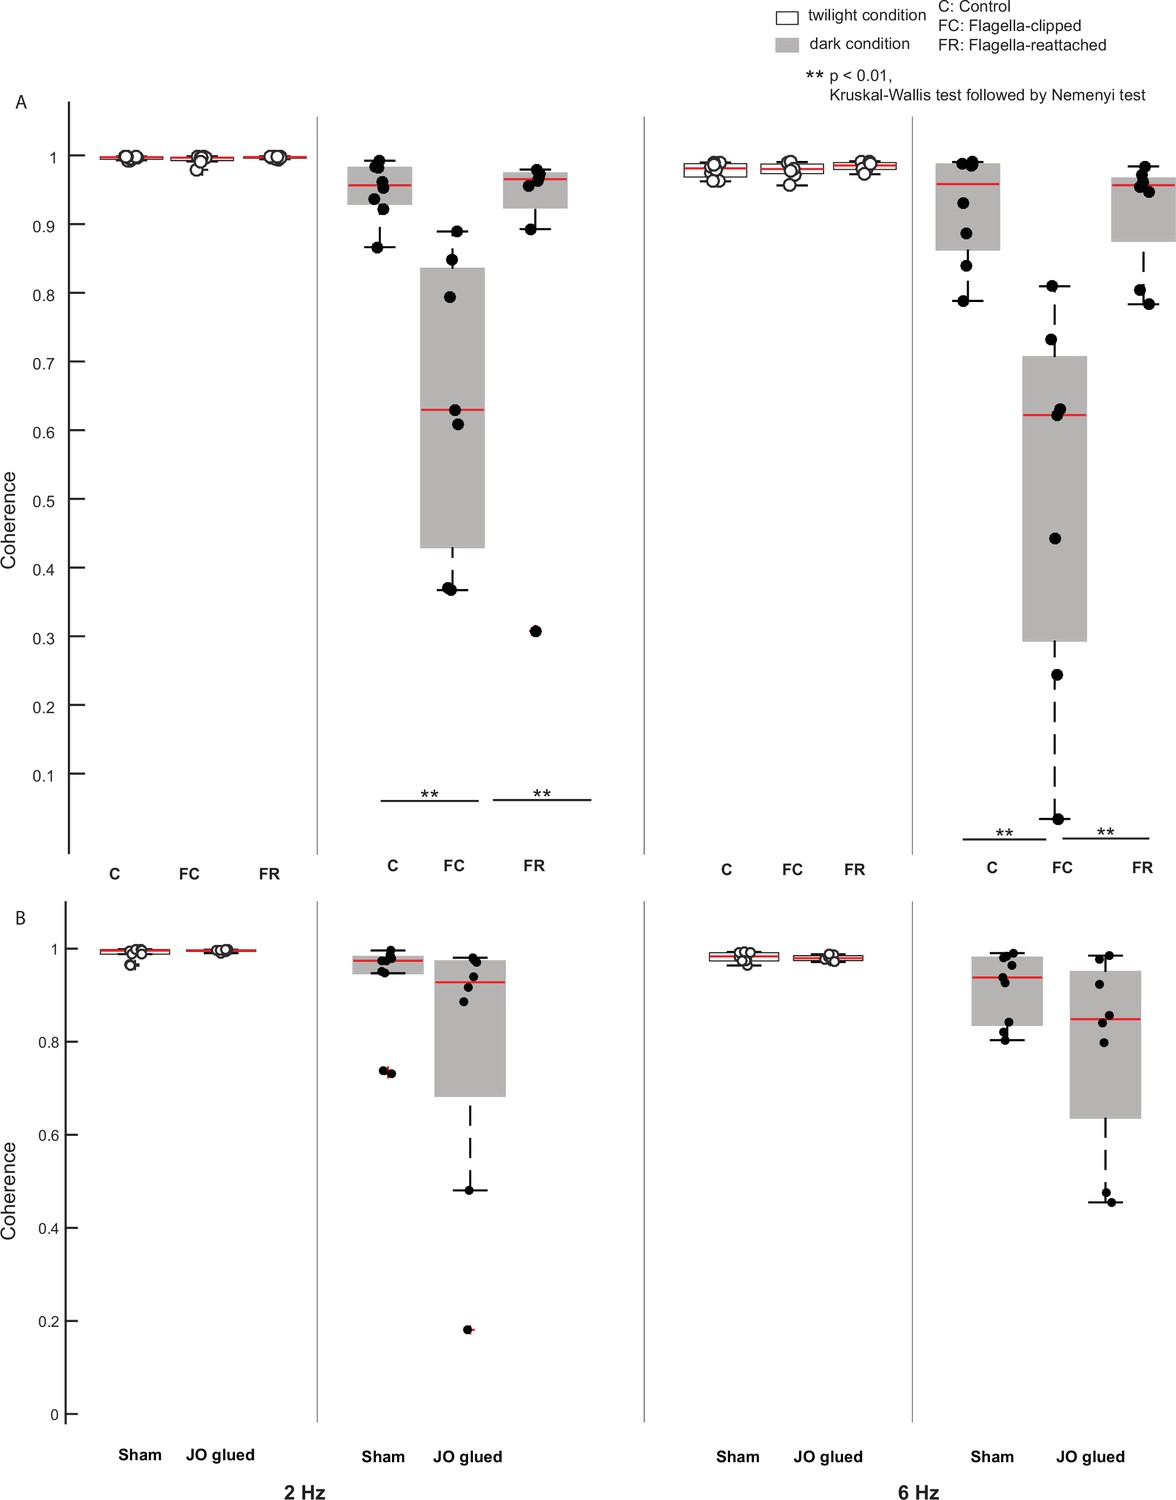
Coherence estimates of different treatments.
(A) Boxplots comparing coherence estimates in control, flagella-intact, and flagella-reattached groups for twilight and dark trials (shaded boxplots) at 2 Hz (left six boxplots) and 6 Hz (right six boxplots). (B) Boxplots comparing coherence estimated in sham and Johnston’s organ-glued groups for twilight and dark trials (shaded boxplots) at 2 Hz (left four boxplots) and 6 Hz (right four boxplots).
Figure 3—figure supplement 3
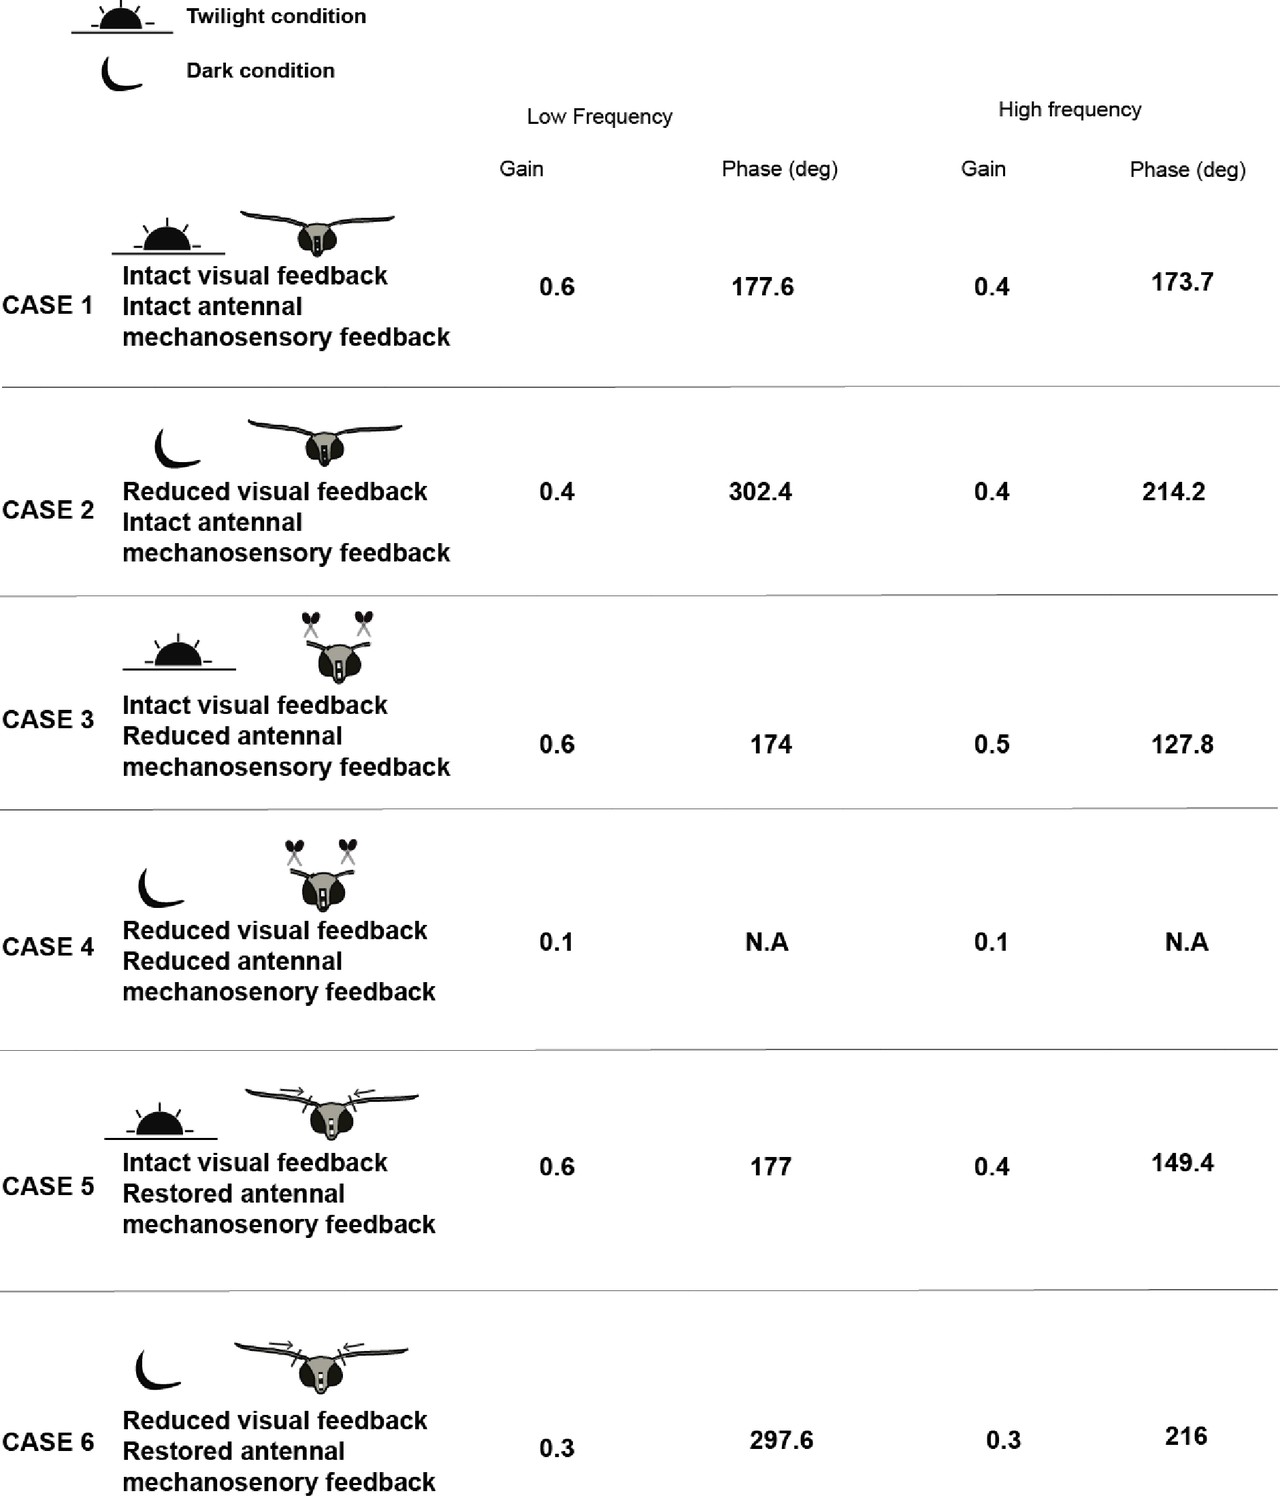
List of median values of gain and phase for the different conditions of flagella-intact, flagella-clipped, and flagella-reattached moths.
Figure 4
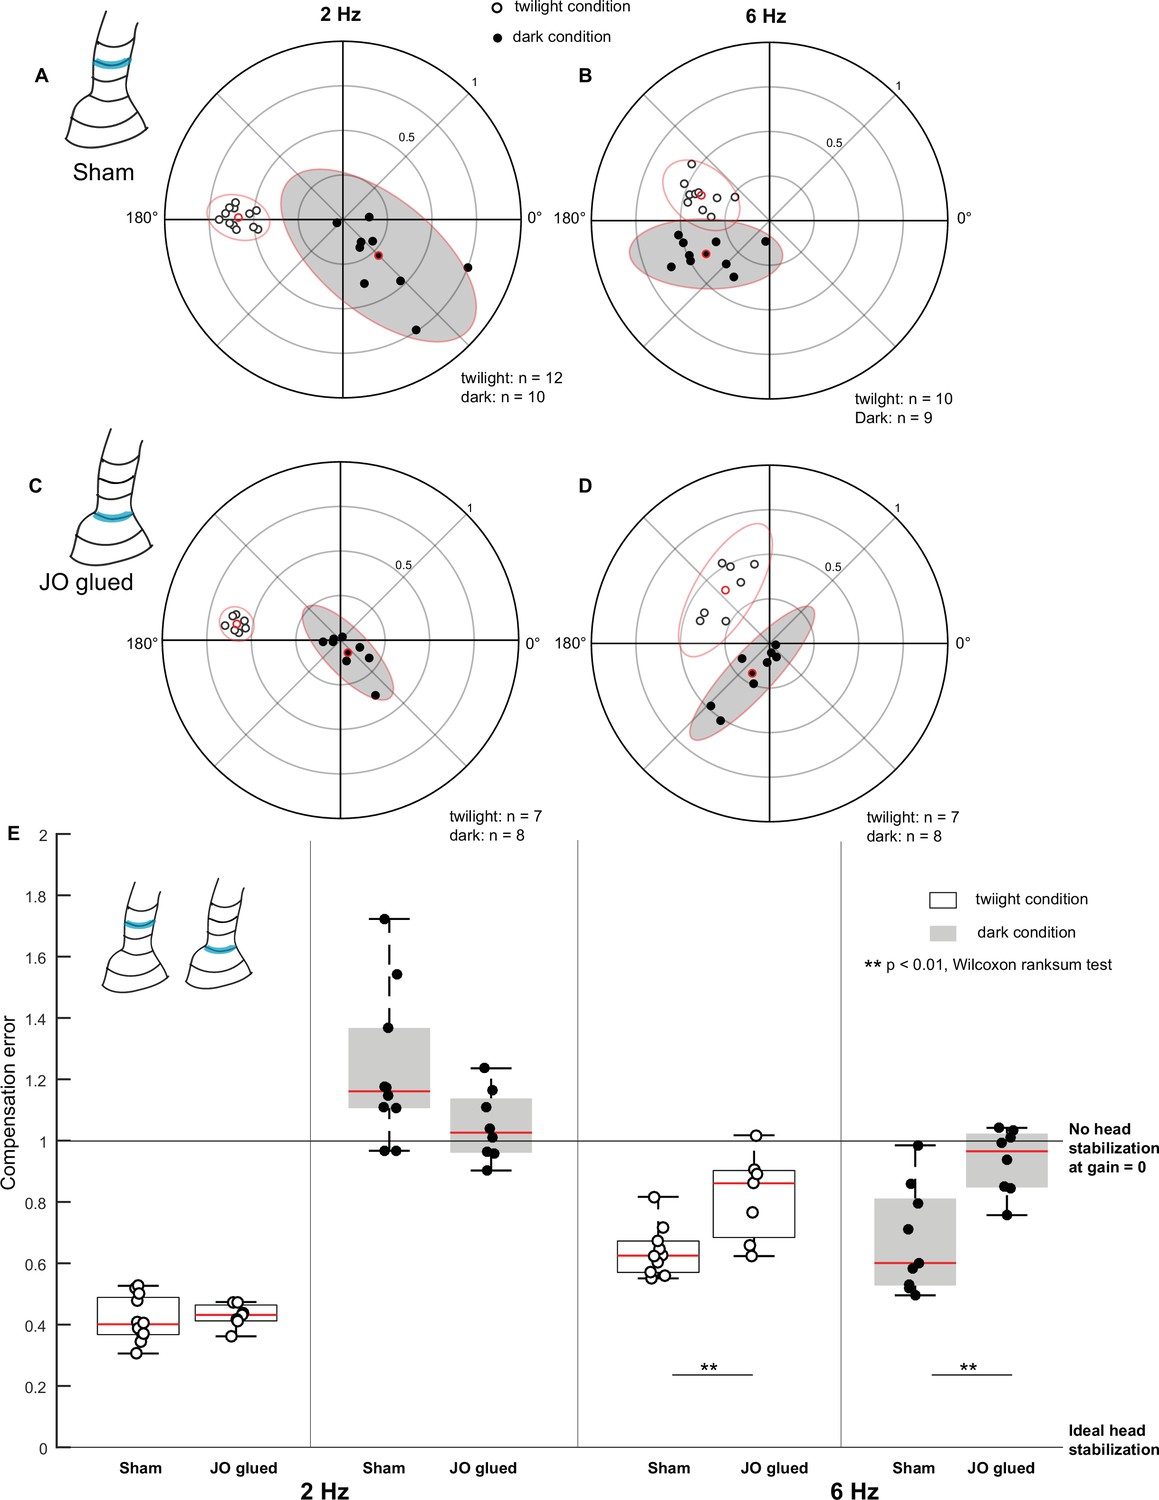
Johnston’s organ contributes to head stabilization.
(A–D) Polar scatter plots (with 95% confidence ellipses) of 2 Hz (A, C) and 6 Hz (B, D) roll frequencies in sham (A, B), and Johnston’s organ-glued (JO-glued) (C, D) moths. In each plot, the datapoints of the twilight condition is marked by open circles, the datapoints of the dark condition is marked by filled circles and the mean is highlighted in red. (E) Boxplots comparing compensation error between sham and JO-glued moths for twilight and dark trials at 2 Hz (left four boxplots) and 6 Hz (right four boxplots).
Figure 5
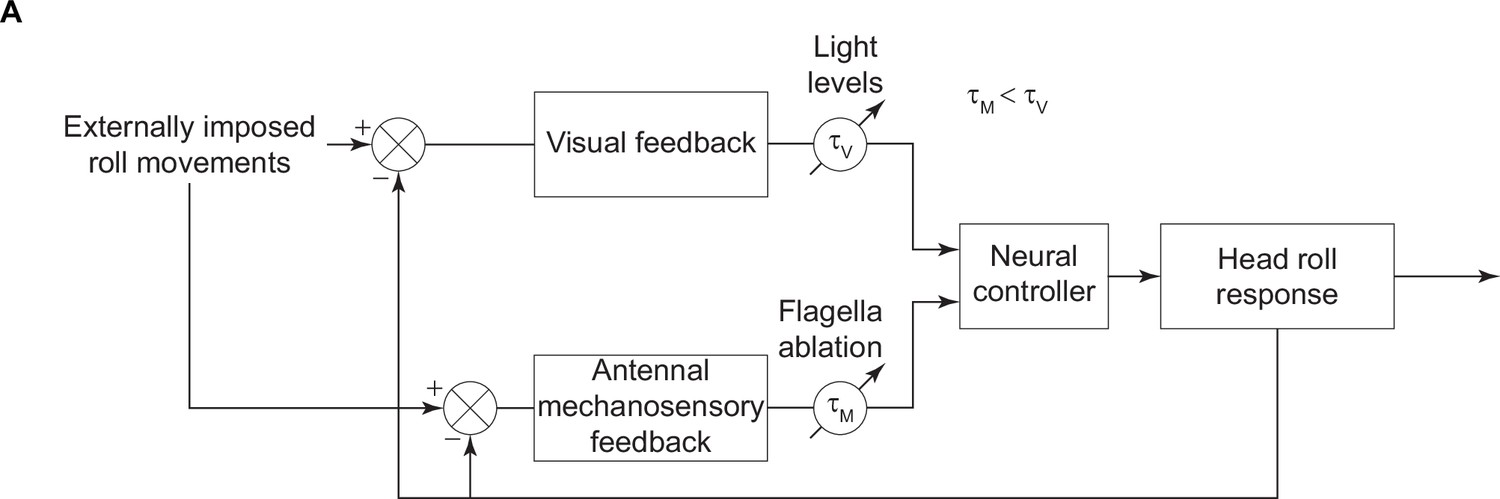
Summary figure.
A block diagram illustrating the role of visual and antennal mechanosensory feedback in the head stabilization response. The visual and antennal mechanosensory feedback sections of the loop have time delays () which vary based on illumination levels and flagella ablation state, respectively. These responses combine to elicit the head roll response.
Figure 6 with 2 supplements
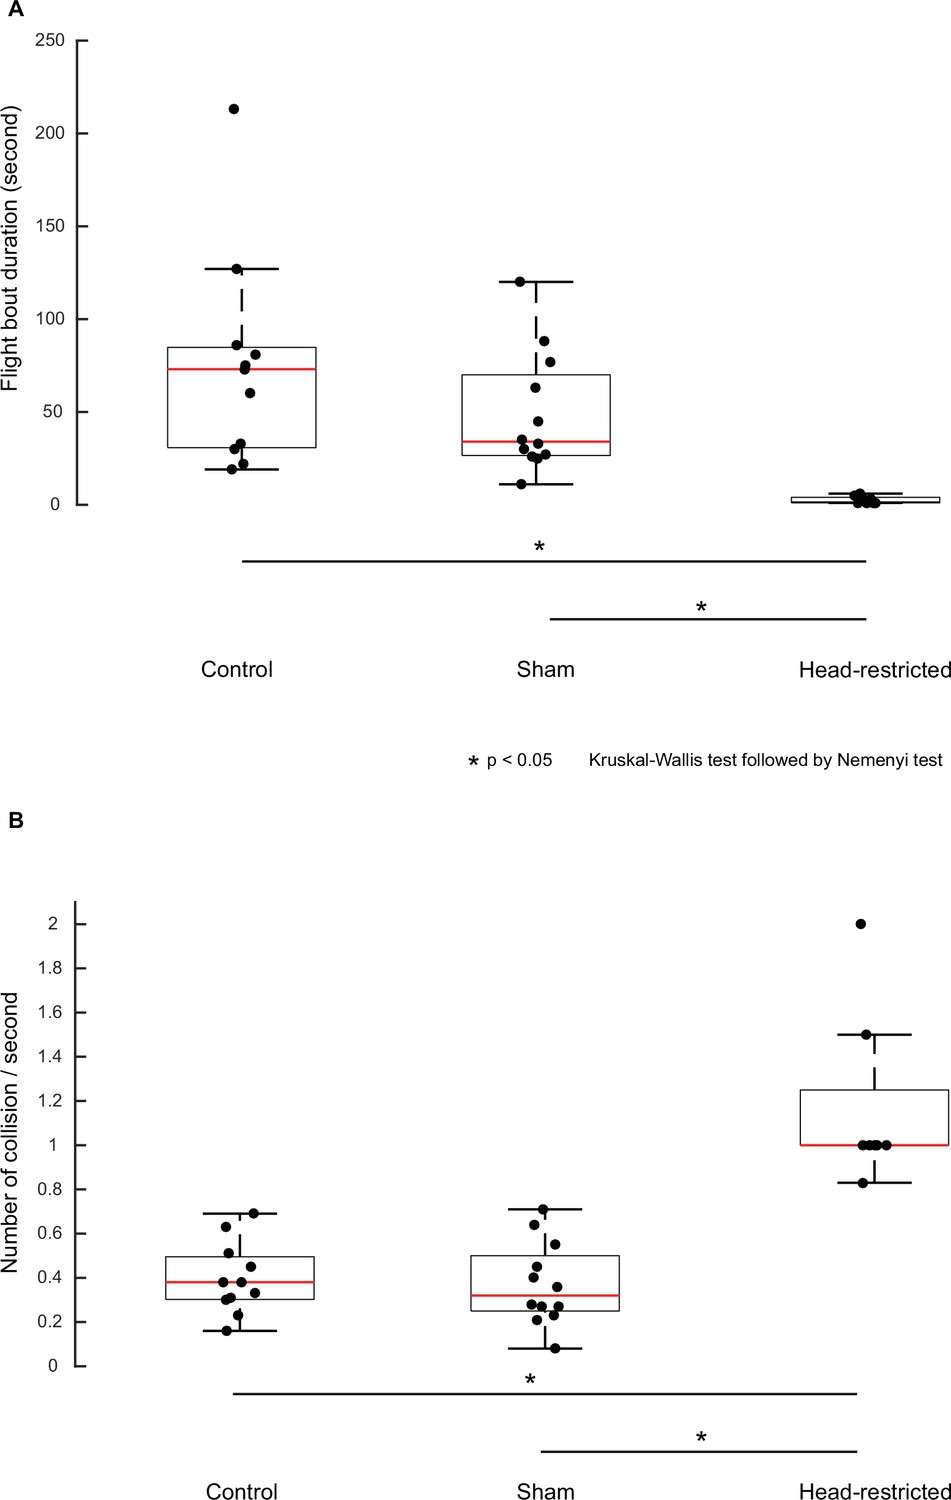
Restricting head movements impairs flight stability.
Boxplots comparing flight bout duration (A) between take-off to landing and collision frequency (B) on side walls of the flight arena between control, sham, and head-restricted moths in free-flight.
Figure 6—figure supplement 1
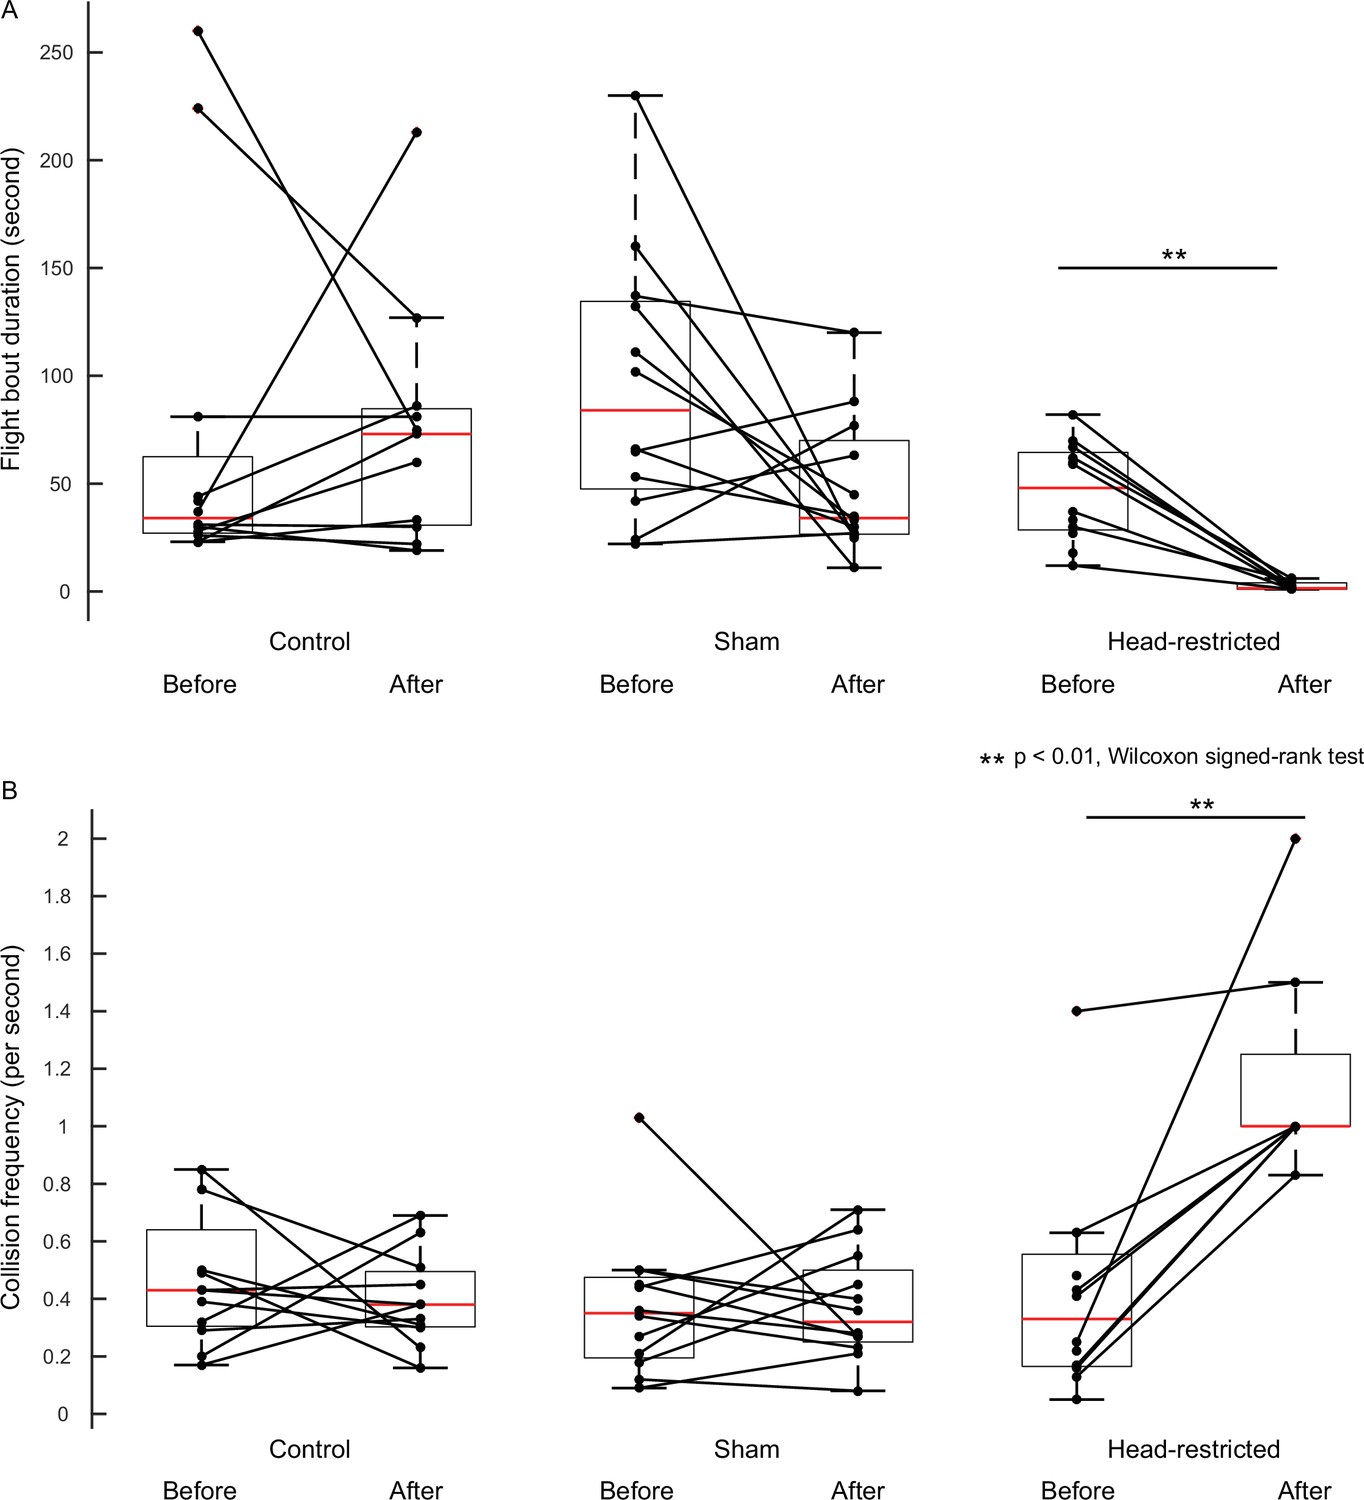
Assessment of free-flight parameters with their internal controls.
Boxplots comparing flight bout duration (A) and collision frequency (B) of experimental moths with their corresponding pre-treatment conditions (internal control).
The flight bout duration and collision frequency of the control and sham moths did not differ significantly from their corresponding pre-treatment conditions (p>0.05, Wilcoxon signed-rank test, pre-treatment: n=12, post-treatment: n=11 (control), n=12 (sham)). Both parameters differed in the head-restricted moths from their pre-treatment conditions. (p=0.0078, Wilcoxon signed-rank test, pre-treatment: n=12, post-treatment: n=8).
Figure 6—figure supplement 2
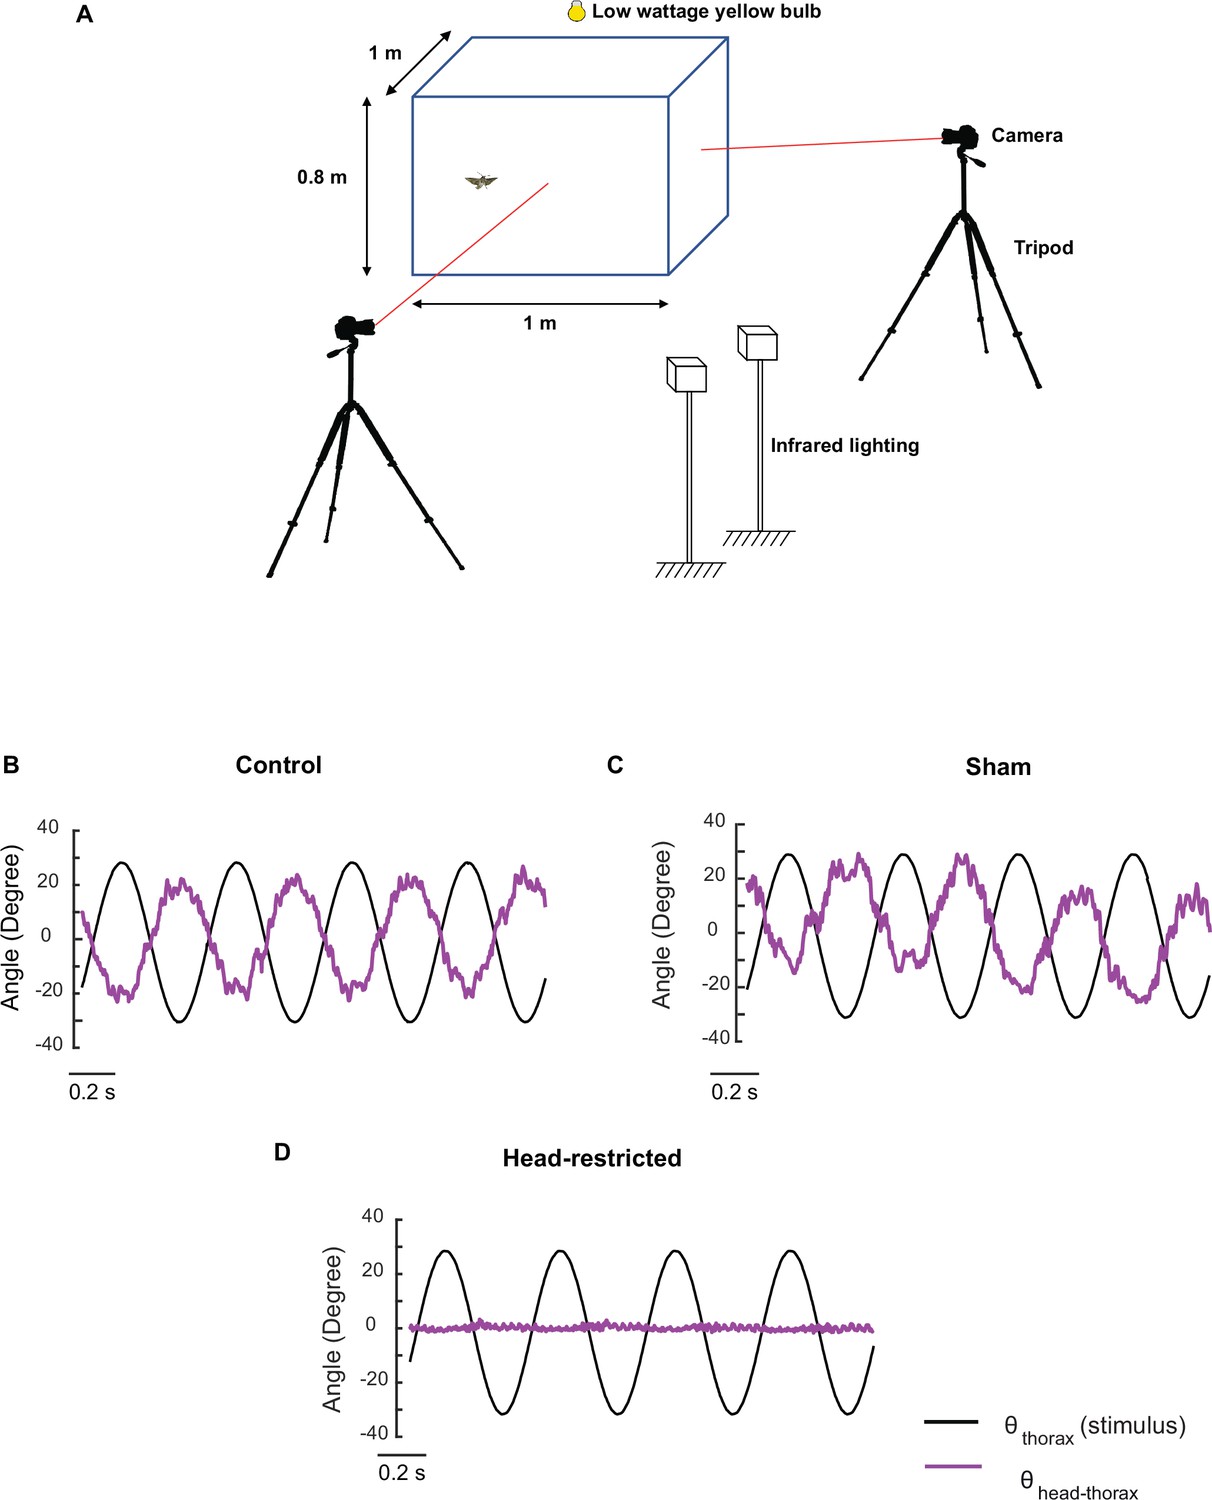
Free-flight set-up and efficacy test of head-restriction treatment.
(A) Diagrammatic representation of the free-flight assay. (B–D) Experiments on tethered moths to confirm the presence of head stabilization in the control (B) and sham (C) moths but no head stabilization in the head-restricted (D) case.
Appendix 1—figure 1

Sample size estimation for twilight vs. dark condition in Figure 2.
The minimum sample size required for having a power of 0.8 is 5. The sample size in this case: n=8 (twilight) and n=8 (dark) (frequency: 2 Hz imposed roll).
Appendix 1—figure 2
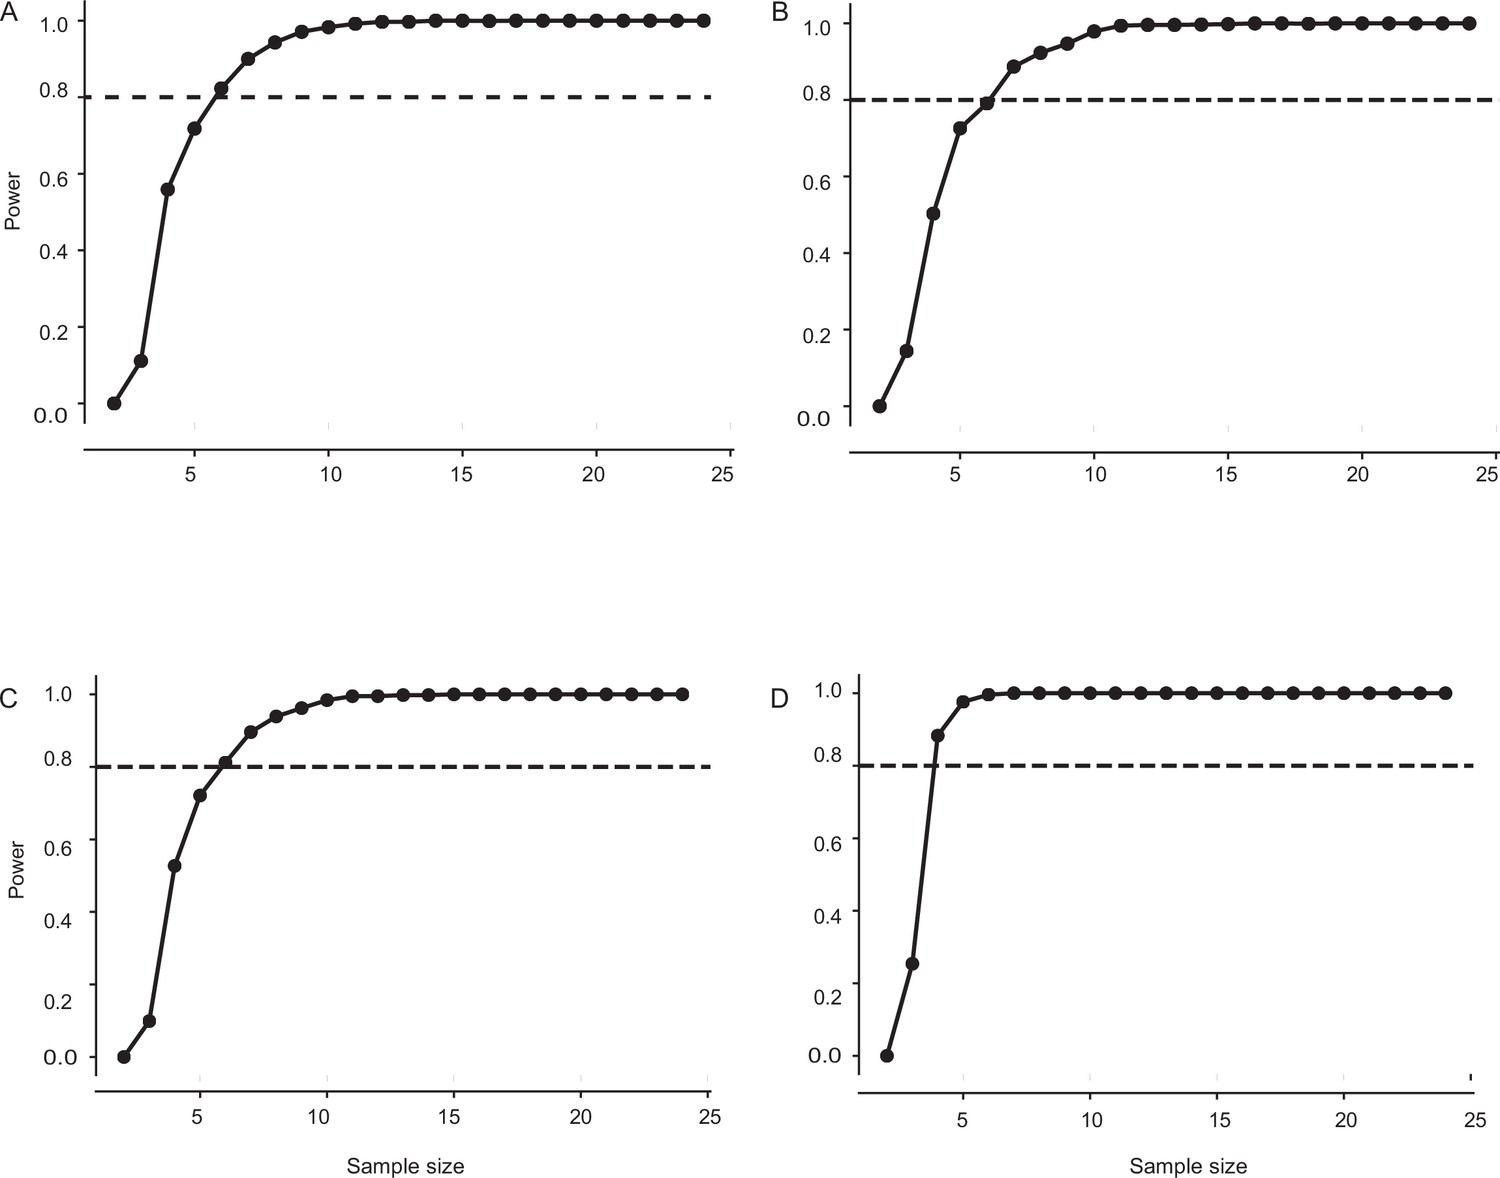
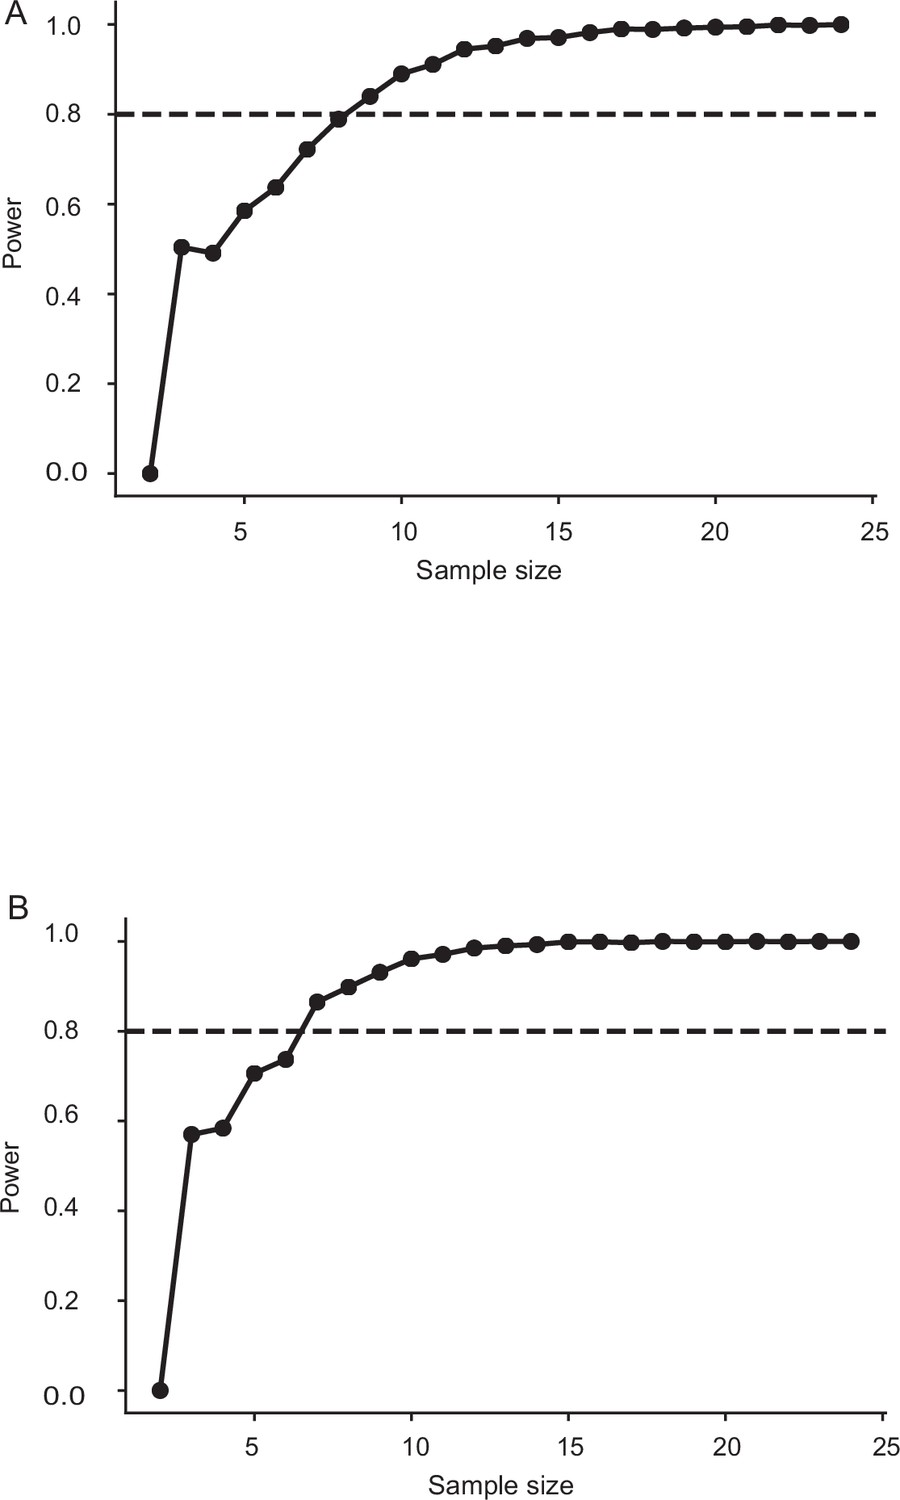
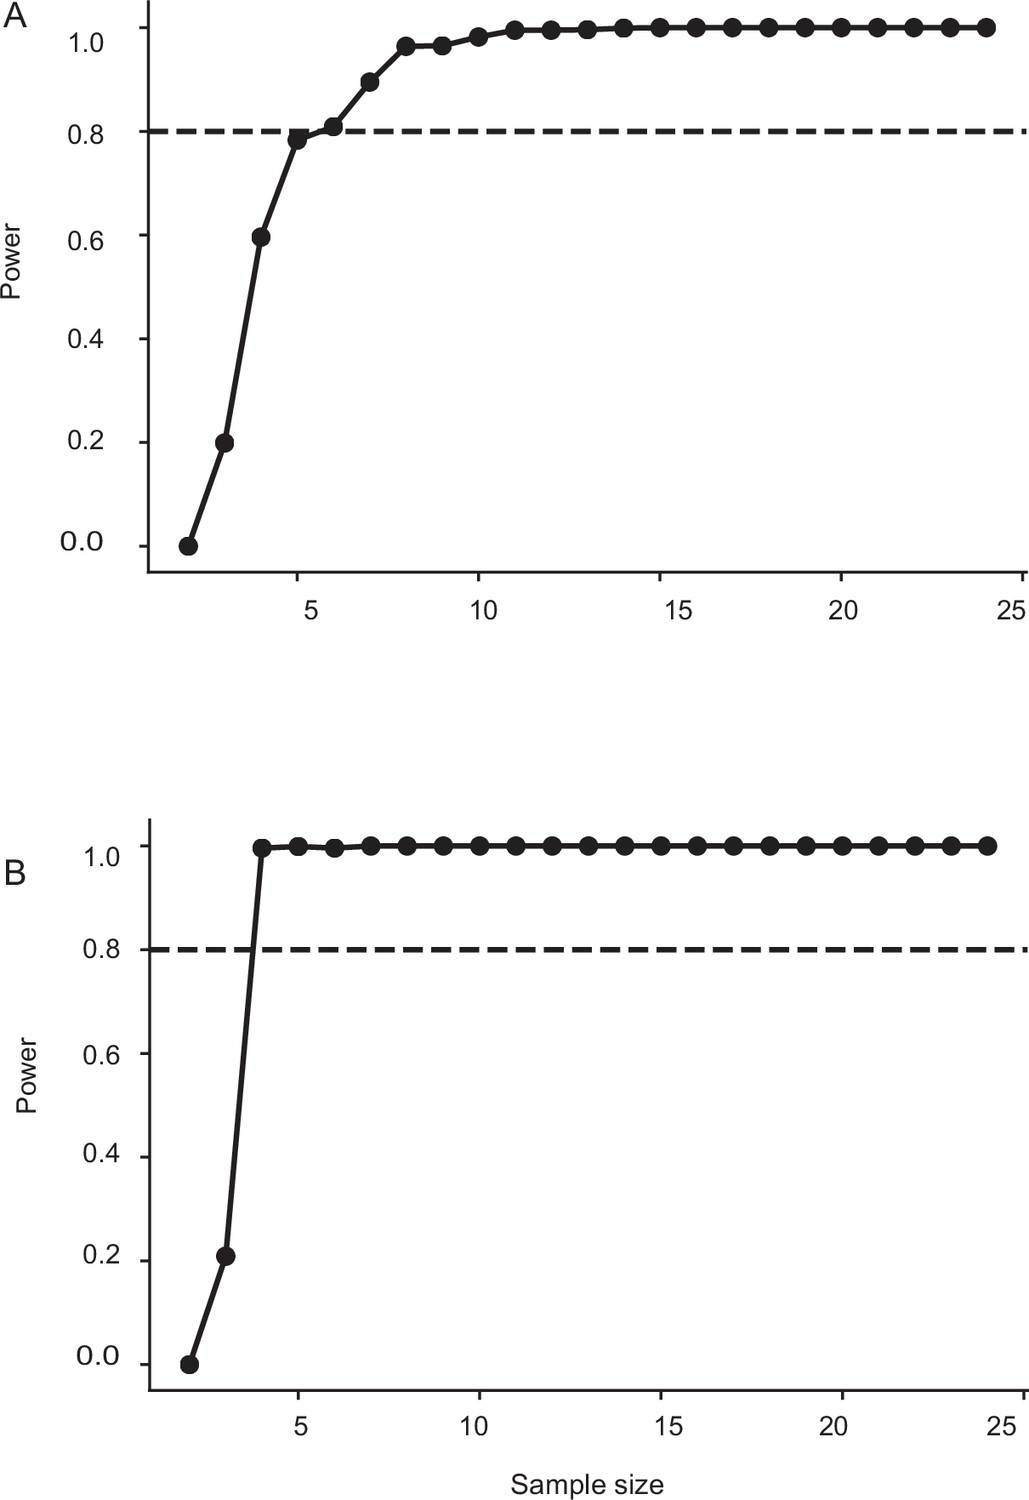
Sample size estimation for control, flagella-clipped, and flagella-reattached moths in Figure 3.
(A) The minimum sample size required for having a power of 0.8 is 6. The sample size in this case: control: n=8, flagella-clipped: n=7, flagella-reattached: n=8 (frequency: 2 Hz imposed roll, light level: twilight). (B) The minimum sample size required for having a power of 0.8 is 6. The sample size in this case: control: n=8, flagella-clipped: n=7, flagella-reattached: n=8 (frequency: 2 Hz imposed roll, light level: dark). (C) The minimum sample size required for having a power of 0.8 is 6. The sample size in this case: control: n=8, flagella-clipped: n=7, flagella-reattached: n=8 (frequency: 6 Hz imposed roll, light level: twilight). (D) The minimum sample size required for having a power of 0.8 is 4. The sample size in this case: control: n=8, flagella-clipped: n=7, flagella-reattached: n=8 (frequency: 6 Hz imposed roll, light level: dark).
Appendix 1—figure 3
Sample size estimation for sham and Johnston’s organ-glued moths in Figure 4.
The minimum sample size required for having a power of 0.8 is 9. The sample size in this case: sham: n=10, Johnston’s organ-glued: n=7 (frequency: 6 Hz imposed roll, light level: twilight). (B) The minimum sample size required for having a power of 0.8 is 7. The sample size in this case: sham: n=9, Johnston’s organ-glued: n=8 (frequency: 6 Hz imposed roll, light level: dark).
Appendix 1—figure 4
Sample size estimation for control, sham, and head-restricted moths in Figure 6.
The minimum sample size required for having a power of 0.8 is 5. The sample size in this case: control: n=11, sham: n=12, head-restricted moths: n=0.8 (flight bout duration). (B) The minimum sample size required for having a power of 0.8 is 4. The sample size in this case: control: n=11, sham: n=12, head-restricted moths: n=.8 (collision frequency).
Author response image 1
Videos
Video 1
Role of visual feedback in head stabilization.
Representative videos of flagella-intact moths under twilight and dark conditions at 2 Hz.
Video 2
Role of antennal feedback in head stabilization.
Representative videos of flagella-intact and flagella-clipped moths under dark conditions at 6 Hz.
Video 3
Role of head movements in free-flight behavior of hawkmoths.
Representative videos of control, sham moths showing stable flight, example of a side-wall collision and head-restricted moths showing unstable flight, crawling, and skidding locomotion.
Additional files
-
Supplementary file 1
(1a) List of interquartile range of compensation error. (1b) List of interquartile ranges of coherence. (1c) Details of the statistical tests used in various experiments in this paper.
- https://cdn.elifesciences.org/articles/78410/elife-78410-supp1-v2.docx
-
MDAR checklist
- https://cdn.elifesciences.org/articles/78410/elife-78410-mdarchecklist1-v2.docx
Download links
A two-part list of links to download the article, or parts of the article, in various formats.
Downloads (link to download the article as PDF)
Open citations (links to open the citations from this article in various online reference manager services)
Cite this article (links to download the citations from this article in formats compatible with various reference manager tools)
Integration of visual and antennal mechanosensory feedback during head stabilization in hawkmoths
eLife 11:e78410.
https://doi.org/10.7554/eLife.78410


