Lowland plant arrival in alpine ecosystems facilitates a decrease in soil carbon content under experimental climate warming
- Institute of Integrative Biology, ETH Zürich, Switzerland
- Climate Impacts Research Centre, Department of Ecology and Environmental Sciences, Umeå Universitet, Sweden
- Swiss Federal Institute for Forest, Snow and Landscape Research (WSL), Switzerland
- École Polytechnique Fédérale de Lausanne EPFL, School of Architecture, Civil and Environmental Engineering ENAC, Laboratory of Ecological Systems ECOS and Plant Ecology Research Laboratory PERL, Switzerland
- Field-Crop Systems & Plant Nutrition, Switzerland
- Faculty of Geosciences & the Environment, Université de Lausanne, Switzerland
- Grazing Systems, Agroscrope, Switzerland
- Department of Ecology & Evolutionary Biology, Princeton University, United States
- Uni. Grenoble Alpes, CNRS, Uni. Savoie Mont Blanc, LECA, Laboratoire d’Ecologie Alpine, France
- Centre of Microbiology & Environmental Systems, Division of Terrestrial Ecosystem Research, University of Vienna, Austria
- International Institute for Applied Systems Analysis, Ecosystem Services and Management Program, Austria
Figures
Figure 1 with 1 supplement
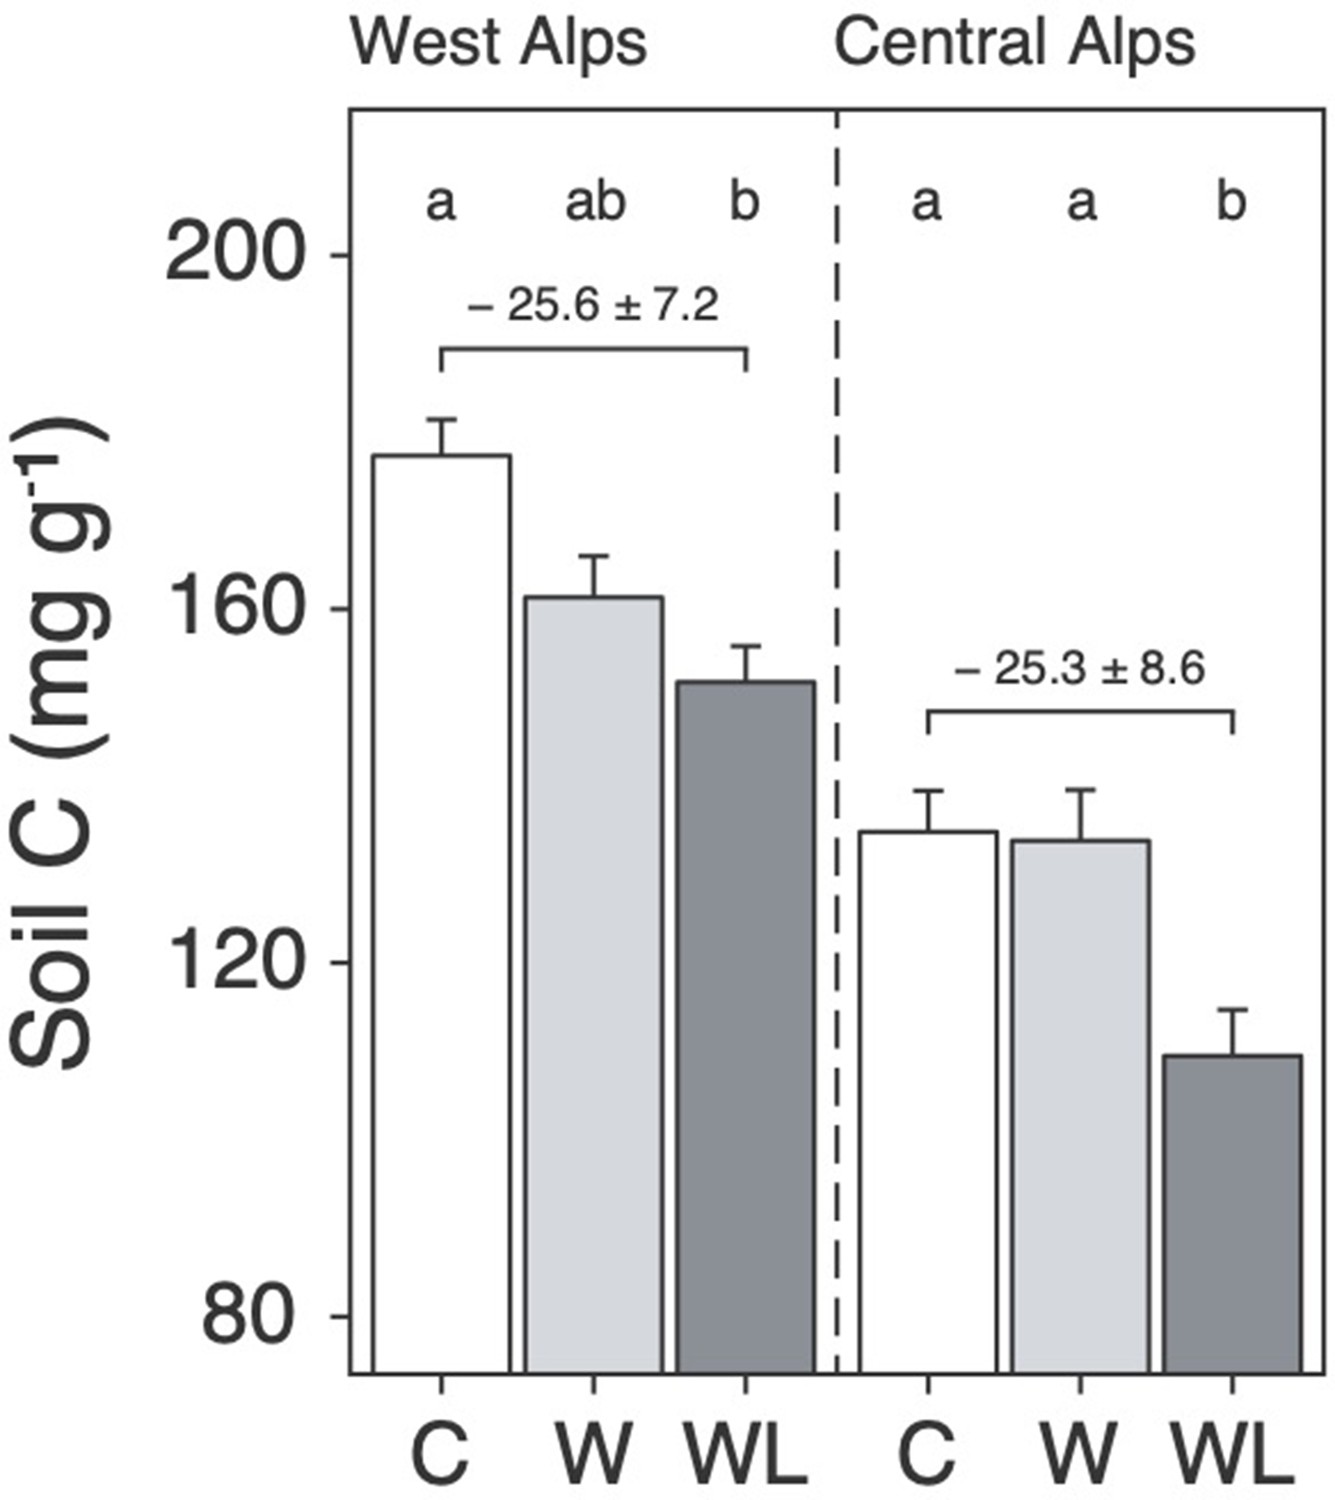
Warming and lowland plant effects on alpine soil carbon content in the field experiment.
Mean ± standard error (SE) soil carbon content (mg C g−1 dry mass; i.e. mass-based per-mil) in alpine turfs transplanted to low elevation (warming, W; light grey), transplanted plus planted with lowland plants (warming plus lowland plant arrival, WL; dark grey), or replanted at high elevation (control, C; white). Data are displayed for two experiments in the western (left) and central (right) Alps, with letters indicating treatment differences (linear mixed effects models; N = 58).
Figure 1—figure supplement 1
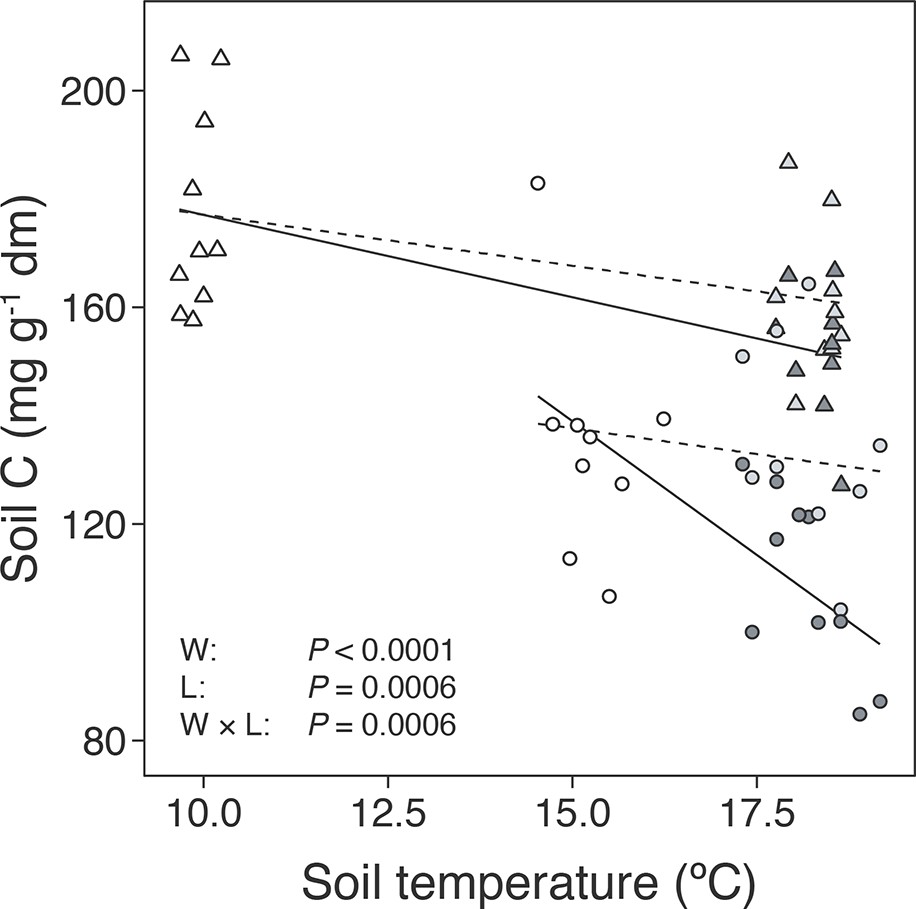
Soil temperature and lowland plant effects on alpine soil carbon content.
Relationship between soil temperature (°C) and soil carbon content (C; mg g−1 dry mass) in alpine turfs exposed to warming (W; light grey), warming plus lowland plants (WL; dark grey), or an ambient control (C; white). Statistics describe effects of warming (W; LR = 17.65, p < 0.0001), lowland plants (L; LR = 11.77, p = 0.0006), and their interaction (W × L; LR = 11.72, p = 0.0006) from one linear mixed-effects model (N = 78), but are visualized with separate fit lines (including slopes) for C–W (dashed lines) and C–WL (solid lines) comparisons in the western Alps (triangles) and central Alps (circles) field experiments.
Figure 2

Differences between lowland and alpine plant traits in the glasshouse experiment.
Mean ± standard error (SE) pot-level traits for alpine (A) and lowland (L) plant treatments in a glasshouse experiment. (a) Aboveground biomass (AGB; g; N = 19). (b) Belowground biomass (BGB; g; N = 10). (c) Root-to-shoot ratio (N = 19). Biomass-weighted (d) specific leaf area (SLA; cm2 g−1; N = 18), (e) maximum photosynthetic capacity (Amax; µmol m2 s−1; N = 19), and (f) maximum stomatal conductance (gs; µmol m2 s−1; N = 20). Treatment effects (p < 0.05) are indicated by asterisks (LMEs; see Supplementary file 2).
Figure 3

Lowland and alpine plant effects on alpine soil microbes in the glasshouse experiment.
Effects of alpine (A) versus lowland (L) plant treatments on alpine soil microbes in a glasshouse experiment (mean ± standard error [SE]; grey points/ribbons: SEs for bare soil). (a) Total microbial respiration (R; µg C g−1 dry mass h−1) during follow-up incubations without plants (N = 260). (b) Size (µg C g−1 dry mass) and (c) decay rate (µg C g−1 dry mass d−1) of a carbon pool identified using two-pool models (N = 16). (d) Microbial biomass carbon (Cmic; mg C g−1 dry mass; N = 18). For (a), vertical line indicates time before which A–L comparison differed (LME, Tukey; see Main text). For (b–d), treatment effects (p < 0.05) are indicated by asterisks (LMEs; see Supplementary file 2).
Figure 4
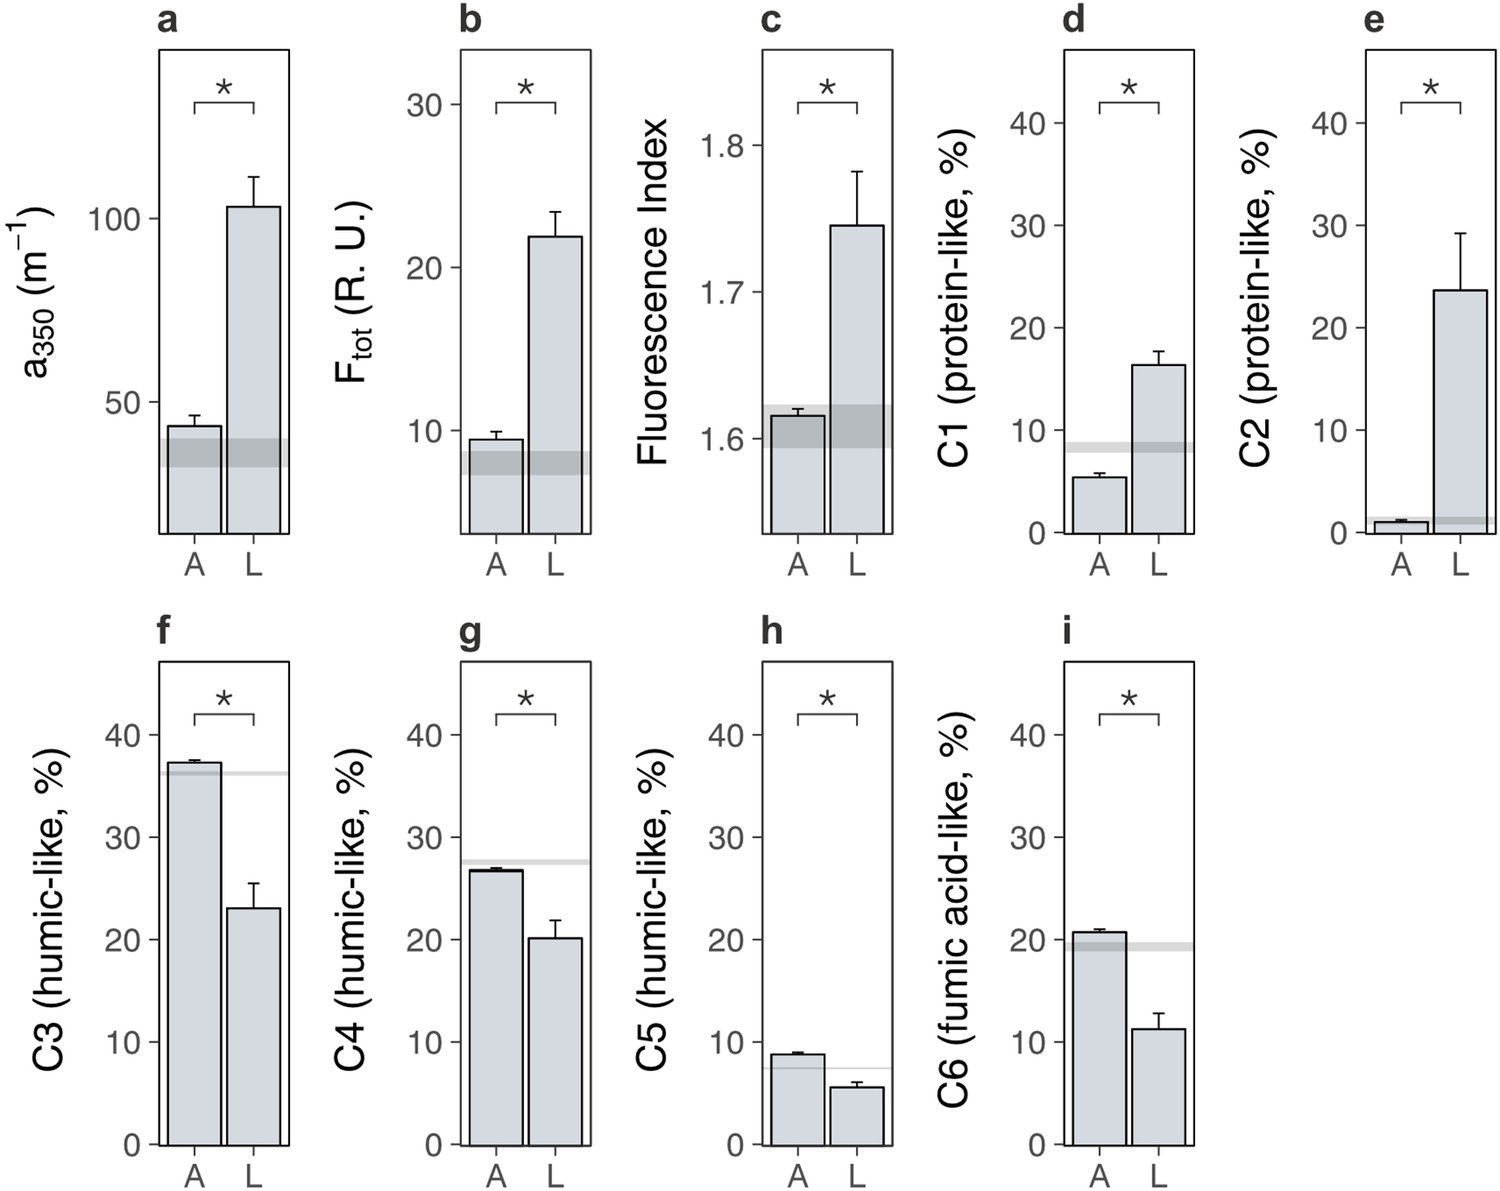
Lowland and alpine plants effects on alpine soil dissolved organic matter in the glasshouse experiment.
Effects of alpine (A) versus lowland (L) plant treatments on alpine soil dissolved organic matter extracted from soil pore water in a glasshouse experiment (mean ± standard error [SE]; grey ribbons: SEs for bare soil). (a) Absorbance (a350; m−1), (b) total fluorescence (Ftot; Raman Units) and (c) fluorescence index (FI) (N = 20). (d–i) Relative abundance (%) of six dissolved organic matter components (C1–C6), where components and associated compound families were derived from PARAFAC modelling (Materials and methods; Supplementary file 4). Treatment effects (p < 0.05) are indicated by asterisks (LMEs; see Supplementary file 2).
Figure 5

Warming and lowland plant effects on alpine ecosystem carbon dioxide fluxes in the field experiment.
Effects of transplantation to low elevation (warming, W), transplantation plus lowland plants (warming plus lowlands, WL), or replantation at high elevation (control, C) on alpine ecosystem carbon dioxide fluxes (mean ± standard error [SE]) during one season. (a) Net ecosystem CO2 exchange (NEE; g CO2 m−2 hr−1). (b) Gross primary production (GPP; g CO2 m−2 hr−1). (c) Ecosystem respiration (ER; g CO2 m−2 hr−1). Measurements were taken in situ at both experiments on multiple dates (western Alps: N = 196, central Alps: N = 90), with negative values indicating carbon uptake into the ecosystem. Treatment effects (p < 0.05) are indicated by letters (LMEs, Tukey; see Supplementary file 1).
Figure 6
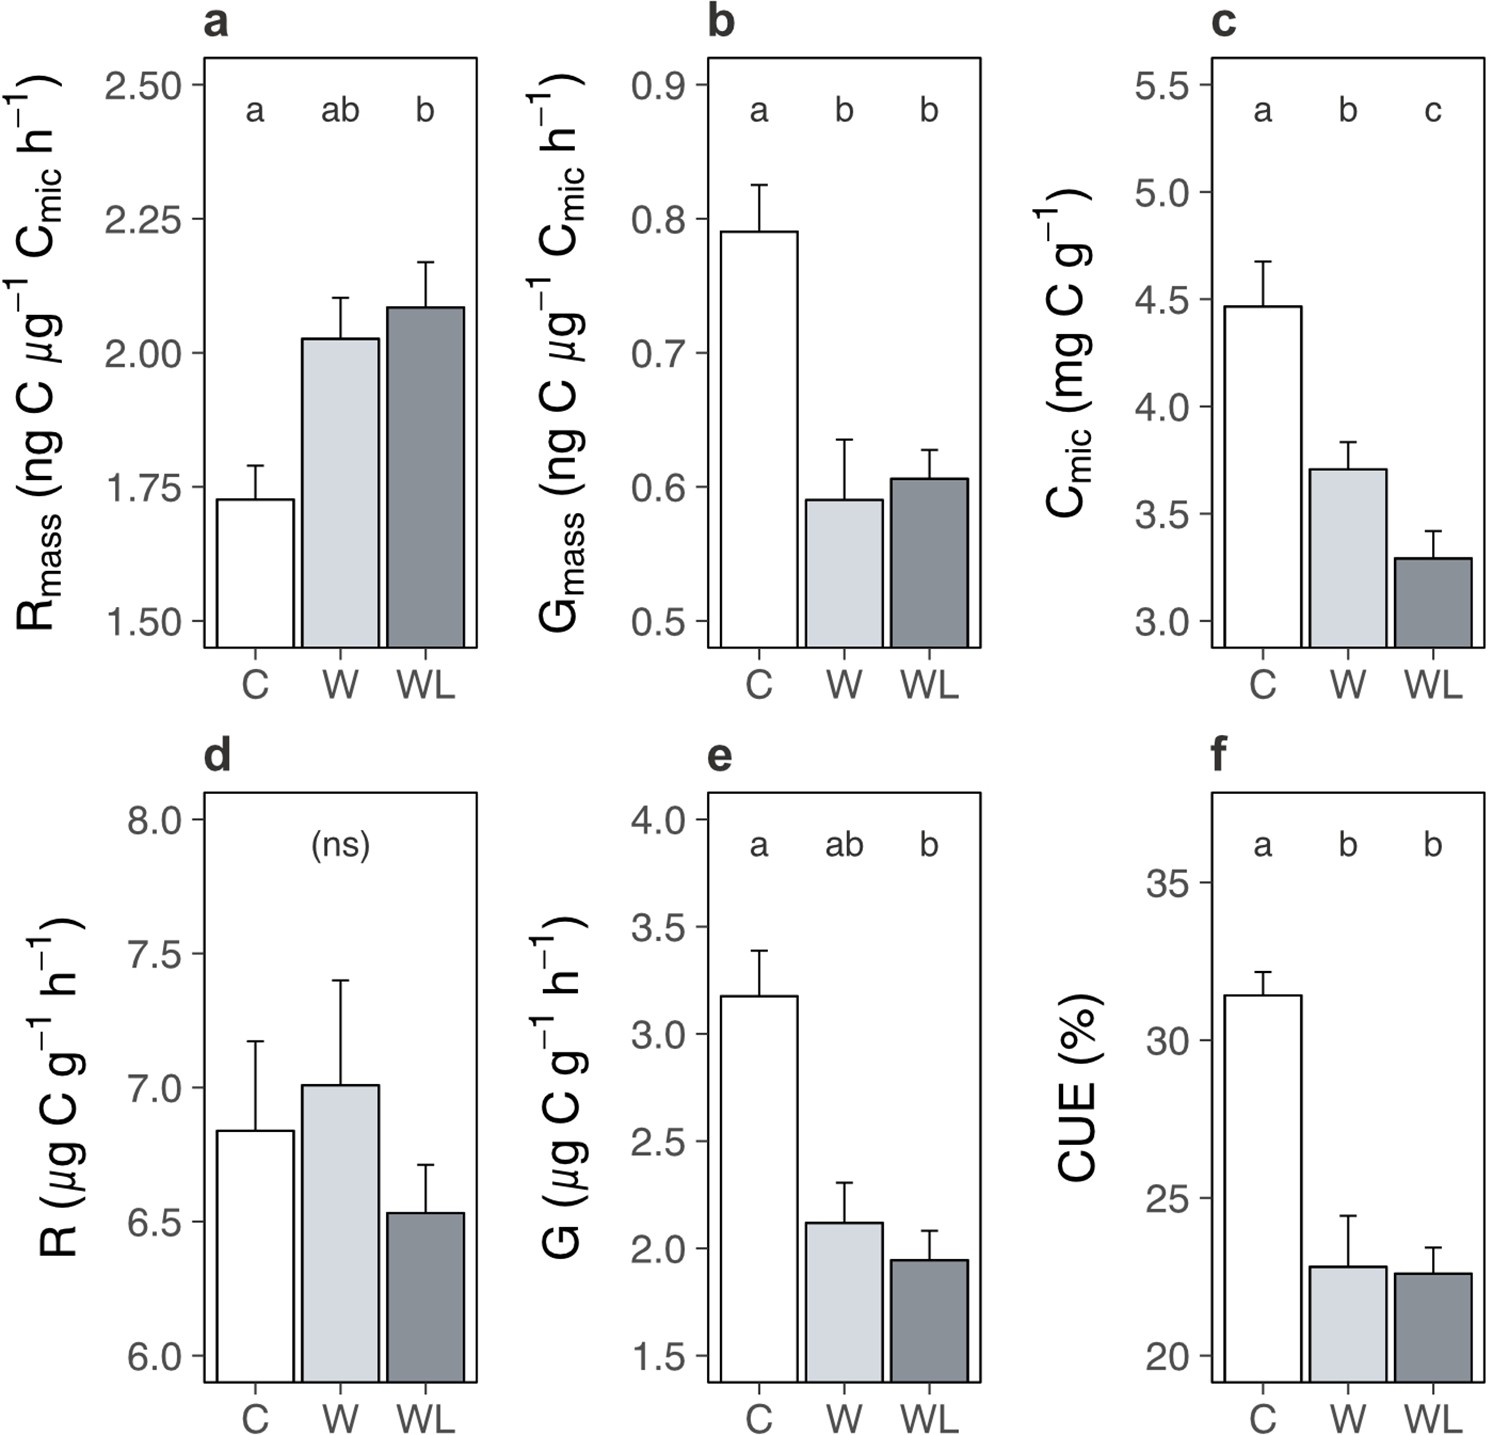
Warming and lowland plant effects on the alpine soil system in the field experiment.
Effects of transplantation to low elevation (warming, W), transplantation plus lowland plants (warming plus lowlands, WL), or replantation at high elevation (control, C) on alpine soil pools and processes (means ± standard errors [SEs]) after one season. (a) Biomass-specific microbial respiration (Rmass; ng C µg−1 Cmic hr−1). (b) Biomass-specific microbial growth (Gmass; ng C µg−1 Cmic hr−1). (c) Cmic (µg C g−1). (d) Total microbial respiration (µg C g−1 h−1). (e) Total microbial growth (µg C g−1 h−1). (f) Microbial carbon use efficiency (CUE; %). Measurements were taken on soils sampled on one date, for (f) at both experiments (western Alps: N = 28; central Alps: N = 30) and for all other variables at the western Alps experiment (N = 28). Treatment effects (p < 0.05) are indicated by letters (LMEs, Tukey; see Supplementary file 1).
Appendix 1—figure 1
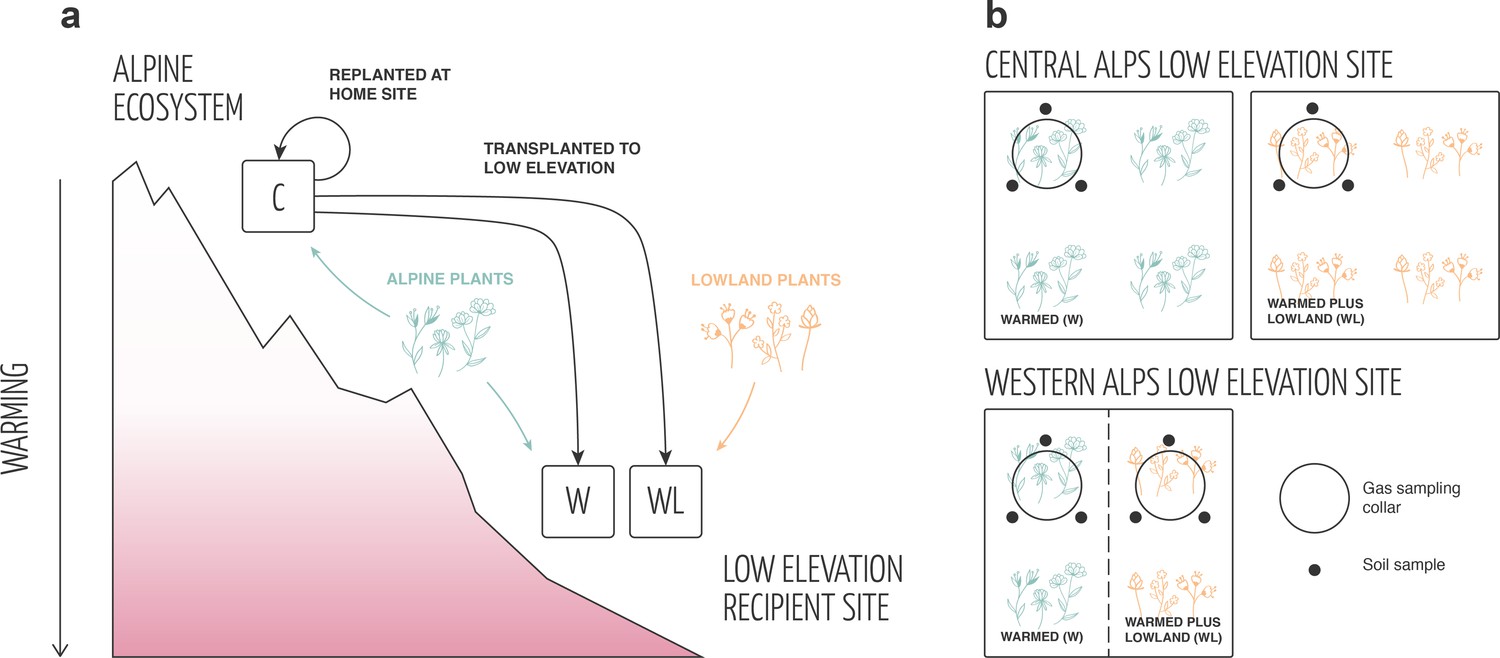
Experimental design.
(a) In both field experiments, intact alpine turfs containing alpine plant communities plus rhizosphere soil were removed from their high-elevation home sites and either replanted at the home site (negative control; C) or transplanted to a low-elevation recipient site to simulate climate warming (W, WL). At low elevation, half of the turfs were planted with a low abundance of lowland plant species to additionally simulate the arrival of migrating plant species in the ecosystem (WL). Both other treatments (i.e. C, W) were planted with the same abundance of alpine plant species as a disturbance control. (b) The layout of W and WL treatments at the low-elevation site differed between western and central alps experiments. In the central alps, W and WL treatments were established in distinct turfs planted adjacently in a block design (N = 10). In the western alps, W and WL treatments were established in different halves of the same turf in a split-plot design (N = 10).
Appendix 1—figure 2
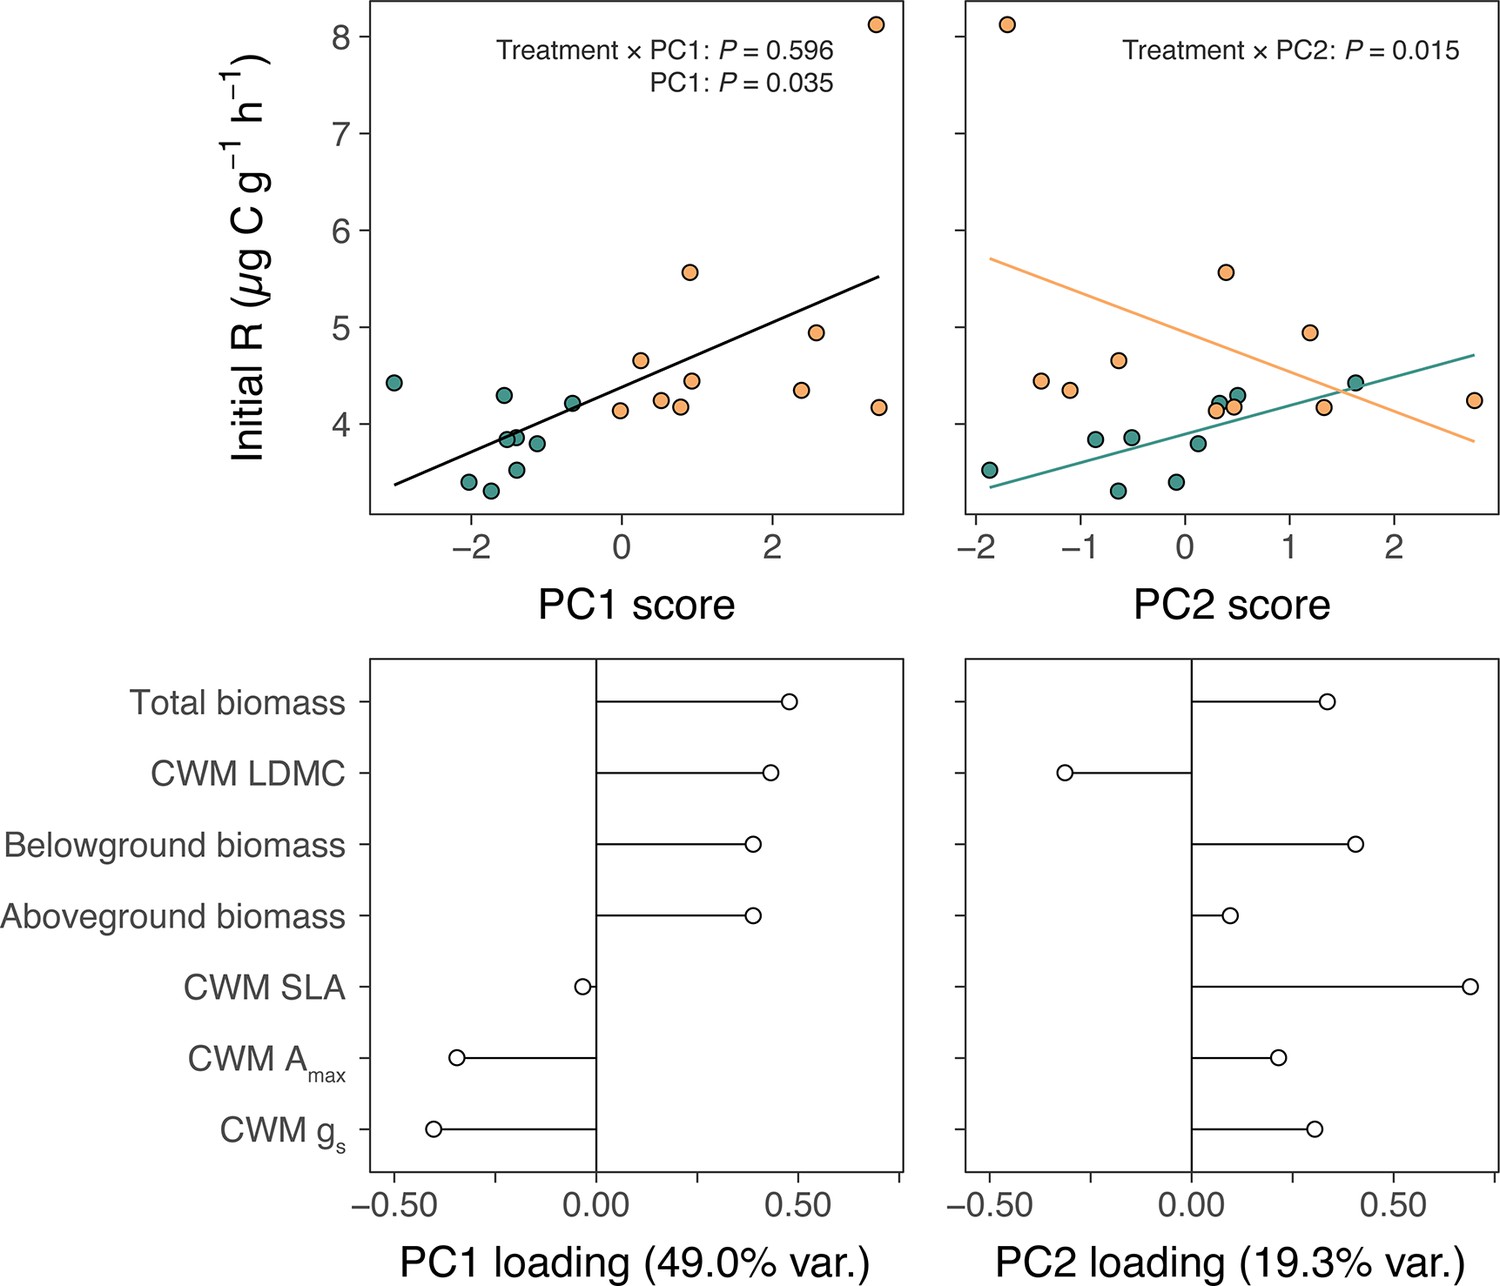
Alpine and lowland plant effects on alpine soil microbial respiration.
Relationships between plant physiology, expressed as (a) PC1 and (b) PC2 scores from PCAs of pot-level measurements, and rates of soil microbial respiration during the first nine days of incubation (initial R; µg C g−1 h−1) in alpine (green) versus lowland (yellow) treatments of the glasshouse experiment. Fit lines describe relationships as determined by a single linear mixed-effects model including treatment, PC1, PC2, and treatment × PC# interactions (N = 20; Main Text), with different colours in (b) indicating a significant treatment × PC2 interaction. Loadings of plant physiological measurements on (c) PC1 and (d) PC2 axes. Total, belowground, and aboveground biomass are sums of all plants per pot and specific leaf area (SLA), maximum photosynthetic capacity (Amax), and stomatal conductance (gs) are pot-wise community-weighted mean (CWM) values.
Appendix 1—figure 3

Alpine and lowland plant effects on soil carbon content.
Trait separation of lowland (yellow) and alpine (green) plant species, displayed as PC1 and PC2 scores from PCAs containing (a) TRY data for species in field experiments (N = 242; F1,240 = 3.98, p = 0.003) or (b) measured data from a glasshouse experiment on selected species (N = 109; F1,107 = 17.69, p = 0.001). Arrows show loadings and p values refer to alpine–lowland comparison (PERMANOVAs). Relationships between soil carbon loss (% initial soil carbon content remaining) and cover (cm2) of each lowland plant species in the (c) western Alps (N = 36; LME: LR = 0.62, p = 0.4302) and (d) central Alps (N = 80; LME: LR = 0.33, p = 0.5666) experiments, (e) total lowland plant cover (cm2; N = 19; see Main text) and (f, g) alpine plant community composition (% change in NMDS axes; N = 18; linear models: NMDS #1: F1,14 = 1.19, p = 0.2934, NMDS #2: F1,14 = 3.17, p = 0.0966; region: F1,14 = 1.29, p = 0.2755). For (c, d), non-significant species-wise fit lines (yellow) are also displayed.
Appendix 1—figure 4

Soil inoculation effects on alpine soil community composition.
Effects of low-elevation soil biota inoculation on (a) bacterial and (b) fungal community composition in alpine plots (N = 10 in both cases). Axes show the first two components of principal coordinates analyses (PCoA; Bray–Curtis distance) performed on the relative abundances of bacterial and fungal operational taxonomic units, respectively. p values are from PERMANOVAs testing for inoculation effects on the same distance matrices.
Additional files
-
Supplementary file 1
Table showing linear mixed-effects model outputs for effects of field treatment (control, warming, warming plus lowland plants), region and their interaction on soil variables.
LR: likelihood ratio.
- https://cdn.elifesciences.org/articles/78555/elife-78555-supp1-v2.docx
-
Supplementary file 2
Table showing linear mixed-effects model outputs for treatment (alpine plants, lowland plants) effects on plant traits and soil variables in the glasshouse experiment.
LR: likelihood ratio.
- https://cdn.elifesciences.org/articles/78555/elife-78555-supp2-v2.docx
-
Supplementary file 3
Table showing statistical test outputs for lowland species identity effects on soil carbon loss.
- https://cdn.elifesciences.org/articles/78555/elife-78555-supp3-v2.docx
-
Supplementary file 4
Table showing DOM components identified through PARAFAC modelling.
- https://cdn.elifesciences.org/articles/78555/elife-78555-supp4-v2.docx
-
MDAR checklist
- https://cdn.elifesciences.org/articles/78555/elife-78555-mdarchecklist1-v2.docx
Download links
A two-part list of links to download the article, or parts of the article, in various formats.
Downloads (link to download the article as PDF)
Open citations (links to open the citations from this article in various online reference manager services)
Cite this article (links to download the citations from this article in formats compatible with various reference manager tools)
Lowland plant arrival in alpine ecosystems facilitates a decrease in soil carbon content under experimental climate warming
eLife 11:e78555.
https://doi.org/10.7554/eLife.78555


