The effect of calcium supplementation in people under 35 years old: A systematic review and meta-analysis of randomized controlled trials
- Department of Epidemiology and Biostatistics, School of Public Health and Management, Wenzhou Medical University, China
- Department of Nutrition and Food Hygiene, School of Public Health and Management, Wenzhou Medical University, China
Figures
Figure 1
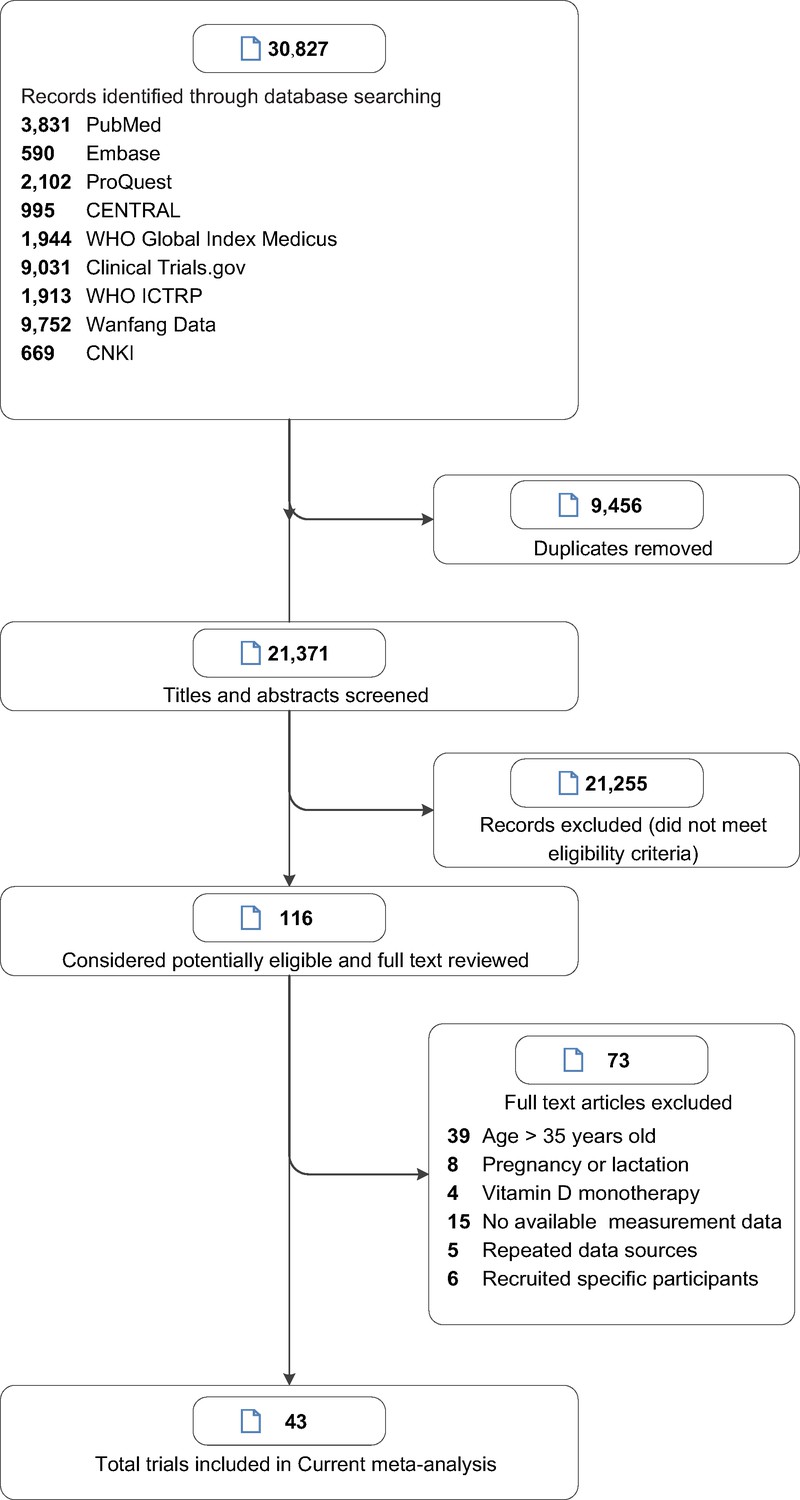
Study selection.
Figure 2
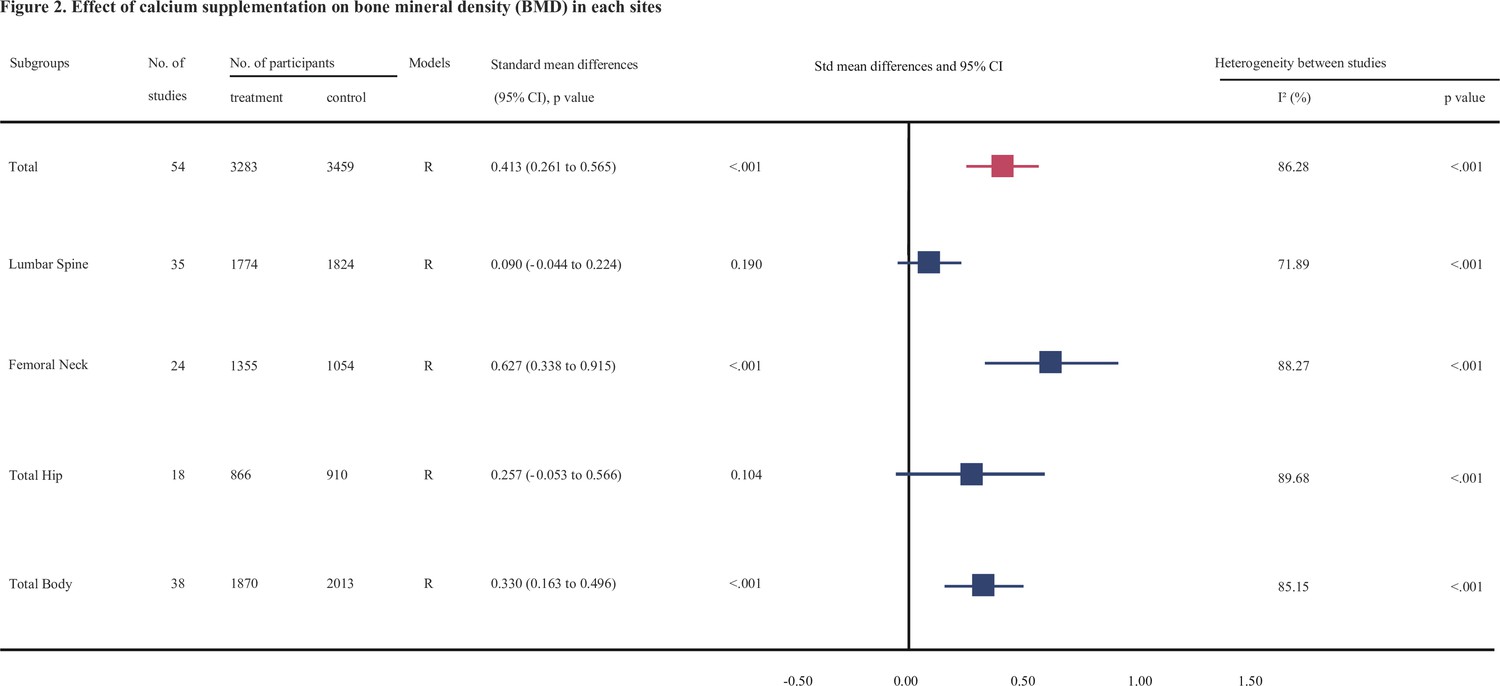
Effect of calcium supplmentation on bone mineral density (BMD) in each site.
-
Figure 2—source data 1
Forest plots for the association between calcium supplementation and the accretion of lumbar spine bone mineral density (LSBMD).
- https://cdn.elifesciences.org/articles/79002/elife-79002-fig2-data1-v1.pdf
-
Figure 2—source data 2
Forest plots for the association between calcium supplementation and the accretion of femoral neck bone mineral density (FNBMD).
- https://cdn.elifesciences.org/articles/79002/elife-79002-fig2-data2-v1.pdf
-
Figure 2—source data 3
Forest plots for the association between calcium supplementation and the accretion of total hip bone mineral density (THBMD).
- https://cdn.elifesciences.org/articles/79002/elife-79002-fig2-data3-v1.pdf
-
Figure 2—source data 4
Forest plots for the association between calcium supplementation and the accretion of total body bone mineral density (TBBMD).
- https://cdn.elifesciences.org/articles/79002/elife-79002-fig2-data4-v1.pdf
Figure 3
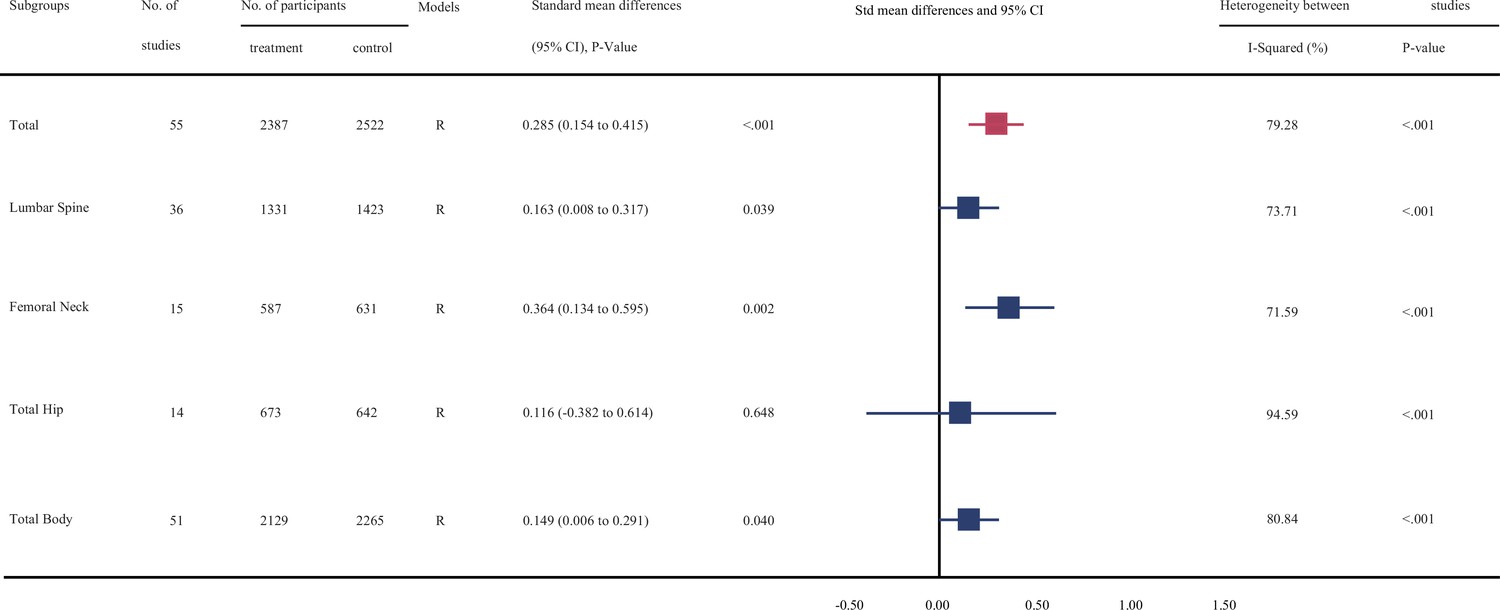
Effect of calcium supplmentation on bone mineral content (BMC) in each site.
-
Figure 3—source data 1
Forest plots for the association between calcium supplementation and the accretion of lumbar spine bone mineral content (LSBMC).
- https://cdn.elifesciences.org/articles/79002/elife-79002-fig3-data1-v1.pdf
-
Figure 3—source data 2
Forest plots for the association between calcium supplementation and the accretion of femoral neck bone mineral content (FNBMC).
- https://cdn.elifesciences.org/articles/79002/elife-79002-fig3-data2-v1.pdf
-
Figure 3—source data 3
Forest plots for the association between calcium supplementation and the accretion of total hip bone mineral content (THBMC).
- https://cdn.elifesciences.org/articles/79002/elife-79002-fig3-data3-v1.pdf
-
Figure 3—source data 4
Forest plots for the association between calcium supplementation and the accretion of total body bone mineral content (TBBMC).
- https://cdn.elifesciences.org/articles/79002/elife-79002-fig3-data4-v1.pdf
Figure 4
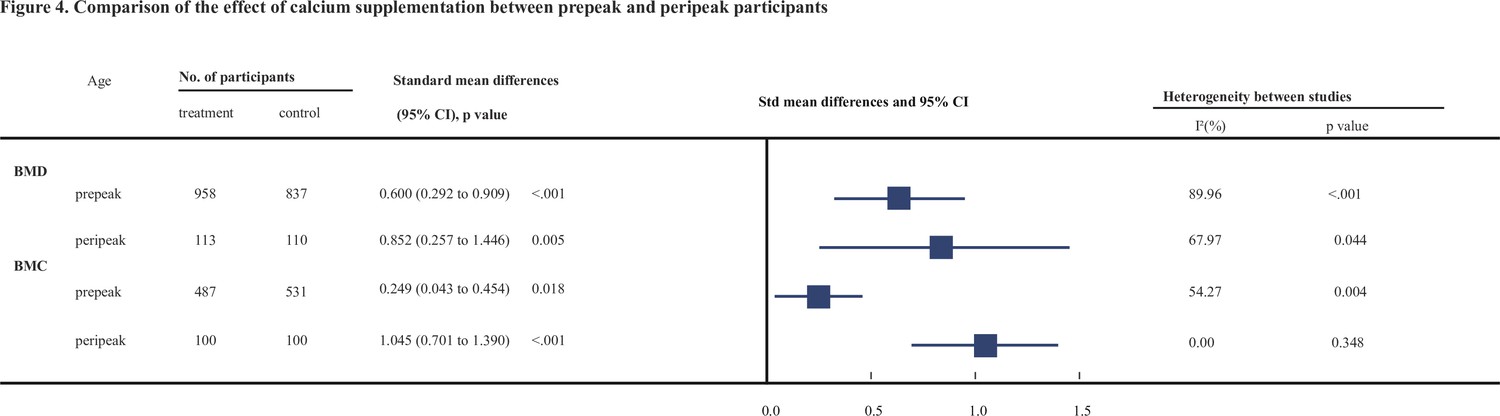
Comparison of the effect of calcium supplementation between prepeak and peripeak participants.
Tables
Table 1
Characteristics of included studies.
| Study | Supplement and Ca dose (mg/day) | Duration of supplement/ follow-up (years) | No. of subjects | Ethnicity | Female (%) | Mean (SD or range) age (years) | Mean baseline Cacium intake (mg/day) | Site measured | |
|---|---|---|---|---|---|---|---|---|---|
| Bonjour et al., 1997 | Milk extract, 850 | 1/2 | 144 | White | 100 | 7.94 ± 0.1 | 912 ± 42 | Radius, hip, LS | |
| Cadogan et al., 1997 | Whole or reduced fat milk, 1125 | 1.5/1.5 | 82 | White | 100 | 12.2 ± 0.3 | 746 | TB | |
| Cameron et al., 2004 | CaCO3, 1200 | 2/2 | 128 | White | 100 | 10.3 ± 0.2 | 715 | LS, forearm, hip, TB | |
| Cheng et al., 2005 | CaCO3 or dairy products, 1000 | 2/2 | 181 | White | 100 | 11 (10–12) | <900 | LS, FN, TB | |
| Chevalley et al., 2005b | CaPO4, 850 | 1/2 | 235 | White | 0 | 7.4 ± 0.4 | 750 | Radius, hip, LS | |
| Du et al., 2004 | Milk, 245 | 2/2 | 757 | Chinese | 100 | 11 (10–12) | 418 | Forearm, TB | |
| Gibbons et al., 2004 | Dairy drink, 1200 | 1.5/2.5 | 154 | White | 51 | 9 (8–10) | 934 | TB, hip, LS | |
| Lau et al., 2004 | Milk powder, 650 or 1300 | 1.5/1.5 | 344 | Chinese | 45 | 8 (9–10) | 463 | Hip, LS, TB | |
| Lee et al., 1995 | CaCO3, 300 | 1.5/1.5 | 109 | Chinese | 42 | Age 7 | 567 | Radius, LS, FN | |
| Lee et al., 1994 | CaCO3, 300 | 1.5/1.5 | 162 | Chinese | 46 | Age 7 | 280 | Radius | |
| Lloyd et al., 1993 | CaCM, 500 | 2/2 | 94 | White | 100 | 11.9 ± 0.5 | 960 | LS, TB | |
| Lloyd et al., 1996 | CaCM, 500 | 2/2 | 112 | White | 100 | 11.9 ± 0.5 | 983 | LS, TB | |
| Matkovic et al., 2005 | CaCM, 1000 | 7/7 | 354 | White | 100 | Age 11 | 830 | Radius, TB | |
| Moyer-Mileur et al., 2003 | CaCO3, 800 | 1/1 | 71 | White | 100 | Age 12 | 900 | TB, trabecular | |
| Prentice et al., 2005 | CaCO3, 1000 | 1/1 | 143 | White | 0 | 16.8 (16–18) | 1190 | TB, LS, hip, forearm | |
| Rozen et al., 2003 | Elemental calcium, 1000 | 1/1 | 112 | 76% Jewish girls, 24% Arab | 100 | 14 ± 0.5 | 580 | TB, LS, FN | |
| Specker and Binkley, 2003 | CaCO3, 1000 | 1/1 | 178 | White | 47 | 4 (3–5) | 900 | TB, arm, leg | |
| Stear et al., 2003 | CaCO3, 1000 | 1.3/1.3 | 144 | White | 100 | 17.3 ± 0.3 | 938 ± 411 | TB, LS, hip, forearm | |
| Courteix et al., 2005 | CaPO4, 800 | 1/1 | 113 | White | 100 | 10 (8–13) | 980 | TB, LS, hip, radius | |
| Iuliano-Burns et al., 2003 | Food products fortified by milk minerals, 400 | 0.7/0.7 | 75 | 85% White, 15% Asian | 100 | 8.8 ± 0.1 | 673 | TB, LS, leg, arm | |
| Johnston et al., 1992 | CaCM, 1000 | 3/3 | 140 | White | 61 | 10 ± 2 | 908 | Radius, hip, LS | |
| Mølgaard et al., 2004 | CaCO3, 500 | 1/1 | 113 | White | 100 | 13.2 (12.6–13.7) | A: 1000–1307; B:<713 | TB | |
| Nowson et al., 1997 | CaCO3/Ca-lactate gluconate, 1000 | 1.5/1.5 | 84 | White | 100 | 14 ± 2.6 | 750 | LS, hip, forearm, TB | |
| Ho et al., 2005 | Calcium-fortified soymilk supplementation, 600 | 1/1 | 210 | Chinese | 100 | 14.5 ± 0.39 | 510 | LS, hip | |
| Lu et al., 2019 | Milk powder, 300/600/900 | 1.5/1.5 | 232 | Chinese | 50 | 13 (12–15) | 370 | TB, LS, hip | |
| Vogel et al., 2017 | Dairy products, 900 | 1.5/1.5 | 240 | 61% Black, 35% White, 4% NS | 66 | 11.8 ± 1.5 | 700 | TB, hip | |
| Ma et al., 2014 | Milk powder, 300/600/900 | 1/1 | 220 | Chinese | 50 | 12.9 ± 0.3 | 700 | TB, LS, hip | |
| Zhang et al., 2014 | Milk powder or additional calcium, 300/600/900 | 2/2 | 220 | Chinese | 50 | 12.9 ± 0.3 | 700 | TB, LS, hip | |
| Ward et al., 2014 | CaCO3, 1000 | 1/12 | 80 | Black | 0 | 12.5 ± 0.1 | 338 | LS, hip | |
| Khadilkar et al., 2012 | CaCO3, 500 | 1/1 | 210 | Indian | 100 | 9.9 ± 1.0 | 250 | TB | |
| Arab Ameri et al., 2012 | Milk, 250 | 0.75/0.75 | 54 | White | 0 | 10.3 ± 2.2 | 570 | FN | |
| Ekbote et al., 2011 | Calcium fortified laddoo, 405 mg | 1/1 | 60 | Indian | 50 | 2.7 ± 0.52 | 188 | TB | |
| Hemayattalab, 2010 | Milk, 230 | 0.5/0.5 | 40 | White | 0 | 8.6 ± 1.1 | 480 | FN | |
| Islam et al., 2010 | Ca-lactate, 600 | 1/1 | 200 | White | 100 | 22.9 ± 3.9 | <500 | LS, hip | |
| Yin et al., 2010 | Calcium, 85/230/500 | 2/2 | 257 | Chinese | 47 | 13.5 ± 0.5 | 300 | TB, LS | |
| Lambert et al., 2008 | Calcium-fortified fruit drink, 792 | 1.5/3.5 | 89 | White | 100 | 11.41 ± 0.54 | 636 | TB, LS, hip | |
| Zhu et al., 2008 | Milk, 650 | 2/2 | 757 | Chinese | 100 | 10.1 ± 0.4 | 436 | TB | |
| Ward et al., 2007 | Elemental calcium, 500 | 1/1 | 75 | White | 60 | 9.8 ± 1.6 | 850 | TB, LS | |
| Bass et al., 2007 | Ca-fortified foods using milk minerals, 392 ± 29 | 0.7/0.7 | 88 | White | 0 | 9.0 ± 0.3 | 900 | TB, LS | |
| Barger-Lux et al., 2005 | CaCO3, 500 | 3/3 | 121 | White | 100 | 23.1 ± 2.7 | 605 | TB, LS, hip | |
| Chevalley et al., 2005b | Milk calcium-phosphate salt extract, 850 | 1/8 | 149 | White | 100 | 7.9 ± 0.5 | 900 | Radius, hip, LS | |
| Winters-Stone and Snow, 2004 | CaCO3, 1000 | 1/1 | 23 | White | 100 | 23.7 ± 4.7 | 1100 | Hip, LS, femoral mid-shaft | |
| Volek et al., 2003 | Milk, 1723 ± 274 | 0.25/0.25 | 28 | White | 0 | 13–17 | 1000 | TB |
-
CaCO3 = calcium carbonate; Ca = calcium; CaCM = calcium citrate malate; CaPO4 = calcium phosphate; LS = lumbar spine; TB = total body; FN = femoral neck; NS = not stated.
Table 2
Subgroup analysis of bone mineral density (BMD) between calcium supplementation and control for each variable at lumbar spine, femoral neck, total hip, and total body.
| Variable | No. of datasets | No. of participants | BMD difference (95% CI), p value | Heterogeneity between studies | p value* | ||||||
|---|---|---|---|---|---|---|---|---|---|---|---|
| I² (%) | p value | ||||||||||
| Lumbar spine | |||||||||||
| Age | |||||||||||
| Prepeak | 31 | 3104 | 0.093 (−0.047 to 0.233), 0.192 | 71.54 | <0.001 | 0.866 | |||||
| Peripeak | 4 | 344 | 0.078 (−0.471 to 0.627), 0.780 | 79.82 | 0.002 | ||||||
| Duration | |||||||||||
| <18 months | 14 | 1420 | 0.066 (−0.069 to 0.202), 0.335 | 32.75 | 0.113 | 0.905 | |||||
| ≥18 months | 21 | 2178 | 0.106 (−0.104 to 0.316), 0.322 | 80.31 | <0.001 | ||||||
| Sex | |||||||||||
| Women-only trials | 13 | 1466 | 0.36 (0.067 to 0.653), 0.016 | 83.71 | <0.001 | 0.011 | |||||
| Trials with men and women | 22 | 2181 | −0.057 (−0.162 to 0.048), 0.284 | 27.53 | 0.115 | ||||||
| Regions | |||||||||||
| Asian | 18 | 1492 | −0.012 (−0.117 to −0.094), 0.829 | 12.70 | 0.302 | 0.177 | |||||
| Western | 17 | 1956 | 0.222 (−0.03 to 0.473), 0.084 | 83.62 | <0.001 | ||||||
| Baseline calcium intake, mg/day | |||||||||||
| <714 | 23 | 2014 | 0.062 (−0.109 to 0.234), 0.477 | 73.19 | <0.001 | 0.561 | |||||
| ≥714 | 12 | 1434 | 0.145 (−0.080 to 0.370), 0.207 | 71.17 | <0.001 | ||||||
| Calcium dose, mg/day | |||||||||||
| <1000 | 26 | 2172 | 0.103 (−0.062 to 0.269), 0.222 | 75.30 | <0.001 | 0.806 | |||||
| ≥1000 | 9 | 1056 | 0.050 (−0.177 to 0.276), 0.667 | 59.22 | 0.012 | ||||||
| Types of calcium supplement | |||||||||||
| Dietary calcium | 18 | 1690 | 0.104 (−0.104 to 0.311), 0.328 | 77.83 | <0.001 | 0.870 | |||||
| Calcium supplementation | 17 | 1758 | 0.075 (−0.099 to 0.249), 0.396 | 63.66 | <0.001 | ||||||
| Supplementation with or without vitamin D | |||||||||||
| Without vitamin D | 22 | 2520 | 0.140 (−0.047 to 0.327), 0.143 | 78.59 | <0.001 | 0.468 | |||||
| With vitamin D | 13 | 1078 | 0.008 (−0.160 to 0.176), 0.926 | 44.69 | 0.041 | ||||||
| Femoral neck | |||||||||||
| Age | |||||||||||
| Prepeak | 21 | 1795 | 0.600 (0.292 to 0.909), <0.001 | 88.68 | <0.001 | 0.138 | |||||
| Peripeak | 3 | 223 | 0.852 (0.257 to 1.446), 0.005 | 67.97 | 0.044 | ||||||
| Duration | |||||||||||
| <18 months | 15 | 1457 | 0.824 (0.383 to 1.266), <0.001 | 91.06 | <0.001 | 0.578 | |||||
| ≥18 months | 9 | 952 | 0.378 (0.047 to 0.709), 0.025 | 79.12 | <0.001 | ||||||
| Sex | |||||||||||
| Women-only trials | 8 | 840 | 0.712 (0.149 to 1.275), 0.013 | 90.89 | <0.001 | 0.963 | |||||
| Trials with men and women | 16 | 1262 | 0.560 (0.233 to 0.879), 0.001 | 85.41 | <0.001 | ||||||
| Regions | |||||||||||
| Asian | 10 | 793 | 0.091 (−0.047 to 0.230), 0.197 | 0.00 | 0.441 | 0.115 | |||||
| Western | 14 | 1309 | 1.078 (0.603 to 1.552), <0.001 | 91.53 | <0.001 | ||||||
| Baseline calcium intake, mg/day | |||||||||||
| <714 | 17 | 1159 | 0.581 (0.266 to 0.896), <0.001 | 84.10 | <0.001 | 0.57 | |||||
| ≥714 | 7 | 903 | 0.680 (0.036 to 1.323), 0.038 | 93.43 | <0.001 | ||||||
| Calcium dose, mg/day | |||||||||||
| <1000 | 18 | 1371 | 0.717 (0.349 to 1.085), <0.001 | 89.52 | <0.001 | 0.488 | |||||
| ≥1000 | 6 | 731 | 0.421 (−0.055 to 0.897), 0.083 | 85.12 | <0.001 | ||||||
| Types of calcium supplement | |||||||||||
| Dietary calcium | 15 | 1071 | 0.728 (0.311 to 1.144), 0.001 | 89.73 | <0.001 | 0.635 | |||||
| Calcium supplementation | 9 | 1031 | 0.510 (0.101 to 0.919), 0.014 | 86.60 | <0.001 | ||||||
| Supplementation with or without vitamin D | |||||||||||
| Without vitamin D | 10 | 1331 | 0.477 (0.045 to 0.910), 0.031 | 91.44 | <0.001 | 0.119 | |||||
| With vitamin D | 14 | 794 | 0.758 (0.350 to 1.166), <0.001 | 85.38 | <0.001 | ||||||
| Total hip | |||||||||||
| Age | |||||||||||
| Prepeak | 16 | 1539 | 0.336 (0.031 to 0.642), 0.031 | 88.43 | <0.001 | 0.119 | |||||
| Peripeak | 2 | 144 | −0.465 (−1.409 to 0.479), 0.334 | 77.90 | 0.033 | ||||||
| Duration | |||||||||||
| <18 months | 6 | 485 | 0.076 (−0.102 to 0.255), 0.402 | 0.00 | 0.963 | 0.935 | |||||
| ≥18 months | 12 | 1291 | 0.351 (−0.102 to 0.805), 0.129 | 93.24 | <0.001 | ||||||
| Sex | |||||||||||
| Women-only trials | 5 | 527 | 0.483 (−0.479 to 1.444), 0.325 | 95.75 | <0.001 | 0.932 | |||||
| Trials with men and women | 13 | 1070 | 0.181 (−0.103 to 0.465), 0.211 | 83.03 | <0.001 | ||||||
| Regions | |||||||||||
| Asian | 13 | 1126 | 0.096 (−0.127 to 0.319), 0.399 | 73.92 | <0.001 | 0.579 | |||||
| Western | 5 | 471 | 0.690 (−0.429 to 1.81), 0.227 | 96.33 | <0.001 | ||||||
| Baseline calcium intake, mg/day | |||||||||||
| <714 | 15 | 1336 | 0.179 (−0.148 to 0.507), 0.283 | 89.55 | <0.001 | 0.023 | |||||
| ≥714 | 3 | 261 | 0.723 (0.245 to 1.201), 0.003 | 60.02 | 0.082 | ||||||
| Calcium dose, mg/day | |||||||||||
| <1000 | 14 | 1092 | 0.189 (−0.179 to 0.557), 0.314 | 90.28 | <0.001 | 0.329 | |||||
| ≥1000 | 4 | 505 | 0.513 (−0.024 to 1.05), 0.061 | 84.04 | <0.001 | ||||||
| Types of calcium supplement | |||||||||||
| Dietary calcium | 15 | 1369 | 0.314 (−0.006 to 0.634), 0.054 | 88.89 | <0.001 | 0.421 | |||||
| Calcium supplementation | 3 | 228 | −0.046 (−1.148 to 1.056), 0.935 | 92.84 | <0.001 | ||||||
| Supplementation with or without vitamin D | |||||||||||
| Without vitamin D | 7 | 894 | 0.506 (−0.138 to 1.149), 0.123 | 94.78 | <0.001 | 0.546 | |||||
| With vitamin D | 11 | 878 | 0.101 (−0.191 to 0.393), 0.498 | 78.22 | <0.001 | ||||||
| Total body | |||||||||||
| Age | |||||||||||
| Prepeak | 38 | 3883 | 0.330 (0.163 to 0.496), <0.001 | 85.15 | <0.001 |
| |||||
| Peripeak |
|
|
|
| |||||||
| Duration | |||||||||||
| <18 months | 12 | 986 | 0.324 (0.035 to 0.614), 0.028 | 79.55 | <0.001 | 0.775 | |||||
| ≥18 months | 26 | 2897 | 0.334 (0.129 to 0.539), 0.001 | 87.15 | <0.001 | ||||||
| Sex | |||||||||||
| Women-only trials | 18 | 2359 | 0.569 (0.328 to 0.810), <0.001 | 87.66 | <0.001 | 0.036 | |||||
| Trials with men and women | 20 | 1558 | 0.104 (−0.089 to 0.296), 0.292 | 73.86 | <0.001 | ||||||
| Ethnicity | |||||||||||
| Asian | 23 | 2008 | 0.274 (0.062 to 0.486), 0.011 | 85.67 | <0.001 | 0.544 | |||||
| Western | 15 | 1469 | 0.422 (0.143 to 0.701), 0.003 | 85.28 | <0.001 | ||||||
| Baseline calcium intake, mg/day | |||||||||||
| <714 | 26 | 2356 | 0.363 (0.127 to 0.599), 0.003 | 89.23 | <0.001 | 0.140 | |||||
| ≥714 | 12 | 1215 | 0.265 (0.136 to 0.394), <0.001 | 22.28 | 0.225 | ||||||
| Calcium dose, mg/day | |||||||||||
| <1000 | 27 | 2612 | 0.392 (0.161 to 0.624), 0.001 | 88.51 | <0.001 | 0.484 | |||||
| ≥1000 | 11 | 1285 | 0.189 (0.073 to 0.306), 0.001 | 11.81 | 0.332 | ||||||
| Types of calcium supplement | |||||||||||
| Dietary calcium | 24 | 2453 | 0.290 (0.054 to 0.526), 0.016 | 88.33 | <0.001 | 0.129 | |||||
| Calcium supplementation | 14 | 1464 | 0.405 (0.195 to 0.615), <0.001 | 74.22 | <0.001 | ||||||
| Supplementation with or without vitamin D | |||||||||||
| Without vitamin D | 22 | 2657 | 0.701 (0.327 to 1.076), <0.001 | 94.83 | <0.001 | 0.137 | |||||
| With vitamin D | 15 | 1625 | 0.156 (−0.156 to 0.468), 0.327 | 88.94 | <0.001 | ||||||
-
*
p value for heterogeneity between subgroups.
Table 3
Subgroup analysis of bone mineral content (BMC) between calcium supplementation and control for each variable at lumbar spine, femoral neck, total hip, and total body.
| Variable | No. of datasets | No. of participants | BMD difference (95% CI), p value | Heterogeneity between studies | p value* | ||
|---|---|---|---|---|---|---|---|
| I² (%) | p value | ||||||
| Lumbar spine | |||||||
| Age | |||||||
| Prepeak | 33 | 2465 | 0.173 (0.006 to 0.341), 0.043 | 75.06 | <0.001 | 0.678 | |
| Peripeak | 3 | 321 | 0.047 (−0.291 to 0.384), 0.786 | 47.68 | 0.148 | ||
| Duration | |||||||
| <18 months | 21 | 1485 | 0.063 (−0.063 to 0.190), 0.328 | 25.21 | 0.143 | 0.487 | |
| ≥18 months | 15 | 1296 | 0.293 (−0.015 to 0.602), 0.062 | 82.27 | <0.001 | ||
| Sex | |||||||
| Women-only trials | 14 | 1220 | 0.327 (−0.017 to 0.672), 0.062 | 86.55 | <0.001 | 0.496 | |
| Trials with men and women | 22 | 1566 | 0.076 (−0.054 to 0.207), 0.251 | 38.52 | 0.035 | ||
| Regions | |||||||
| Asian | 15 | 1260 | 0.003 (−0.108 to 0.113), 0.962 | 0.00 | 0.704 | 0.112 | |
| Western | 21 | 1199 | 0.319 (0.059 to 0.579), 0.016 | 82.06 | <0.001 | ||
| Baseline calcium intake, mg/day | |||||||
| <714 | 24 | 2030 | 0.137 (−0.075 to 0.349), 0.206 | 81.04 | <0.001 | 0.104 | |
| ≥714 | 12 | 756 | 0.206 (0.059 to 0.354), 0.006 | 0.00 | 0.472 | ||
| Calcium dose, mg/day | |||||||
| <1000 | 29 | 2048 | 0.187 (−0.013 to 0.386), 0.067 | 78.79 | <0.001 | 0.938 | |
| ≥1000 | 7 | 768 | 0.097 (−0.051 to 0.245), 0.198 | 0.00 | 0.992 | ||
| Types of calcium supplement | |||||||
| Dietary calcium | 17 | 1267 | 0.198 (−0.119 to 0.516), 0.221 | 86.46 | <0.001 | 0.447 | |
| Calcium supplementation | 19 | 1519 | 0.129 (0.024 to 0.234), 0.016 | 0.00 | 0.664 | ||
| Supplementation with or without vitamin D | |||||||
| Without vitamin D | 26 | 2095 | 0.256 (0.056 to 0.456), 0.012 | 78.77 | <0.001 | 0.057 | |
| With vitamin D | 10 | 700 | −0.059 (−0.214 to 0.096), 0.456 | 0.00 | 0.608 | ||
| Femoral neck | |||||||
| Age | |||||||
| Prepeak | 13 | 1018 | 0.249 (0.043 to 0.454), 0.018 | 58.27 | 0.004 | <0.001 | |
| Peripeak | 2 | 200 | 1.045 (0.701 to 1.390), <0.001 | 0.00 | 0.348 | ||
| Duration | |||||||
| <18 months | 9 | 648 | 0.569 (0.223 to 0.914), 0.001 | 75.38 | <0.001 | 0.194 | |
| ≥18 months | 6 | 570 | 0.107 (−0.062 to 0.276), 0.213 | 0.00 | 0.467 | ||
| Sex | |||||||
| Women-only trials | 5 | 397 | 0.742 (0.267 to 1.217), 0.002 | 74.47 | 0.004 | 0.129 | |
| Trials with men and women | 10 | 793 | 0.195 (−0.027 to 0.418), 0.086 | 57.60 | 0.012 | ||
| Regions | |||||||
| Asian | 10 | 793 | 0.195 (−0.027 to 0.418), 0.086 | 57.60 | 0.012 | 0.129 | |
| Western | 5 | 397 | 0.742 (0.267 to 1.217), 0.002 | 74.47 | 0.004 | ||
| Types of calcium supplement | |||||||
| Dietary calcium | 9 | 684 | 0.218 (−0.029 to 0.464), 0.083 | 60.89 | 0.009 | 0.367 | |
| Calcium supplementation | 6 | 506 | 0.609 (0.162 to 1.056), 0.008 | 78.02 | 0.000 | ||
| Supplementation with or without vitamin D | |||||||
| Without vitamin D | 5 | 518 | 0.269 (−0.025 to 0.563), 0.073 | 52.38 | 0.078 | 0.865 | |
| With vitamin D | 10 | 700 | 0.393 (0.067 to 0.719), 0.018 | 76.45 | <0.001 | ||
| Total hip | |||||||
| Age | |||||||
| Prepeak | 13 | 1194 | 0.273 (−0.150 to 0.696), 0.206 | 91.78 | <0.001 | <0.001 | |
| Peripeak | 1 | 121 | −1.936 (−2.346 to −1.525), <0.001 | 0.00 | 1.000 | ||
| Duration | |||||||
| <18 months | 6 | 542 | −0.226 (−0.514 to 0.061), 0.123 | 61.79 | 0.023 | 0.083 | |
| ≥18 months | 8 | 773 | 0.385 (−0.495 to 1.264), 0.392 | 96.76 | <0.001 | ||
| Sex | |||||||
| Women-only trials | 3 | 420 | –0.202 (−1.851 to 1.448), 0.81 | 98.13 | <0.001 | 0.499 | |
| Trials with men and women | 11 | 866 | 0.205 (−0.276 to 0.685), 0.404 | 91.70 | <0.001 | ||
| Regions | |||||||
| Asian | 10 | 894 | 0.043 (−0.087 to 0.172), 0.516 | 0.00 | 0.691 | 0.914 | |
| Western | 4 | 392 | 0.325 (−1.788 to 2.438), 0.763 | 98.71 | <0.001 | ||
| Supplementation with or without vitamin D | |||||||
| Without vitamin D | 6 | 815 | 0.226 (−0.837 to 1.289), 0.677 | 97.87 | <0.001 | 0.981 | |
| With vitamin D | 8 | 500 | 0.032 (−0.144 to 0.208), 0.721 | 0.00 | 0.663 | ||
| Total body | |||||||
| Age | |||||||
| Prepeak | 50 | 3762 | 0.168 (0.029 to 0.308), 0.018 | 79.47 | <0.001 | <0.001 | |
| Peripeak | 1 | 121 | −0.716 (−1.086 to −0.347), <0.001 | 0.00 | 1.000 | ||
| Duration | |||||||
| <18 months | 26 | 1760 | 0.146 (−0.095 to 0.387), 0.235 | 83.36 | <0.001 | 0.902 | |
| ≥18 months | 25 | 2634 | 0.143 (−0.027 to 0.313), 0.100 | 77.82 | <0.001 | ||
| Sex | |||||||
| Women-only trials | 23 | 2139 | 0.227 (−0.021 to 0.476), 0.073 | 86.47 | <0.001 | 0.593 | |
| Trials with men and women | 28 | 2089 | 0.082 (−0.076 to 0.240), 0.310 | 70.54 | <0.001 | ||
| Regions | |||||||
| Asian | 22 | 2142 | 0.186 (−0.004 to 0.375), 0.055 | 79.98 | <0.001 | 0.569 | |
| Western | 29 | 2086 | 0.120 (−0.094 to 0.334), 0.273 | 81.74 | <0.001 | ||
| Baseline calcium intake, mg/day | |||||||
| <714 | 30 | 2765 | 0.123 (−0.082 to 0.327), 0.239 | 86.14 | <0.001 | 0.307 | |
| ≥714 | 21 | 1463 | 0.186 (0.014 to 0.358), 0.034 | 59.78 | <0.001 | ||
| Calcium dose, mg/day | |||||||
| <1000 | 37 | 2779 | 0.172 (−0.017 to 0.361), 0.074 | 84.50 | <0.001 | 0.895 | |
| ≥1000 | 14 | 1314 | 0.090 (−0.075 to 0.255), 0.283 | 51.43 | 0.013 | ||
| Types of calcium supplement | |||||||
| Dietary calcium | 26 | 2087 | 0.084 (−0.109 to 0.277), 0.392 | 80.09 | <0.001 | 0.429 | |
| Calcium supplementation | 25 | 2141 | 0.215 (0.004 to 0.427), 0.046 | 81.58 | <0.001 | ||
| Supplementation with or without vitamin D | |||||||
| Without vitamin D | 35 | 2910 | 0.205 (0.017 to 0.393), 0.033 | 83.03 | <0.001 | 0.320 | |
| With vitamin D | 15 | 1388 | 0.030 (−0.188 to 0.249), 0.786 | 75.35 | <0.001 | ||
-
*
p value for heterogeneity between subgroups.
Author response table 1
Information regarding vitamin D supplementation in the included trials.
| Subgroups | No. of trials | Trials |
|---|---|---|
| Without vitamin D supplementation | 32 | Johnston 1992; Lee 1994; Lloyd 1994; Lee 1995; Lloyd 1996; Bonjour 1997; Cadogan 1997; Nowson 1997; Sandra 2003; Rozen 2003; Volek 2003; Specker 2003; Stear 2003; Molgaard 2004; Cameron 2004; Winters-Stone 2004; Lau 2004; Gibbons 2004; Chevalley 2005; Matkovic 2005; Barger-Lux 2005; Prentice 2005; Courteix 2005; Ho 2005; Chevalley 2005; Ward 2007; Bass 2007; Lambert 2008; Yin 2010; Ekbote 2011; Ward 2014; Vogel 2017; |
| With vitamin D supplementation | 11 | Moyer-Mileur 2003; Du 2004; Cheng 2005; Zhu 2008; Hemayattalab 2010; Islam 2010; Khadilkar 2012; Arab 2012; Ma 2014; Zhang 2014; Lu 2019; |
Author response table 2
Detailed information regarding vitamin D supplementation in the trials with vitamin D supplementation.
| Trials | Vitamin D Supplementation | |
|---|---|---|
| Moyer-Mileur 2003 | Arm 1: 800 mg calcium carbonate and vitamin D (400 IU); Arm 2: placebo | |
| Du 2004 | Arm 1: milk; Arm 2: milK+ vitamin D (5 or 8mg cholecalciferol); Arm 3: control | |
| Cheng 2005 | Arm 1: calcium (1000 mg) vitamin D3 (200 IU) Arm 2: calcium (1000 mg), Arm 3: cheese (1000 mg calcium) Arm 4: placebo | |
| Zhu 2008 | Arm 1: calcium fortified milk (Ca milk) Arm 2: calcium and vitamin D fortified milk (CaD milk) Arm 3: control | |
| Hemayattalab 2010 | Arm 1: calcium plus vitamin D Arm 2: control | |
| Islam 2010 | Arm 1 – Arm 3: 600 mg of calcium with 10mg of VD; 600 mg of calcium plus multiple micronutrients with 10mg of VD Arm 4: control | |
| Khadilkar 2012 | Arm 1: calcium with 30,000 IU vitamin D3 (cholecalciferol); Arm 2: calcium and multivitamin plus zinc with 30,000 IU vitamin D3 Arm 3: control | |
| Arab 2012 | Arm 1: calcium plus vitamin D Arm 2: control | |
| Ma 2014 | Arm 1 – Arm 3: low, medium and high doses of calcium plus 200 IU vitamin D Arm 4: control | |
| Zhang 2014 | Arm 1 – Arm 3: low, medium and high doses of calcium plus 200 IU vitamin D Arm 4: control | |
| Lu 2019 | Arm 1 – Arm 3: milk powder fortified with vitamin D 400 IU plus calcium 300, or 600, or 900 mg Arm 4: control |
Author response table 3
Subgroup analyses by calcium supplementation with or without vitamin D on bone mineral density at lumbar spine, femoral neck, total hip and total body.
| Subgroups | No. of datasets | No. of participants | Mean difference(95% CI),P-value | Heterogeneity between studies | P-value for difference between subgroups | |
|---|---|---|---|---|---|---|
| I² (%) | P-value | |||||
| Lumbar Spine | ||||||
| without vitamin D | 22 | 2520 | 0.140 (-0.047 to 0.327), 0.143 | 78.59 | <0.001 | 0.468 |
| with vitamin D | 13 | 1078 | 0.008 (-0.160 to 0.176), 0.926 | 44.69 | 0.041 | |
| Femoral Neck | ||||||
| without vitamin D | 10 | 1331 | 0.477 (0.045 to 0.910), 0.031 | 91.44 | <0.001 | 0.119 |
| with vitamin D | 14 | 794 | 0.758 (0.350 to 1.166), <0.001 | 85.38 | <0.001 | |
| Total Hip | ||||||
| without vitamin D | 7 | 894 | 0.506 (-0.138 to 1.149), 0.123 | 94.78 | <0.001 | 0.546 |
| with vitamin D | 11 | 878 | 0.101 (-0.191 to 0.393), 0.498 | 78.22 | <0.001 | |
| Total Body | ||||||
| without vitamin D | 22 | 2657 | 0.701 (0.327 to 1.076), <0.001 | 94.83 | <0.001 | 0.137 |
| with vitamin D | 15 | 1625 | 0.156 (-0.156 to 0.468), 0.327 | 88.94 | <0.001 |
Author response table 4
Subgroup analyses by calcium supplementation with or without vitamin D on bone mineral content at lumbar spine, femoral neck, total hip and total body.
| Subgroups | No. of datasets | No. of participants | Mean difference (95% CI),P-value | Heterogeneity between studies | P-value for difference between subgroups | |
|---|---|---|---|---|---|---|
| I² (%) | P-value | |||||
| Lumbar Spine | ||||||
| without vitamin D | 26 | 2095 | 0.256 (0.056 to 0.456), 0.012 | 78.77 | <0.001 | 0.057 |
| with vitamin D | 10 | 700 | -0.059 (-0.214 to 0.096), 0.456 | 0.00 | 0.608 | |
| Femoral Neck | ||||||
| without vitamin D | 5 | 518 | 0.269 (-0.025 to 0.563), 0.073 | 52.38 | 0.078 | 0.865 |
| with vitamin D | 10 | 700 | 0.393 (0.067 to 0.719), 0.018 | 76.45 | <0.001 | |
| Total Hip | ||||||
| without vitamin D | 6 | 815 | 0.226 (-0.837 to 1.289), 0.677 | 97.87 | <0.001 | 0.981 |
| with vitamin D | 8 | 500 | 0.032 (-0.144 to 0.208), 0.721 | 0.00 | 0.663 | |
| Total Body | ||||||
| without vitamin D | 35 | 2910 | 0.205 (0.017 to 0.393), 0.033 | 83.03 | <0.001 | 0.320 |
| with vitamin D | 15 | 1388 | 0.030 (-0.188 to 0.249), 0.786 | 75.35 | <0.001 |
Additional files
-
Supplementary file 1
Search strategies.
- https://cdn.elifesciences.org/articles/79002/elife-79002-supp1-v1.docx
-
Supplementary file 2
Excluded trials and reasons for exclusion.
- https://cdn.elifesciences.org/articles/79002/elife-79002-supp2-v1.docx
-
Supplementary file 3
Risk-of-bias assessment for eligible trials.
- https://cdn.elifesciences.org/articles/79002/elife-79002-supp3-v1.doc
-
Supplementary file 4
Sensitivity analyses excluding studies of low or medium quality.
(A) Sensitivity analyses excluding studies of low or medium quality in bone mineral density (BMD). (B) Sensitivity analyses excluding studies of low or medium quality in bone mineral content (BMC).
- https://cdn.elifesciences.org/articles/79002/elife-79002-supp4-v1.docx
-
Supplementary file 5
Sensitivity analysis by comparisons of fixed and random-effect models.
(A) Sensitivity analysis by comparisons of fixed and random-effect models for bone mineral density (BMD). (B) Sensitivity analysis by comparisons of fixed and random-effect models for bone mineral content (BMC).
- https://cdn.elifesciences.org/articles/79002/elife-79002-supp5-v1.docx
-
Supplementary file 6
Cumulative meta-analysis according to sample size.
(A) Cumulative meta-analysis according to sample size in lumbar spine bone mineral density (LSBMD). (B) Cumulative meta-analysis according to sample size in femoral neck bone mineral density (FNBMD). (C) Cumulative meta-analysis according to sample size in total hip bone mineral density (THBMD). (D) Cumulative meta-analysis according to sample size in total body bone mineral density (TBBMD). (E) Cumulative meta-analysis according to sample size in lumbar spine bone mineral content (LSBMC). (F) Cumulative meta-analysis according to sample size in femoral neck bone mineral content (FNBMC). (G) Cumulative meta-analysis according to sample size in total hip bone mineral content (THBMC). (H) Cumulative meta-analysis according to sample size in total body bone mineral content (TBBMC).
- https://cdn.elifesciences.org/articles/79002/elife-79002-supp6-v1.doc
-
Supplementary file 7
Sensitivity analyses by comparisons of the pooled results of the trials included in previous study and trials newly added in our current study.
(A) Sensitivity analyses by comparisons of the pooled results of the trials included in previous study and trials newly added in our current study of bone mineral density (BMD). (B) Sensitivity analyses by comparisons of the pooled results of the trials included in previous study and trials newly added in our current study of bone mineral content (BMC).
- https://cdn.elifesciences.org/articles/79002/elife-79002-supp7-v1.doc
-
Supplementary file 8
GRADE assessment.
- https://cdn.elifesciences.org/articles/79002/elife-79002-supp8-v1.docx
-
Supplementary file 9
Meta-regression for age, region, Ca dosage, baseline intake and sample size on bone mineral density (BMD) and bone mineral content (BMC).
- https://cdn.elifesciences.org/articles/79002/elife-79002-supp9-v1.docx
-
Supplementary file 10
Publication bias.
- https://cdn.elifesciences.org/articles/79002/elife-79002-supp10-v1.docx
-
MDAR checklist
- https://cdn.elifesciences.org/articles/79002/elife-79002-mdarchecklist1-v1.pdf
-
Reporting standard 1
PRISMA checklist.
- https://cdn.elifesciences.org/articles/79002/elife-79002-repstand1-v1.docx
Download links
A two-part list of links to download the article, or parts of the article, in various formats.
Downloads (link to download the article as PDF)
Open citations (links to open the citations from this article in various online reference manager services)
Cite this article (links to download the citations from this article in formats compatible with various reference manager tools)
The effect of calcium supplementation in people under 35 years old: A systematic review and meta-analysis of randomized controlled trials
eLife 11:e79002.
https://doi.org/10.7554/eLife.79002


