Single-cell profiling coupled with lineage analysis reveals vagal and sacral neural crest contributions to the developing enteric nervous system
- Division of Biology and Biological Engineering, California Institute of Technology, United States
Figures
Figure 1 with 2 supplements
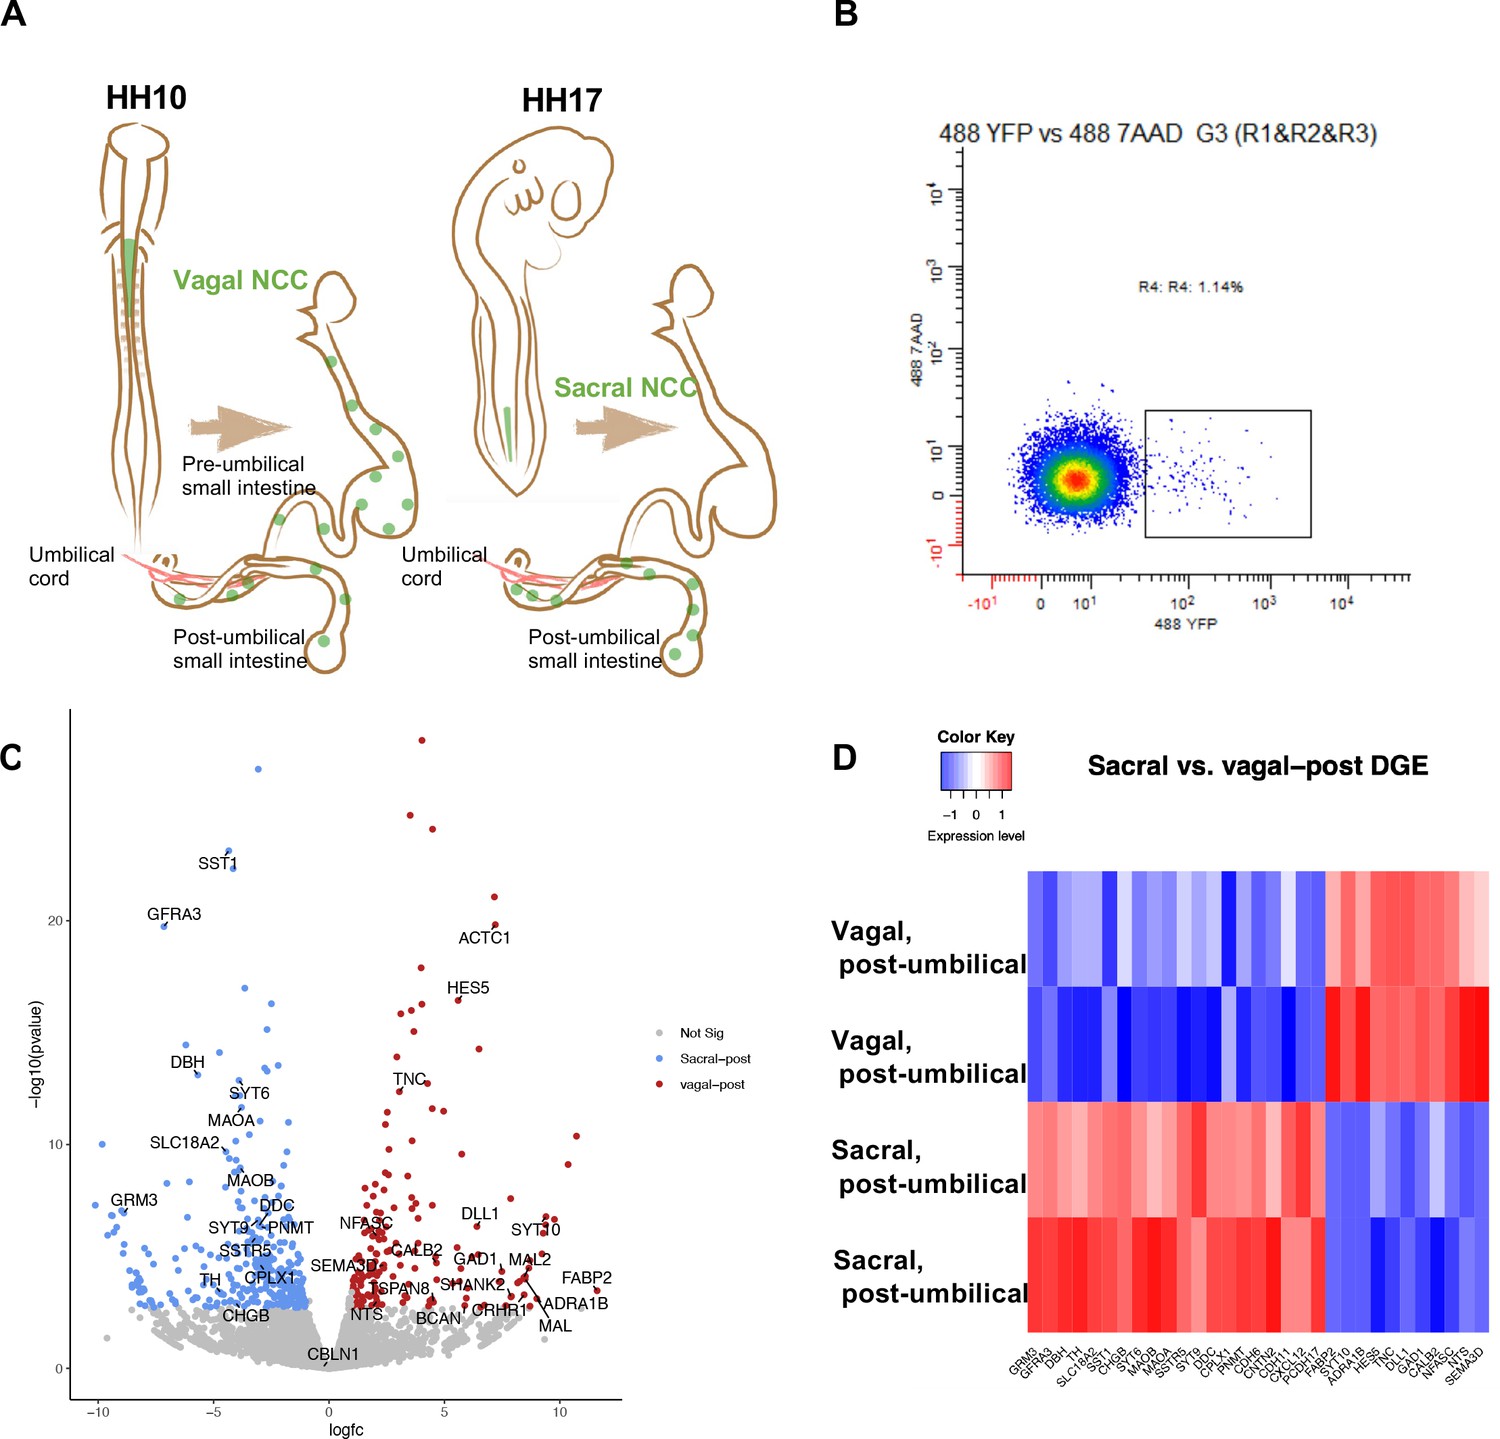
Bulk RNA-seq of vagal and sacral neural crest derived cells in the post-umbilical enteric nervous system (ENS).
(A) Schematic diagram describing experimental procedure for viral labeling. Vagal and sacral neural crest cells were labeled by H2B-YFP (green) in separate embryos. The post-umbilical gastrointestinal tracts, including accompanying ganglia, were dissected at E10 for dissociation. (B) YFP+ cells from the post-umbilical region derived from vagal or sacral neural crest (NC) were sorted via FACS. (C) Volcano plot describing differentially expressed genes of sacral (sacral-post, blue) and vagal neural crest cells in the post-umbilical gut (vagal-post, red). Genes with fold change greater than 2 and p-value<0.05 are colored. (D) Heatmap highlighting selected genes related to neuronal functions from differential gene expression analysis in sacral and vagal-post ENS populations (with two replicates per condition). Genes are ordered based on significance level and fold change.
Figure 1—figure supplement 1
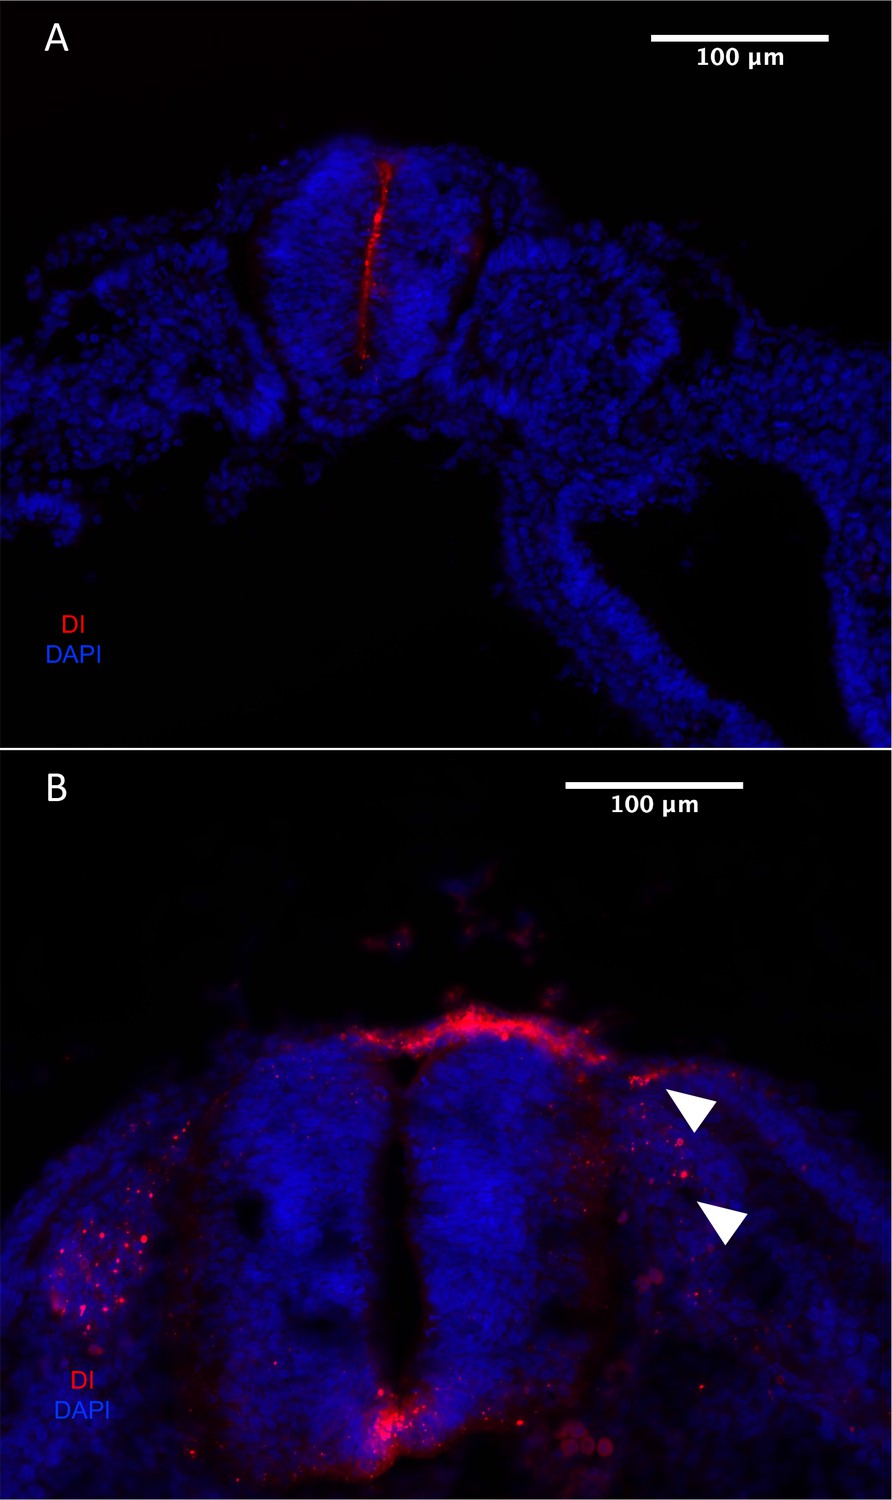
DiI-labeling of the sacral neural crest.
(A) Transverse section of HH17 (E2.5) embryo 1 hr post injection of DiI into the lumen of the sacral neural tube showing that the DiI is confined to the luminal region. (B) Transverse section of embryo collected 48 hr after injection (~HH25-26, E5) with vital dye DiI. White arrows identify labeled migratory streams of neural crest cells. Scale bars for main figure (A, B): 100 μm.
Figure 1—figure supplement 2
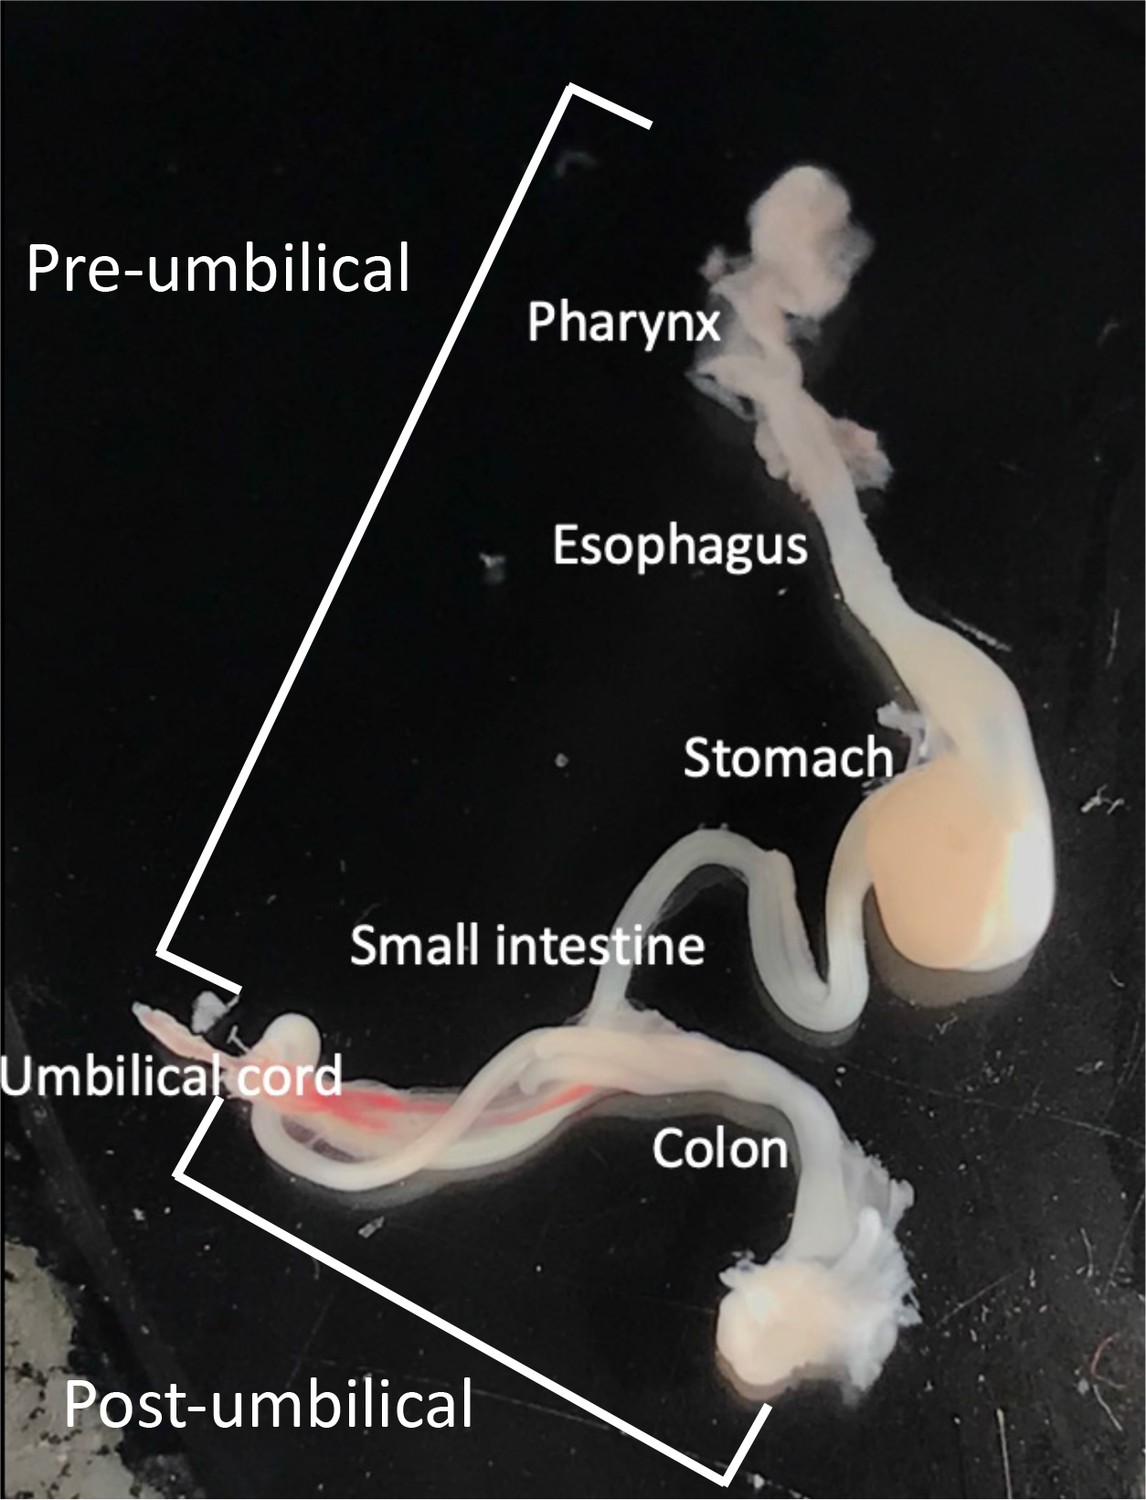
Diagram of dissected tissue for single-cell RNA-sequencing.
Figure 2 with 1 supplement
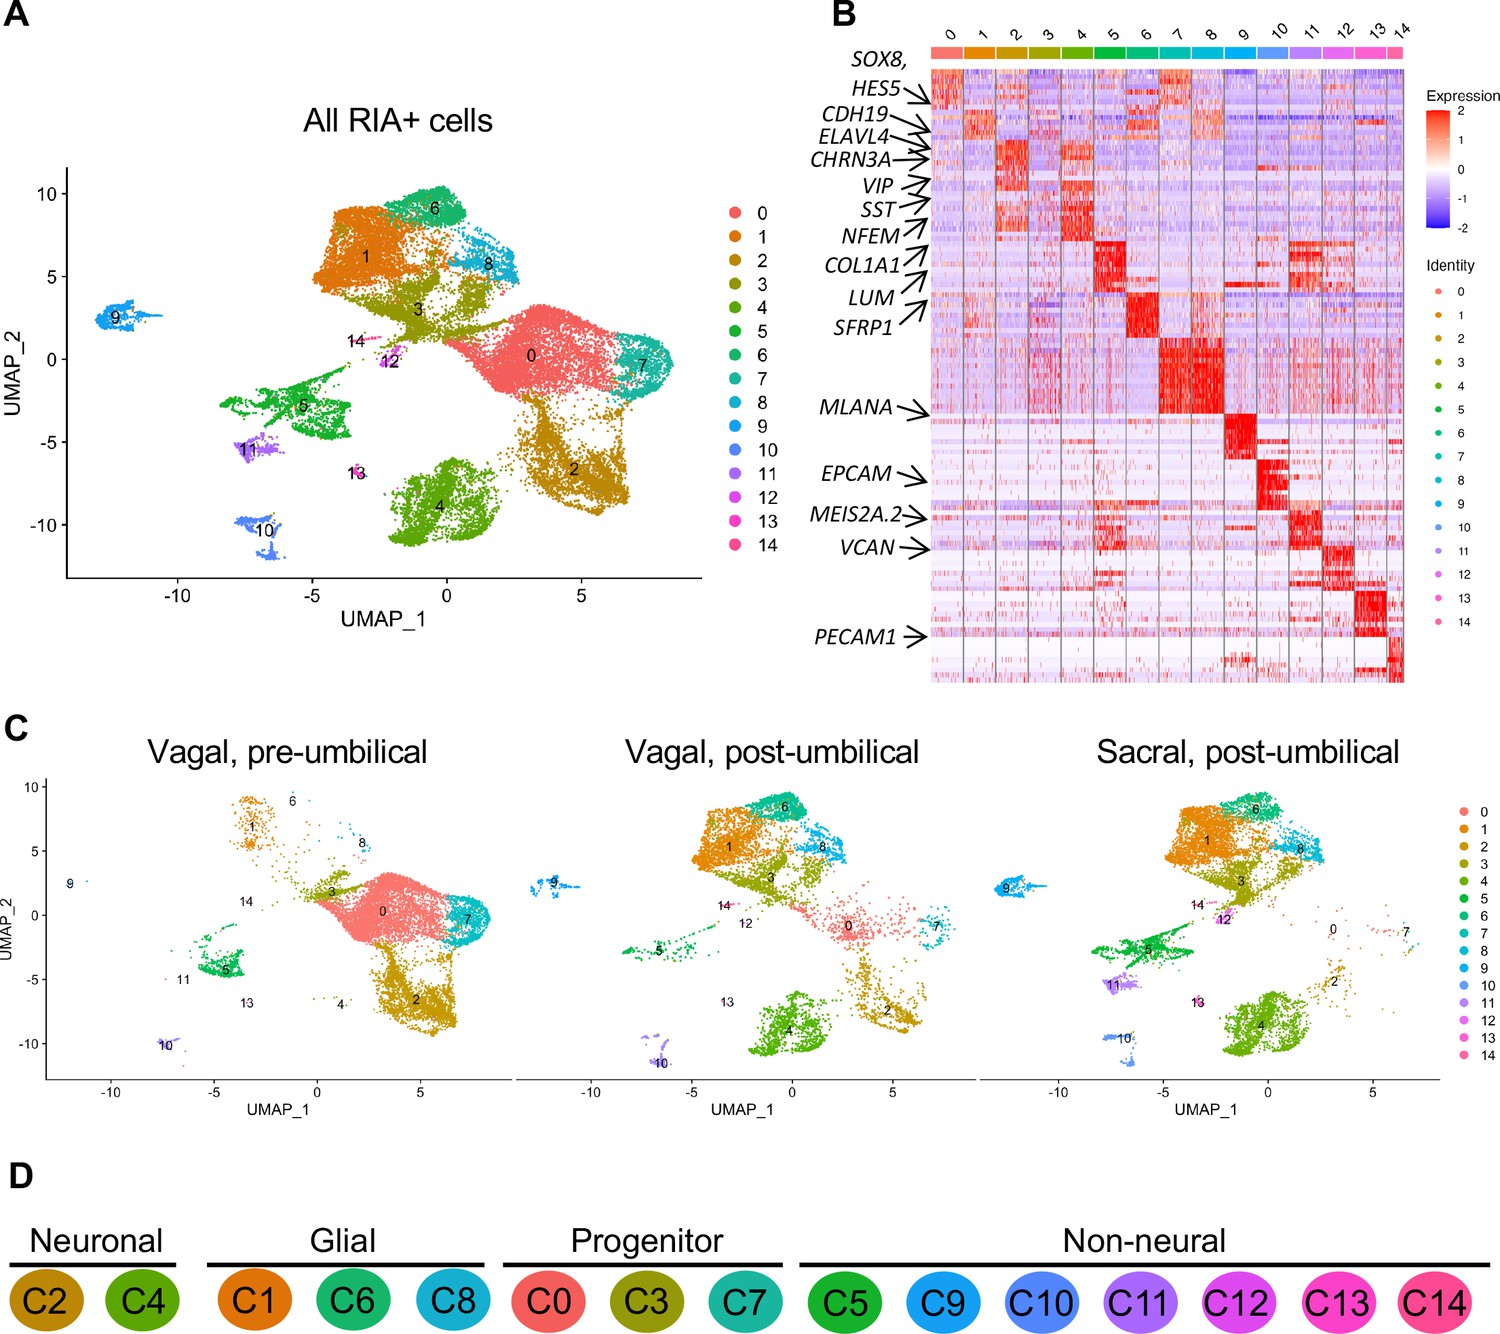
Single-cell RNA-seq of vagal and sacral-contributions to the enteric nervous system (ENS) and associated peripheral ganglia.
(A) Uniform manifold approximation and projection (UMAP, resolution 0.3) representation of all RIA+ cells (>2 RIA transcripts; 26,993 cells) collected from the vagal and sacral-labeled embryos in both post-umbilical (including the Nerve of Remak and pelvic plexus) and pre-umbilical gastrointestinal tracts. (B) Expression heatmap for top 10 gene markers in clusters 0–14 (subsampled) with arrows pointing to marker genes for neural crest progenitor and glial (SOX8, HES5, CDH19, SFRP1), neuronal (ELAVL4, CHRN3A, VIP, SST, NFEM), fibroblast (COL1A1, LUM), melanocyte (MLANA), epithelial (EPCAM), vascular muscle (MEIS2A.2, VCAN), and endothelial (PECAM1). (C) UMAP representation (resolution 0.3) of each population: vagal-derived cells in the pre-umbilical gut, vagal-derived cells in the post-umbilical gut, and sacral-derived cells in the post-umbilical gut. (D) Key for putative cluster identities. See Figure 3A for greater detail.
Figure 2—figure supplement 1
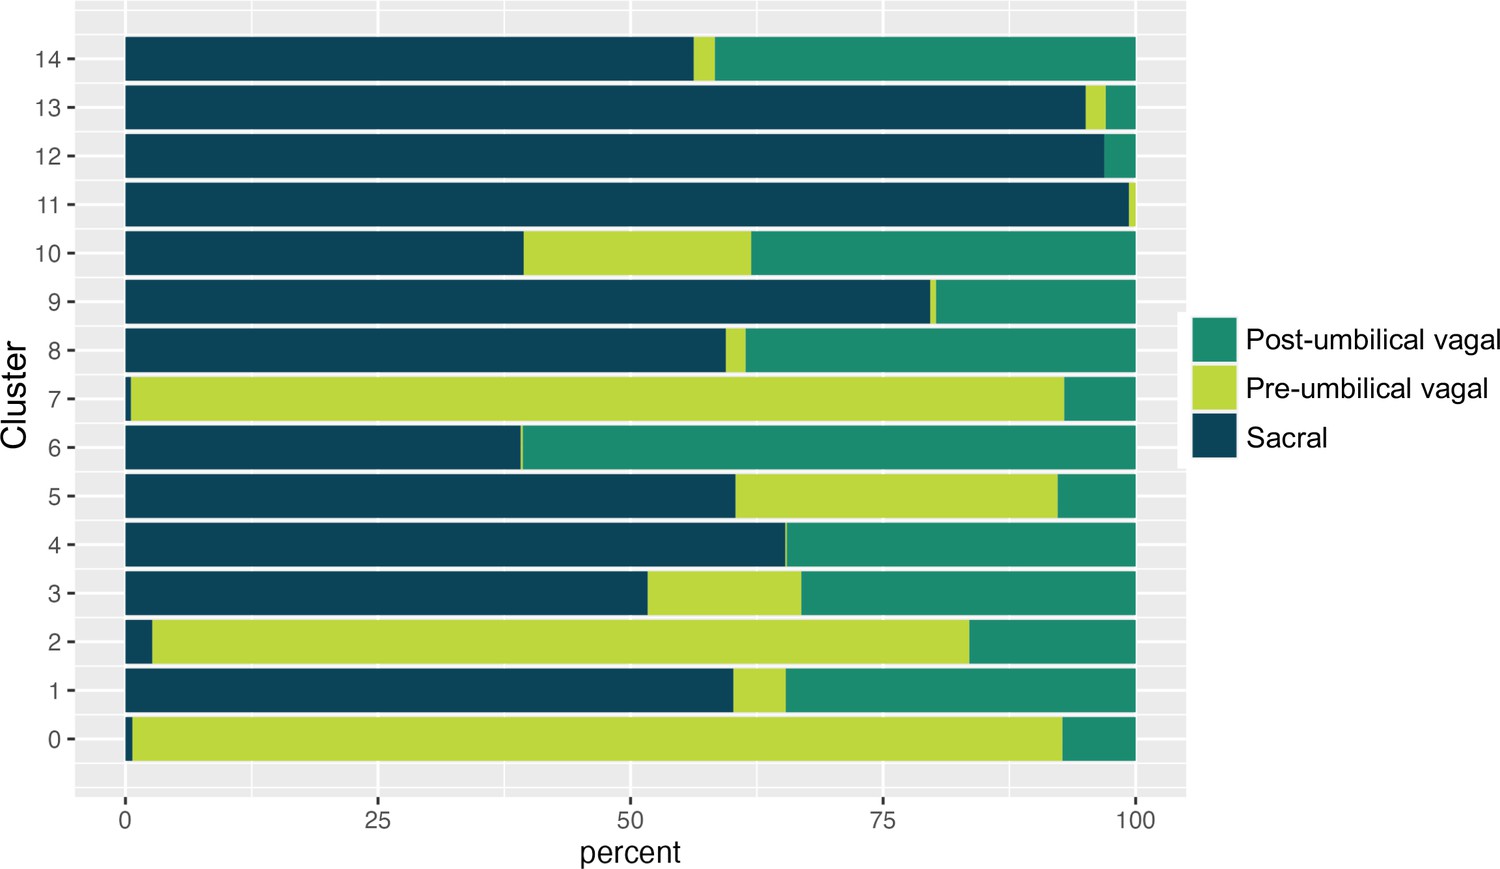
Proportion of pre-umbilical vagal, post-umbilical vagal, and sacral populations across clusters.
Figure 3
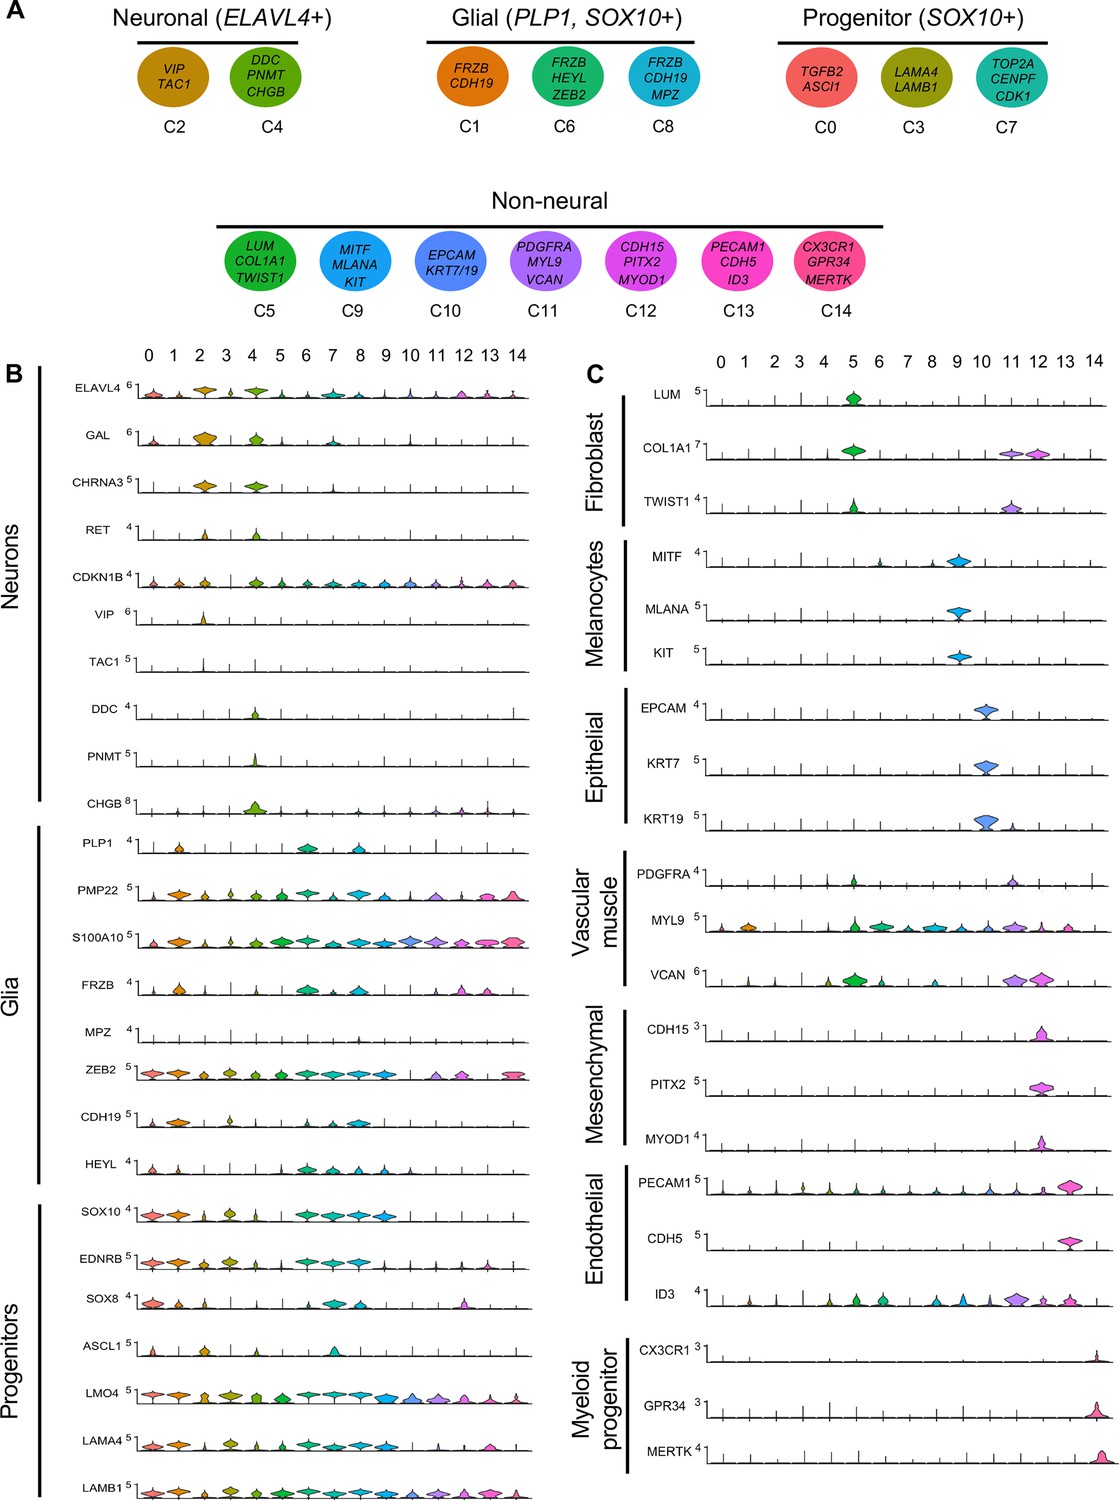
Gene expression analysis of markers associated different enteric nervous system (ENS) cell types.
(A) Schematic diagram demonstrating genes associated with particular clusters of neuronal (ELAVL4+), glial (PLP1+, SOX10+), progenitor (SOX10+), and non-neural cell identities. (B) Violin plot of key genes reflecting neuronal/glial/progenitor cell fates. (C) Violin plot of key genes for non-neural cell identities (fibroblast, melanocyte, epithelial, vascular muscle, mesenchymal, endothelial, and myeloid progenitor).
Figure 4 with 2 supplements
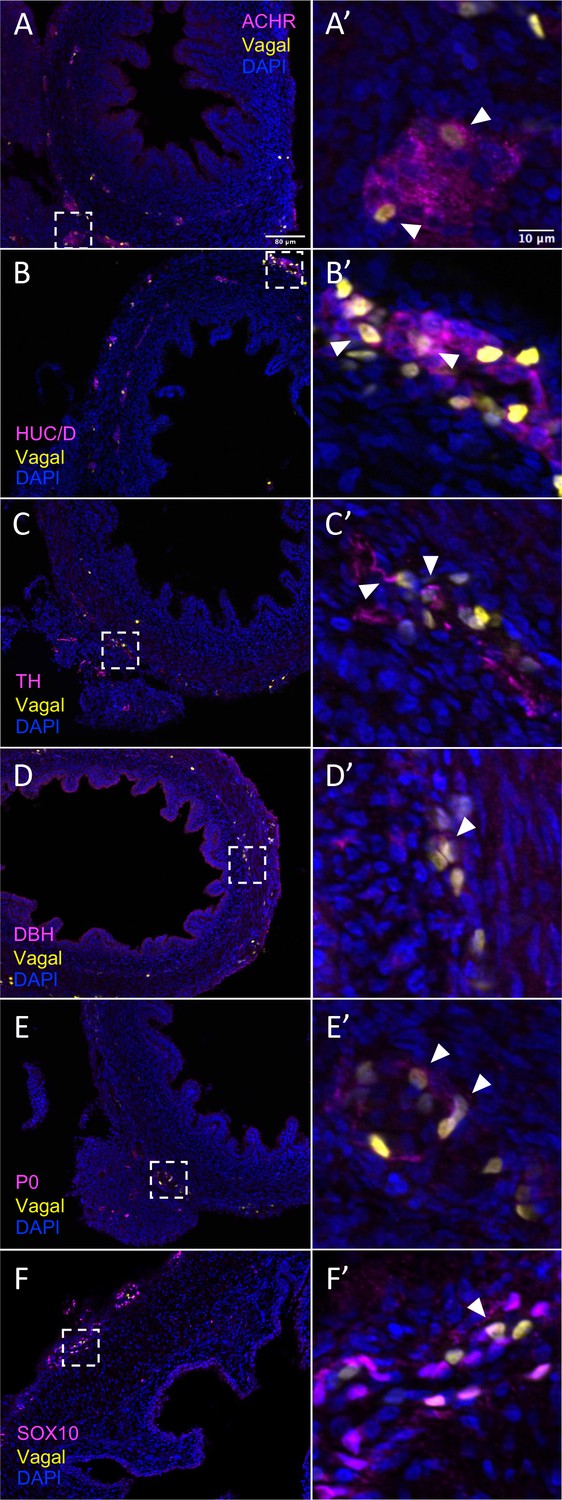
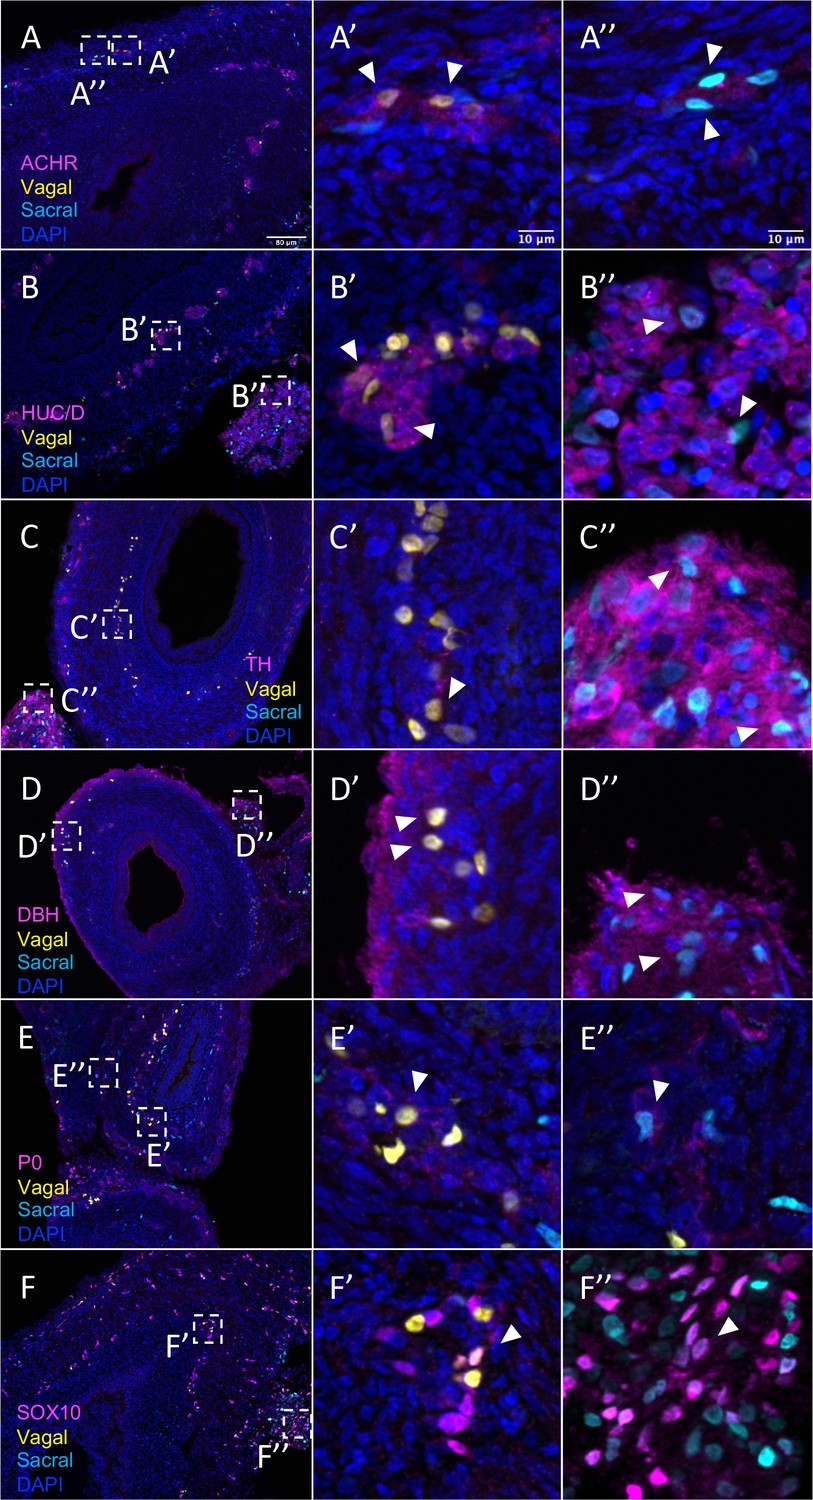
In vivo validation of vagal neural crest contributions to neuronal, glial, and progenitor cells in the pre-umbilical gut.
Transverse sections through the E10 preumbilical gut reveal (A) acetylcholine receptor expression in some vagal neural crest-derived cells along the pre-umbilical small intestine. (B) Vagal neural crest also gave rise to HUC/D+ neurons in this region. (C) A small number of neurons expressing TH were observed sparsely distributed in the myenteric plexus of the pre-umbilical intestine. (D) DBH expressing vagally derived cells were also observed in both the myenteric and submucosal plexus of the pre-umbilical intestine. (E) Vagal-derived glial cells (P0+) were present in the pre-umbilical intestine. (F) Enteric progenitor or glial cells expressing nuclear SOX10 were present in the pre-umbilical gastrointestinal tract. Insets (A’–F’) show magnified regions in the corresponding dashed box. Sacral neural crest cells were absent from the pre-umbilical gut. White arrows indicate double-positive cells. Scale bars for main figure (A–F): 80 μm. Scale bars for insets (A’–F’): 10 μm.
Figure 4—figure supplement 1
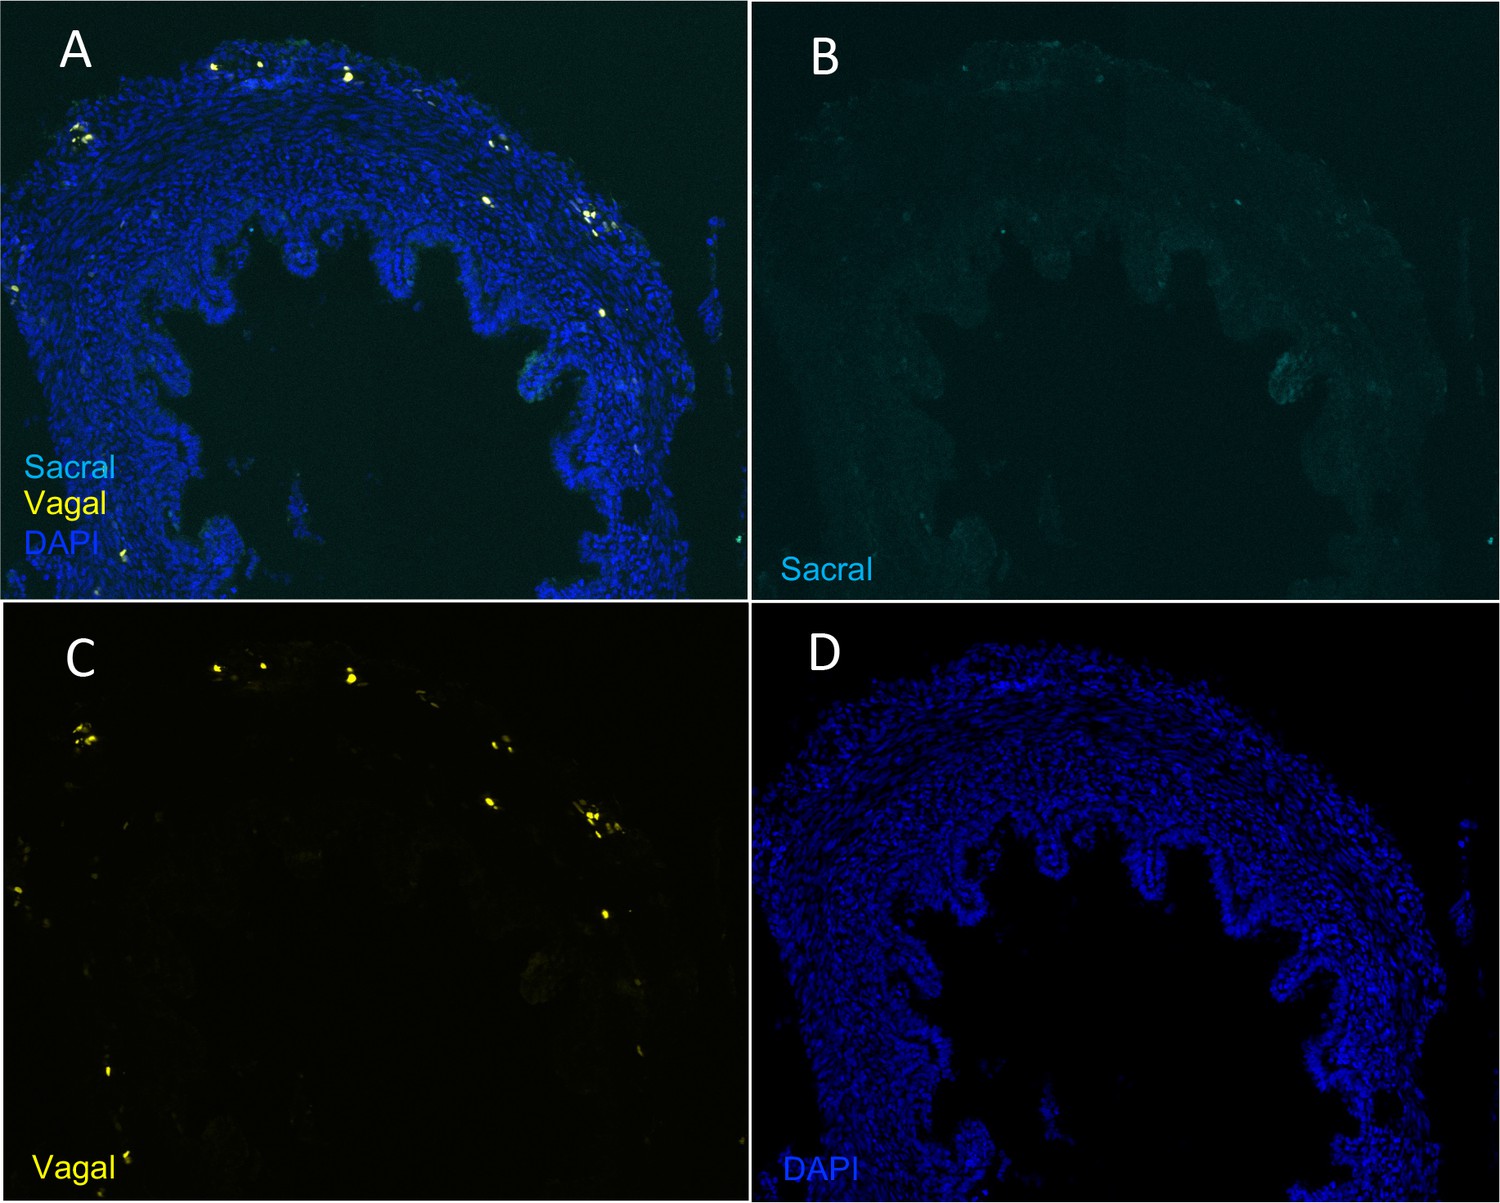
Absence of sacral-derived cells in the E10 pre-umbilical gut.
(A) Transverse section of pre-umbilical gut of E10 embryo with vagal cells (yellow) labeled with H2B-RFP and sacral cells (cyan) labeled with H2B-YFP. (B) YFP channel failed to show the presence of sacral-derived cells. (C) RFP channel containing labeled vagal-derived cells. (D) DAPI staining.
Figure 4—figure supplement 2

Vagal contribution to the pre-umbilical gut separated by channel.
(A) Acetylcholine receptor (ACHR). (B) Differentiated neuronal marker HUC/D. (C) Differentiated neuronal marker TH. (D) Neuronal marker DBH. (E) Glial marker P0. (F) Progenitor marker SOX10. Insets (A’–F’) show magnified regions in the corresponding dashed box. Insets (A’’–F’’) show antibody channel of magnified region. Insets (A’’’–F’’’) show vagal channel. Insets (A’’’’–F’’’’) show DAPI channel. White arrows indicate double-positive cells. Scale bars for main figure (A–F): 80 μm Scale bars for insets: 10 μm.
Figure 5 with 2 supplements
Relative contributions of vagal and sacral neural crest cells to the post-umbilical gut.
(A) Acetylcholine receptor was broadly expressed by vagal neural crest along the post-umbilical gut (inset A’); ACHR was also present in sacral neural crest-derived cells (inset A”). (B, C) Differentiated neuronal markers HUC/D and TH were expressed by vagal (insets B’, C’) neural crest cells in the hindgut, while sacral neural crest cells were most present in the Nerve of Remak (insets B”, C”). (D) DBH expressing vagally derived cells were observed primarily in the myenteric plexus of the hindgut while sacral-derived DBH+ cells were predominantly in the Nerve of Remak (D”). (E) Both populations contributed P0+ glial cells within the plexuses of the hindgut (insets E’–E”). (F) SOX10+ progenitors were derived from both populations with vagal cells residing within the hindgut (inset F’) and sacral cells predominantly located within the Nerve of Remak (inset F”). Insets (A’–F’, A”–F”) show magnified regions in the corresponding dashed box. White arrows indicate double-positive cells. Scale bars for main figure (A–F): 80 μm. Scale bars for insets: 10 μm.
Figure 5—figure supplement 1

Relative contributions of vagal neural crest cells to the post-umbilical gut separated by channel.
(A) Acetylcholine receptor (ACHR). (B) Differentiated neuronal marker HUC/D. (C) Differentiated neuronal marker TH. (D) Neuronal marker DBH. (E) Glial marker P0. (F) Progenitor marker SOX10. Insets (A’–F’) show magnified regions in the corresponding dashed box. Insets (A’’–F’’) show antibody channel of magnified region. Insets (A’’’–F’’’) show vagal channel. Insets (A’’’’–F’’’’) show sacral channel. Insets (A’’’’’–F’’’’’) show DAPI staining. White arrows indicate double-positive cells. Scale bars for main figure (A–F): 80 μm. Scale bars for insets: 10 μm.
Figure 5—figure supplement 2

Relative contributions of sacral neural crest cells to the post-umbilical gut separated by channel.
(A) Acetylcholine receptor (ACHR). (B) Differentiated neuronal marker HUC/D. (C) Differentiated neuronal marker TH. (D) Neuronal marker DBH. (E) Glial marker P0. (F) Progenitor marker SOX10. Insets (A’–F’) show magnified regions in the corresponding dashed box. Insets (A’’–F’’) show antibody channel of magnified region. Insets (A’’’–F’’’) show vagal channel. Insets (A’’’’–F’’’’) show sacral channel. Insets (A’’’’’–F’’’’’) show DAPI staining. White arrows indicate double-positive cells. Scale bars for main figure (A–F): 80 μm. Scale bars for insets: 10 μm.
Figure 6 with 1 supplement
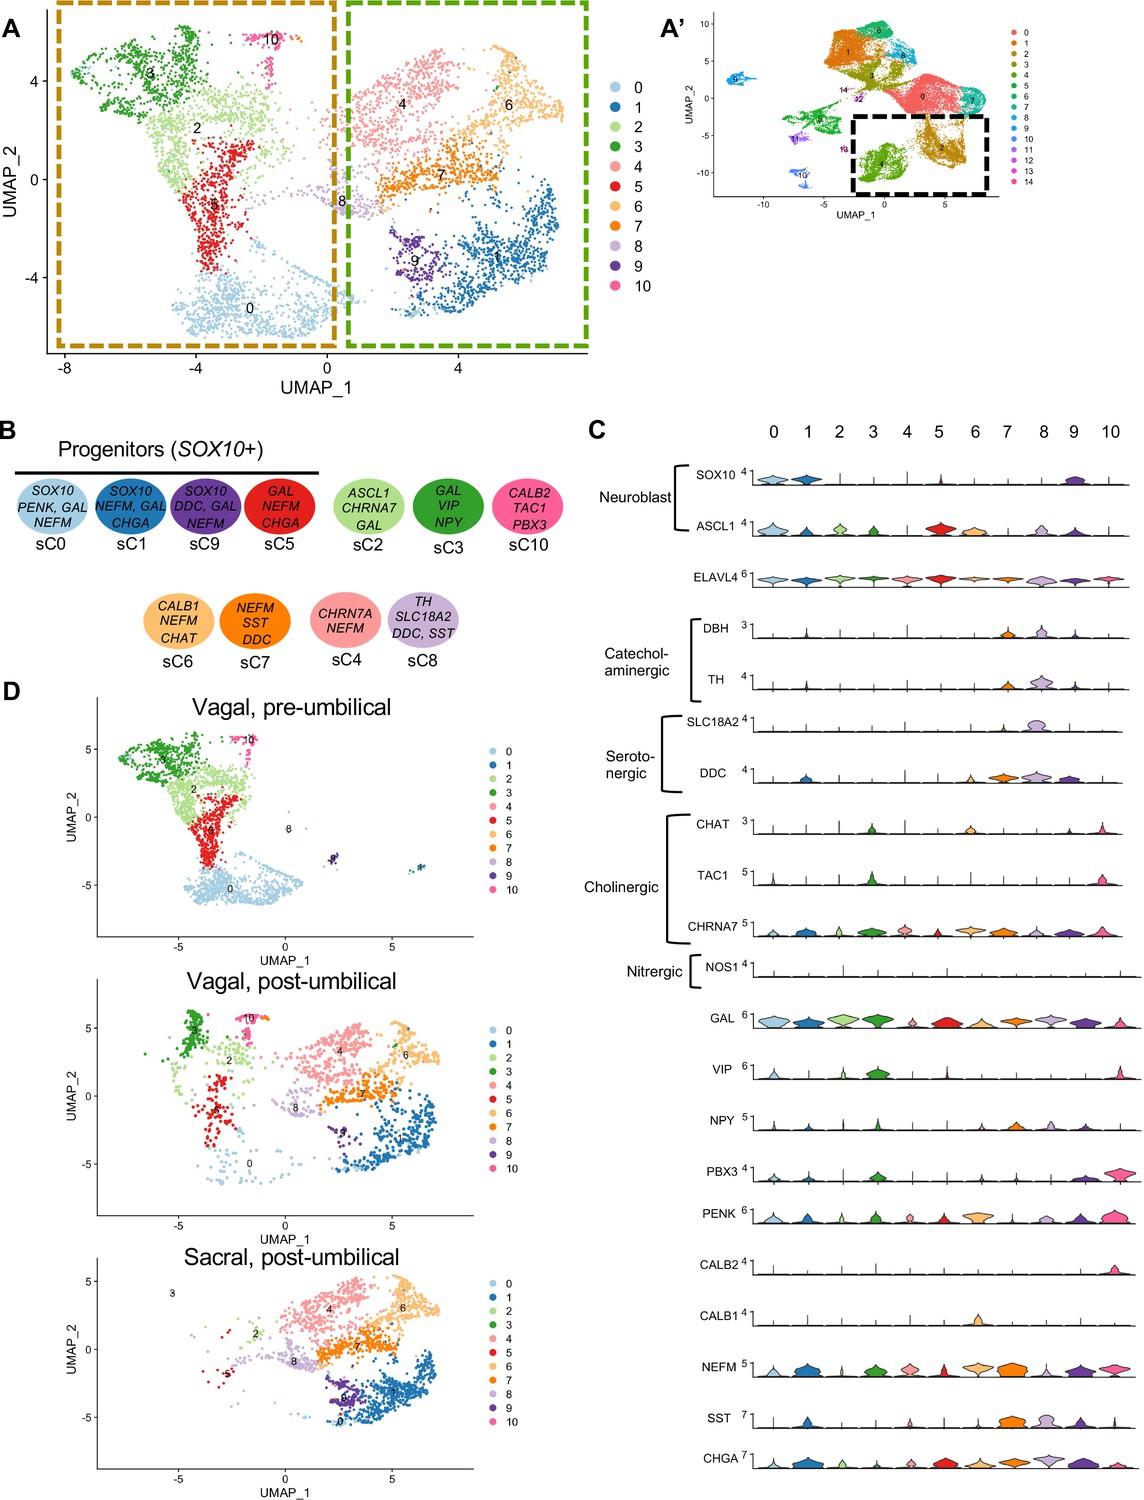
Subclassification of neuronal clusters.
(A) Subclustering of neuronal clusters (resolution of 0.4) (c4, c2 inset A’) resulted in 11 distinct populations (sc0-10). (B) Schematic diagram demonstrating marker genes of each cluster. (C) Violin plots of neurotransmitters, neuropeptides, receptors, and key genes representing neuroblasts and specific neuronal functions such as catecholaminergic, serotonergic, cholinergic, and nitrergic. (D) UMAP representation (resolution 0.4) of each population’s subclustered neuronal cells.
Figure 6—figure supplement 1
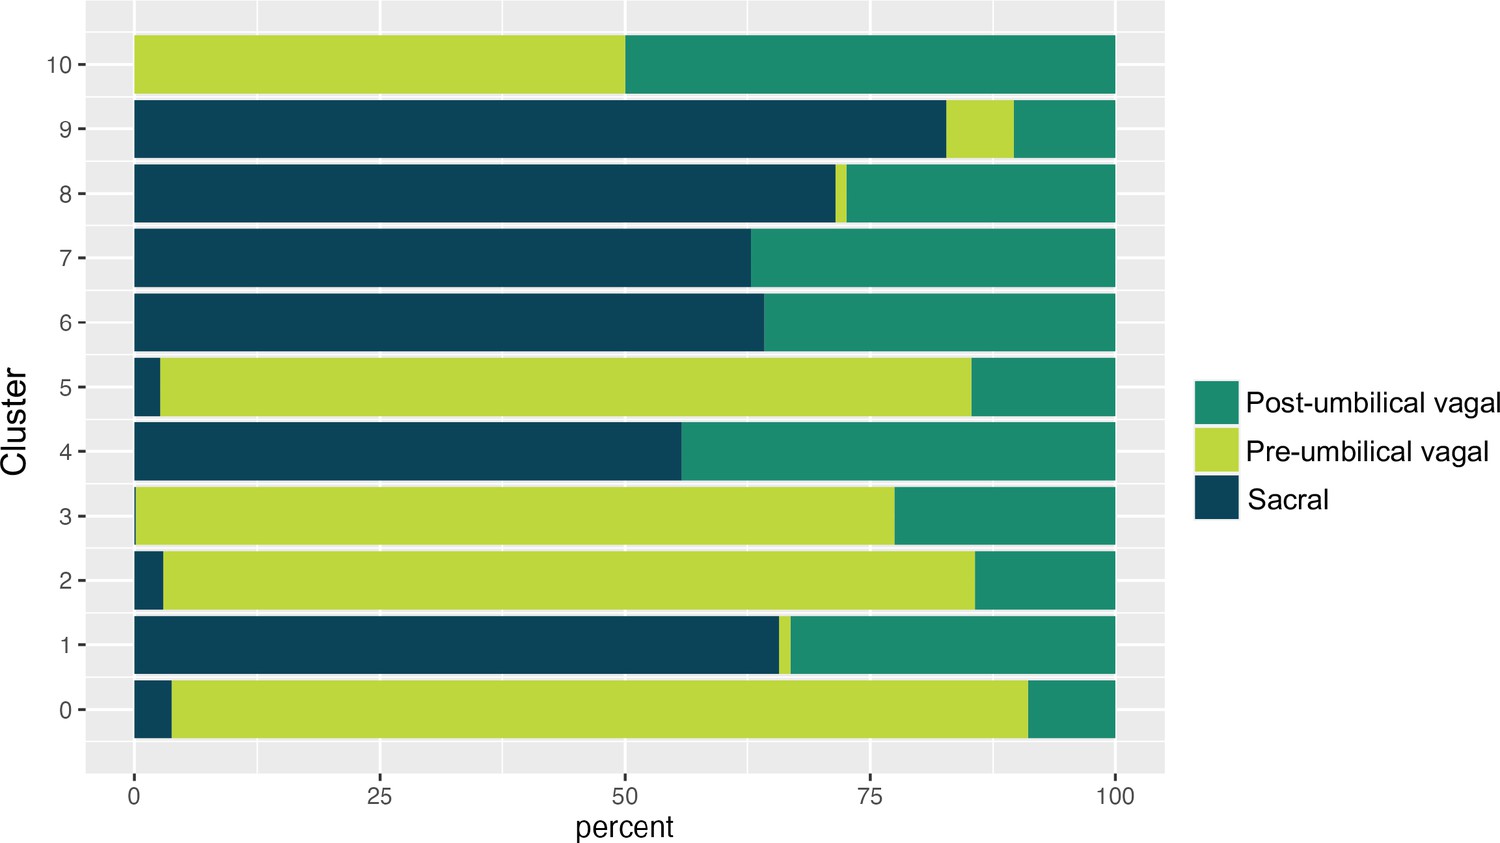
Proportion of pre-umbilical vagal, post-umbilical vagal, and sacral populations across neuronal subclusters.
Figure 7
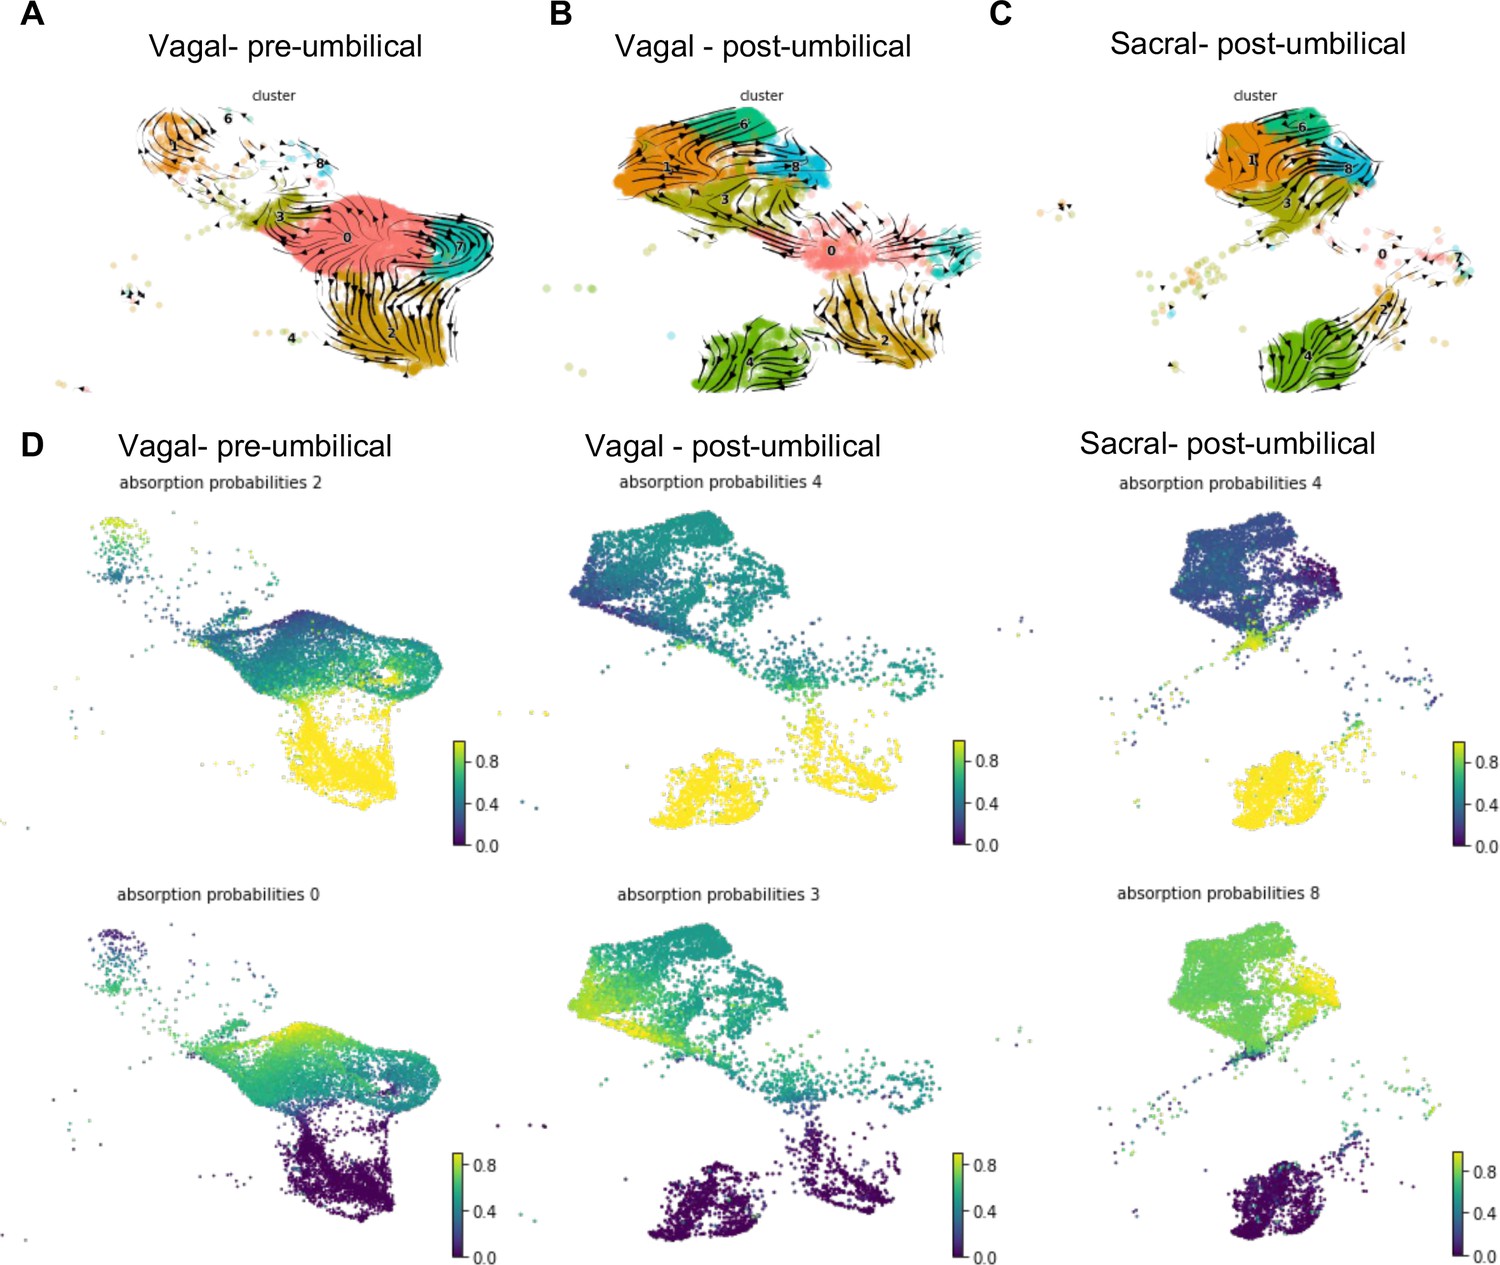
RNA velocity and terminal fate analysis of vagal and sacral neural crest cells in the enteric nervous system (ENS).
(A) Streamlines of RNA velocity projected on UMAP for pre-umbilical vagal-derived cells. (B) Streamlines of RNA velocity projected on UMAP for post-umbilical vagal-derived cells. (C) Streamlines of RNA velocity projected on UMAP for post-umbilical sacral-derived cells. (D) Absorption probabilities for the terminal fates determined in each population: pre-umbilical vagal-derived, post-umbilical vagal-derived, and post-umbilical sacral-derived.
Figure 8 with 1 supplement
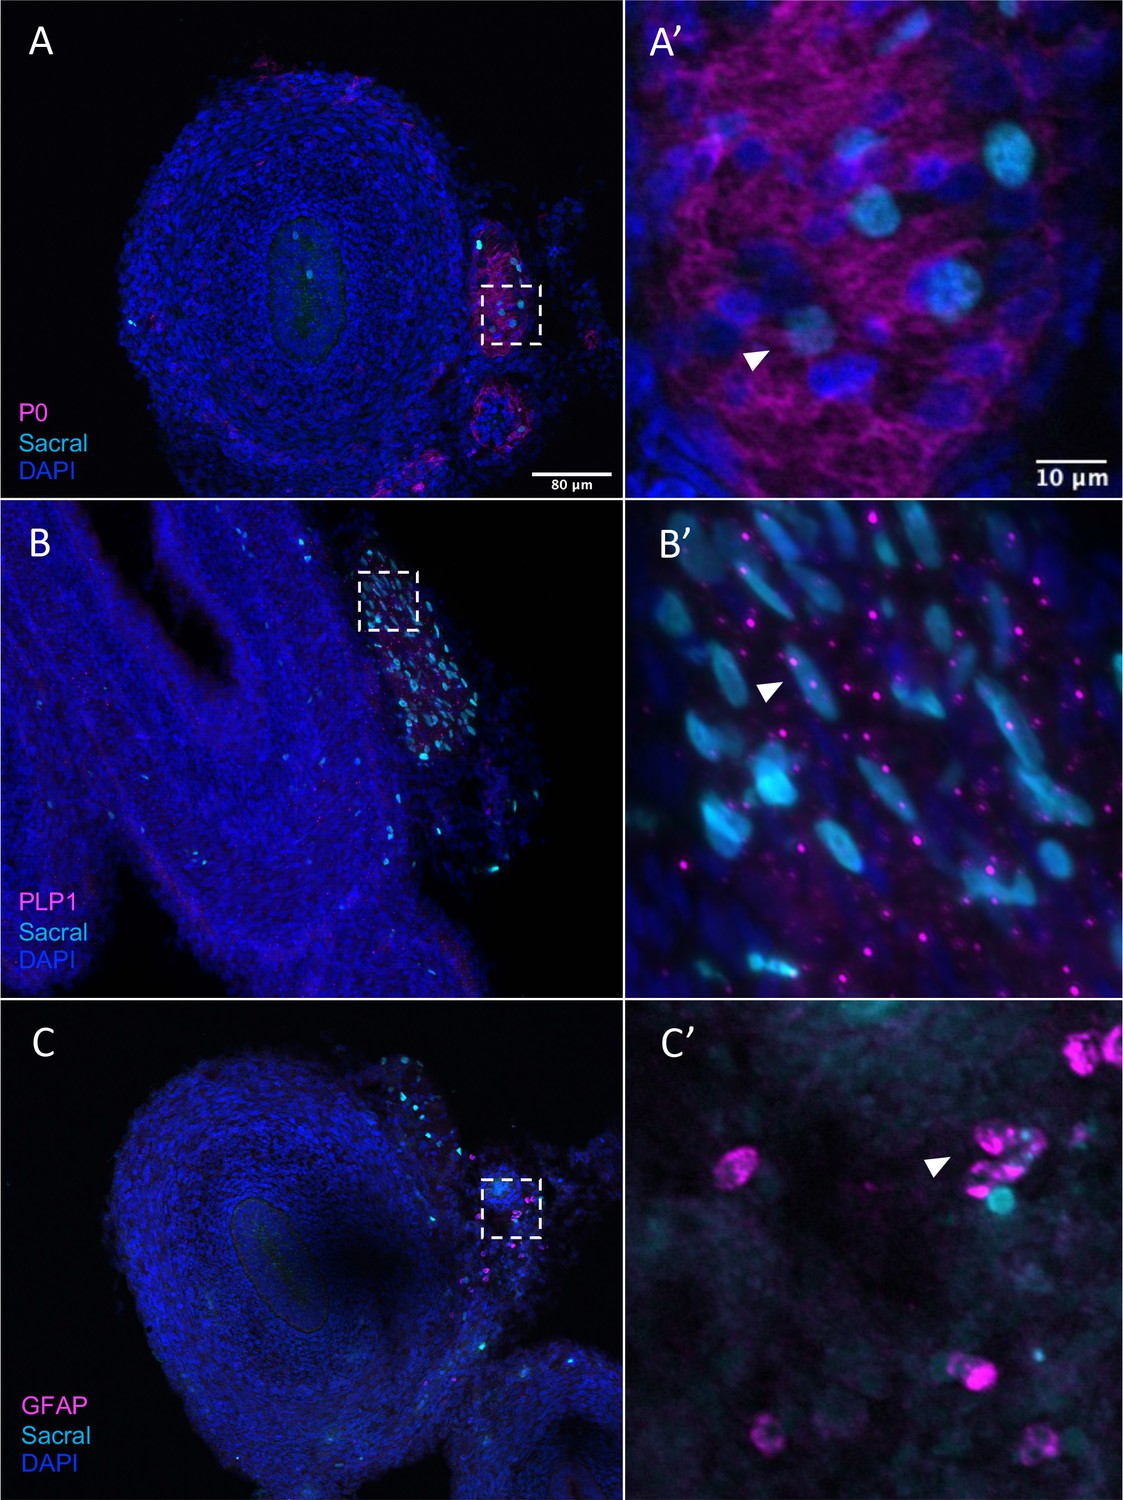
Sacral-derived glial fate in the Nerve of Remak.
Sacral-derived cells contributed enteric glia within the Nerve of Remak labeled with P0 (A, A’), PLP1 (B, B’), and GFAP (C, C’). Insets (A’–E’) show magnified regions in the corresponding dashed box. White arrows indicate double-positive cells. Scale bars for main figure (A–E): 80 μm. Scale bars for insets (A’–E’): 20 μm.
Figure 8—figure supplement 1
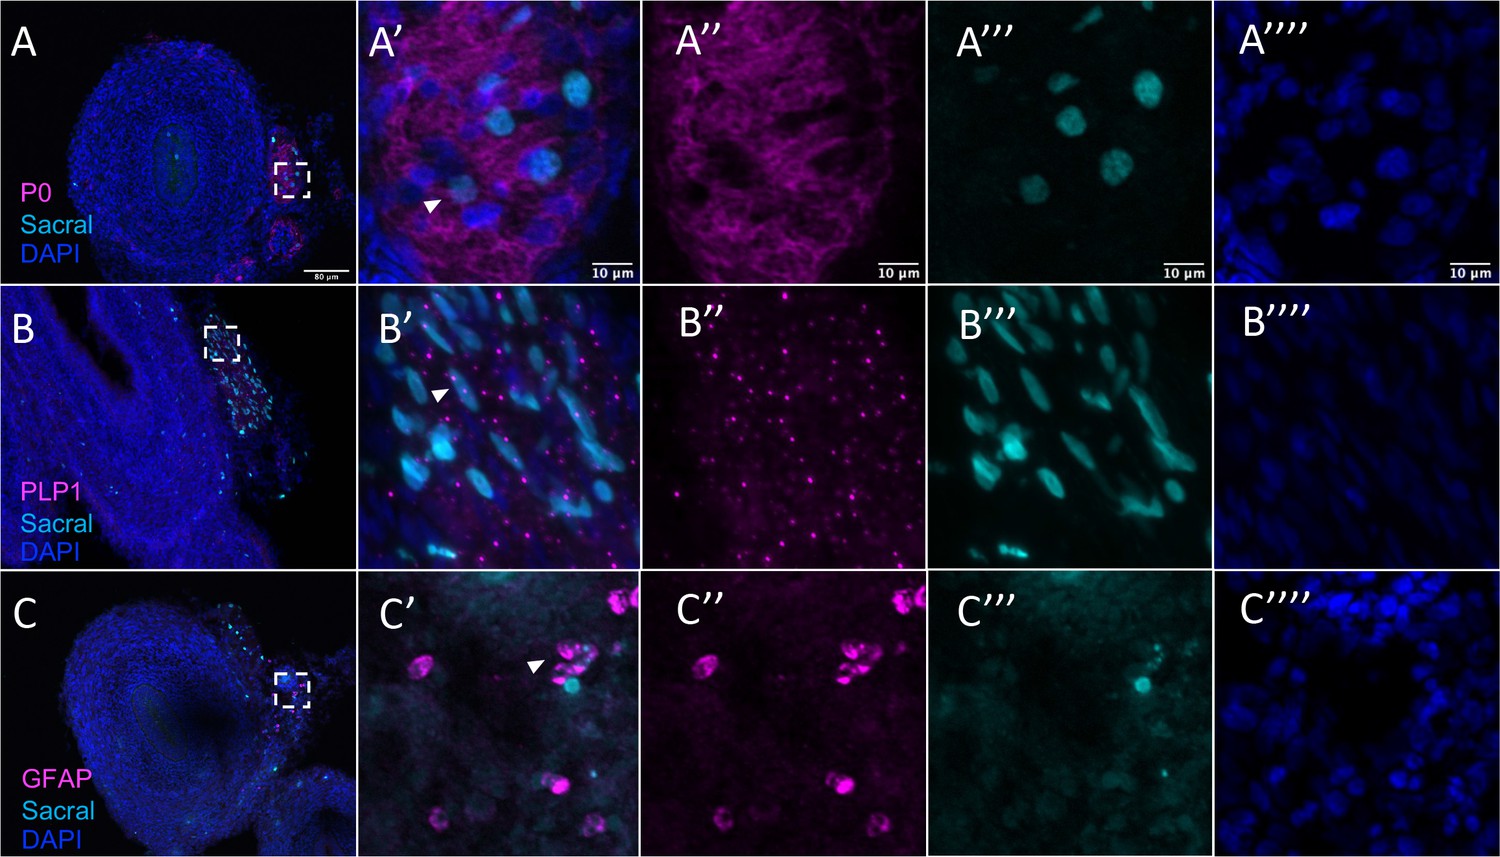
Sacral-derived glial fate in the Nerve of Remak separated by channel.
(A) P0. (B) PLP1. (C) GFAP. Insets (A’–C’) show magnified regions in the corresponding dashed box. Insets (A’’–C’’) show antibody channel of magnified region. Insets (A’’’–C’’’) show vagal channel. Insets (A’’’’–C’’’’) show DAPI staining. White arrows indicate double-positive cells. Scale bars for main figure (A–F): 80 μm. Scale bars for insets: 10 μm.
Additional files
-
Supplementary file 1
Gene markers associated with single-cell RNA-seq clusters of vagal and sacral neural crest-derived cells.
- https://cdn.elifesciences.org/articles/79156/elife-79156-supp1-v2.csv
-
Supplementary file 2
Signaling pathways and transcription factors enriched in vagal and sacral neural crest-derived cells.
- https://cdn.elifesciences.org/articles/79156/elife-79156-supp2-v2.xlsx
-
Supplementary file 3
All cells from neuronal clusters C2 and C4 were re-clustered them into 11 subclusters (sC0-10).
- https://cdn.elifesciences.org/articles/79156/elife-79156-supp3-v2.csv
-
Supplementary file 4
Transcription factors associated with each cluster.
- https://cdn.elifesciences.org/articles/79156/elife-79156-supp4-v2.csv
-
Supplementary file 5
Average number of RIA retrovirus promoter mRNA transcripts per cluster.
- https://cdn.elifesciences.org/articles/79156/elife-79156-supp5-v2.csv
-
MDAR checklist
- https://cdn.elifesciences.org/articles/79156/elife-79156-mdarchecklist1-v2.docx
Download links
A two-part list of links to download the article, or parts of the article, in various formats.
Downloads (link to download the article as PDF)
Open citations (links to open the citations from this article in various online reference manager services)
Cite this article (links to download the citations from this article in formats compatible with various reference manager tools)
Single-cell profiling coupled with lineage analysis reveals vagal and sacral neural crest contributions to the developing enteric nervous system
eLife 12:e79156.
https://doi.org/10.7554/eLife.79156


