How should COVID-19 vaccines be distributed between the Global North and South: a discrete choice experiment in six European countries
- Hochschule für Politik/Munich School of Politics and Public Policy, TUM School of Social Sciences & Technology and TUM School of Medicine, Technical University of Munich, Germany
- TUM School of Social Sciences & Technology, Technical University of Munich, Germany
- Department of Sociology and Social Research, University of Trento, Italy
- Hochschule für Politik/Munich School of Politics and Public Policy and TUM School of Social Sciences & Technology, Germany
Figures
Figure 1 with 1 supplement
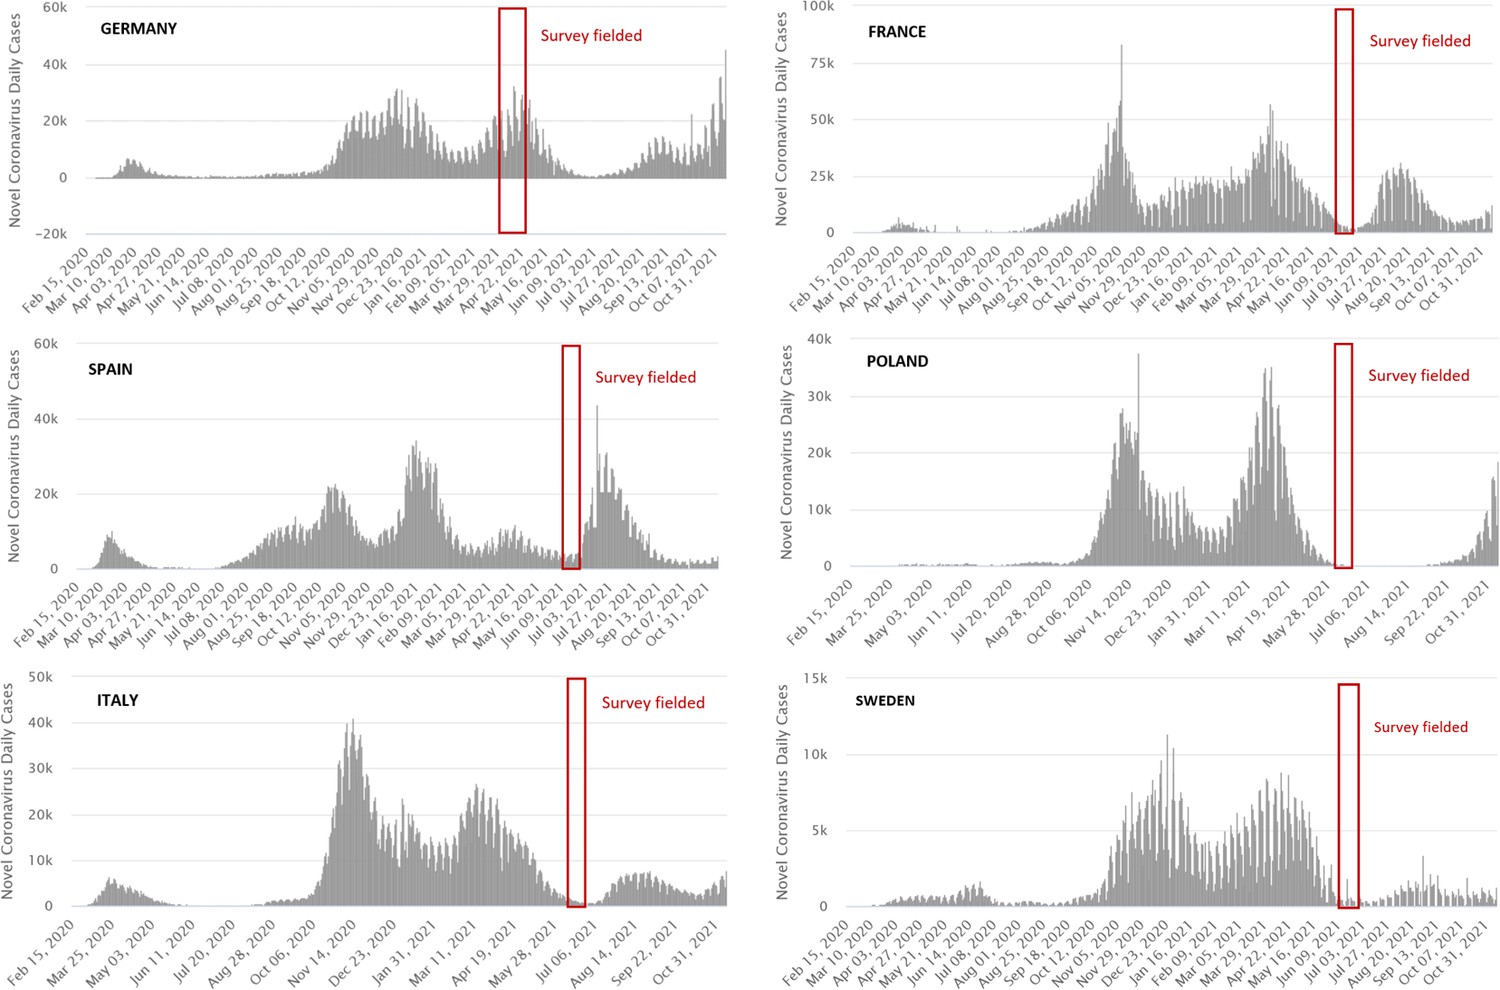
Timeline survey launch and infection rates.
Source for COVID-19 daily case data: Worldometers.info, 2021.
Figure 1—figure supplement 1
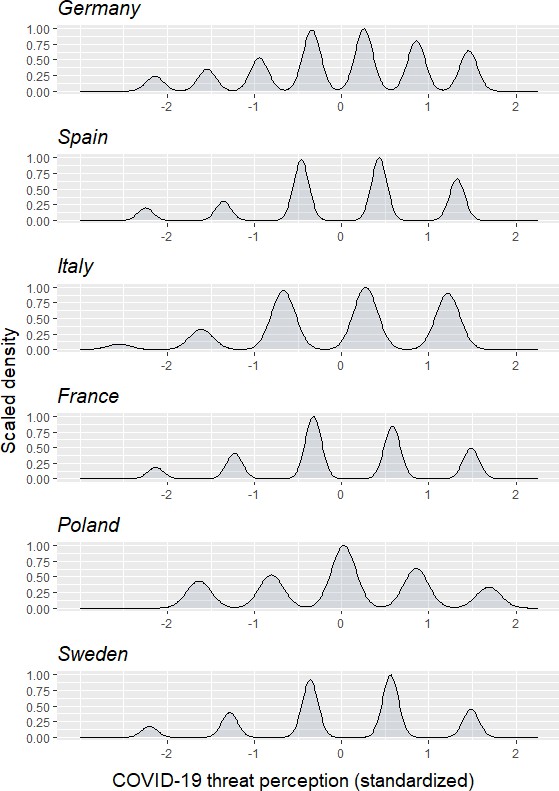
COVID-19 threat perception across countries.
Figure 2
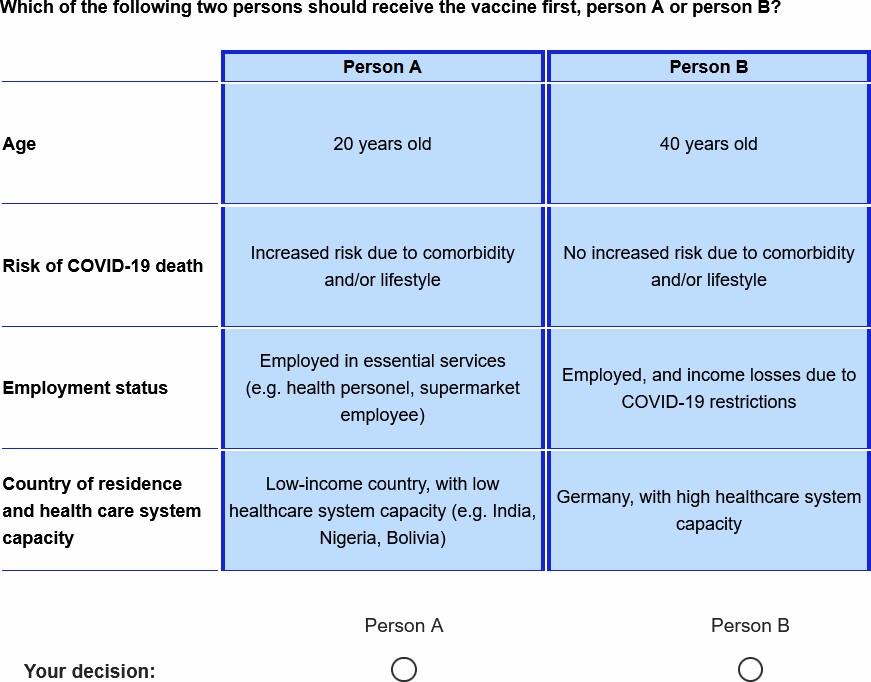
Sample choice set presented to respondents.
Technical notes: The design was determined to be D-efficient based on weak priors for the main attributes effects (without interactions). Statistical efficiency was measured by the D-optimality criterion (D-error), the most widely used metric in this regard. D-optimal or D-efficient designs minimise the determinant of the asymptotic variance-covariance matrix, ensuring minimum variation around the parameter estimates.
Figure 3
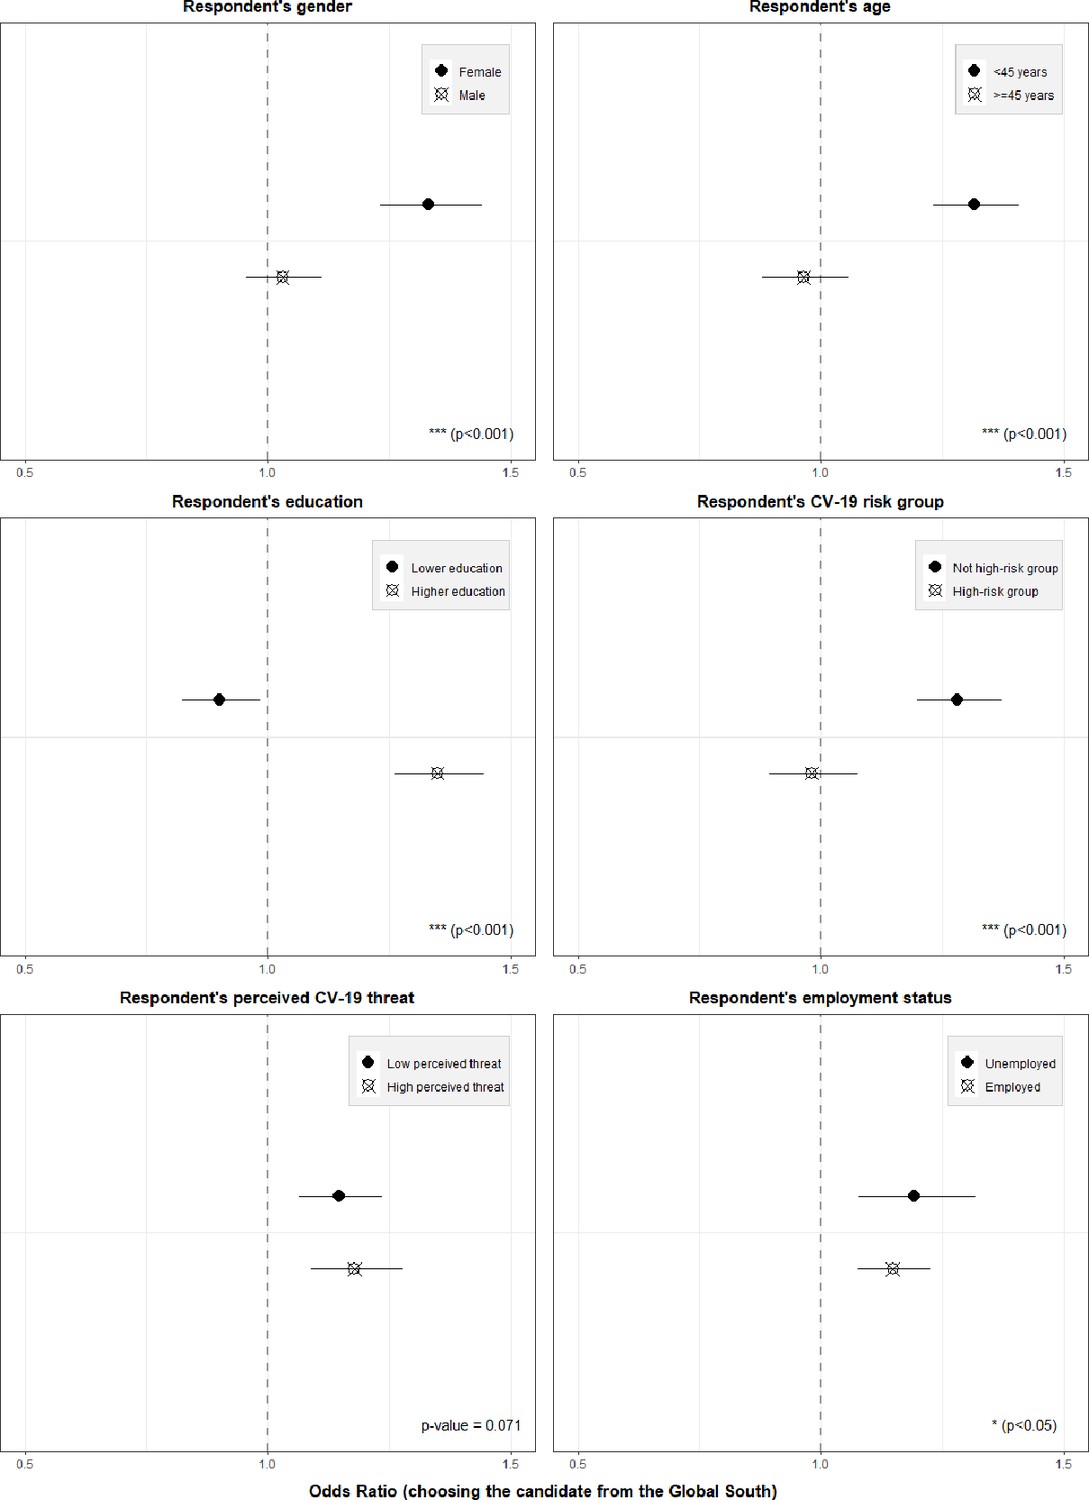
Heterogeneity of country attribute by respondent characteristics (pooled sample).
Notes: Outcome: Choosing the respective candidate to receive the vaccine. Coefficients are odds ratios based on conditional logit estimations (respondent-level fixed effects) with standard errors clustered at the respondent level. Estimations were conducted controlling for the main effects of the other three attributes, but only the results for the candidate’s country of residence attribute are shown here. Results to be interpreted relative to the indicated reference category, i.e. relative to the vaccine being given to a person living in the country of the survey respondent. The p-values on the bottom right of each graph indicates the statistical (in-)significance of the interaction term of the heterogeneity variable in question. For exact coefficients and interaction terms, see Supplementary file 1b, c.
Figure 4

Heterogeneity of country attribute by respondent characteristics (country samples).
Notes: Outcome: Choosing the respective candidate to receive the vaccine. Coefficients are odds ratios based on conditional logit estimations (respondent-level fixed effects) with standard errors clustered at the respondent level Estimations were conducted controlling for the main effects of the other three attributes, but only the results for the candidates’ country of residence attribute are shown here. Results to be interpreted relative to the indicated reference category, i.e. in the case of country of residence, relative to the preference for the vaccine being given to a person living in the country of the survey respondent answering the question. The p-values on the bottom right of each graph indicates the statistical (in-)significance of the interaction term of the heterogeneity variable in question. For exact values of interaction terms, see Supplementary file 1d–i.
Figure 5
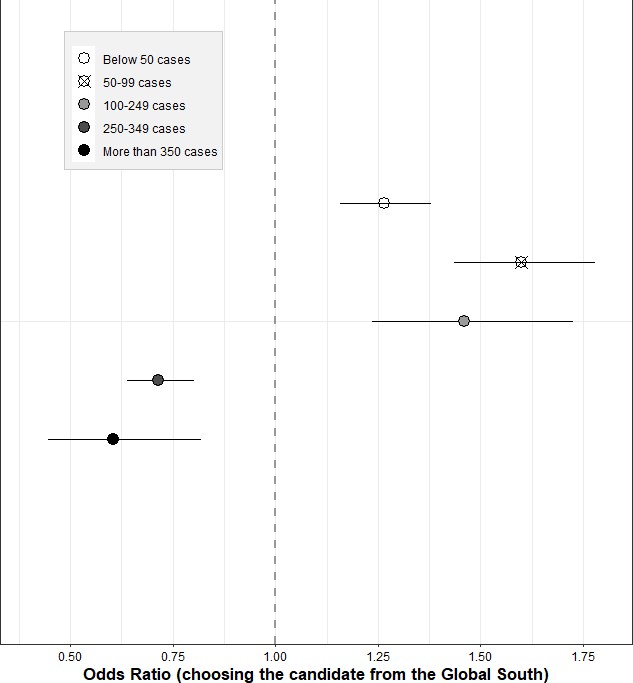
Heterogeneity of country attribute by regional COVID-19 case incidence (pooled sample).
Notes: Outcome: Choosing the respective candidate to receive the vaccine. Coefficients are odds ratios based on conditional logit estimations (respondent-level fixed effects) with standard errors clustered at the respondent level. Data for the regional COVID-19 case incidence was drawn from https://www.ecdc.europa.eu/en/publications-data/weekly-subnational-14-day-notification-rate-covid-19 and reflects the 14-day notification rate of reported COVID-19 cases per 100 000 people, averaged over the data collection time period and sampled regions of the respective country. Estimations were conducted controlling for the main effects of the other three attributes, but only the results for the candidate’s country of residence attribute are shown here. The coefficients are to be interpreted relative to the indicated reference category, i.e. relative to the vaccine being given to a person living in the country of the survey respondent. For exact coefficients, interaction terms, and p-values, see Supplementary file 1j, k.
Tables
Table 1
Socio-demographic characteristics.
| Germany | Spain | Italy | France | Poland | Sweden | |
|---|---|---|---|---|---|---|
| Female | 938 | 471 | 363 | 376 | 365 | 465 |
| (47.76%) | (50.92%) | (47.33%) | (49.09%) | (54.48%) | (49.57%) | |
| Age group | ||||||
| 18–24 | 148 | 111 | 107 | 106 | 185 | 104 |
| (7.54%) | (12.00%) | (13.95%) | (13.84%) | (27.61%) | (11.09%) | |
| 25–34 | 279 | 259 | 163 | 191 | 179 | 268 |
| (14.21%) | (28.00%) | (21.25%) | (24.93%) | (26.72%) | (28.57%) | |
| 35–44 | 361 | 307 | 162 | 217 | 152 | 281 |
| (18.38%) | (33.19) | (21.12%) | (28.33%) | (22.69%) | (29.96%) | |
| 45–54 | 376 | 193 | 177 | 236 | 105 | 179 |
| (19.14%) | (20.86) | (23.08%) | (30.81%) | (15.67%) | (19.08%) | |
| 55–64 | 484 | 52 | 130 | 16 | 41 | 97 |
| (24.64%) | (5.62%) | (16.95%) | (2.09%) | (6.12%) | (10.34%) | |
| 65+ | 316 | 3 | 4 | 0 | 8 | 9 |
| (16.09%) | (0.32%) | (0.52%) | (0%) | (1.19%) | (0.96%) | |
| Education | ||||||
| Primary | 631 | 3 | 27 | 9 | 17 | 40 |
| (32.13%) | (0.32%) | (3.52%) | (1.17%) | (2.54%) | (4.26%) | |
| Secondary | 622 | 171 | 141 | 79 | 130 | 311 |
| (31.67%) | (18.49%) | (18.38%) | (10.31%) | (19.40%) | (33.16%) | |
| Higher | 359 | 264 | 353 | 301 | 337 | 159 |
| (18.28%) | (28.54%) | (46.02%) | (39.30%) | (50.30%) | (16.95%) | |
| University degree | 352 | 487 | 222 | 377 | 186 | 428 |
| (17.92%) | (52.56%) | (28.94%) | (49.22%) | (27.76%) | (45.63%) | |
| Employed | 1,204 | 647 | 480 | 579 | 460 | 753 |
| (61.30%) | (69.95%) | (62.58%) | (75.59%) | (68.66%) | (80.28%) | |
| CV-19 high-risk group | 1,041 | 255 | 204 | 219 | 256 | 190 |
| (53.00%) | (27.57%) | (26.60%) | (28.59%) | (38.21%) | (20.26%) | |
| Elevated CV-19 threat perception | 1,056 | 491 | 434 | 349 | 222 | 462 |
| (53.88%) | (53.08%) | (58.41%) | (45.56%) | (33.13%) | (49.25%) | |
| Observations | 1964 | 925 | 767 | 766 | 670 | 938 |
-
The table shows sample characteristics of participants by country, reporting both the absolute number of participants as well as the relative proportion of the respective characteristic prevalent in the sample. ‘CV-19’ denotes ‘COVID-19’.
Table 2
Full list of choice sets of the DCE and observed respondents’ choices.
| Choice set | Age in years | COVID-19 mortality risk | Employment status | Country of residence and healthcare system capacity | Share of respondents who selected Person A and Person B within the given choice set (see col. 1) | ||||||
|---|---|---|---|---|---|---|---|---|---|---|---|
| Pooled | Germany | Spain | Italy | France | Poland | Sweden | |||||
| 1 Person A | 40 | No increased risk due to comorbidity and/or lifestyle | Not employed | *[Respondents’ country of residence], with high healthcare system capacity | 16.77% | 16.70% | 14.70% | 19.04% | 15.14% | 24.93% | 12.58% |
| 1 Person B | 40 | Strongly increased risk due to comorbidity and/or lifestyle | Employed and guaranteed income | Low-income country, with poor healthcare system capacity | 83.23% | 83.23% | 85.30% | 80.96% | 84.86% | 75.07% | 87.42% |
| 2 Person A | 60 | Strongly increased risk due to comorbidity and/or lifestyle | Employed and guaranteed income | *[Respondents’ country of residence], with high healthcare system capacity | 57.41% | 63.44% | 46.70% | 51.76% | 58.62% | 58.96% | 57.89% |
| 2 Person B | 60 | No increased risk due to comorbidity and/or lifestyle | Employed in essential services | Low-income country, with poor healthcare system capacity | 42.59% | 36.56% | 53.30% | 48.24% | 41.38% | 41.04% | 42.11% |
| 3 Person A | 60 | Increased risk due to comorbidity and/or lifestyle | Employed and income losses due to COVID-19 restrictions | *[Respondents’ country of residence], with high healthcare system capacity | 57.06% | 68.74% | 45.51% | 46.94% | 58.49% | 55.22% | 52.45% |
| 3 Person B | 80 | Increased risk due to comorbidity and/or lifestyle | Not employed | Low-income country, with poor healthcare system capacity | 42.94% | 31.26% | 54.49% | 53.06% | 41.51% | 44.78% | 47.55% |
| 4 Person A | 20 | Increased risk due to comorbidity and/or lifestyle | Employed in essential services | Low-income country, with poor healthcare system capacity | 73.53% | 74.59% | 75.78% | 67.80% | 67.80% | 61.19% | 81.66% |
| 4 Person B | 40 | No increased risk due to comorbidity and/or lifestyle | Employed and income losses due to COVID-19 restrictions | *[Respondents’ country of residence], with high healthcare system capacity | 26.47% | 25.41% | 24.22% | 32.20% | 32.20% | 38.81% | 18.34% |
| 5 Person A | 40 | No increased risk due to comorbidity and/or lifestyle | Employed in essential services | *[Respondents’ country of residence], with high healthcare system capacity | 52.16% | 63.85% | 51.24% | 46.94% | 74.67% | 47.31% | 44.67% |
| 5 Person B | 20 | Increased risk due to comorbidity and/or lifestyle | Not employed | Low-income country, with poor healthcare system capacity | 47.84% | 36.15% | 48.76% | 53.06% | 25.33% | 52.69% | 55.33% |
| 6 Person A | 20 | Strongly increased risk due to comorbidity and/or lifestyle | Employed and income losses due to COVID-19 restrictions | Low-income country, with poor healthcare system capacity | 79.98% | 79.89% | 85.51% | 77.18% | 80.55% | 68.51% | 84.75% |
| 6 Person B | 20 | No increased risk due to comorbidity and/or lifestyle | Employed and guaranteed income | *[Respondents’ country of residence], with high healthcare system capacity | 20.02% | 20.11% | 14.49% | 22.82% | 19.45% | 31.49% | 15.25% |
| 7 Person A | 80 | Increased risk due to comorbidity and/or lifestyle | Not employed | Low-income country, with poor healthcare system capacity | 42.70% | 31.82% | 52.00% | 53.98% | 41.64% | 49.40% | 43.18% |
| 7 Person B | 60 | Increased risk due to comorbidity and/or lifestyle | Employed and income losses due to COVID-19 restrictions | *[Respondents’ country of residence], with high healthcare system capacity | 57.30% | 68.18% | 48.00% | 46.02% | 58.36% | 50.60% | 56.82% |
| 8 Person A | 40 | No increased risk due to comorbidity and/or lifestyle | Employed and guaranteed income | Low-income country, with poor healthcare system capacity | 14.49% | 7.89% | 13.19% | 29.07% | 15.93% | 22.54% | 10.77% |
| 8 Person B | 40 | Strongly increased risk due to comorbidity and/or lifestyle | Employed in essential services | *[Respondents’ country of residence], with high healthcare system capacity | 85.51% | 92.11% | 86.81% | 70.93% | 84.07% | 77.46% | 89.23% |
-
*
[Respondents’ country of residence] was differed depending on the respective country in which the survey was fielded. E.g. in the German sample, this attribute level was ’Germany, with high healthcare system capacity’. The design was determined with a built-in constraint for the attributes Age and Employment status in order to avoid implausible combinations (specifically, an age of 80 was always combined with not being employed).
Table 3
Main attribute effects by country.
| Germany | Spain | Italy | France | Poland | Sweden | |
|---|---|---|---|---|---|---|
| (1) | (2) | (3) | (4) | (5) | (6) | |
| Age | ||||||
| 20 years (Reference category) | ||||||
| 40 years | 1.39*** | 1.25*** | 1.16*** | 1.15*** | 1.08* | 1.13*** |
| [1.33,1.45] | [1.17,1.33] | [1.09,1.22] | [1.08,1.22] | [1.02,1.14] | [1.06,1.20] | |
| 60 years | 0.87*** | 0.85*** | 0.88*** | 0.87*** | 0.85*** | 0.77*** |
| [0.83,0.90] | [0.80,0.91] | [0.84,0.94] | [0.82,0.93] | [0.80,0.91] | [0.73,0.82] | |
| 80 years | 0.81*** | 1.23** | 1.12 | 0.59*** | 0.94 | 0.70*** |
| [0.73,0.90] | [1.06,1.43] | [0.94,1.33] | [0.50,0.69] | [0.78,1.13] | [0.61,0.81] | |
| COVID-19 mortality risk | ||||||
| Average (Reference category) | ||||||
| Increased | 5.63*** | 3.05*** | 2.27*** | 4.54*** | 2.40*** | 5.67*** |
| [5.13,6.19] | [2.66,3.50] | [1.96,2.64] | [3.88,5.31] | [2.07,2.79] | [4.91,6.56] | |
| Strongly increased | 13.23*** | 9.68*** | 4.36*** | 9.04*** | 4.35*** | 14.20*** |
| [11.64,15.03] | [8.12,11.53] | [3.69,5.15] | [7.50,10.91] | [3.65,5.19] | [11.75,17.17] | |
| Employment situation | ||||||
| Not employed (Reference category) | ||||||
| Employed (guaranteed income) | 1.30*** | 0.79*** | 1.14 | 1.04 | 1.06 | 1.00 |
| [1.18,1.42] | [0.68,0.92] | [0.99,1.32] | [0.89,1.22] | [0.91,1.24] | [0.87,1.16] | |
| Employed (income losses) | 2.37*** | 1.91*** | 1.67*** | 1.65*** | 1.36*** | 1.73*** |
| [2.19,2.56] | [1.71,2.13] | [1.49,1.87] | [1.47,1.86] | [1.21,1.53] | [1.54,1.94] | |
| Essential services | 6.01*** | 4.05*** | 2.27*** | 2.74*** | 1.88*** | 4.22*** |
| [5.38,6.72] | [3.50,4.70] | [1.98,2.59] | [2.33,3.22] | [1.65,2.15] | [3.57,4.99] | |
| Country of residence | ||||||
| Respondents’ country (Reference category) | ||||||
| Global South | 0.69*** | 1.79*** | 1.74*** | 1.37*** | 0.99 | 1.43*** |
| [0.62,0.76] | [1.55,2.06] | [1.50,2.01] | [1.18,1.59] | [0.86,1.15] | [1.24,1.65] | |
| Log likelihood | –14428.91 | –7090.45 | –6541.07 | –5994.74 | –5860.07 | –6875.04 |
| AIC | 28875.82 | 14198.89 | 13100.14 | 12007.48 | 11738.15 | 13768.07 |
| BIC | 28951.02 | 14267.31 | 13166.88 | 12074.21 | 11803.67 | 13836.62 |
| Pseudo R2 | 0.22 | 0.19 | 0.10 | 0.17 | 0.08 | 0.23 |
| Observations | 31424 | 14800 | 12272 | 12256 | 10720 | 15008 |
-
Coefficients are odds ratios based on conditional logit estimations (respondent-level fixed effects) with standard errors clustered at the respondent level. Results to be interpreted relative to the indicated reference category, that is in the case of ‘Country of residence’, relative to the preference for the vaccine being given to a person living in the country of the survey respondent answering the question. 95% confidence intervals in brackets. *p<0.05, **p<0.01, ***p<0.001. Sample sizes reflect the eight choice tasks performed by each respondent.
Additional files
-
Supplementary file 1
The supplementary file contains supplementary tables to further contextualise the results.
(a) Population Census Data for Key Sociodemographic Variables. (b) Country of residence attribute main effect - By subgroups of respondent characteristics (pooled sample). (c) Country of residence attribute: Heterogeneity by respondent’s characteristics (pooled results). (d) Country of residence attribute: Heterogeneity by respondent’s characteristics (German sample). (e) Country of residence attribute: Heterogeneity by respondent’s characteristics (Spanish sample). (f) Country of residence attribute: Heterogeneity by respondent’s characteristics (Italian sample). (g) Country of residence attribute: Heterogeneity by respondent’s characteristics (French sample). (h) Country of residence attribute: Heterogeneity by respondent’s characteristics (Polish sample). (i) Country of residence attribute: Heterogeneity by respondent’s characteristics (Swedish sample). (j) Country of residence attribute main effect - By subgroups of regional case incidence (pooled sample). (k) Country of residence attribute: Heterogeneity by regional case incidence (pooled results). (l) Country level differences in case incidence, vaccination rates, willingness and threat perception
- https://cdn.elifesciences.org/articles/79819/elife-79819-supp1-v2.docx
-
MDAR checklist
- https://cdn.elifesciences.org/articles/79819/elife-79819-mdarchecklist1-v2.pdf
Download links
A two-part list of links to download the article, or parts of the article, in various formats.
Downloads (link to download the article as PDF)
Open citations (links to open the citations from this article in various online reference manager services)
Cite this article (links to download the citations from this article in formats compatible with various reference manager tools)
How should COVID-19 vaccines be distributed between the Global North and South: a discrete choice experiment in six European countries
eLife 11:e79819.
https://doi.org/10.7554/eLife.79819


