Lineage-specific differences and regulatory networks governing human chondrocyte development
- Human Evolutionary Biology, Harvard University, United States
- Department of Orthopedic Research, Boston Children’s Hospital, United States
- Department of Orthopedic Surgery, Harvard Medical School, United States
- Department of Molecular and Cellular Biology, Harvard University, United States
- Broad Institute of MIT and Harvard, United States
- Harvard Stem Cell Institute, United States
Figures
Figure 1 with 4 supplements
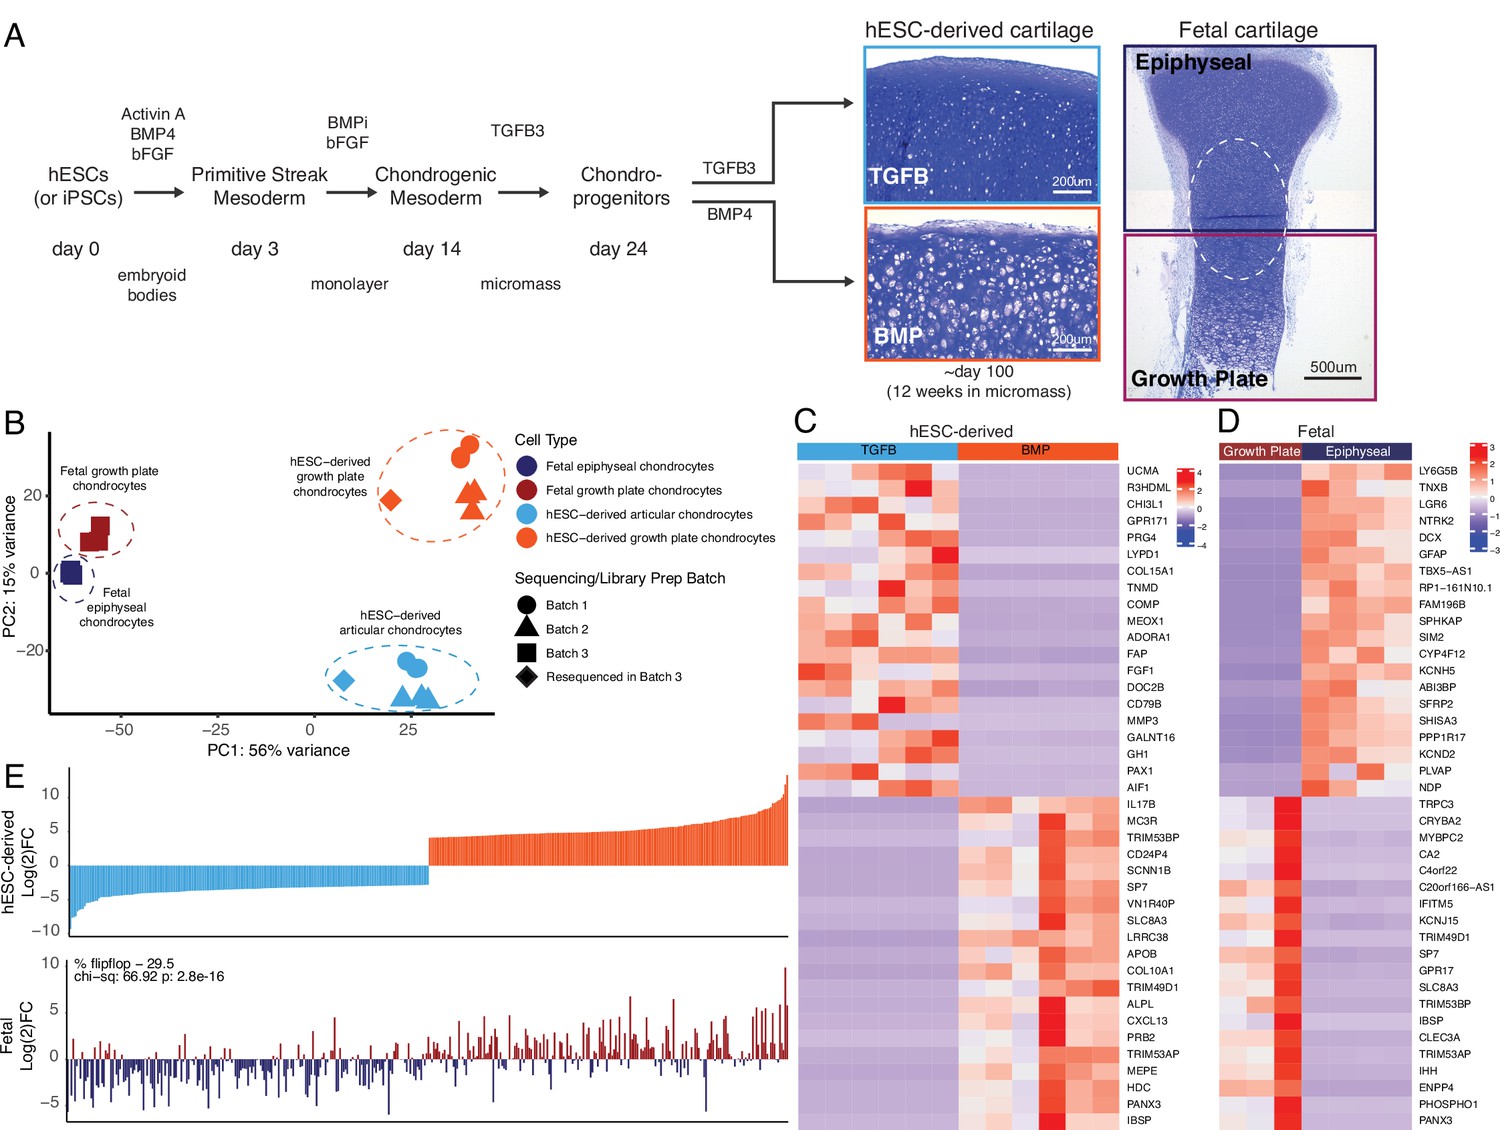
hESC-derived articular and growth plate chondrocytes have distinct transcriptional profiles that are similar to their respective fetal cartilage counterparts.
(A) Brief methods to generate hESC-derived cartilage accompanied by toluidine-blue staining sections of hESC-derived articular (TGFB) and growth plate-like (BMP) cartilage tissues and the epiphyseal and growth plate cartilage of a developing fetal cartilage (E59 proximal tibia) show distinct chondrocyte morphology and proteoglycan-rich matrix. Fetal dissection location noted is approximate, and the dotted circle highlights the overlap of chondrocytes with similar phenotypes likely present in both samples following dissection. (B) PCA plot of RNA-seq expression data from hESC-derived and fetal cartilages. Legend indicates cell type and sequencing batch. (C) Expression heatmap of the top 20 differentially-expressed genes (DEGs) up- and down-regulated when comparing hESC-derived articular and growth plate cartilage. Red/blue color scale indicates Z-score expression values across samples in each plot. Columns indicate biological replicates. (D) Expression heatmap of the top 20 DEGs up- and down-regulated when comparing fetal epiphyseal and growth plate cartilage tissues. Red/blue color scale indicates Z-score expression values across samples in each plot. Columns indicate biological replicates. (E) The top 100 DEGs up- and down-regulated in the hESC-derived cartilages (top) were compared with equivalent log(2)FC values from the fetal cartilage (bottom).
Figure 1—figure supplement 1
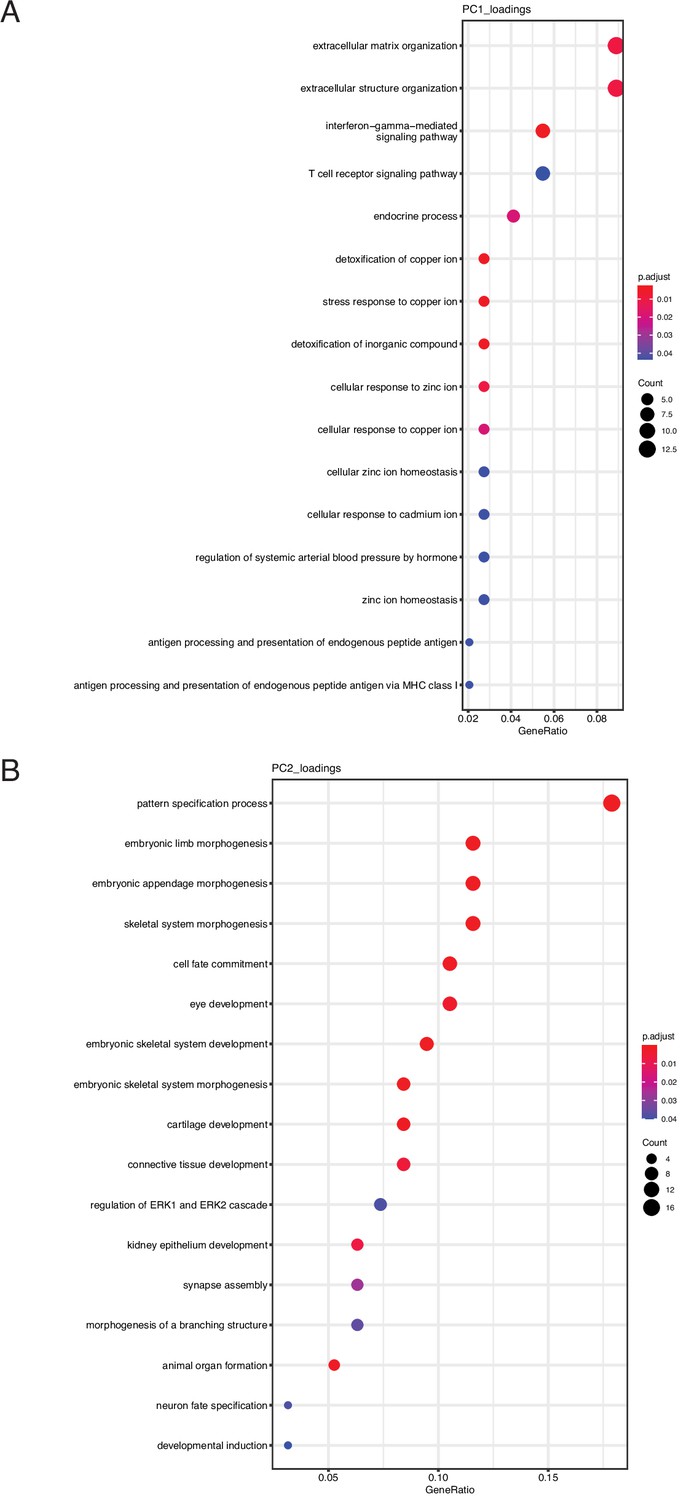
Gene-set GO biological process enrichments for the top 200 gene loadings of principle component 1 (PC1) and PC2.
(A) Gene-set GO biological process enrichments for the top 200 gene loadings of PC1. (B) Gene-set GO biological process enrichments for the top 200 gene loadings of PC2.
Figure 1—figure supplement 2
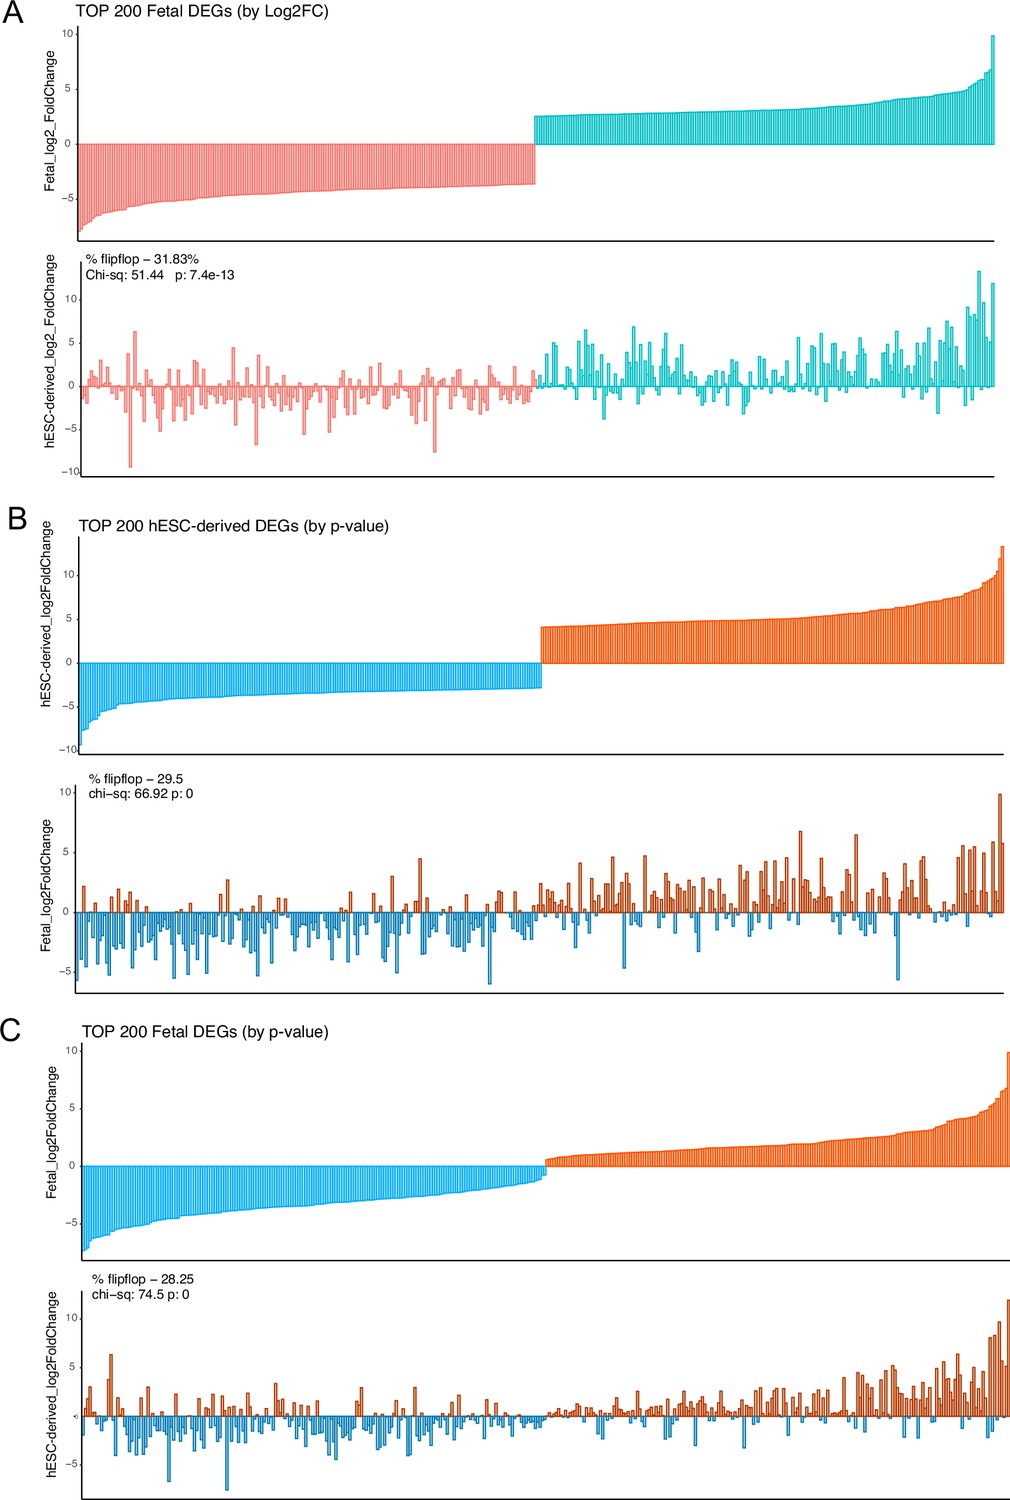
Direction sharing of top differentially-expressed genes (DEGs) (by log(2)FC or p-value) between in vitro-derived and primary tissue samples.
(A) The top 200 DEGs ordered by log(2)FC (100 each up- and down-regulated) in the fetal articular and fetal growth plate cartilage (top) were compared with equivalent log(2)FC values from the hESC-derived cartilages (bottom). (B) The log(2)FC of the top 200 DEGs with the lowest p-value (100 each up- and down-regulated) in the hESC-derived cartilages (top) were compared to the equivalent log(2)FC values from the fetal articular and fetal growth plate cartilage (bottom). (C) The log(2)FC of the top 200 DEGs with the lowest p-value (100 each up- and down-regulated) in the fetal cartilages (top) were compared to the equivalent log(2)FC values from the hESC-derived cartilages (bottom).
Figure 1—figure supplement 3
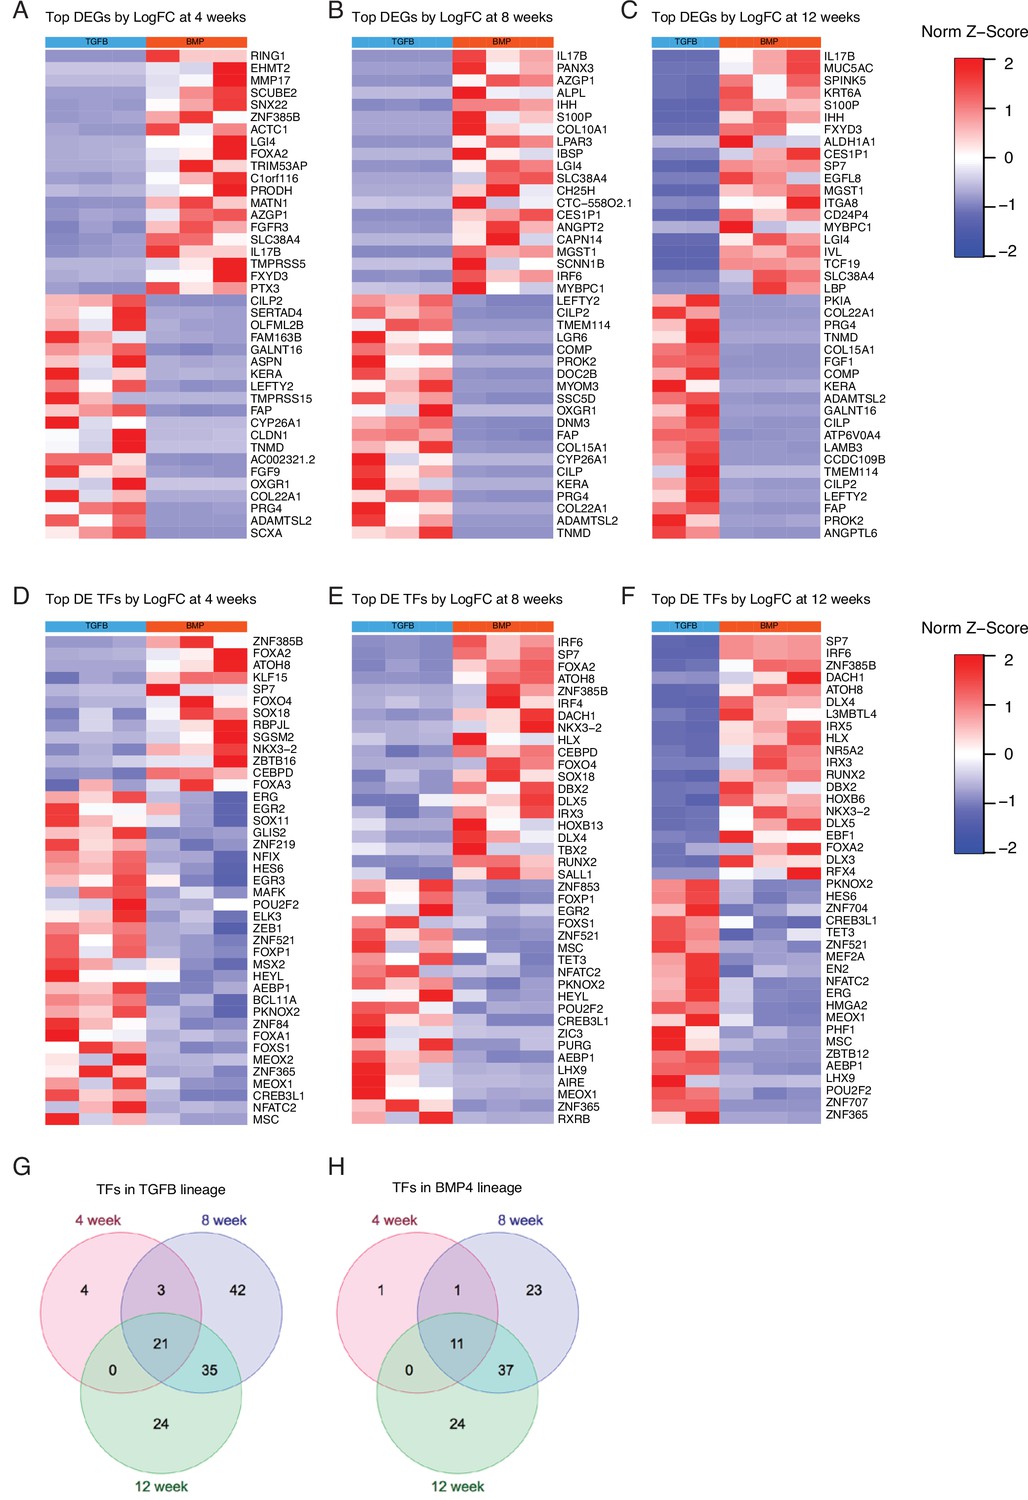
hESC-derived articular and growth plate chondrocytes have distinct transcriptional profiles at early, mid, and late stages of differentiation.
(A–C) Expression heatmap of the top 20 differentially-expressed genes (DEGs) up- and down-regulated when comparing hESC-derived articular and growth plate cartilage after 4 weeks (A), 8 weeks (B), and 12 weeks (C) of differentiation. (D–F) Expression heatmap of the top 20 differentially-expressed transcription factors (TFs) up- and down-regulated when comparing hESC-derived articular and growth plate cartilage after 4 weeks (D), 8 weeks (E), and 12 weeks (F) of differentiation. Red/blue color scale indicates Z-score expression values across samples in each plot. Columns indicate biological replicates. (G–H) Venn diagrams depicting the number of differentially expressed TFs in the articular cartilage (TGFB-treated) lineage (G) or the growth plate cartilage (BMP4-treated) lineage (H) that are unique at early (4 weeks), mid (8 weeks), and late stages (12 weeks) of differentiation, or shared at indicated stages.
Figure 1—figure supplement 4
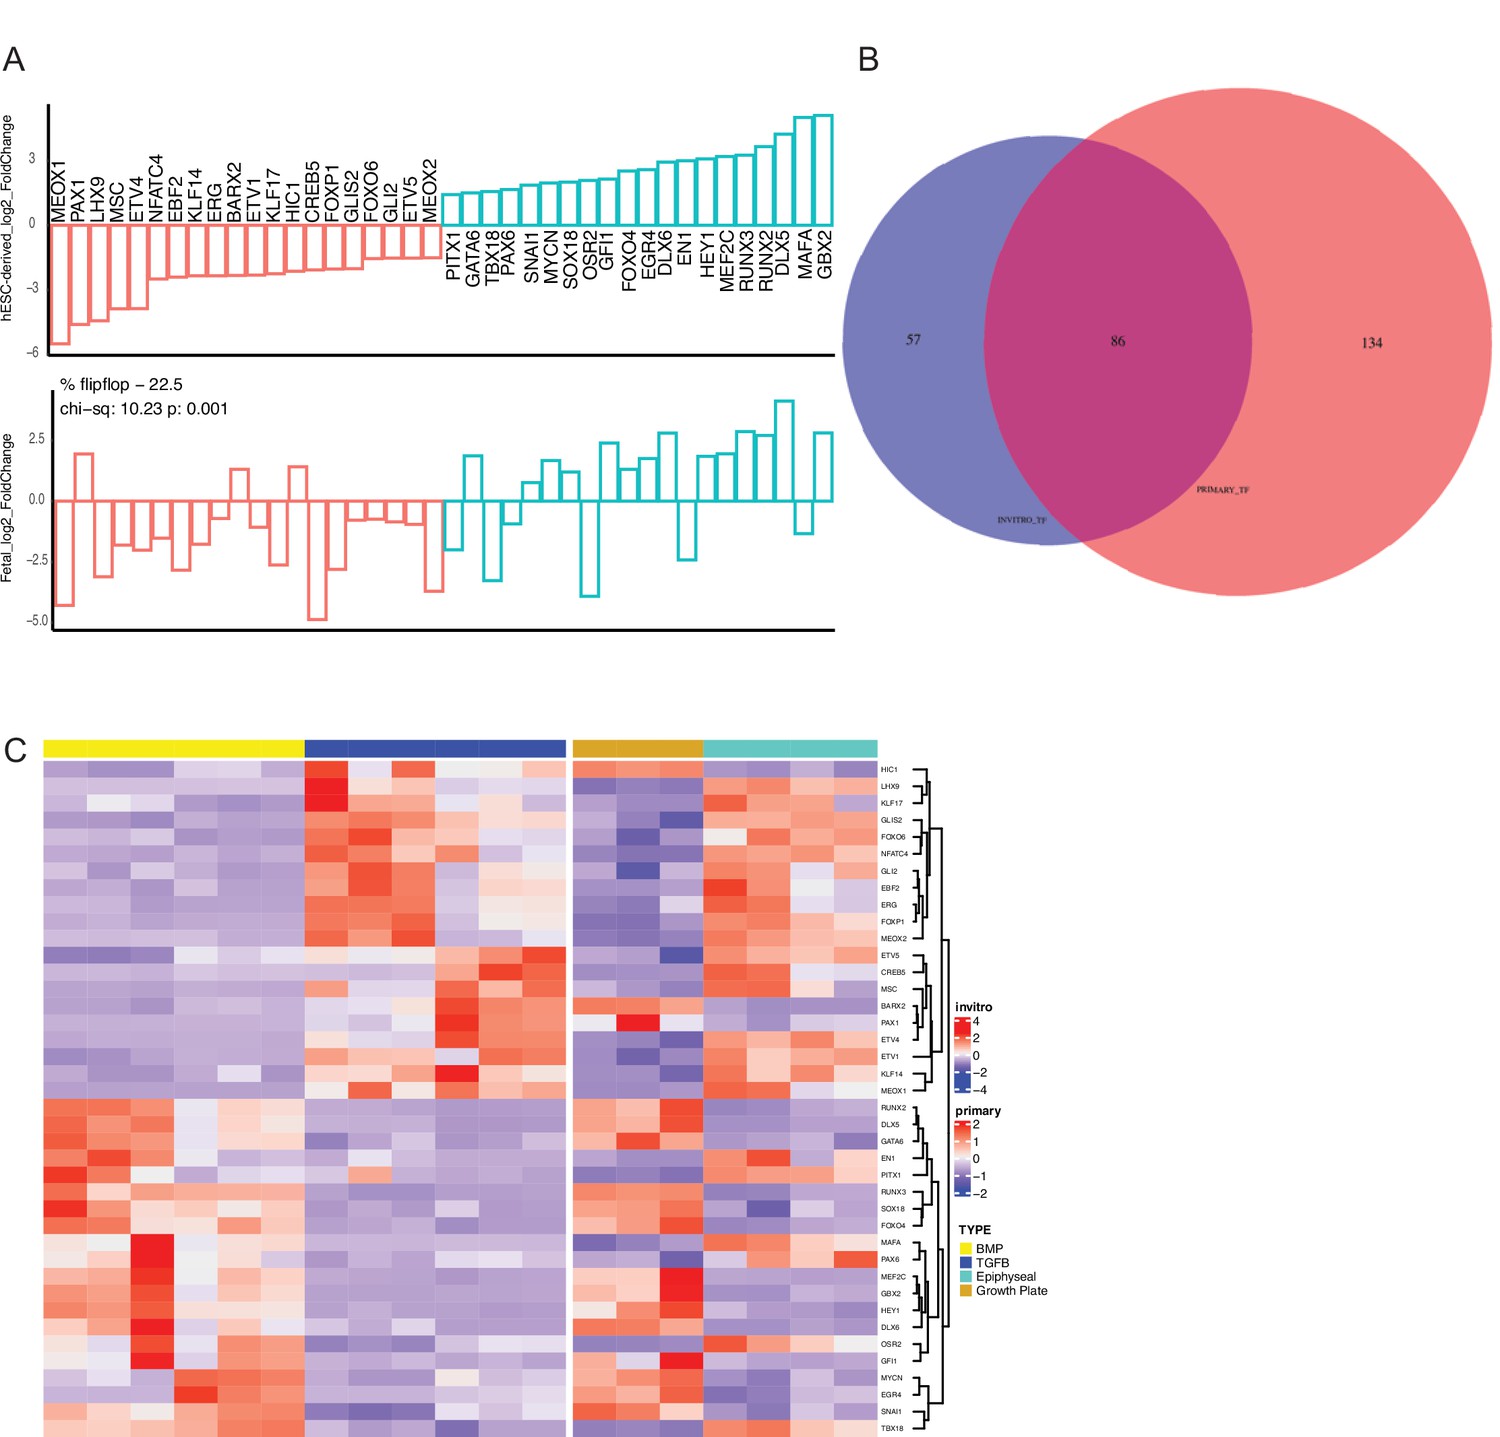
Transcription factor expression and overlap between hESC-derived and human fetal chondrocytes.
(A) Direction sharing of the top 20 differentially-expressed transcription factors (TFs) up- and down-regulated when comparing hESC-derived articular and growth-plate chondrocytes (top), along with the equivalent log(2)FC values from the fetal tissue samples (bottom). (B) Venn diagram of the overlap between TFs defined as differentially expressed in either hESC-derived (purple) or fetal (salmon) chondrocytes. (C) Expression heatmap of the top 20 differentially-expressed TFs up- and down-regulated when comparing hESC-derived articular and growth-plate chondrocytes (left plots), with the equivalent expression of fetal articular and fetal growth plate cartilage (right). Red/blue color scale indicates Z-score expression values across samples in each plot. Columns indicate biological replicates.
Figure 2
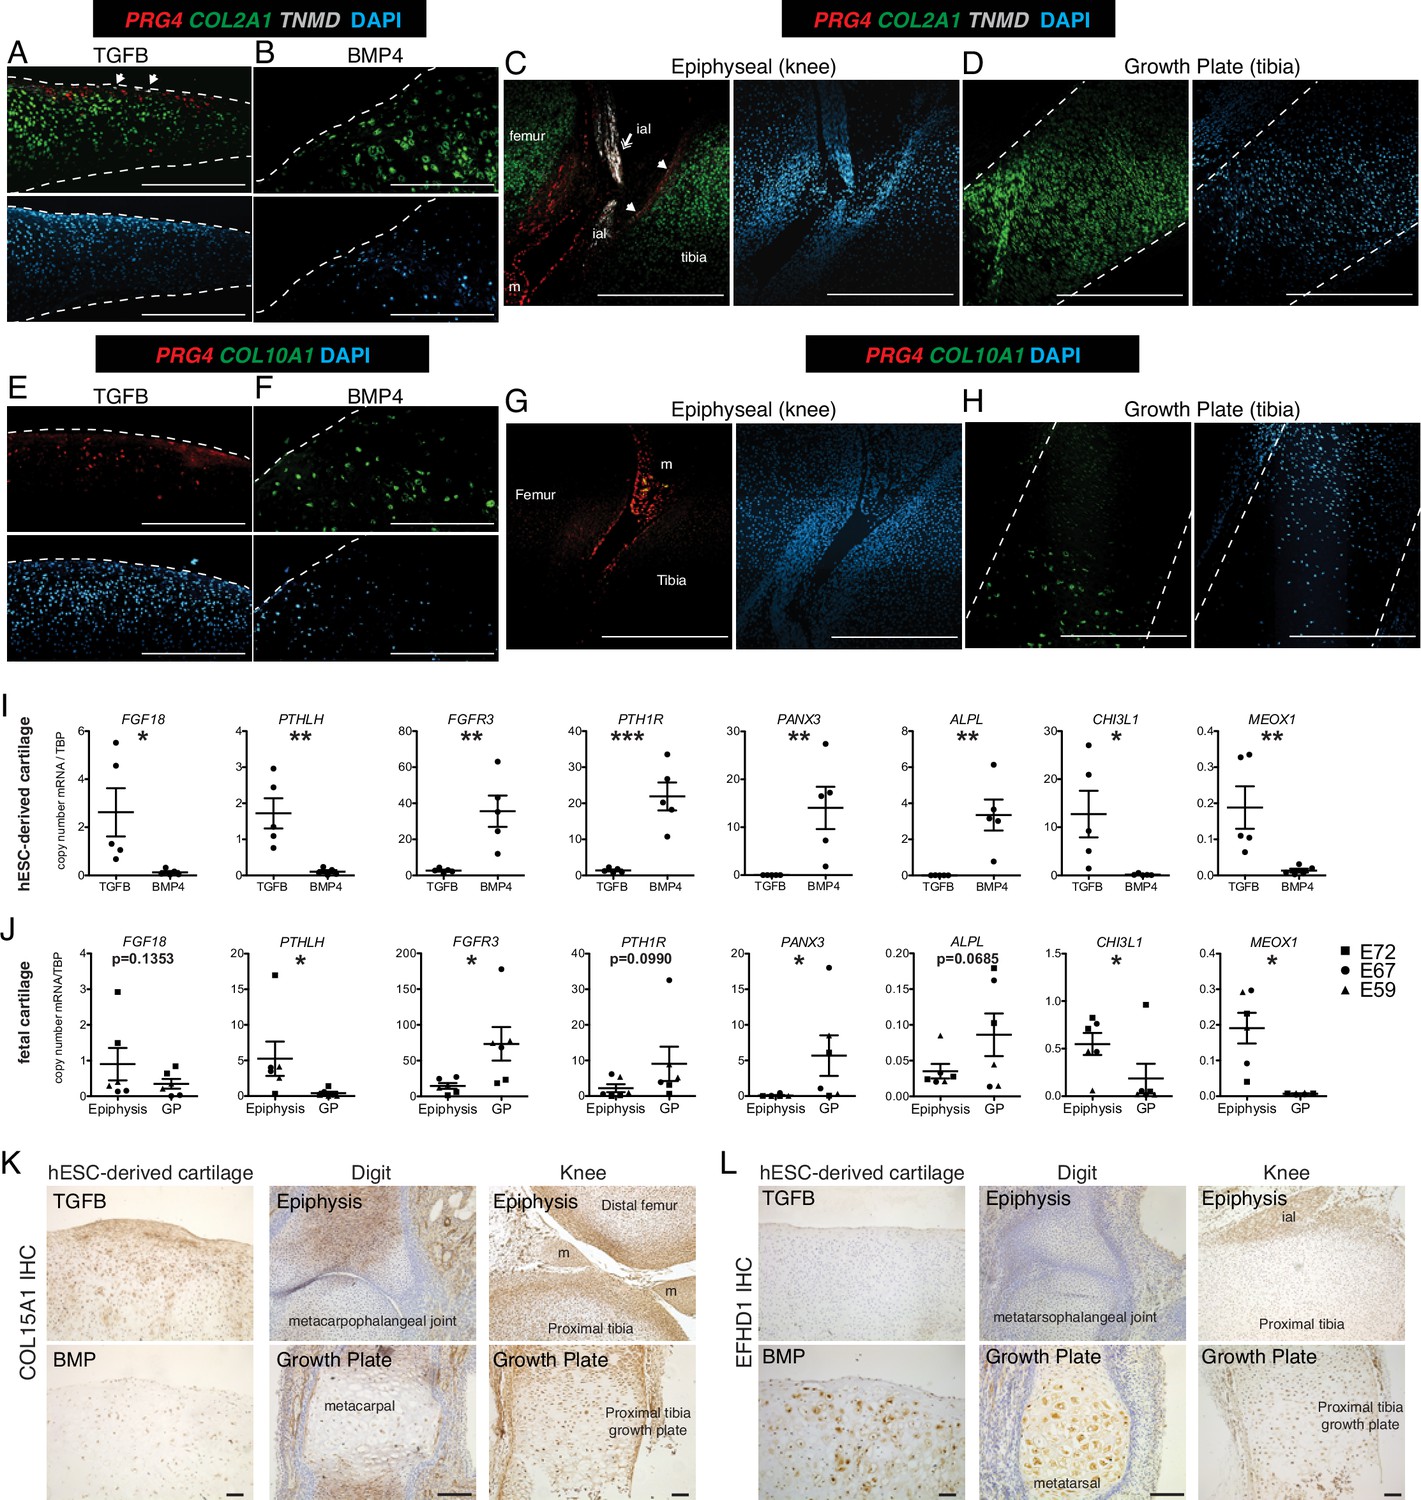
Validation of differential gene and protein expression in hESC-derived articular and growth plate cartilage and fetal epiphyseal and growth plate cartilage.
(A–H) Confocal microscopy of hESC-derived and epiphyseal and growth plate fetal cartilage following in situ hybridization for indicated probes (RNAscope, Wang et al., 2012) and counterstained with DAPI (adjacent images). White arrows indicate TMND staining at the cartilage surface, and white double arrow indicates TNMD staining in an intra-articular ligament. Scale bar, 500 µm. ial, intra-articular ligament; m, meniscus (I–J) Quantitative RT-PCR of differentially expressed genes (DEGs) in hESC-derived cartilage (I, n=5 independent experiments with 3–6 replicates per experiment) and fetal cartilage (J). Chondrocytes were isolated from the epiphysis and growth plate (GP) of the distal femur and proximal tibia at E59 (triangles), E67 (circles), and E72 (squares). *p<0.05, **p<0.01, ***p<0.001, Student’s t-test. Error bars, SEM. (K–L) Immunohistochemistry (IHC, brown staining) was used to validate the expression of indicated proteins within cartilage and joint tissues as indicated. Scale bar, 100 µm. ial, intra-articular ligament; m, meniscus. Sections counterstained with Mayer’s hematoxylin (blue). Fetal IHC images are representative of at least three anatomical locations and two donor specimens; hESC-derived tissue IHC and in situ hybridization (A–H) are representative of tissues from at least three independent experiments.
Figure 3 with 2 supplements
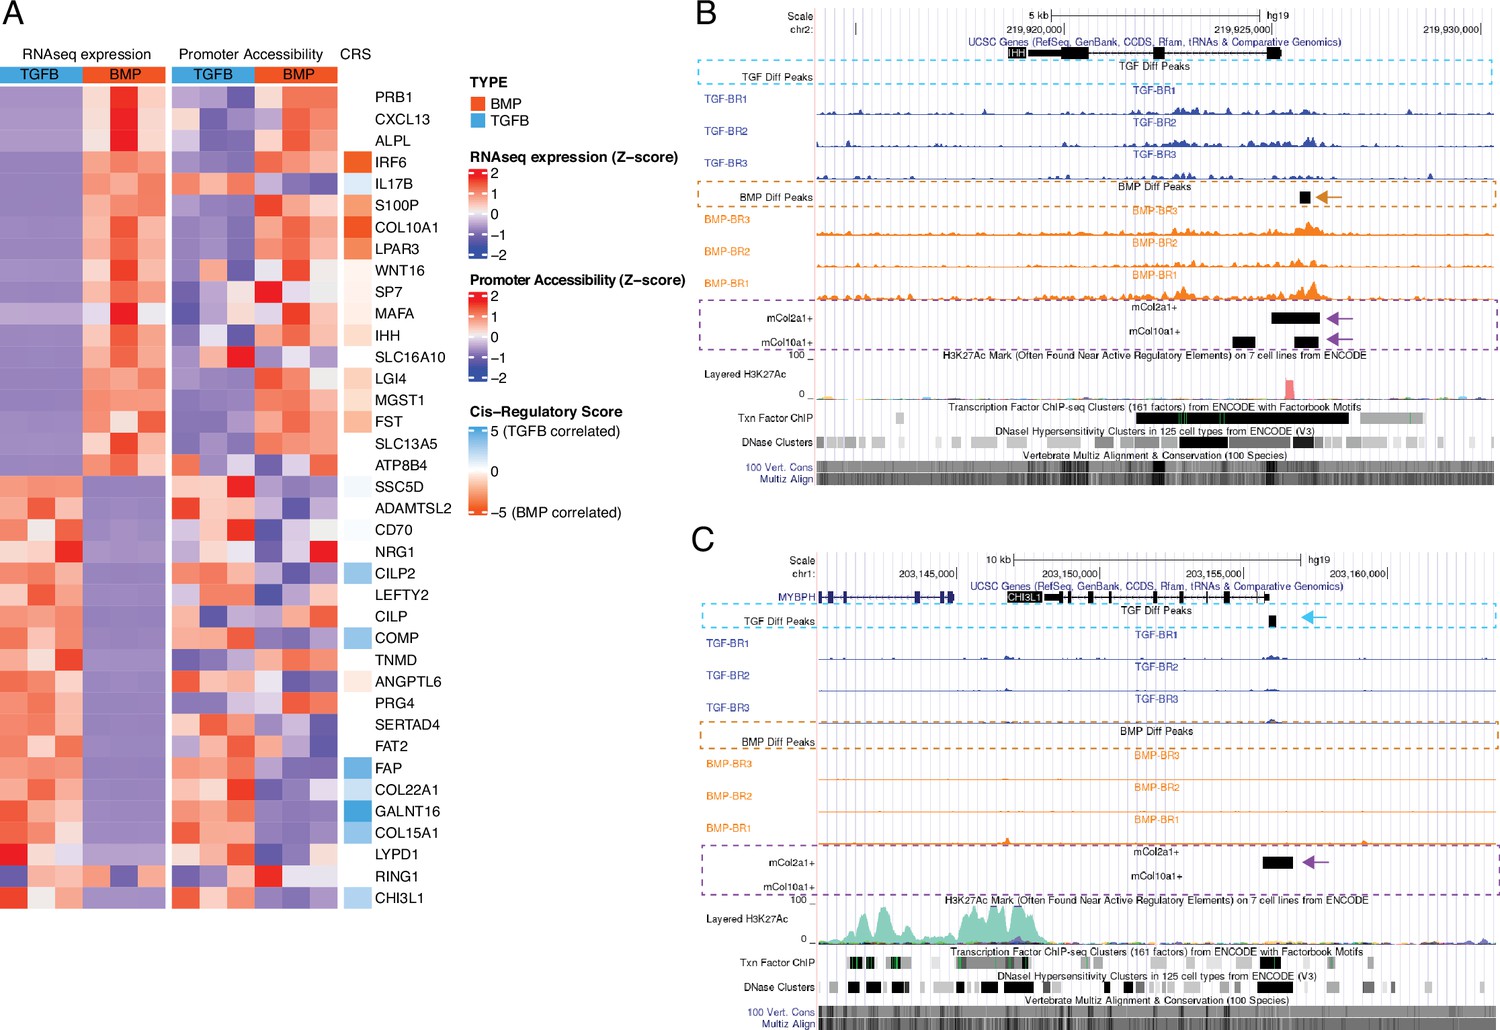
Epigenetic profiling of hESC-derived articular and growth plate chondrocytes.
(A) The expression (left), gene-promoter accessibility (middle), and metric of cis-regulatory activity (cis-regulatory score, CRS, right) values of the top 20 differentially-expressed genes (DEGs) in each lineage. Red/blue color scale indicates Z-score expression/accessibility values across samples in each plot. Blue/orange scale indicates lineage-bias in cis-regulatory metric. (B–C) Representative differentially-expressed gene locus in each lineage show differentially accessible regions (DARs) at the promoter corresponding to the same lineage. IHH (B) is differentially expressed in the growth plate lineage while CHI3L1 (C) is differentially expressed in the articular cartilage lineage. Arrows highlight DAR of interest in respective tracks.
Figure 3—figure supplement 1
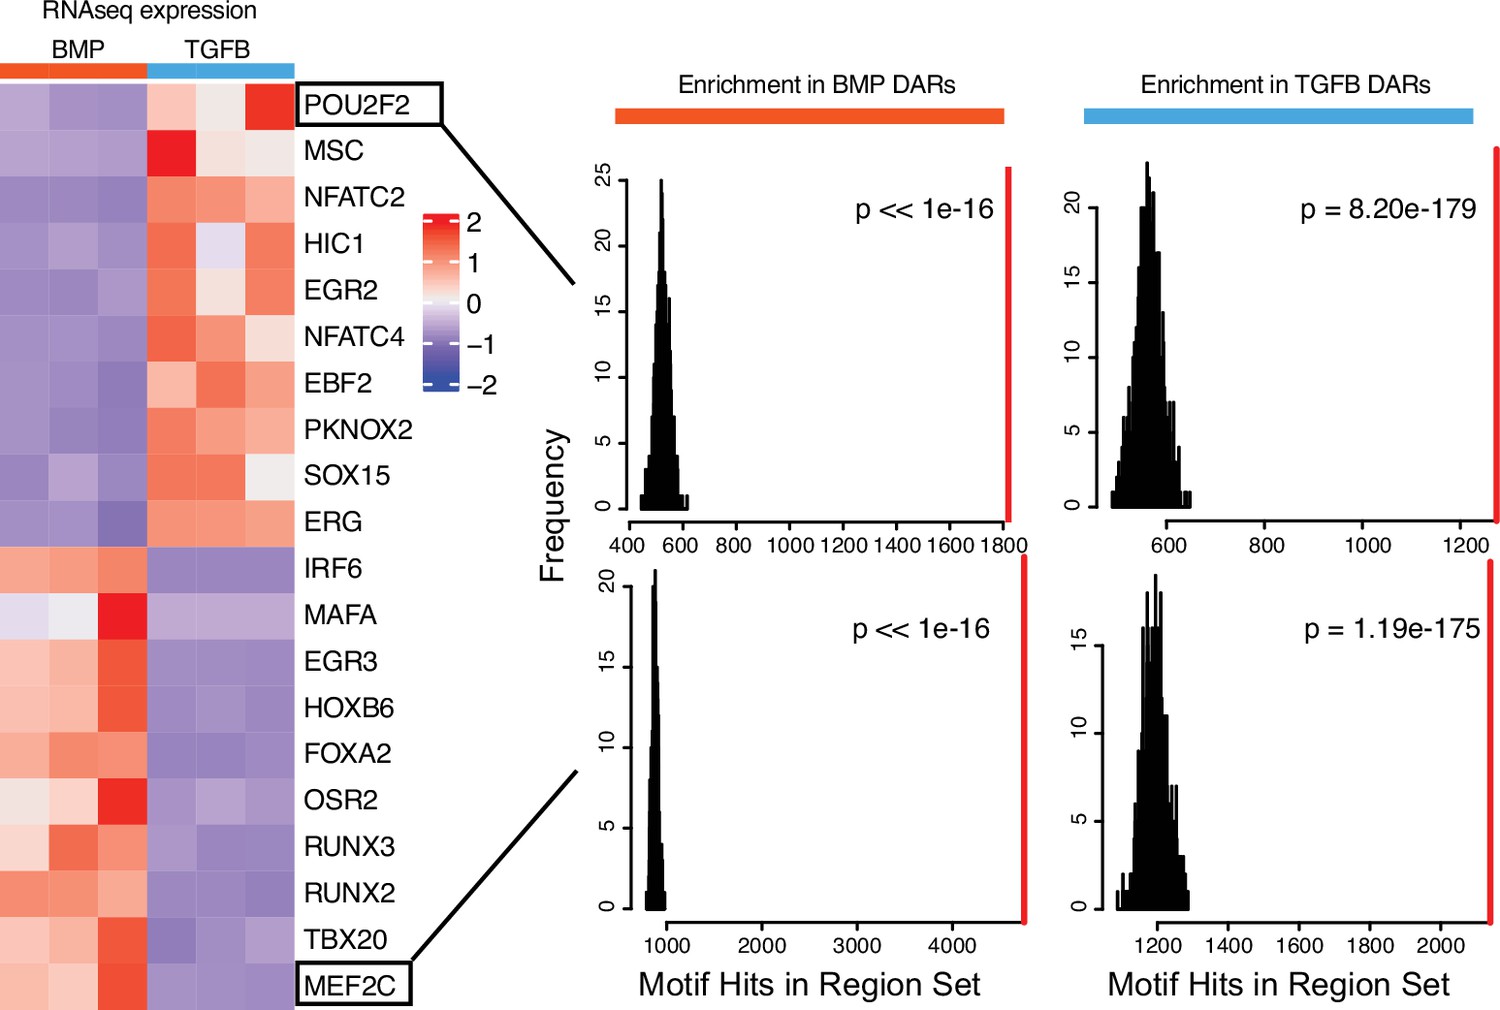
Top differentially expressed transcription factors (TFs) in hESC-derived ACs and GPCs.
(Left) Expression heatmap of the top 10 differentially-expressed TFs in each lineage. (Right) For indicated TF, the number of hits of that motif in putative enhancer sequences is biased towards either lineage (red line), compared to randomly-sampled sequence sets (black lines/histogram).
Figure 3—figure supplement 2
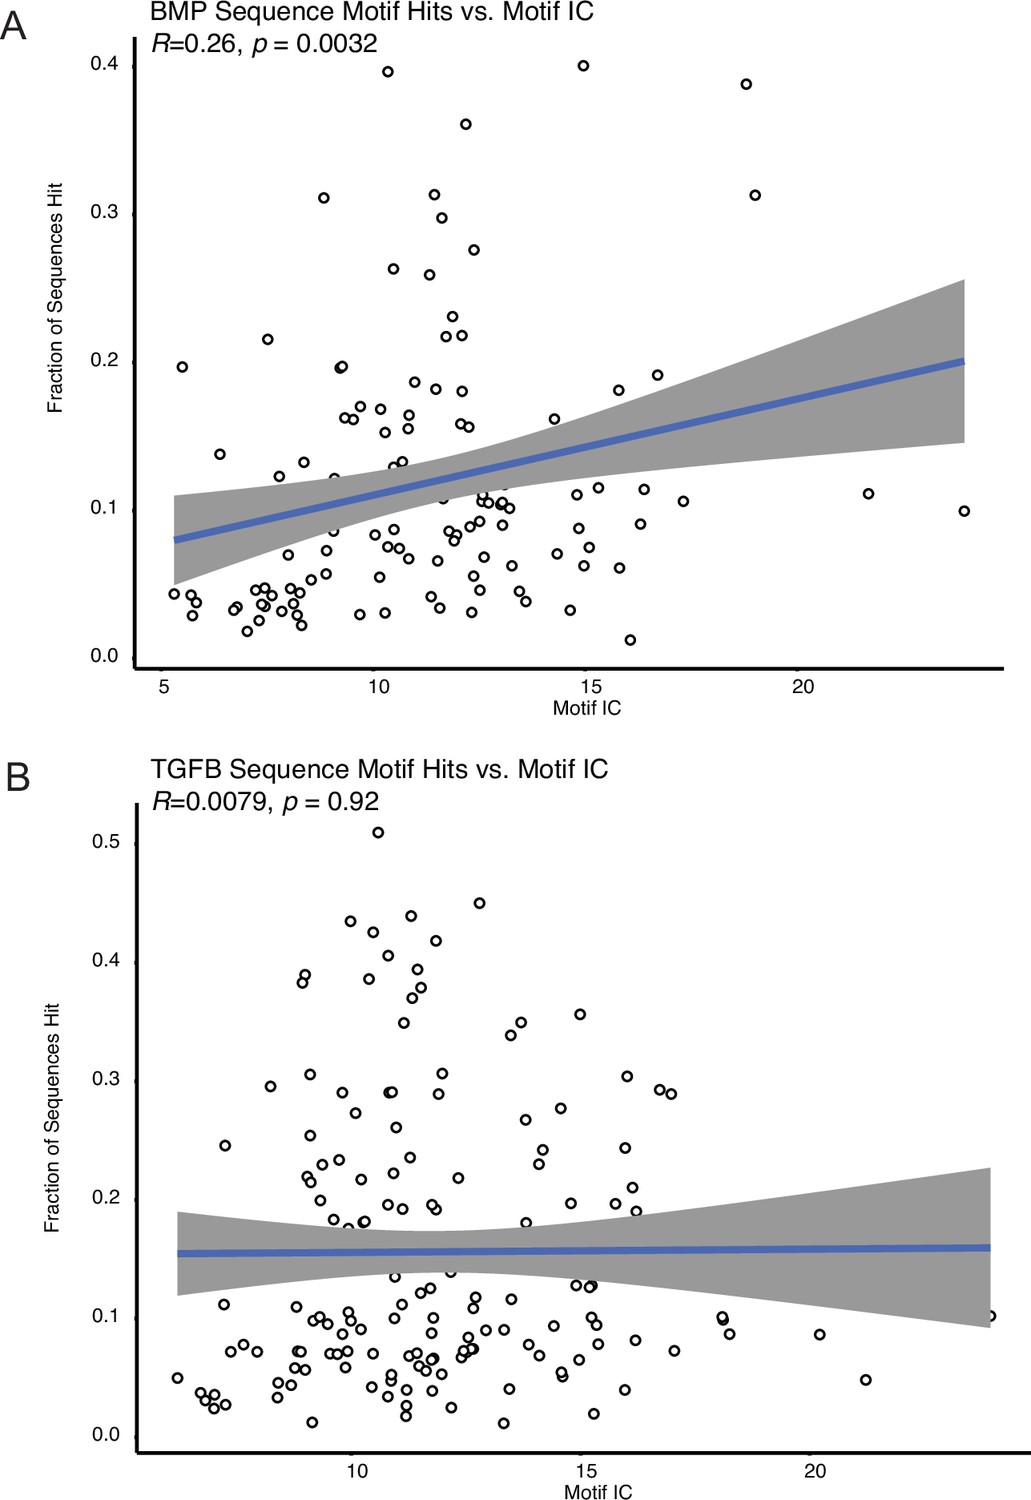
Motif enrichment is not correlated with sequence complexity.
(A) The number of motif hits within the BMP-biased peaks for a particular transcription factor, compared against the information content (IC) of that factor’s binding motif. The Pearson correlation (R) and significance values of the relationship between IC and motif hits are shown in the top left. (B) The number of motif hits within the TGFB-biased peaks for a particular transcription factor, compared against the IC of that factor’s binding motif.
Figure 4
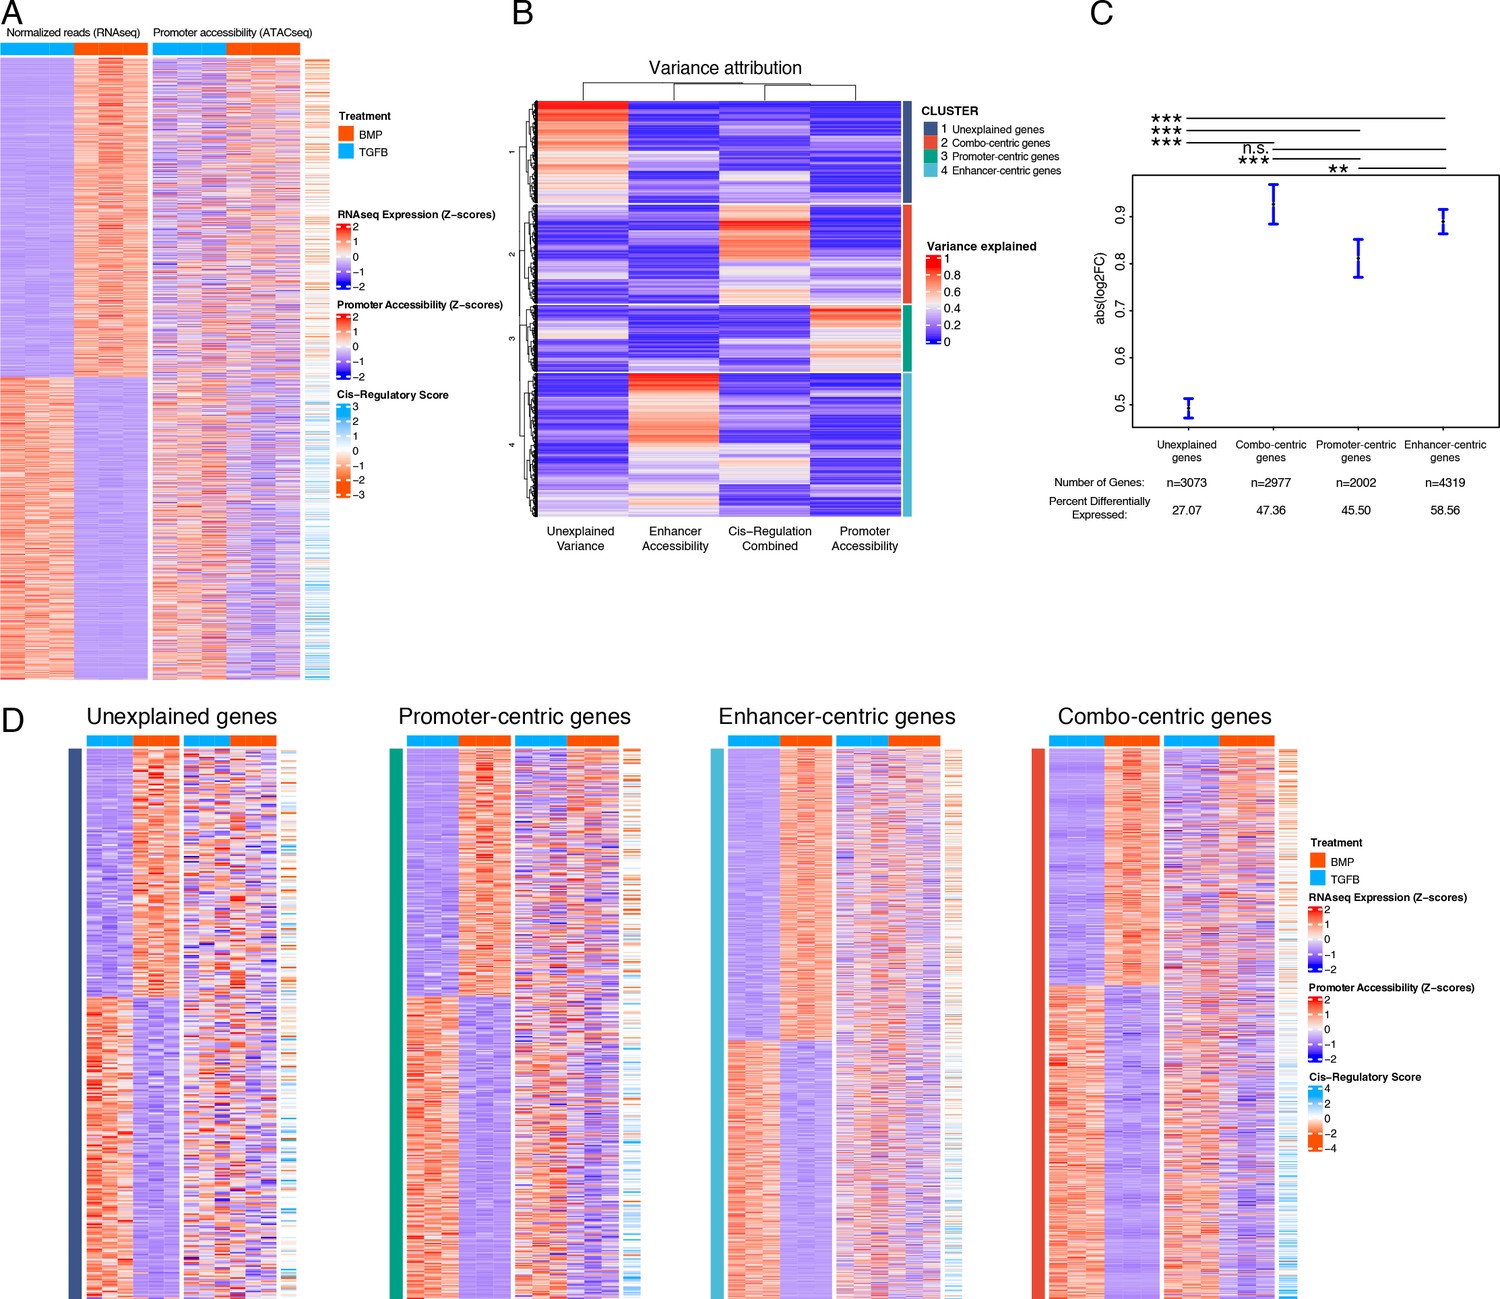
Variance in the expression of differentially-expressed genes (DEGs) can be attributed to different classes of regulatory elements (gene regulatory behavior).
(A) Expression (left), gene-promoter accessibility (middle), and cis-regulatory metric (right) of all genes with expression logFC >1 across lineages. Red/blue, blue-orange color scale indicates Z-score of indicated metric across samples in each indicated plot. (B) For each gene in (A), the proportion of variance in expression which can be explained by regressing on individual accessibility metrics is shown in red/blue color scale (red = more variance). Hierarchical clustering dendrogram and cluster identity are shown on the left and right (respectively), indicating the four clusters of regulatory behavior identified. (C) LogFC values of genes clustered by regulatory behavior. Significance bars indicate Tukey post-hoc corrected p-values. Proportion of significant differentially expressed (DE) genes in each cluster is indicated (see Supplementary file 4b-e). n.s., not significant; *p<0.05; **p<0.01; ***p<0.001. (D) Similar plots to (A), for genes clustered by regulatory behavior. Within each heatmap genes are hierarchically clustered by expression logFC. Color scales as in (A).
Figure 5
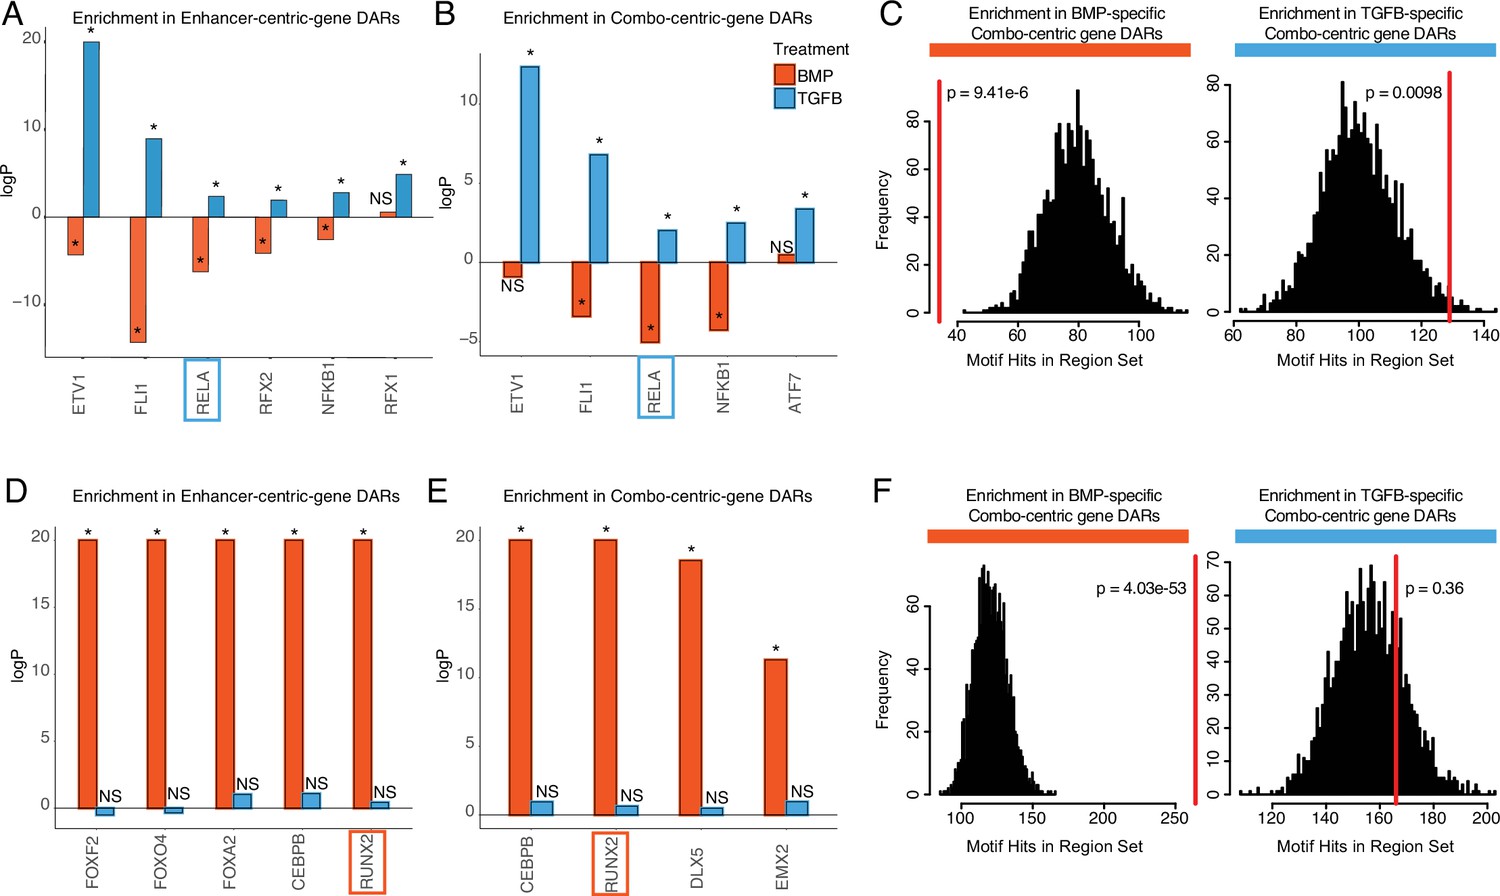
Identifying putative lineage-delineating transcription factors (TFs).
Enrichment test results comparing the occurrence of the indicated motif in TGFB or BMP-biased differentially accessible regions (DARs) relative to randomized backgrounds. (A) TFs differentially expressed (DE) in TGFB-treated articular chondrocytes, testing motif occurrence in TGFB or BMP-biased DARs around enhancer-centric DEGs. *p<0.05; NS, not significant. (B) TFs DE in TGFB-treated articular chondrocytes, testing motif occurrence in TGFB or BMP-biased DARs around combo-centric differentially-expressed genes (DEGs). *p<0.05; NS, not significant. (C) Enrichment histogram of RELA motif occurrence in BMP (left) and TGFB (right)-biased DARs around combo-centric genes DE in their respective lineages. Red line indicates the target set value, black bars indicate occurrences in randomized sets. (D) TFs DE in BMP-treated growth plate chondrocytes, testing motif occurrence in TGFB or BMP-biased DARs around enhancer-centric DEGs. *p<0.05; NS, not significant. (E) TFs DE in BMP-treated growth plate chondrocytes, testing motif occurrence in TGFB or BMP-biased DARs around combo-centric DEGs. *p<0.05; NS, not significant. (F) Enrichment histogram of RUNX2 motif occurrence in BMP (left) and TGFB (right)-biased DARs around combo-centric genes DE in their respective lineages. Red line indicates the target set value, black bars indicate occurrences in randomized sets.
Figure 6 with 1 supplement
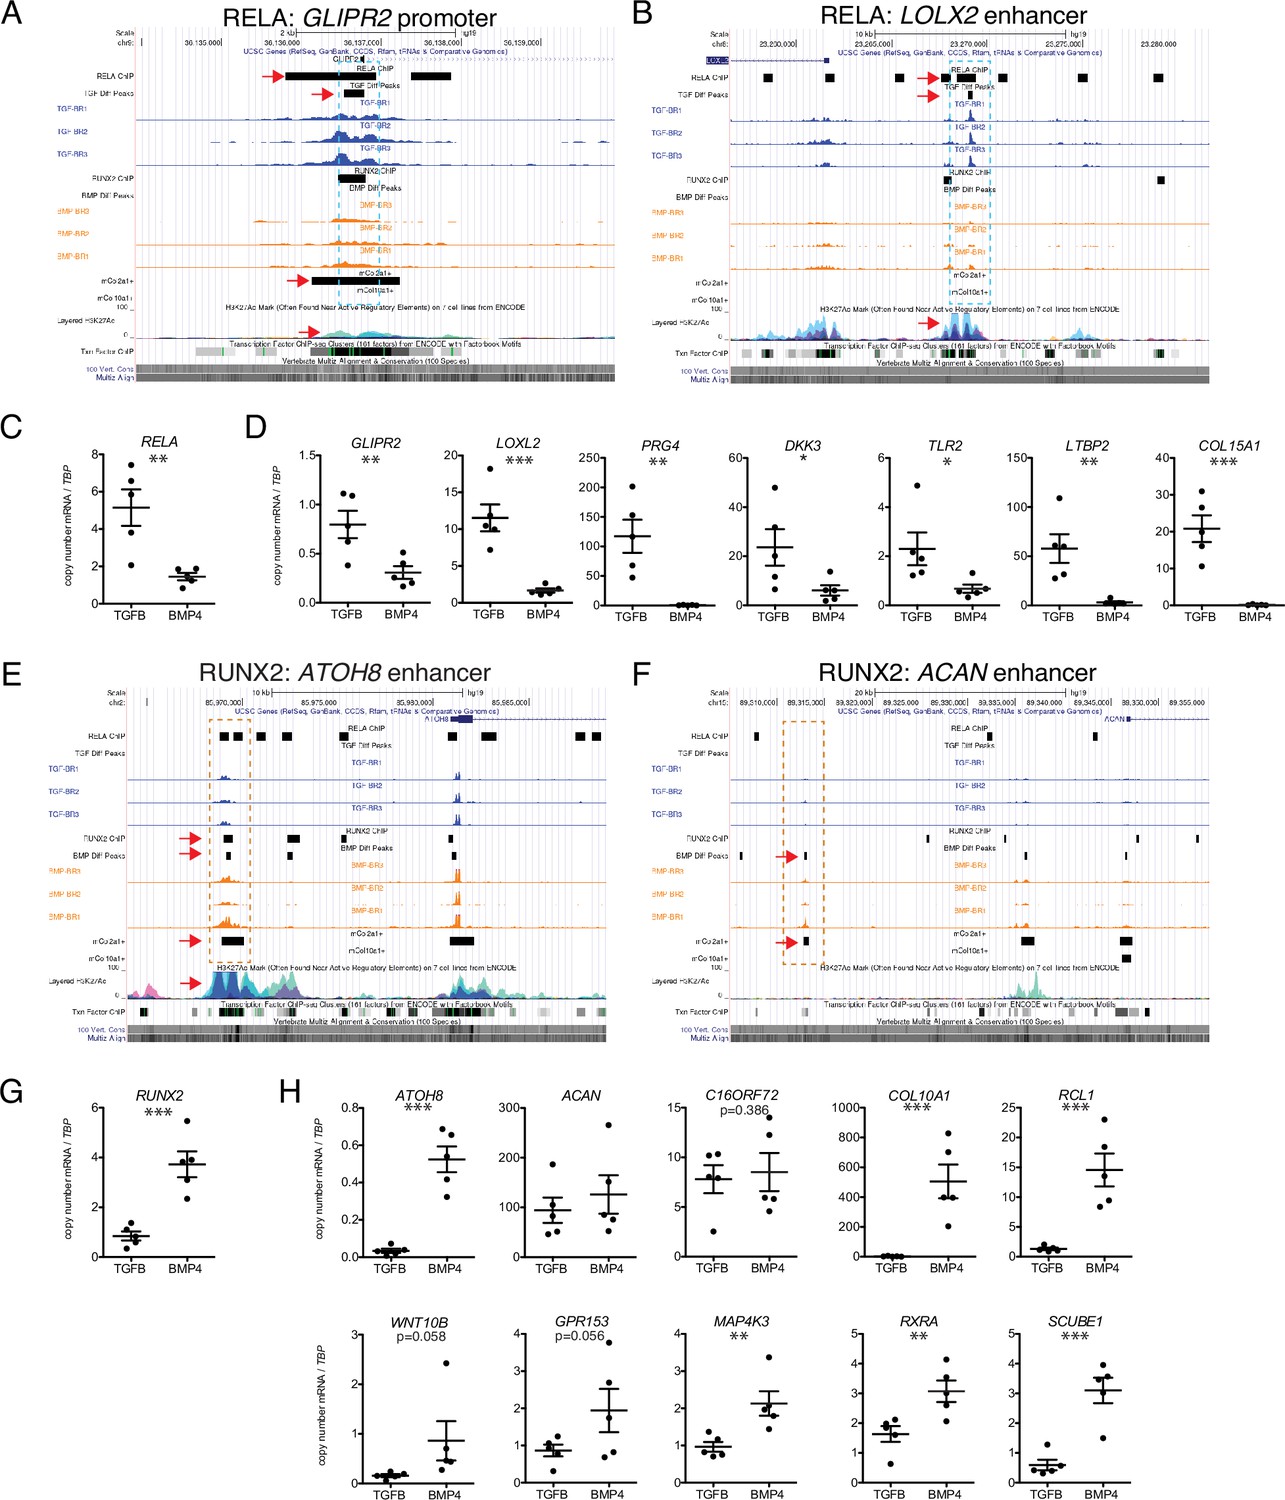
Putative targets of transcription factor (TF) regulation in hESC-derived articular and growth plate chondrocytes.
(A–B) Two representative differentially accessible regions (DARs) (blue dashed boxes) in hESC-derived articular chondrocytes (TGFB-treated) which contain RELA binding motifs: near the promoter of GLIPR2 (A) and an intronic enhancer of LOXL2 (B). Region of interest indicated with the red arrow in relevant tracks. (C) RELA is differentially expressed in TGFB-treated articular chondrocytes, quantified by qRT-PCR. **p<0.01. (D) Expression of selected genes with putative RELA binding motifs was quantified by qRT-PCR. *p<0.05, **p<0.01, ***p<0.001, Student’s t-test. Values indicate the mean of two to three biological replicates per five independent experiments. Error bars, SEM. (E–F) Two representative DARs (orange dashed boxes) in hESC-derived growth plate chondrocytes (BMP-treated) which contain RUNX2 binding motifs: near the promoter of ATOH8 (E) and an enhancer of ACAN (F). Region of interest indicated with the red arrow in relevant tracks. (G) RUNX2 is differentially expressed in BMP-treatment, quantified by qRT-PCR. ***p<0.001. (H) Expression of selected genes with putative RUNX2 binding motifs was quantified by qRT-PCR. *p<0.05, **p<0.01, ***p<0.001, Student’s t-test. Values indicate the mean of two to three biological replicates per five independent experiments. Error bars, SEM.
Figure 6—figure supplement 1
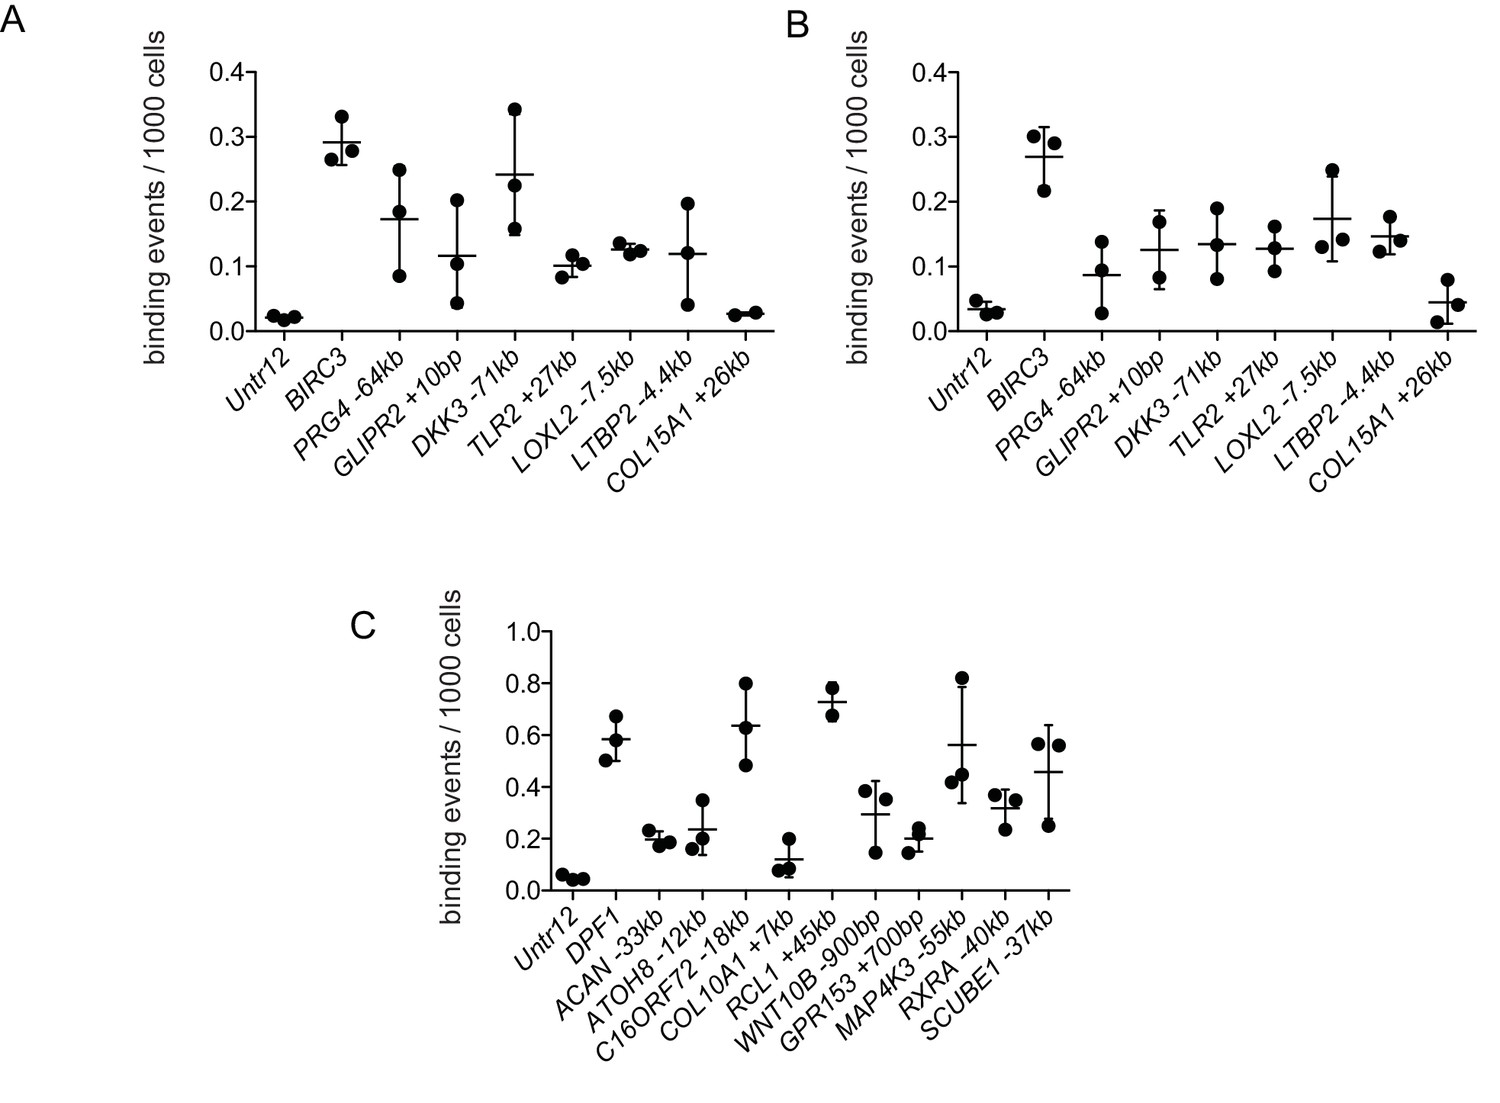
Validation of transcription factor (TF) interaction with putative regulatory elements by Chromatin Immunoprecipitation – quantitative PCR (ChIP-qPCR).
(A–B) ChIP-qPCR of RELA results for differentially accessible peaks near target genes show enrichment of these sequences compared to a negative (gene desert) control (Untr12). BIRC3 is a positive RELA control. A and B represent two independent pools of TGFB-treated articular chondrocytes. (C) ChIP-qPCR of RUNX2 results for differentially accessible peaks near target genes show enrichment of these sequences compared to a negative (gene desert) control (Untr12). DPF1 is a positive RUNX2 control. Error bars, SD. Primers are provided in Supplementary file 6.
Tables
Table 1
Summary of ATAC-seq peaks from mouse and human chondrocytes.
| Mouse embryonic chondrocytes | |||||
|---|---|---|---|---|---|
| All | Col2+ | Col10+ | |||
| 30,950 | 28,972 | 12,906 | |||
| hESC-derived chondrocytes | All Peaks (T+B) | 37,780 | 13,687 | ||
| TGFB (All peaks) | 31,137 | 13,381 | 9223 | ||
| BMP (All peaks) | 29,821 | 12,471 | 9070 | ||
| TGFB (Unique) | 11,571 | 3971 | 2385 | ||
| BMP (Unique) | 12,154 | 2584 | 1754 | ||
Table 2
Summary of candidate RELA targets.
| Putative Target | Chromosome location (hg19) | Distance from TSS of gene | Overlap with Mouse Col2a1+peaks | Overlap with mouse Col10a1+peaks | Validated ChIP-seq hits from other studies | Fold enrichment in ChIP-qPCR |
|---|---|---|---|---|---|---|
| PRG4 | chr1:186201240–186201490 | - 64.4 kb | Y | 1 | 8.26 | |
| LOXL2 | chr8:23268990–23269240 | - 7520 bp | 44 | 6.03 | ||
| LTBP2 | chr14:75083374–75083624 | - 4380 bp | 33 | 5.71 | ||
| GLIPR2 | chr9:36135932–36137932 | +10 bp | Y | 17 | 5.57 | |
| DKK3 | chr11:12101707–12101957 | - 71.1 kb | 134 | 11.56 | ||
| TLR2 | chr4:154577179–154577429 | +27.2 kb | Y | 36 | 4.85 | |
| COL15A1 | chr9:101733568–101733818 | +26.6 kb | Y | 1 | 1.28 |
Table 3
Summary of candidate RUNX2 targets.
| Putative Target | Chromosome location (hg19) | Distance from TSS of gene | Overlap with mouse Col2 +peaks | Overlap with mouse Col10 +peaks | Validated ChIP-seq hits from other studies | Fold enrichment in ChIP-qPCR |
|---|---|---|---|---|---|---|
| ACAN | chr15:89312870–89313120 | –33.0 kb | Y | 3.98 | ||
| ATOH8 | chr2:85969150–85969400 | –11.9 kb | Y | 2 | 4.79 | |
| C16orf72 | chr16:9166745–9166995 | –18.5 kb | 4 | 12.88 | ||
| COL10A1 | chr6:116439814–116440064 | +7110 bp | Y | Y | 4 | 2.44 |
| RCL1 | chr9:4837930–4838180 | +44.8 kb | 3 | 14.73 | ||
| WNT10B | chr12:49366141–49368141 | - 899 bp | 4 | 5.96 | ||
| GPR153 | chr1:6319685–6321685 | +699 bp | Y | Y | 3 | 4.06 |
| MAP4K3 | chr2:39719320–39719570 | –54.6 kb | Y | Y | 1 | 11.36 |
| RXRA | chr9:137178491–137178741 | –39.3 kb | 4 | 6.42 | ||
| SCUBE1 | chr22:43701886–43702136 | –36.8 kb | Y | Y | 1 | 9.27 |
Key resources table
| Reagent type (species) or resource | Designation | Source or reference | Identifiers | Additional information |
|---|---|---|---|---|
| Cell line (human) | H9 hESCs (XX) | Wicell | WAe009-A | |
| Biological sample (human) | Musculoskeletal/joint fetal donor samples; from first trimester termination | Birth Defects Research Laboratory, University of Washington | ||
| Biological sample (human) | Phalangeal joint fetal donor samples; first trimester termination (E70) | Advanced Bioscience Resources Inc. | ||
| Antibody | Rabbit polyclonal anti-EFHD1 | Sigma Aldrich | Cat# HPA056959 | 1:100 |
| Antibody | Rabbit polyclonal anti-COL15A1 | Sigma Aldrich | Cat# HPA017915 | 1:100 |
| peptide, recombinant protein | Basic Fibroblast Growth Factor (bFGF) | R&D Systems | Cat#233-FB | |
| Peptide, recombinant protein | Bone Morphogenetic Protein 4 (BMP4) | R&D Systems | Cat#314 BP | |
| Peptide, recombinant protein | Activin A | R&D Systems | Cat#338-AC | |
| Peptide, recombinant protein | Transforming Growth Factor Beta 3 (TGFB3) | R&D Systems | Cat#243-B3 | |
| Chemical compound, drug | Fetal Bovine Serum (FBS) | Corning | Cat#35–010-CV | |
| Chemical compound, drug | Dulbecco’s Modified Eagle Medium, high glucose | Gibco | Cat#11995065 | |
| Chemical compound, drug | DMEM/F12 | Corning | Cat#10–092-CV | |
| Chemical compound, drug | StemPro-34 serum-free medium and nutrient supplement | Gibco | Cat#10639011 | |
| Chemical compound, drug | Knockout Serum Replacement (KOSR) | Gibco | Cat#10828028 | |
| Chemical compound, drug | L-Ascorbic Acid | Sigma-Aldrich | Cat#A4544 | |
| Chemical compound, drug | L-glutamine | Sigma-Aldrich | Cat#25030081 | |
| Chemical compound, drug | Non-essential amino acids (NEAA) | Gibco | Cat#11140050 | |
| Chemical compound, drug | Penicillin/Streptomycin (Pen/Strep) | Gibco | Cat#15140122 | |
| Chemical compound, drug | b-mercaptoethanol, 55 mM solution (BME) | Gibco | Cat#21985023 | |
| Chemical compound, drug | Transferrin from human serum | Roche | Cat#10652202001 | |
| Chemical compound, drug | a-monothioglycerol (MTG) | Sigma-Aldrich | Cat#M6145 | |
| Chemical compound, drug | Insulin-Transferrin-Selenium-Sodium Pyruvate (ITS-A) | Gibco | Cat#51300044 | |
| Chemical compound, drug | L-Proline | Gibco | Cat#P5607 | |
| Chemical compound, drug | Dexamethasone | Sigma-Aldrich | Cat#D4902 | |
| Chemical compound, drug | Polyheme (2-hydroxyethyl methacrylate) | Sigma-Alrich | Cat#P3932 | |
| Chemical compound, drug | Gelatin from porcine skin type A | Sigma-Alrich | Cat#G1890 | |
| Chemical compound, drug | Matrigel, growth factor-reduced | Corning | Cat#354230 | |
| Chemical compound, drug | TryplE | Gibco | Cat#12605028 | |
| Chemical compound, drug | Trypsin from porcine pancreas | Sigma-Aldrich | Cat#T4799 | |
| Chemical compound, drug | Ethylenediaminetetraacetic Acid (EDTA), 0.5 M solution, pH 8.0 | Sigma-Aldrich | Cat#A3145 | |
| Chemical compound, drug | DNaseI from bovine pancreas | Sigma-Aldrich | Cat#260913 | |
| Chemical compound, drug | Collagenase type B | Roche | Cat#11088831001 | |
| Chemical compound, drug | ROCK inhibitor Y-27632 dihydrochloride (RI) | Tocris | Cat#1254 | |
| Chemical compound, drug | SB431542 hydrate | Sigma-Aldrich | Cat#S4317 | |
| Chemical compound, drug | Dorsomorphin (DM) | Sigma-Aldrich | Cat#P5499 | |
| Chemical compound, drug | IWP2 | Tocris | Cat#3533 | |
| Chemical compound, drug | Collagenase Type I | Sigma-Aldrich | Cat#C0130 |
Additional files
-
Supplementary file 1
Sequencing information for RNA-seq runs.
(a) Quality summary statistics for RNA-seq samples. (b) DEG data for hESC-derived (in vitro) and fetal (primary) chondrocyte samples. Columns C-H: DESeq2 statistics for hESC-derived samples. Log2FC is calculated as BMP-vs-TGF. Columns I-N: DESeq2 statistics for primary fetal samples. Log2FC is calculated as Growth plate vs. epiphyseal (GP-vs-EP). Columns O-AG: Normalized transcript counts for the indicated gene in the indicated sample. (c) DEG gene-set enrichments. The (up to) top 30 significantly-enriched gene sets obtained using sets of genes up-regulated in the given tissue. (d) Testing shared direction of differential expression between primary and in vitro hESC-derived samples. (e) Differential expression information for differentially expressed in at least one of four cell types. Column ‘A’ denotes the classification of different TFs. (f) Differential expression analysis run only on ‘Batch 2’ samples, for which paired ATAC-seq libraries were generated. (g) Sets of that were DEG in the Batch 2 analysis.
- https://cdn.elifesciences.org/articles/79925/elife-79925-supp1-v2.xlsx
-
Supplementary file 2
Sequencing information for the in vitro chondrogenic time course RNA-seq run.
(a) DEG data for hESC-derived (in vitro) chondrocyte samples after 4 weeks of in vitro differentiation. Columns C-H: DESeq2 statistics. Log2FC is calculated as BMP-vs-TGF. Columns I-N: Normalized transcript counts for the indicated gene in the indicated sample. (b) DEG data for hESC-derived (in vitro) chondrocyte samples after 8 weeks of in vitro differentiation. Columns C-H: DESeq2 statistics. Log2FC is calculated as BMP-vs-TGF. Columns I-N: Normalized transcript counts for the indicated gene in the indicated sample. (c) DEG data for hESC-derived (in vitro) chondrocyte samples after 12 weeks of in vitro differentiation. Columns C-H: DESeq2 statistics. Log2FC is calculated as BMP-vs-TGF. Columns I-N: Normalized transcript counts for the indicated gene in the indicated sample. (d) DEG gene-set enrichments in each lineage and time. The (up to) top 30 significantly-enriched gene sets were obtained using sets of genes up-regulated in the indicated tissue and time (e) Differential expression information for differentially expressed at 4 weeks. (f) Differential expression information for differentially expressed at 8 weeks. (g) Differential expression information for differentially expressed at 12 weeks. (h) Allocation of in the TGF lineage which were differentially expressed in one or more timepoints during in vitro differentiation. (i) Allocation of in the BMP lineage which were differentially expressed in one or more timepoint during in vitro differentiation.
- https://cdn.elifesciences.org/articles/79925/elife-79925-supp2-v2.xlsx
-
Supplementary file 3
Sequencing information for ATAC-seq runs.
(a) Quality summary statistics for ATAC-seq samples. (b) Sets of differentially-accessible peaks, separated by their lineage bias. hg19 coordinates shown. (c) GREAT results for differentially-accessible peak sets. Description of column names and tests are available from the GREAT website. (d) HOMER de-novo motif analysis results for DA peaks in growth plate chondrocytes. (e) HOMER de-novo motif analysis results for DA peaks in articular chondrocytes. (f) Results of motif testing of all differentially-expressed transcription factors with the indicated DA peaksets.
- https://cdn.elifesciences.org/articles/79925/elife-79925-supp3-v2.xlsx
-
Supplementary file 4
Gene regulatory behaviors.
(a) Summarized statistics comparing genes grouped by regulatory behavior. (b) Significant genes assigned to cluster 1 - ‘Poorly explained.’ DESeq2 DEG statistics for all genes are shown, along with the amount of variance in gene expression which was ascribed to either enhancer cis-regulatory scores, promoter accessibility, the interaction term, and variance which could not be explained, ‘Unexplained.’ (c) Significant genes assigned to cluster 2 - ‘Combo-centric.’ (d) Significant genes assigned to cluster 3 - ‘Promoter-centric.’ (e) Significant genes assigned to cluster 4 - ‘Enhancer-centric.’ (f) The set of differentially-expressed transcription factors for which motif enrichments were tested in regulatory sequences associated with genes falling in different regulatory groups. Columns I-K indicates whether a significant enrichment was observed for promoter-centric, enhancer-centric, or combo-centric genes. Column L indicates the direction of the differential expression of a given TF. (g) Results of motif enrichment testing for promoters of promoter-centric genes. Columns E-G refers to the enrichment statistics for BMP-biased DEGs. Columns I-K refers to enrichment statistics for TGF-biased DEGs. Sets of TFs are grouped based on their lineage-specificity behaviors. (h) Results of motif enrichment testing for putative enhancers of enhancer-centric genes. Columns E-I refers to the enrichment statistics for BMP-biased DEGs. Columns J-O refers to enrichment statistics for TGF-biased DEGs. ‘GENOME_TAG’ refers to enrichment results when using the entire genome as a background set. Sets of TFs are grouped based on their lineage-specificity behaviors. (i) Results of motif enrichment testing for putative enhancers of combo-centric genes. Columns E-I refers to the enrichment statistics for BMP-biased DEGs. Columns J-O refers to enrichment statistics for TGF-biased DEGs. ‘GENOME_TAG’ refers to enrichment results when using the entire genome as a background set. Sets of TFs are grouped based on their lineage-specificity behaviors.
- https://cdn.elifesciences.org/articles/79925/elife-79925-supp4-v2.xlsx
-
Supplementary file 5
Overlapping ChIP-seq datasets with DA peaksets.
(a) Overlapping ChIP-seq datasets with DA peaksets. Accessions listed in this sheet for RELA and RUNX2 correspond to those accessions listed in Supplementary file 5b- e. (b) Overlaps of RELA ChIP-seq datasets with BMP-biased peak sets. Column A: Whether or not the indicated region (Columns B-D) contained a FIMO-predicted motif hit for RELA. ‘Num_hits’: the number of ChIP-seq peaks (pooled across individual datasets) which overlapped the given region. ‘Hits':’ the individual overlapping ChIP-seq peaks, separated by ‘@’. ‘sources’ and ‘ID’ refers to the individual datasets corresponding to each ChIP-seq peak separated by ‘@’ in ‘Hits’ column. (c) Overlaps of RELA ChIP-seq datasets with TGF-biased peak sets. (d) Overlaps of RUNX2 ChIP-seq datasets with BMP-biased peak sets. (e) Overlaps of RUNX2 ChIP-seq datasets with TGF-biased peak sets.
- https://cdn.elifesciences.org/articles/79925/elife-79925-supp5-v2.xlsx
-
Supplementary file 6
Oligonucleotides used in this report.
- https://cdn.elifesciences.org/articles/79925/elife-79925-supp6-v2.docx
-
MDAR checklist
- https://cdn.elifesciences.org/articles/79925/elife-79925-mdarchecklist1-v2.docx
Download links
A two-part list of links to download the article, or parts of the article, in various formats.
Downloads (link to download the article as PDF)
Open citations (links to open the citations from this article in various online reference manager services)
Cite this article (links to download the citations from this article in formats compatible with various reference manager tools)
Lineage-specific differences and regulatory networks governing human chondrocyte development
eLife 12:e79925.
https://doi.org/10.7554/eLife.79925


