Representational integration and differentiation in the human hippocampus following goal-directed navigation
- Graduate Program in Neurosciences, Stanford University, United States
- Wu Tsai Neurosciences Institute, Stanford University, United States
- Department of Psychological and Brain Sciences, University of Iowa, United States
- Department of Psychology, Stanford University, United States
Figures
Figure 1
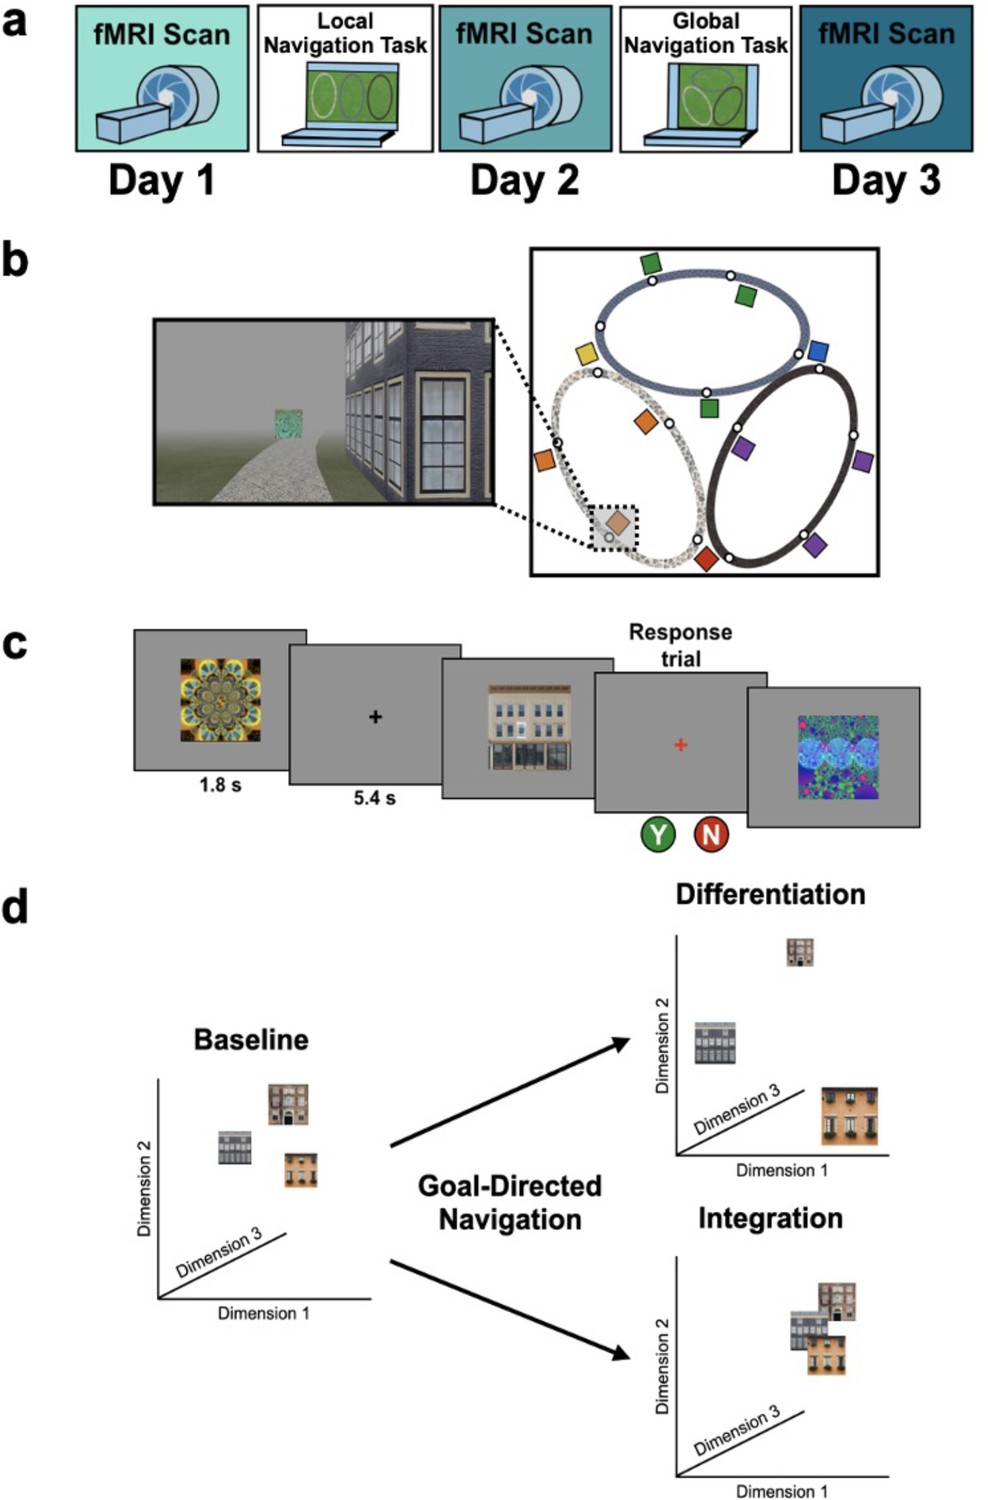
Study design.
(A) Overview of the 3-day experimental paradigm. (B) First-person view from an example training trial (left); virtual fog limited the distance viewed, ensuring that no two landmark buildings could be seen at any one time. Overhead view of the virtual environment (right). The environment consisted of three oval tracks. Colored boxes indicate the approximate locations of landmarks, circles approximate goal locations for an individual study participant. (C) fMRI paradigm. Participants viewed images of the 12 landmarks and 15 fractals that were used in their unique virtual environment, while performing a perceptual decision-making task. On each trial, the stimulus appeared on a gray background for 1.8 s, followed by a fixation cross for 5.4 s; participants were instructed to attend to the stimuli and to determine whether a feature of the stimulus was ‘bleached out’; on ‘catch’ trials (8% of trials), a red fixation cross appeared after image offset and participants indicated a response. (D) Schematic illustration of potential representational changes driven by learning. Following goal-directed navigation, the distance between landmarks in neural state-space could have increased (differentiation) or decreased (integration).
Figure 2

Navigation performance on the Local and Global Navigation Tasks.
(A) Local Navigation accuracy on test trials was near ceiling across runs on Day 1 and Day 2 (top). Participants’ navigational efficiency improved over learning trials, and they navigated efficiently across test trials (bottom). (B) During the Global Navigation Task, participants navigated more accurately (top) and efficiently (bottom) on within- vs. across-track trials. Participants were more accurate for within-track trials during learning and during early test runs, but improved on across-track trials over the course of test runs on Day 2 (top). Accuracy improved for both trial types on Day 3, such that performance did not significantly differ between within-track and across-track trials. Participants were significantly more efficient on both trial types on Day 3 relative to Day 2. (*** p < 0.001, paired t-test. Error bars denote SEM. Local Navigation Task, n = 23; Global Navigation Task, n = 21. Learning trials = trials on which the fractal marking the goal location was visible on the track; Test trials = trials on which participants had to rely on memory for the goal location, as the fractals were removed from the track).
Figure 3
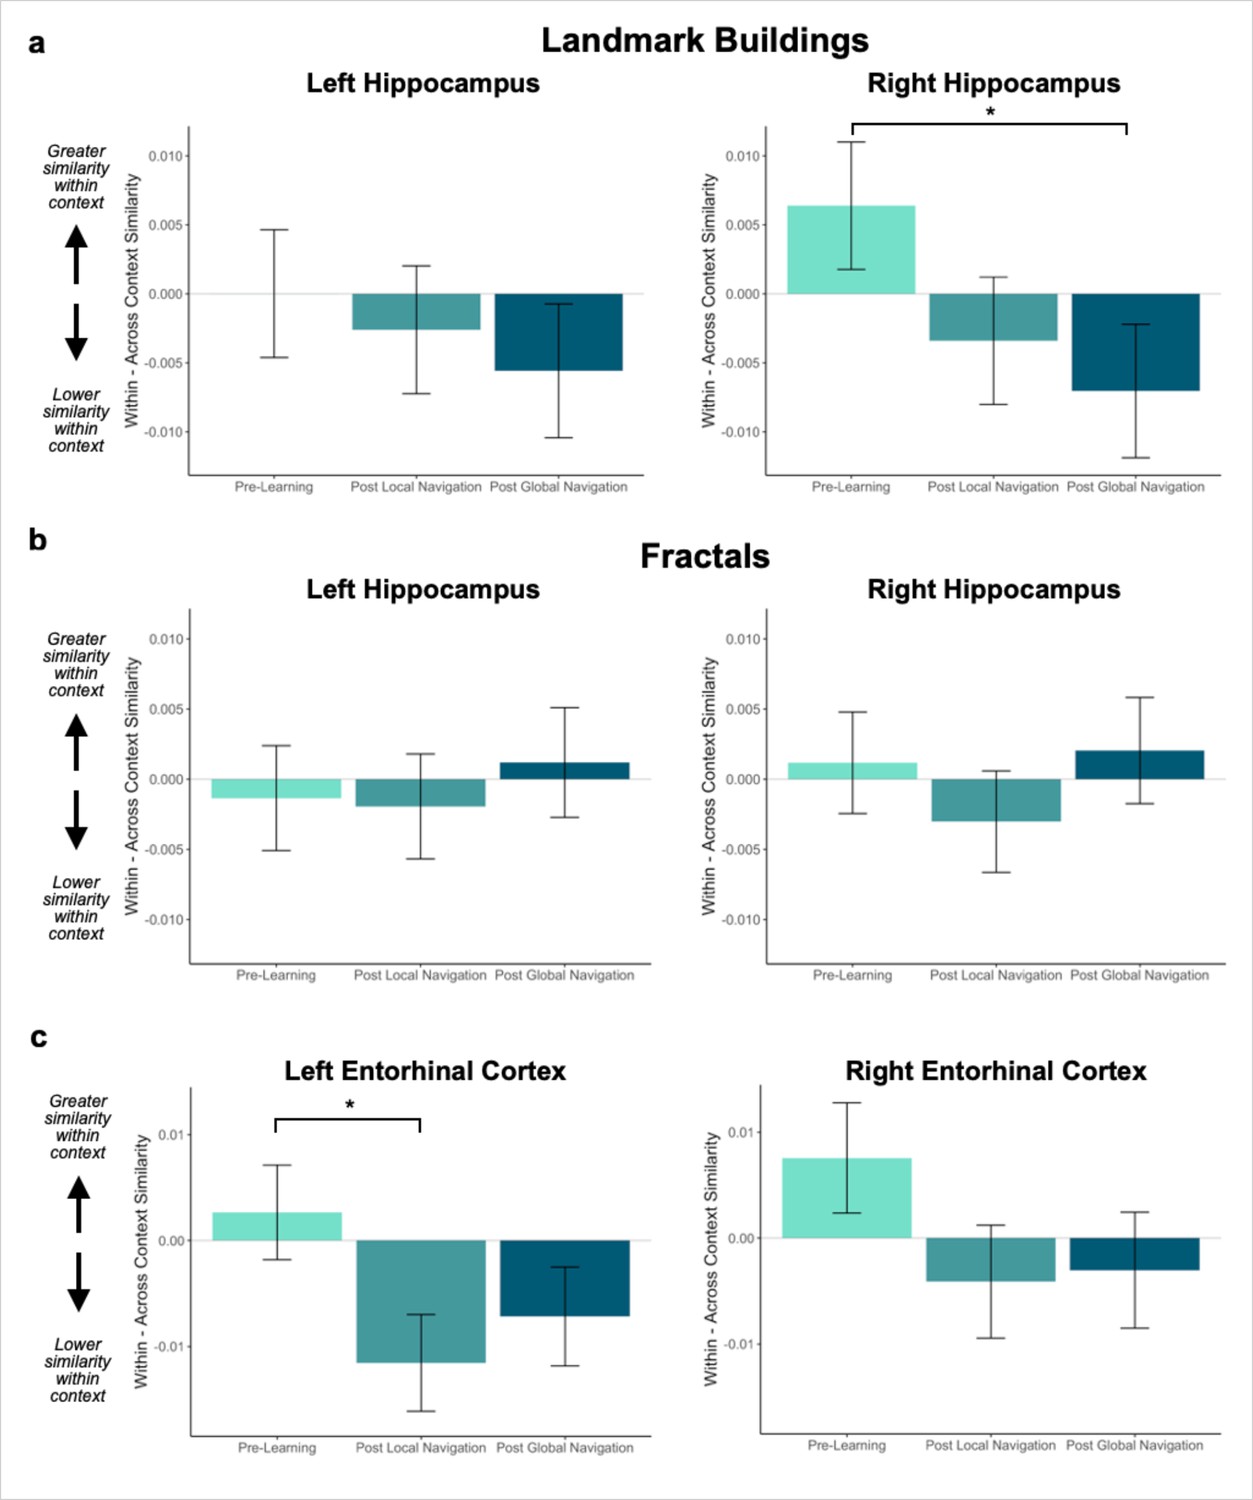
Context representations in hippocampus and entorhinal cortex (EC).
(A) Contrast estimates for models predicting landmark similarity in left and right hippocampus. Right hippocampus differentiates landmarks located on the same track following Global Navigation, such that those experienced within the same track became less similar. A similar pattern of findings was observed in left hippocampus but did not reach statistical significance. (B) Contrast estimates for models predicting fractal similarity in left and right hippocampus. Interactions between scan session and context were not significant. (C) Contrast estimates for models in left and right EC that include both landmark and fractal stimuli. Left EC differentiates items located on the same track following Local Navigation, such that items experienced within the same track became less similar. Following Global Navigation, pattern similarity remained lower for within-track items, but the interaction between context and scan session did not reach statistical significance. A similar pattern of findings was observed in right EC, but interactions between context and scan session did not reach statistical significance (a priori predicted effects: * p < 0.05, uncorrected. Error bars denote SE of the estimates. Hippocampus: Day 2 > Day 1, n = 23; Day 3 > Day 1, n = 21; Left EC: n = 20; Right EC: n = 18).
Figure 4
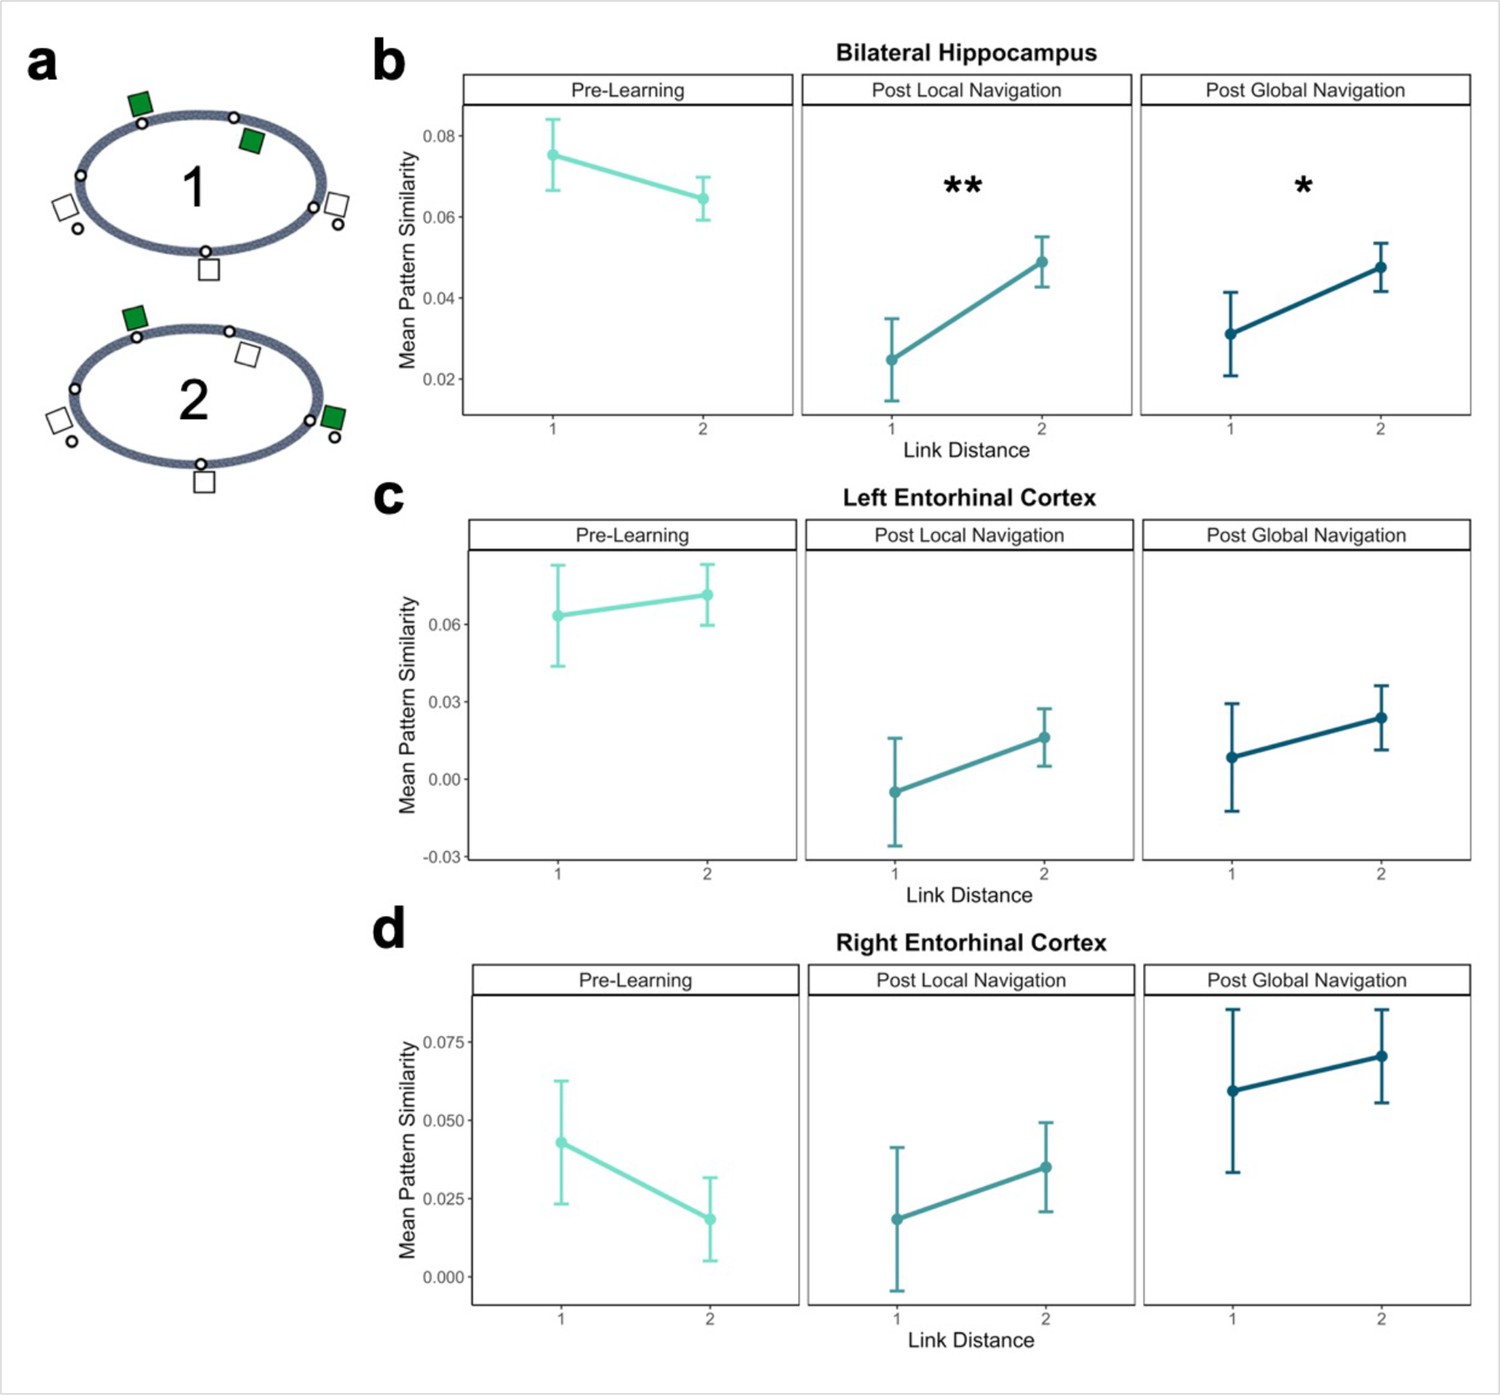
Hippocampal pattern similarity reflects distance in local environments.
(A) Examples of landmarks at link distances 1 and 2 on the same track. (B) Hippocampal pattern similarity for within-track landmarks Pre-Learning (left), after the Local Navigation Task (center), and after the Global Navigation Task (right). Interactions between distance and scan session were significant from Pre-Learning to Post Local and Global Navigation. (C–D) Pattern similarity for within-track landmarks in the left (C) and right (D) EC. Interactions between distance and scan session were not significant. (a priori predicted effects: ** p < 0.01, * p < 0.05, uncorrected. Error bars denote SE of the estimates. Hippocampus: Day 2 > Day 1, n = 23; Day 3 > Day 1, n = 21; Left EC: n = 20; Right EC: n = 18).
Figure 5
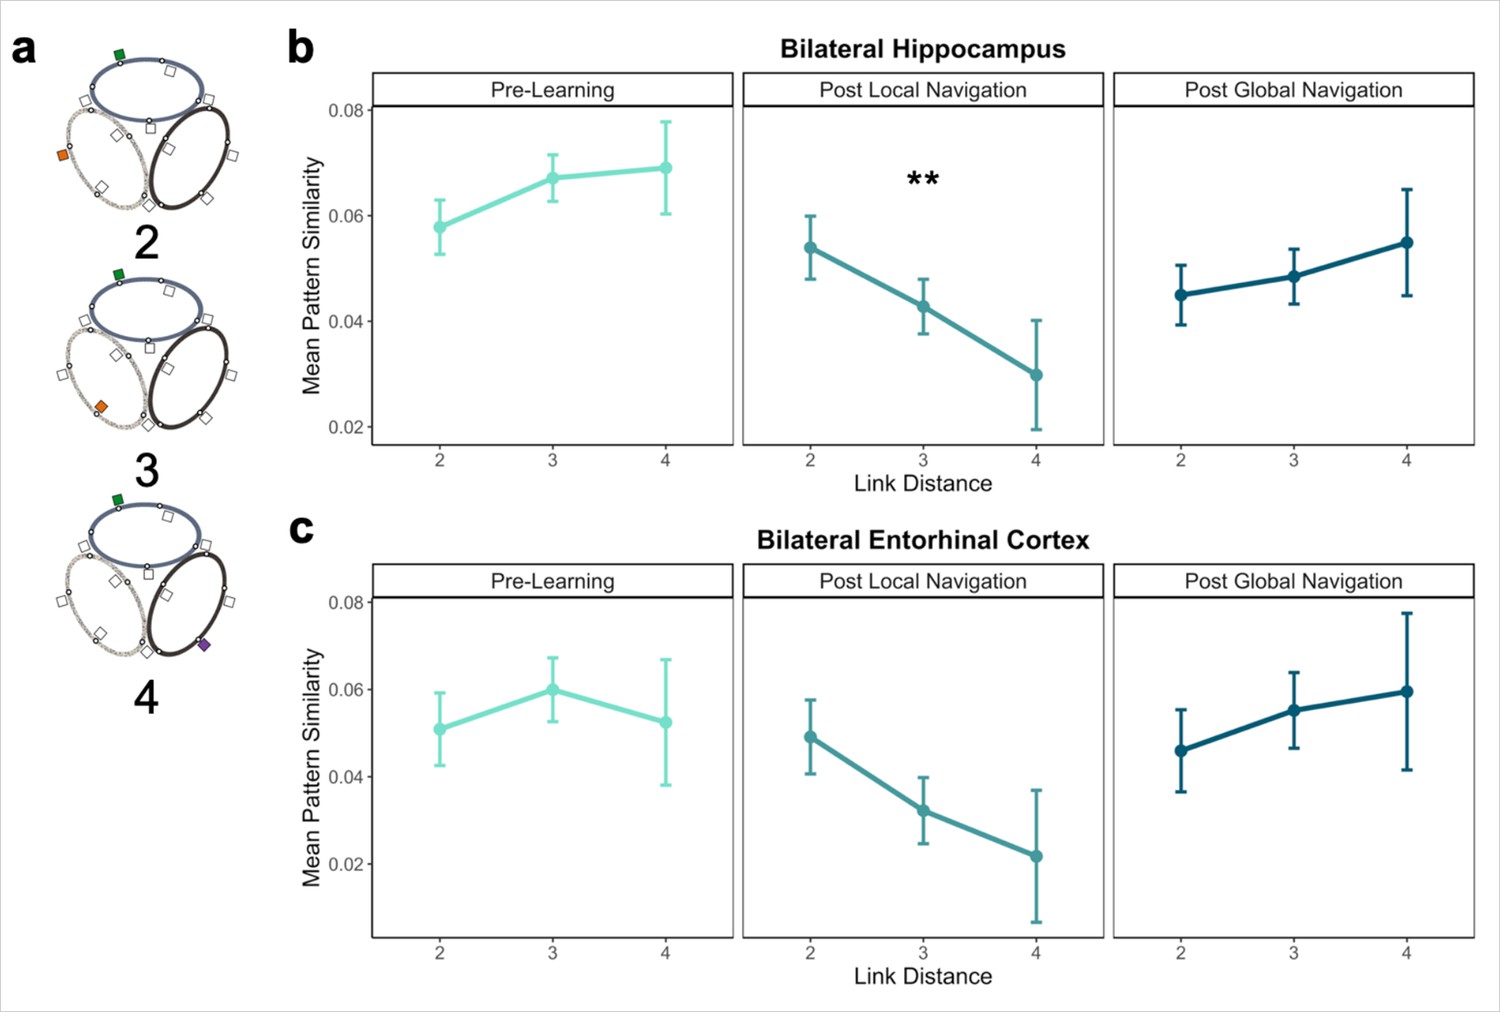
Distance representations in the Global environment.
(A) Examples of landmarks at different link distances on different tracks. (B) Hippocampal pattern similarity for landmarks on different tracks Pre-Learning (left), after the Local Navigation Task (center), and after the Global Navigation Task (right). The interaction between distance and scan session was significant from Pre-Learning to Post Local Navigation, but not to Post Global Navigation. (C) A similar pattern of findings was observed in Entorhinal Cortex, but the interaction between distance and scan session was not significant from Pre-Learning to Post Local Navigation (a priori predicted effects: ** p < 0.01, uncorrected. Error bars denote SE of the estimates. Hippocampus: Day 2 > Day 1, n = 23; Day 3 > Day 1, n = 21; EC: n = 18).
Figure 6
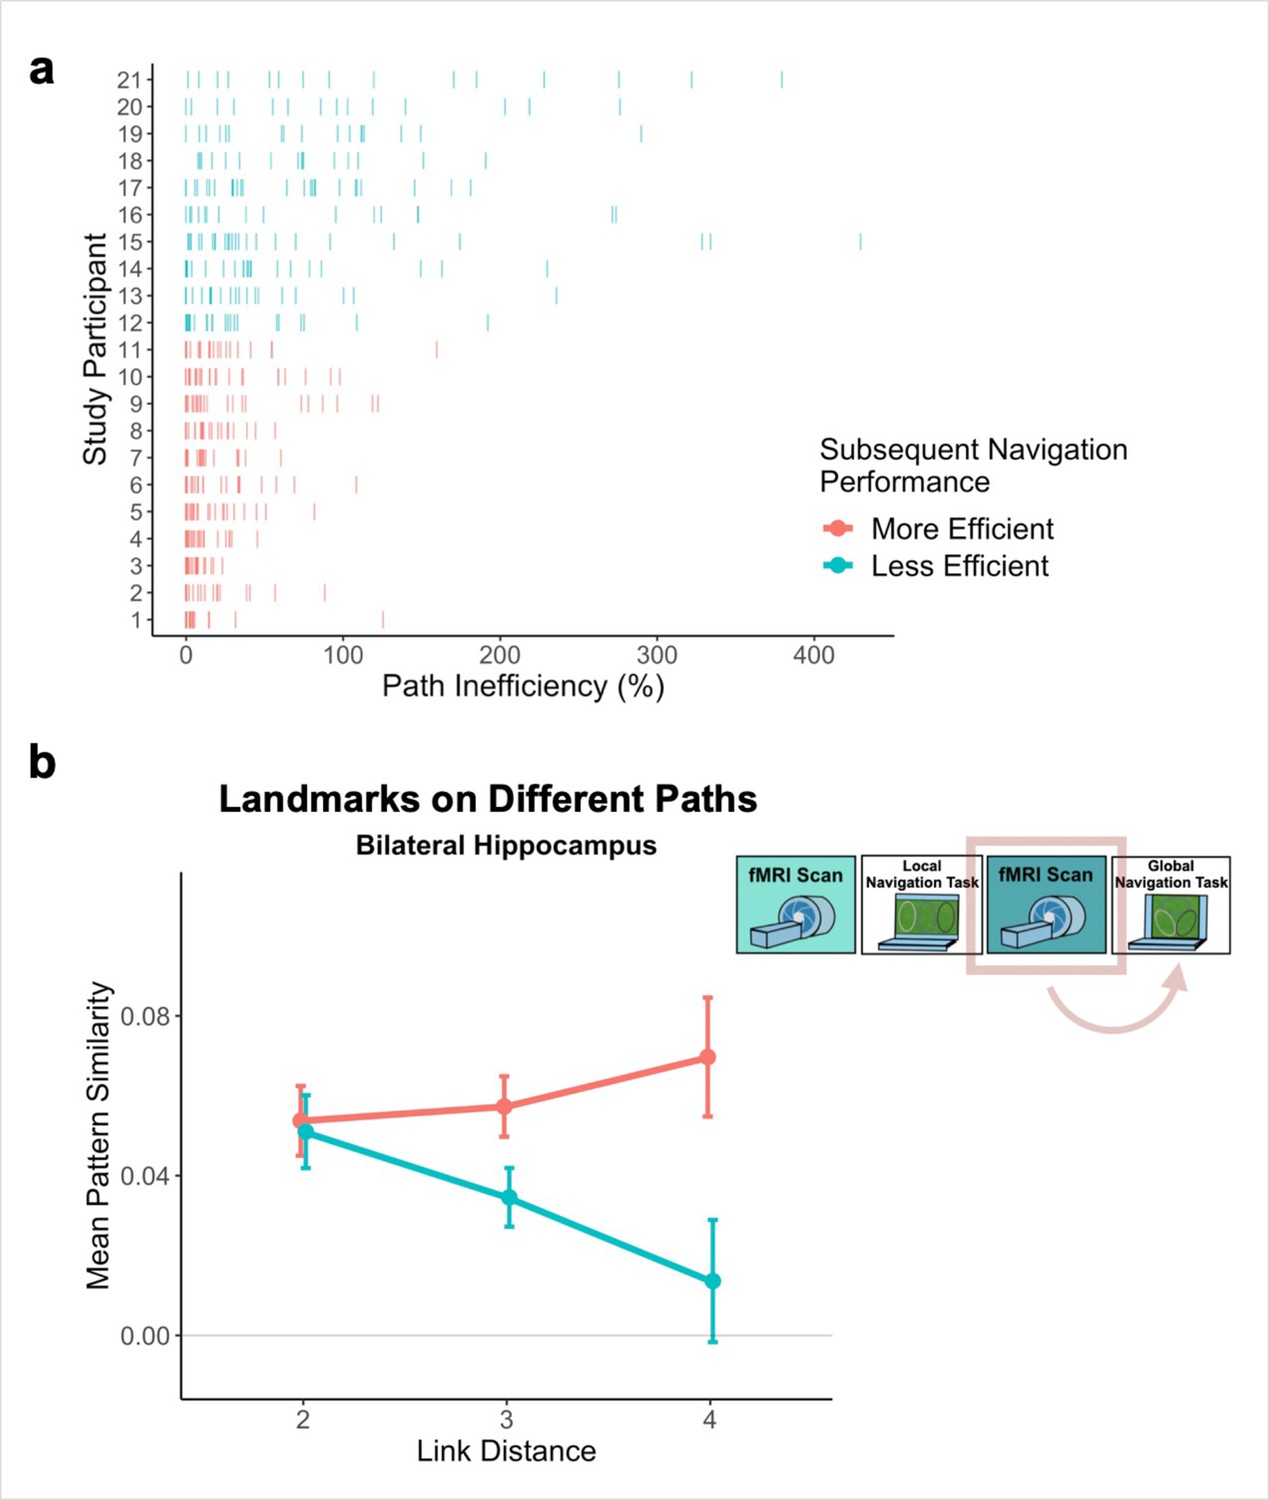
Path inefficiency on the Global Navigation Task varies with across-track distance-related hippocampal pattern similarity after the Local Navigation Task.
To qualitatively visualize the relationship between pattern similarity, link distance, and path inefficiency, we split participants into two groups – More Efficient and Less Efficient – based on their median path inefficiency on across-track trials in the first four test runs of the Global Task on Day 2. (A) Path inefficiency (%) for each across-track trial during the first four test runs of the Global Navigation Task, plotted for each participant and colored by performance group. (B) We used a linear mixed-effects model to formally test this relationship (see main text for details). The linear model revealed a significant interaction between path inefficiency and link distance, with the direction of the effect being unexpected. To qualitatively depict this effect, we plot hippocampal pattern similarity for landmarks on different tracks prior to the Global Navigation Task for the Less Efficient and More Efficient median-split data. Data are split by participants’ subsequent navigation performance as shown in (A). (Error bars denote SE of the estimates. More Efficient, n = 11; Less Efficient, n = 10).
Appendix 1—figure 1
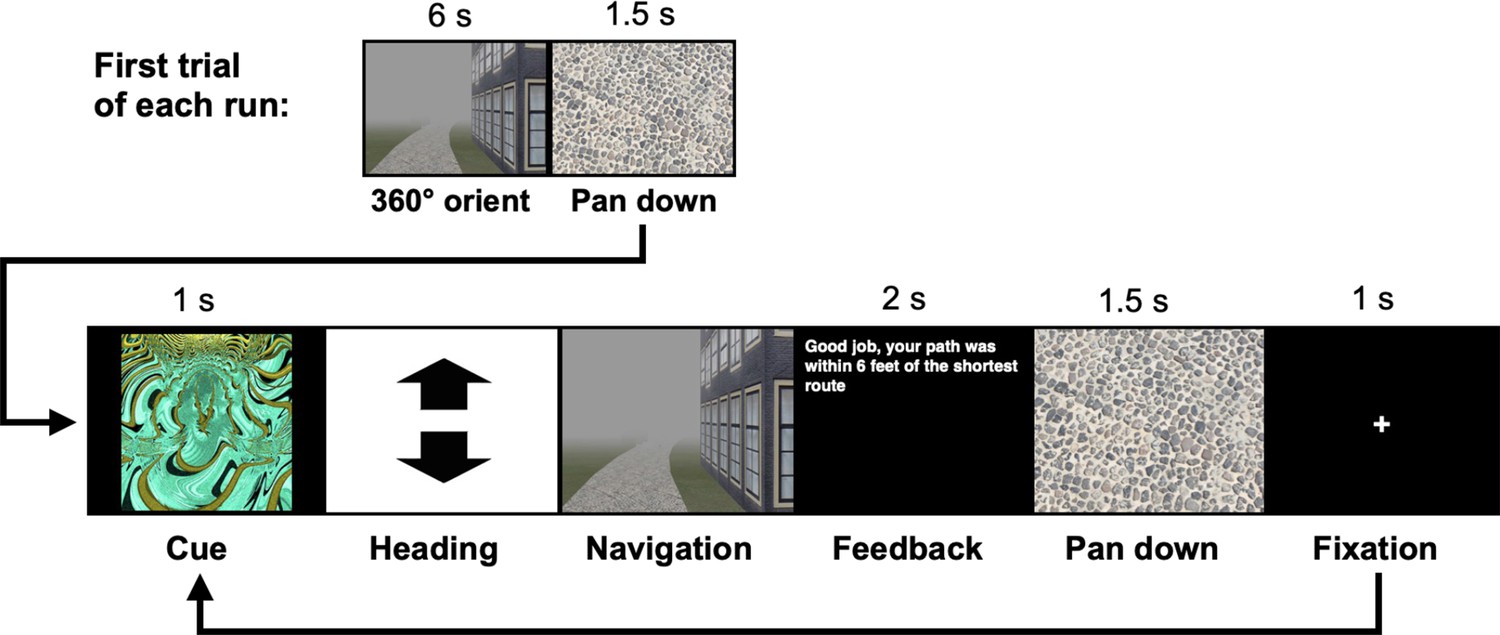
Trial structure for all navigation tasks.
Each behavioral run contained 10 navigation trials. At the start of each run, participants were placed at a location on the track and rotated 360 degrees (6 s). Trials then proceeded as follows: (1) a fractal cue appeared onscreen (1 s) indicating the goal to which the participant should navigate; (2) participants chose their heading direction and (3) navigated to the cued goal location, pressing the spacebar when they arrived; (4) feedback appeared onscreen revealing whether the participant was at the correct location and whether they had navigated via the shortest path (2 s); and (5) the camera panned down and a fixation cross appeared (1 s) before the next trial began. On learning trials, goal locations were marked by fractal images appearing on the track. On test trials, fractals were not visible on the track and participants had to rely on memory to navigate.
Appendix 1—figure 2
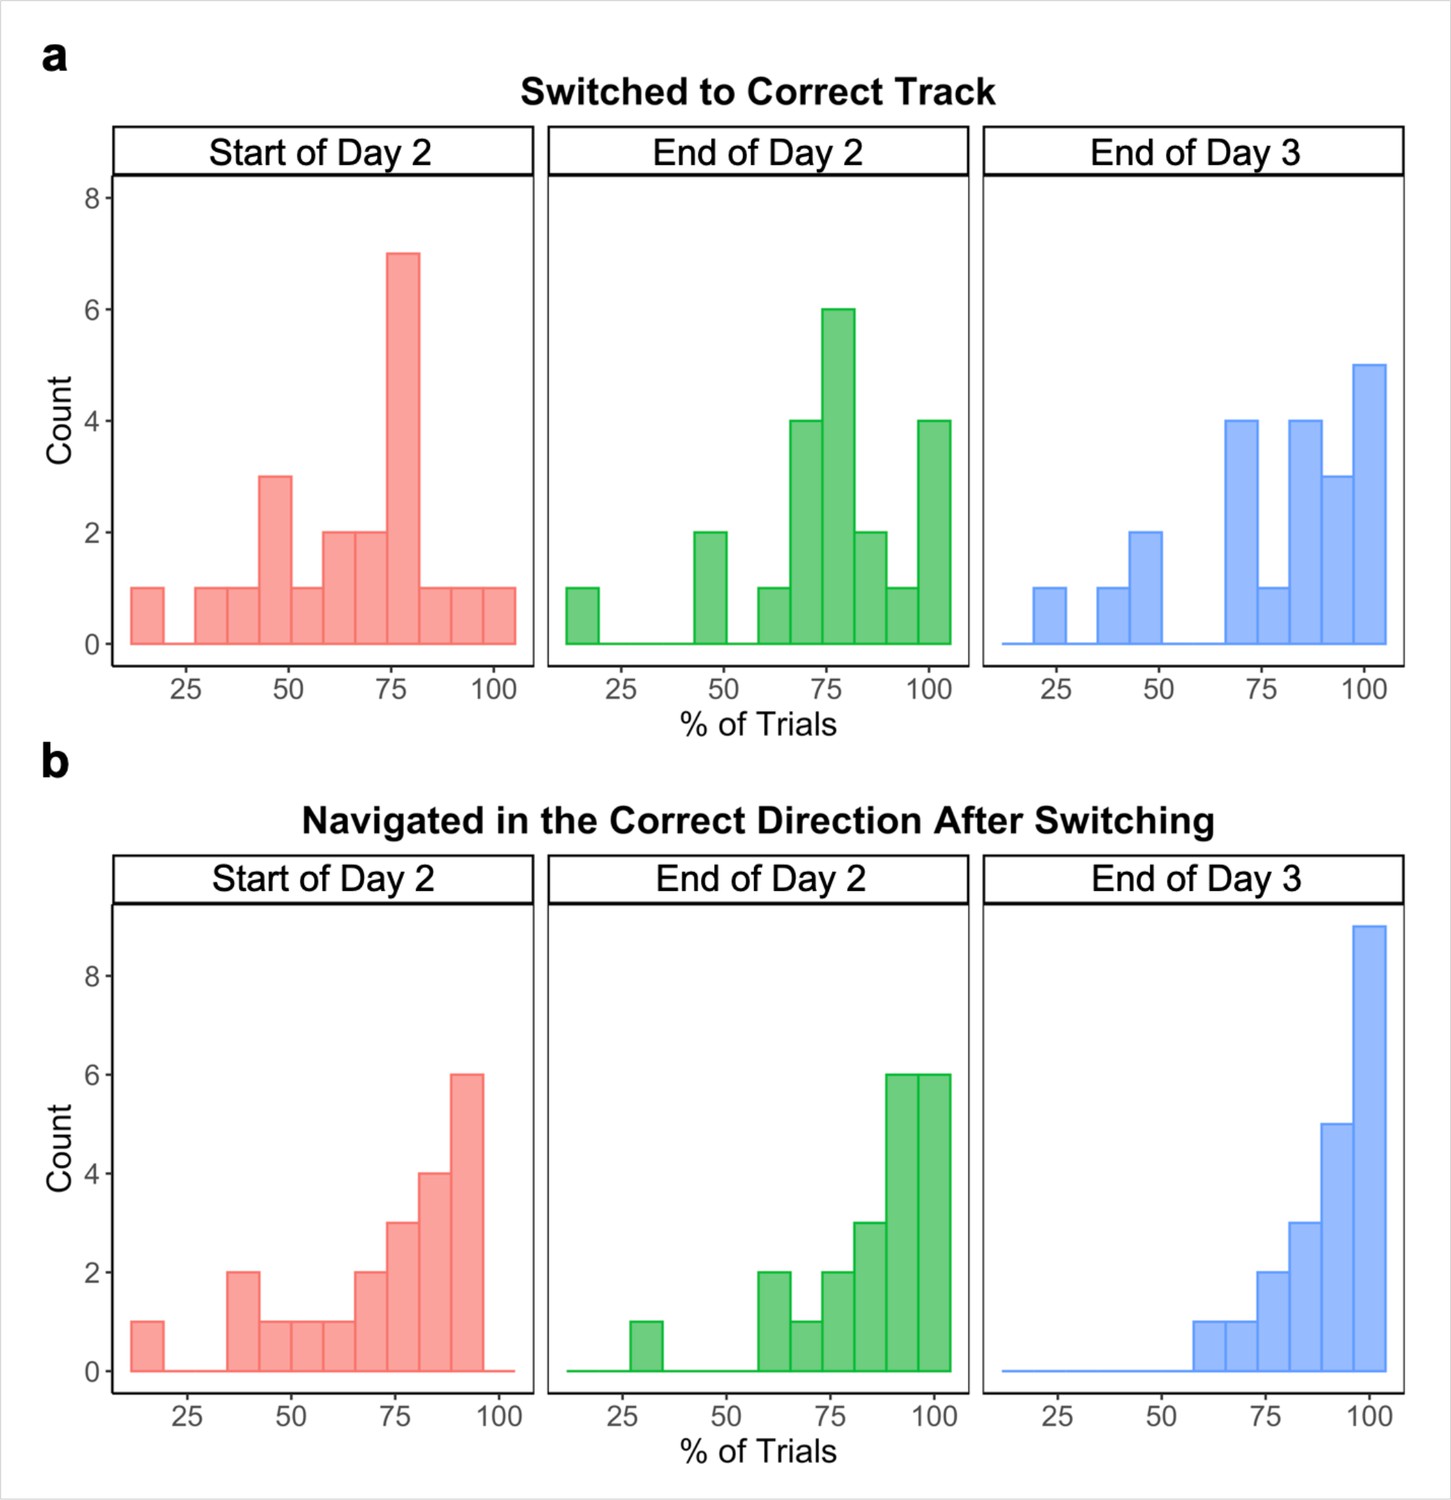
Performance improves across the Global Navigation Task.
Individual participants’ performance on across-track navigation trials at the start (first four test runs; left) and end (last two test runs; center) of the task on Day 2, and at the end (last two test runs; right) of Day 3. (A) Percent of across-track trials where participants switched to the correct track. (B) Percent of across-track trials where participants navigated in the correct direction once switching (n = 21).
Appendix 1—figure 3

Hippocampal pattern similarity for landmark buildings on different tracks.
To visualize the relationship between pattern similarity, link distance, and path inefficiency, we split participants into two groups – More Efficient and Less Efficient – based on their median path inefficiency on across-track trials in the first four test runs of the Global Task on Day 2. Pattern similarity relationships did not differ between participants who are more or less efficient on the Global Navigation Task, (A) Pre-Learning (Day 1) and (B) Post Global Navigation (Day 3). (Error bars denote SE of the estimates. More Efficient, n = 11; Less Efficient, n = 10).
Appendix 1—figure 4
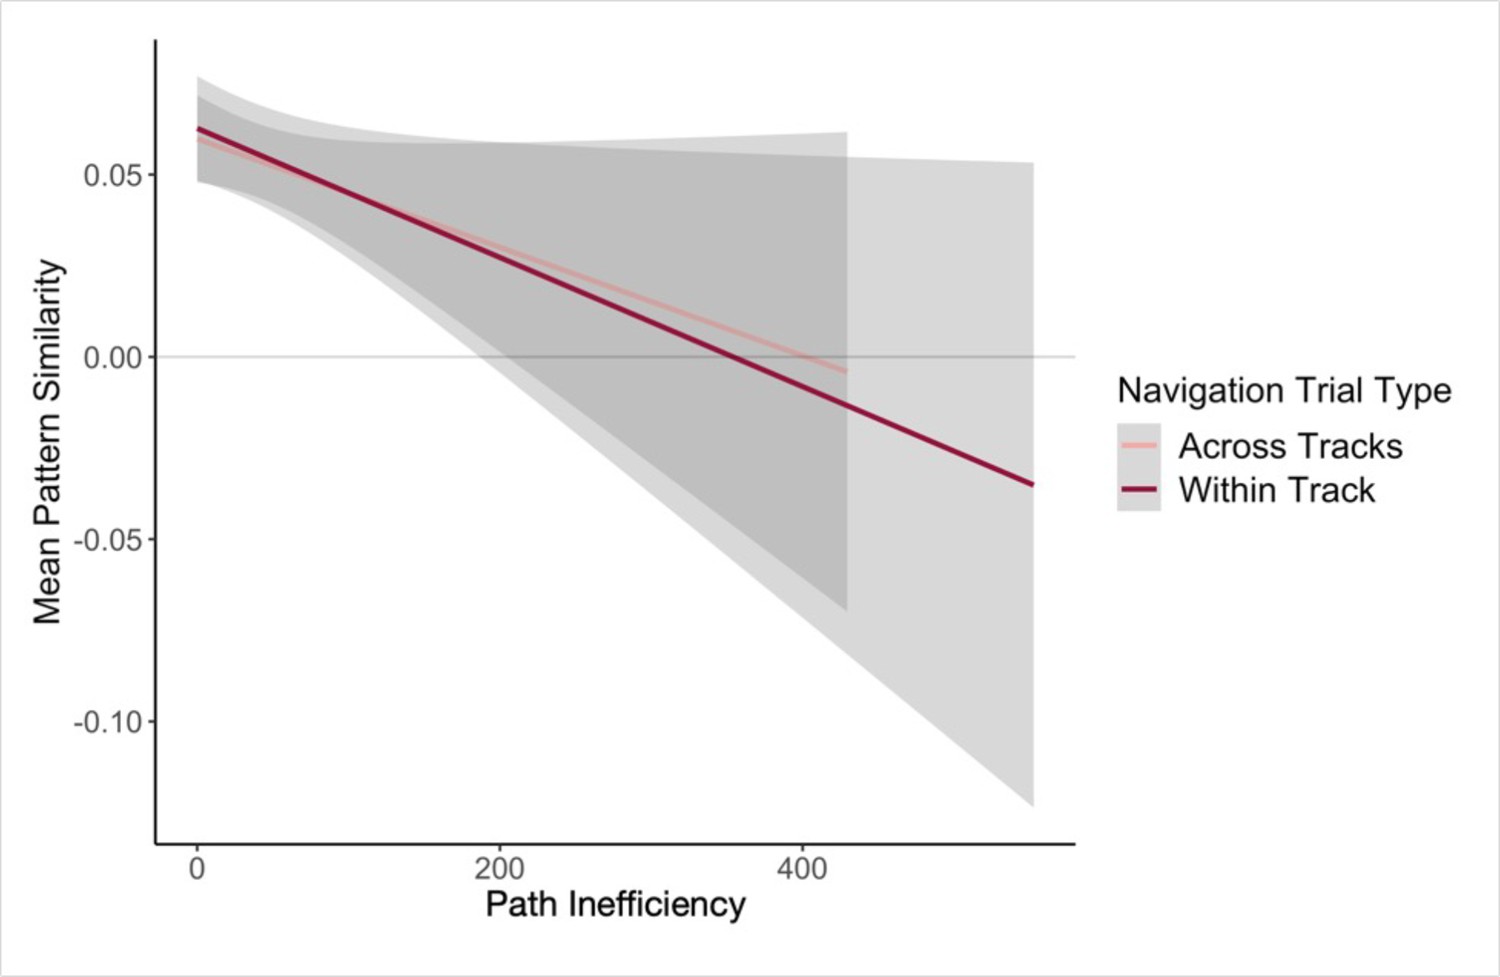
Hippocampal pattern similarity (Post Local Navigation) relates to trial-level performance on the subsequent Global Navigation Task.
We observed trend-level evidence that greater hippocampal pattern similarity predicted more efficient paths at the start of Global Navigation for both trial types. (Solid lines = estimated linear fit to the data, gray = 95% CI).
Appendix 1—figure 5
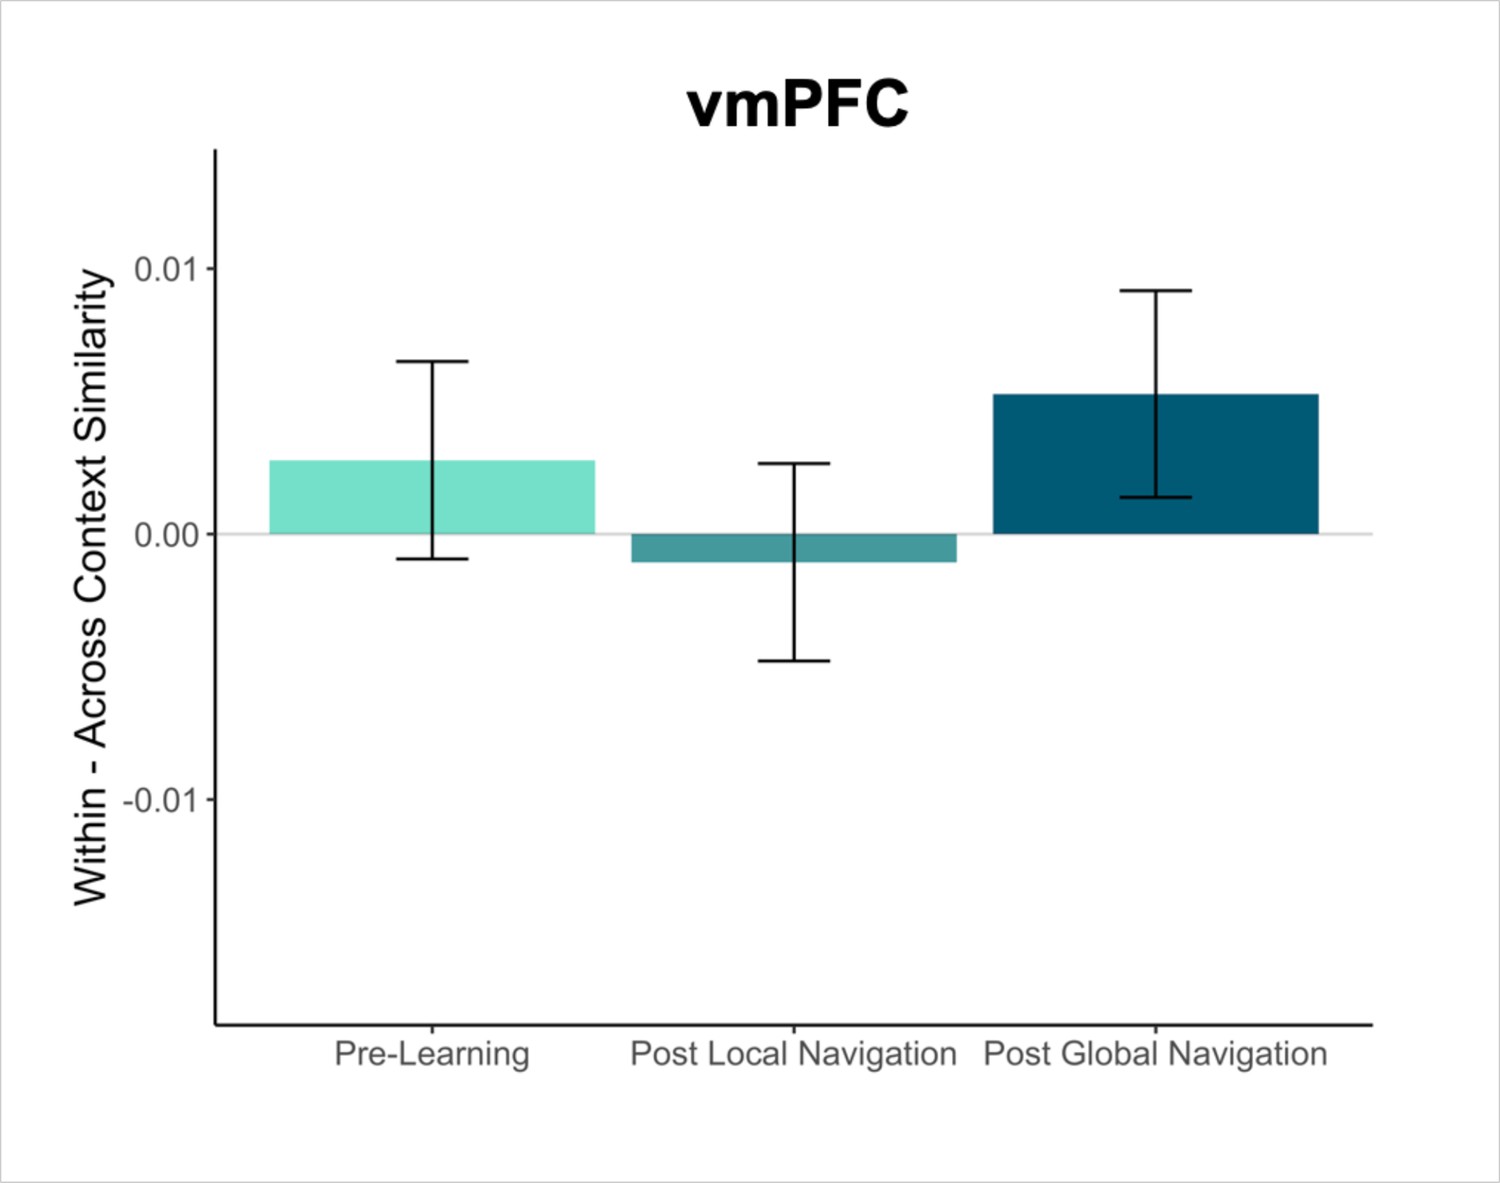
Contrast estimates from a model in vmPFC that includes both landmark and fractal stimuli.
Interactions between scan session and context were not significant. (Error bars denote SE of the estimates. Day 2 > Day 1, n = 23; Day 3 > Day 1, n = 21).
Appendix 1—figure 6

Pattern similarity for landmark buildings at different link distances in vmPFC.
(A) Pattern similarity for landmarks on the same track Pre-Learning (left), after the Local Navigation Task (center), and after the Global Navigation Task (right). Interactions between link distance and scan session were not significant. (B) Pattern similarity for landmarks on different tracks. Interactions between link distance and scan session were not significant. (Error bars denote SE of the estimates. Day 2 > Day 1, n = 23; Day 3 > Day 1, n = 21).
Appendix 1—figure 7
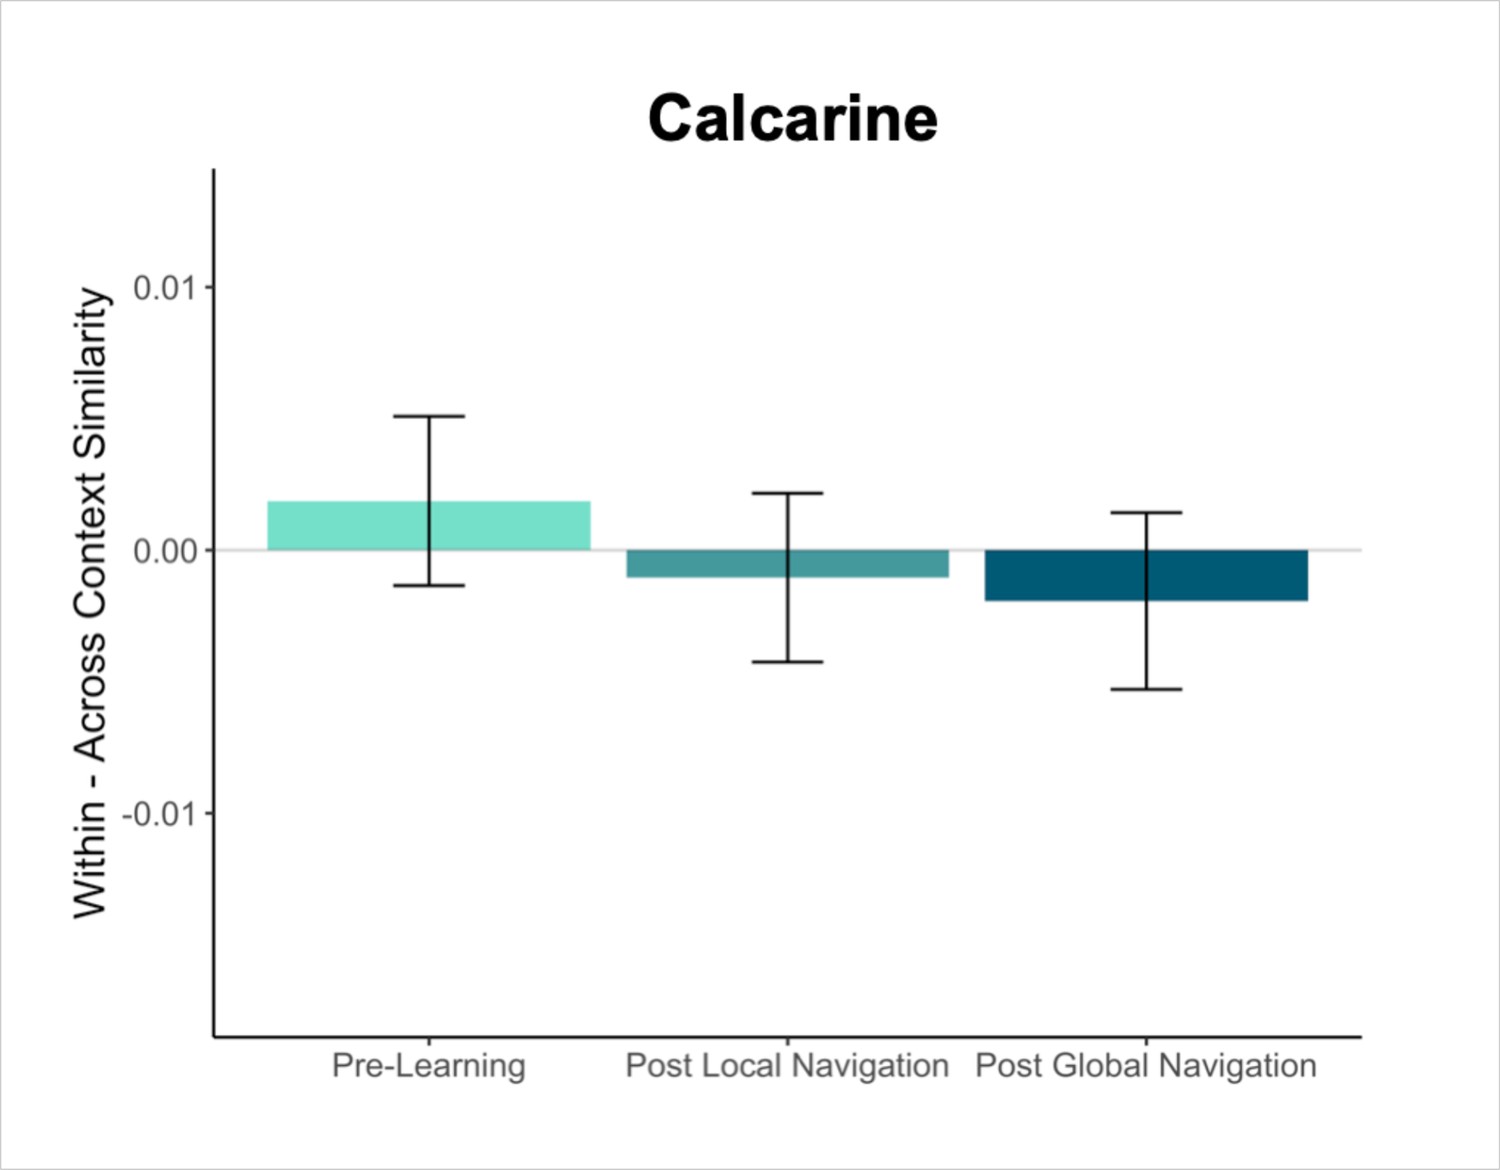
Contrast estimates for context models fit to data in a visual region serving as a control (calcarine).
Within - across context similarity for landmark buildings. Interactions between scan session and context were not significant. (Error bars denote SE of the estimates. Day 2 > Day 1, n = 23; Day 3 > Day 1, n = 21).
Appendix 1—figure 8
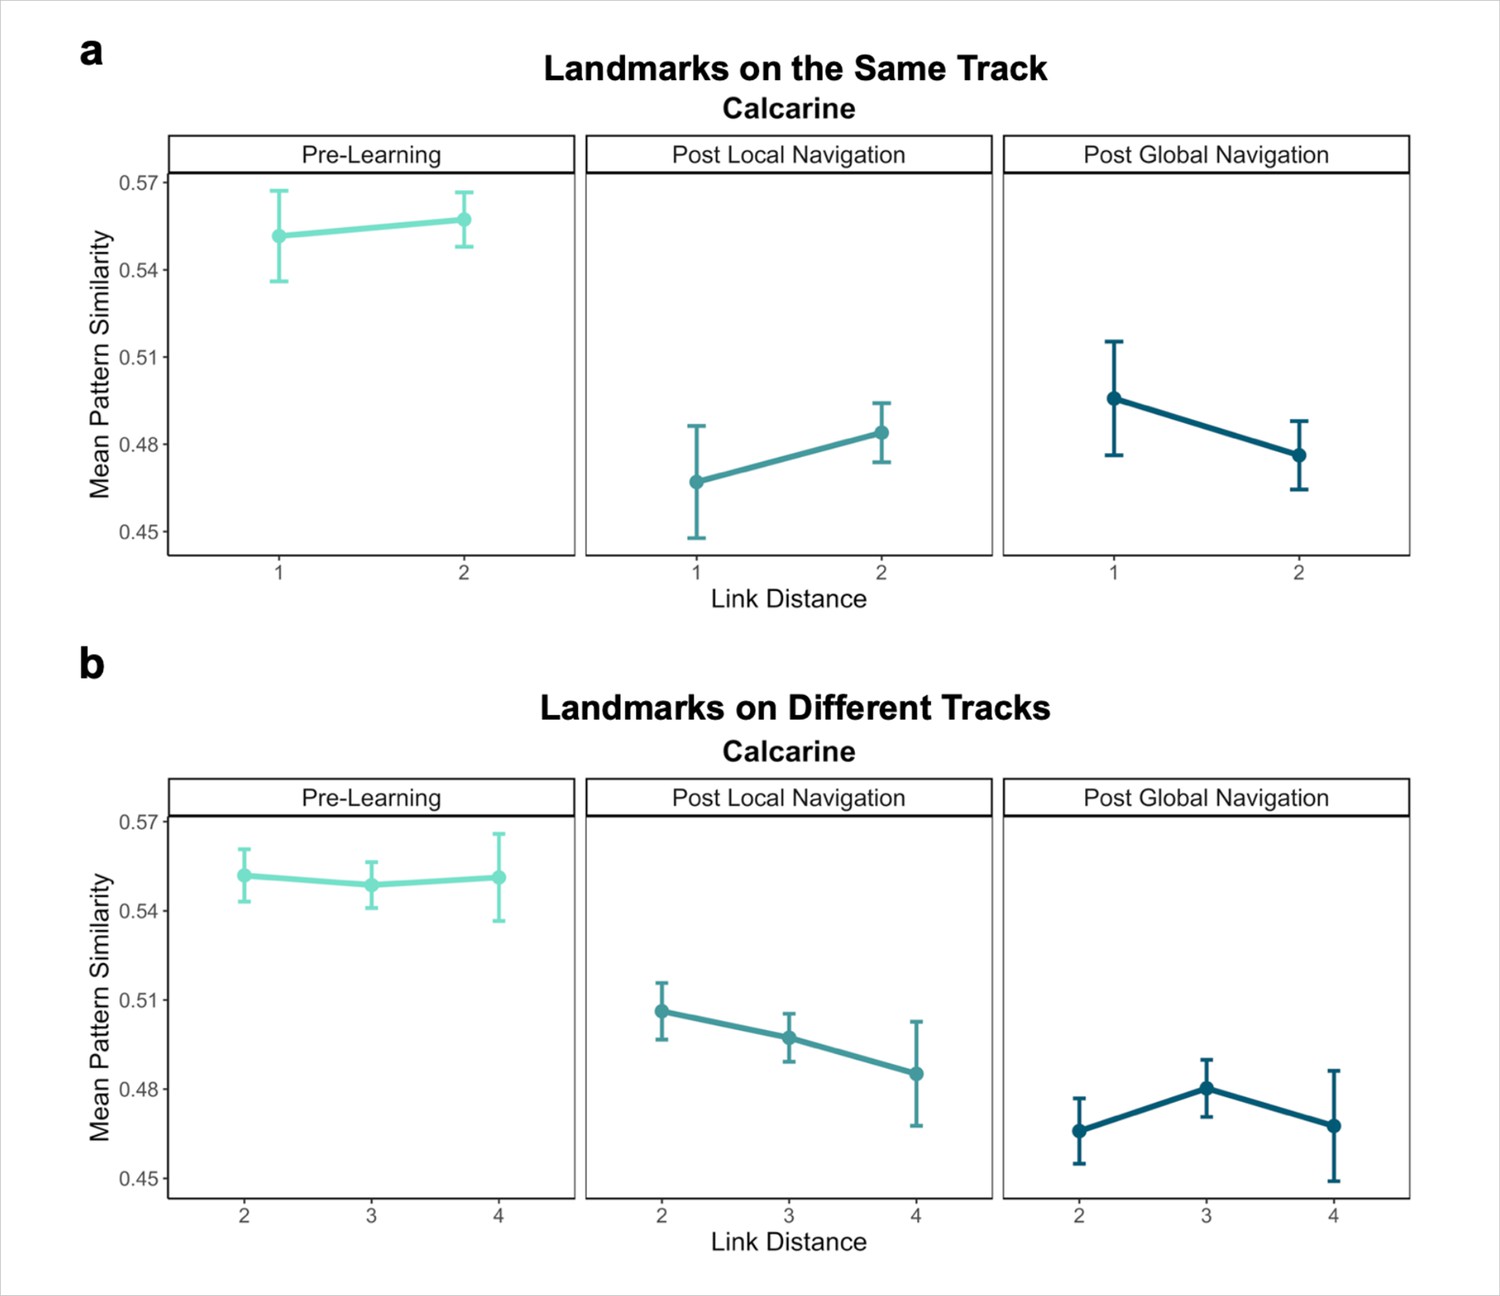
Pattern similarity for landmark buildings at different link distances in a visual region serving as a control (calcarine).
(A) Pattern similarity for landmarks on the same track Pre-Learning (left), after the Local Navigation Task (center), and after the Global Navigation Task (right). Interactions between link distance and scan session were not significant. (B) Pattern similarity for landmarks on different tracks. Interactions between link distance and scan session were not significant (Error bars denote SE of the estimates. Day 2 > Day 1, n = 23; Day 3 > Day 1, n = 21).
Tables
Appendix 1—table 1
Linear mixed-effects model results for an omnibus context model predicting neural pattern similarity, fit to data in the hippocampus.
SE = standard error. To correct for multiple comparisons, we adjusted the α-value for 18 tests. An asterisk (*) denotes findings that survived FDR correction.
| Variable | β | SE | t | p |
|---|---|---|---|---|
| (Intercept) | 0.035 | 0.009 | 3.858 | 8.11e–4 |
| Day 2 | 0.002 | 0.011 | 0.136 | 0.892 |
| Day 3 | –0.006 | 0.012 | –0.542 | 0.588 |
| stimulus type (landmark > fractal) | 0.007 | 0.003 | 2.422 | 0.015 |
| context (same track > different tracks) | –0.001 | 0.003 | –0.254 | 0.800 |
| hemisphere | 0.006 | 0.002 | 2.756 | 0.006* |
| Day 2 × stimulus type | –0.003 | 0.004 | –0.715 | 0.475 |
| Day 3 × stimulus type | –0.011 | 0.004 | –2.604 | 0.009* |
| Day 2 × context | –0.002 | 0.004 | –0.365 | 0.715 |
| Day 3 × context | –0.001 | 0.004 | –0.334 | 0.739 |
| stimulus type × context | 0.001 | 0.006 | 0.246 | 0.806 |
| Day 2 × hemisphere | –0.011 | 0.003 | –3.477 | 5.08e–4* |
| Day 3 × hemisphere | 0.012 | 0.003 | 3.795 | 1.48e–4* |
| stimulus type × hemisphere | 0.004 | 0.004 | 0.866 | 0.387 |
| context × hemisphere | 0.005 | 0.004 | 1.066 | 0.287 |
| Day 2 × stimulus type × context | –0.002 | 0.009 | –0.216 | 0.829 |
| Day 3 × stimulus type × context | –0.008 | 0.009 | –0.920 | 0.357 |
| Day 2 × stimulus type × hemisphere | –0.002 | 0.006 | –0.320 | 0.749 |
| Day 3 × stimulus type × hemisphere | –0.001 | 0.006 | –0.192 | 0.848 |
| Day 2 × context × hemisphere | –0.005 | 0.006 | –0.899 | 0.369 |
| Day 3 × context × hemisphere | –0.005 | 0.006 | –0.767 | 0.443 |
| stimulus type × context × hemisphere | 0.004 | 0.009 | 0.497 | 0.619 |
| Day 2×stimulus type×context × hemisphere | –0.004 | 0.012 | –0.322 | 0.747 |
| Day 3 × stimulus type × context × hemisphere | –0.006 | 0.012 | –0.511 | 0.610 |
Appendix 1—table 2
Linear mixed-effects model results for a context model predicting neural pattern similarity for landmark buildings, fit to data in left hippocampus.
SE = standard error. To correct for multiple comparisons, we adjusted the α-value for 16 tests.
| Variable | β | SE | t | p |
|---|---|---|---|---|
| (Intercept) | 0.051 | 0.049 | 1.043 | 0.297 |
| Day 2 | 0.001 | 0.014 | 0.058 | 0.954 |
| Day 3 | –0.011 | 0.016 | –0.686 | 0.493 |
| context (same track > different tracks) | 0.000 | 0.005 | 0.003 | 0.998 |
| Day 2 × context | –0.003 | 0.007 | –0.400 | 0.689 |
| Day 3 × context | –0.006 | 0.007 | –0.834 | 0.404 |
Appendix 1—table 3
Linear mixed-effects model results for a context model predicting neural pattern similarity for landmark buildings, fit to data in right hippocampus.
SE = standard error. No correction for multiple comparisons was applied. To correct for multiple comparisons, we adjusted the α-value for 16 tests. No findings survived FDR correction.
| Variable | β | SE | t | p |
|---|---|---|---|---|
| (Intercept) | 0.062 | 0.049 | 1.260 | 0.208 |
| Day 2 | –0.011 | 0.015 | –0.747 | 0.455 |
| Day 3 | –0.002 | 0.017 | –0.099 | 0.921 |
| context (same track > different tracks) | 0.006 | 0.005 | 1.385 | 0.166 |
| Day 2 × context | –0.010 | 0.007 | –1.502 | 0.133 |
| Day 3 × context | –0.013 | 0.007 | –2.014 | 0.044 |
Appendix 1—table 4
Linear mixed-effects model results for a context model predicting neural pattern similarity for fractals, fit to data in left hippocampus.
SE = standard error. To correct for multiple comparisons, we adjusted the α-value for 16 tests.
| Variable | β | SE | t | p |
|---|---|---|---|---|
| (Intercept) | 0.029 | 0.030 | 0.945 | 0.345 |
| Day 2 | 0.003 | 0.012 | 0.262 | 0.794 |
| Day 3 | –0.002 | 0.011 | –0.150 | 0.881 |
| context (same track > different tracks) | –0.001 | 0.004 | –0.363 | 0.717 |
| Day 2 × context | –0.001 | 0.005 | –0.111 | 0.911 |
| Day 3 × context | 0.003 | 0.005 | 0.472 | 0.637 |
Appendix 1—table 5
Linear mixed-effects model results for a context model predicting neural pattern similarity for fractals, fit to data in right hippocampus.
SE = standard error. To correct for multiple comparisons, we adjusted the α-value for 16 tests.
| Variable | β | SE | t | p |
|---|---|---|---|---|
| (Intercept) | 0.100 | 0.029 | 3.398 | 6.89e–4 |
| Day 2 | –0.003 | 0.012 | –0.268 | 0.789 |
| Day 3 | 0.011 | 0.014 | 0.817 | 0.414 |
| context (same track > different tracks) | 0.001 | 0.004 | 0.326 | 0.745 |
| Day 2 × context | –0.004 | 0.005 | –0.823 | 0.411 |
| Day 3 × context | 0.001 | 0.005 | 0.166 | 0.868 |
Appendix 1—table 6
Linear mixed-effects model results for an omnibus context model predicting neural pattern similarity, fit to data in EC.
SE = standard error. To correct for multiple comparisons, we adjusted the α-value for 18 tests. An asterisk (*) denotes findings that survived FDR correction.
| Variable | β | SE | t | p |
|---|---|---|---|---|
| (Intercept) | 0.049 | 0.017 | 2.912 | 0.004 |
| Day 2 | –0.037 | 0.020 | –1.874 | 0.061 |
| Day 3 | –0.023 | 0.020 | –1.178 | 0.239 |
| stimulus type (landmark > fractal) | 0.008 | 0.005 | 1.607 | 0.108 |
| context (same track > different tracks) | 0.002 | 0.005 | 0.461 | 0.645 |
| hemisphere | –0.022 | 0.004 | –6.060 | 1.37e–9* |
| Day 2 × stimulus type | 0.010 | 0.007 | 1.457 | 0.145 |
| Day 3 × stimulus type | –0.003 | 0.007 | –0.358 | 0.720 |
| Day 2 × context | –0.014 | 0.007 | –2.046 | 0.041 |
| Day 3 × context | –0.010 | 0.007 | –1.394 | 0.163 |
| stimulus type × context | –0.001 | 0.010 | –0.139 | 0.889 |
| Day 2 × hemisphere | 0.022 | 0.005 | 4.192 | 2.77e–5* |
| Day 3 × hemisphere | 0.056 | 0.005 | 10.552 | <2e–16* |
| stimulus type × hemisphere | 0.000 | 0.007 | 0.036 | 0.971 |
| context × hemisphere | 0.004 | 0.007 | 0.524 | 0.600 |
| Day 2 × stimulus type × context | 0.002 | 0.014 | 0.132 | 0.895 |
| Day 3 × stimulus type × context | –0.005 | 0.014 | –0.387 | 0.699 |
| Day 2 × stimulus type × hemisphere | –0.011 | 0.010 | –1.132 | 0.258 |
| Day 3 × stimulus type × hemisphere | –0.003 | 0.010 | –0.319 | 0.749 |
| Day 2 × context × hemisphere | 0.003 | 0.010 | 0.263 | 0.793 |
| Day 3 × context × hemisphere | 0.001 | 0.010 | 0.117 | 0.907 |
| stimulus type × context × hemisphere | –0.009 | 0.014 | –0.633 | 0.527 |
| Day 2 × stimulus type × context × hemisphere | –0.001 | 0.020 | –0.050 | 0.960 |
| Day 3 × stimulus type×context × hemisphere | 0.022 | 0.020 | 1.057 | 0.291 |
Appendix 1—table 7
Linear mixed-effects model results for a context model predicting neural pattern similarity, fit to data in left EC.
SE = standard error. To correct for multiple comparisons, we adjusted the α-value for 16 tests. No findings survived FDR correction.
| Variable | β | SE | t | p |
|---|---|---|---|---|
| (Intercept) | 0.082 | 0.040 | 2.025 | 0.043 |
| Day 2 | –0.036 | 0.024 | –1.490 | 0.136 |
| Day 3 | –0.026 | 0.021 | –1.223 | 0.221 |
| context (same track > different tracks) | 0.003 | 0.004 | 0.656 | 0.512 |
| Day 2 × context | –0.014 | 0.006 | –2.339 | 0.019 |
| Day 3 × context | –0.009 | 0.006 | –1.457 | 0.145 |
Appendix 1—table 8
Linear mixed-effects model results for a context model predicting neural pattern similarity, fit to data in right EC.
SE = standard error. To correct for multiple comparisons, we adjusted the α-value for 16 tests.
| Variable | β | SE | t | p |
|---|---|---|---|---|
| (Intercept) | 0.067 | 0.049 | 1.362 | 0.173 |
| Day 2 | 0.002 | 0.022 | 0.071 | 0.943 |
| Day 3 | 0.044 | 0.024 | 1.836 | 0.066 |
| context (same track > different tracks) | 0.008 | 0.005 | 1.455 | 0.146 |
| Day 2 × context | –0.012 | 0.007 | –1.568 | 0.117 |
| Day 3 × context | –0.011 | 0.008 | –1.404 | 0.160 |
Appendix 1—table 9
Linear mixed-effects model results for a context model predicting neural pattern similarity that included EC and hippocampus.
SE = standard error. To correct for multiple comparisons, we adjusted the α-value for 5 tests. An asterisk (*) denotes findings that survived FDR correction.
| Variable | β | SE | t | p |
|---|---|---|---|---|
| (Intercept) | 0.074 | 0.021 | 3.623 | 3.66e–4 |
| Day 2 | –0.012 | 0.013 | –0.883 | 0.377 |
| Day 3 | –0.010 | 0.013 | –0.780 | 0.436 |
| context (same track > different tracks) | 0.001 | 0.003 | 0.473 | 0.636 |
| region | –0.015 | 0.002 | –7.360 | 1.85e–13* |
| Day 2 × context | –0.004 | 0.004 | –0.956 | 0.339 |
| Day 3 × context | –0.002 | 0.004 | –0.594 | 0.553 |
| Day 2 × region | –0.017 | 0.003 | –5.757 | 8.58e–9* |
| Day 3 × region | 0.014 | 0.003 | 4.592 | 4.40e–6* |
| context × region | 0.004 | 0.004 | 0.907 | 0.364 |
| Day 2 × context × region | –0.009 | 0.006 | –1.635 | 0.102 |
| Day 3 × context × region | –0.007 | 0.006 | –1.278 | 0.201 |
Appendix 1—table 10
Linear mixed-effects model results for an omnibus model of local (within-track) distance, predicting neural pattern similarity for landmark buildings in the hippocampus.
SE = standard error. To correct for multiple comparisons, we adjusted the α-value for 5 tests.
| Variable | β | SE | t | p |
|---|---|---|---|---|
| (Intercept) | 0.044 | 0.012 | 3.621 | 9.12e–4 |
| Day 2 | –0.016 | 0.015 | –1.041 | 0.298 |
| Day 3 | –0.020 | 0.016 | –1.236 | 0.217 |
| distance (link distance 2 > link distance 1) | –0.014 | 0.015 | –0.974 | 0.330 |
| hemisphere | 0.006 | 0.011 | 0.528 | 0.598 |
| Day 2 × distance | 0.036 | 0.021 | 1.721 | 0.085 |
| Day 3 × distance | 0.033 | 0.021 | 1.520 | 0.129 |
| Day 2 × hemisphere | –0.011 | 0.015 | –0.723 | 0.470 |
| Day 3 × hemisphere | 0.004 | 0.015 | 0.288 | 0.774 |
| distance × hemisphere | –0.003 | 0.021 | –0.124 | 0.901 |
| Day 2 × distance × hemisphere | 0.008 | 0.030 | 0.280 | 0.780 |
| Day 3 × distance × hemisphere | 0.004 | 0.030 | 0.121 | 0.904 |
Appendix 1—table 11
Linear mixed-effects model results in a model of local (within-track) distance, predicting neural pattern similarity for landmarks buildings in the hippocampus.
SE = standard error. To correct for multiple comparisons, we adjusted the α-value for 10 tests. No results survived FDR correction.
| Variable | β | SE | t | p |
|---|---|---|---|---|
| (Intercept) | –0.037 | 0.088 | –0.419 | 0.675 |
| Day 2 | –0.021 | 0.013 | –1.597 | 0.110 |
| Day 3 | –0.018 | 0.014 | –1.247 | 0.213 |
| distance (link distance 2 > link distance 1) | –0.016 | 0.010 | –1.510 | 0.131 |
| Day 2 × distance | 0.040 | 0.015 | 2.700 | 0.007 |
| Day 3 × distance | 0.034 | 0.015 | 2.259 | 0.024 |
Appendix 1—table 12
Linear mixed-effects model results in a model of local (within-track) distance, predicting neural pattern similarity for fractals in the hippocampus.
SE = standard error. To correct for multiple comparisons, we adjusted the α-value for 10 tests.
| Variable | β | SE | t | p |
|---|---|---|---|---|
| (Intercept) | 0.038 | 0.047 | 0.802 | 0.422 |
| Day 2 | 0.001 | 0.010 | 0.068 | 0.946 |
| Day 3 | 0.005 | 0.012 | 0.456 | 0.653 |
| distance (link distance 2 > link distance 1) | 0.003 | 0.006 | 0.488 | 0.625 |
| Day 2 × distance | –0.003 | 0.008 | –0.368 | 0.713 |
| Day 3 × distance | –0.003 | 0.008 | –0.338 | 0.735 |
Appendix 1—table 13
Linear mixed-effects model results in an omnibus model of global (across-track) distance, predicting neural pattern similarity for landmark buildings in the hippocampus.
SE = standard error. To correct for multiple comparisons, we adjusted the α-value for 5 tests.
| Variable | β | SE | t | p |
|---|---|---|---|---|
| (Intercept) | 0.033 | 0.016 | 2.023 | 0.043 |
| Day 2 | 0.018 | 0.023 | 0.779 | 0.436 |
| Day 3 | –0.010 | 0.023 | –0.445 | 0.657 |
| distance | 0.002 | 0.007 | 0.369 | 0.712 |
| hemisphere | –0.012 | 0.018 | –0.659 | 0.510 |
| Day 2 × distance | –0.012 | 0.010 | –1.297 | 0.195 |
| Day 3 × distance | 0.000 | 0.010 | 0.044 | 0.965 |
| Day 2 × hemisphere | 0.019 | 0.025 | 0.763 | 0.445 |
| Day 3 × hemisphere | 0.016 | 0.026 | 0.632 | 0.527 |
| distance × hemisphere | 0.011 | 0.010 | 1.159 | 0.246 |
| Day 2 × distance × hemisphere | –0.015 | 0.013 | –1.082 | 0.279 |
| Day 3 × distance × hemisphere | –0.007 | 0.014 | –0.485 | 0.628 |
Appendix 1—table 14
Linear mixed-effects model results in a model of global (across-track) distance, predicting neural pattern similarity for landmark buildings in the hippocampus.
SE = standard error. To correct for multiple comparisons, we adjusted the α-value for 8 tests. An asterisk (*) denotes findings that survived FDR correction.
| Variable | β | SE | t | p |
|---|---|---|---|---|
| (Intercept) | 0.076 | 0.064 | 1.181 | 0.238 |
| Day 2 | 0.057 | 0.027 | 2.126 | 0.034 |
| Day 3 | 0.002 | 0.027 | 0.077 | 0.939 |
| distance | 0.007 | 0.005 | 1.567 | 0.117 |
| Day 2 × distance | –0.020 | 0.007 | –2.891 | 0.004* |
| Day 3 × distance | –0.003 | 0.007 | –0.413 | 0.679 |
Appendix 1—table 15
Linear mixed-effects model results in a model of global (across-track) distance, predicting neural pattern similarity for fractals in the hippocampus.
SE = standard error. To correct for multiple comparisons, we adjusted the α-value for 8 tests.
| Variable | β | SE | t | p |
|---|---|---|---|---|
| (Intercept) | 0.014 | 0.032 | 0.432 | 0.666 |
| Day 2 | –0.005 | 0.013 | –0.412 | 0.682 |
| Day 3 | –0.003 | 0.014 | –0.192 | 0.849 |
| distance (link distance 2 > link distance 1) | –0.002 | 0.002 | –0.944 | 0.345 |
| Day 2 × distance | 0.004 | 0.003 | 1.471 | 0.141 |
| Day 3 × distance | 0.003 | 0.003 | 1.081 | 0.280 |
Appendix 1—table 16
Linear mixed-effects model results in an omnibus model of local (within-track) distance, predicting neural pattern similarity for landmark buildings in EC.
SE = standard error. To correct for multiple comparisons, we adjusted the α-value for 5 tests. An asterisk (*) denotes findings that survived FDR correction.
| Variable | β | SE | t | p |
|---|---|---|---|---|
| (Intercept) | 0.053 | 0.021 | 2.521 | 0.012 |
| Day 2 | –0.057 | 0.023 | –2.503 | 0.012 |
| Day 3 | –0.040 | 0.024 | –1.662 | 0.097 |
| distance (link distance 2 > link distance 1) | 0.011 | 0.024 | 0.475 | 0.635 |
| hemisphere | –0.030 | 0.017 | –1.775 | 0.076 |
| Day 2 × distance | 0.006 | 0.033 | 0.191 | 0.849 |
| Day 3 × distance | 0.008 | 0.034 | 0.226 | 0.821 |
| Day 2 × hemisphere | 0.050 | 0.024 | 2.093 | 0.036 |
| Day 3 × hemisphere | 0.069 | 0.024 | 2.835 | 0.005* |
| distance × hemisphere | –0.034 | 0.033 | –1.031 | 0.303 |
| Day 2 × distance × hemisphere | 0.029 | 0.047 | 0.620 | 0.535 |
| Day 3 × distance × hemisphere | 0.026 | 0.048 | 0.545 | 0.586 |
Appendix 1—table 17
Linear mixed-effects model results in a model of local (within-track) distance, predicting neural pattern similarity for landmark buildings in left EC.
SE = standard error. To correct for multiple comparisons, we adjusted the α-value for 10 tests.
| Variable | β | SE | t | p |
|---|---|---|---|---|
| (Intercept) | 0.109 | 0.180 | 0.604 | 0.546 |
| Day 2 | –0.057 | 0.022 | –2.529 | 0.012 |
| Day 3 | –0.043 | 0.023 | –1.920 | 0.055 |
| distance (link distance 2 > link distance 1) | 0.011 | 0.021 | 0.508 | 0.611 |
| Day 2 × distance | 0.007 | 0.030 | 0.238 | 0.812 |
| Day 3 × distance | 0.007 | 0.031 | 0.232 | 0.816 |
Appendix 1—table 18
Linear mixed-effects model results in a model of local (within-track) distance, predicting neural pattern similarity for landmark buildings in right EC.
SE = standard error. To correct for multiple comparisons, we adjusted the α-value for 10 tests.
| Variable | β | SE | t | p |
|---|---|---|---|---|
| (Intercept) | –0.410 | 0.213 | –1.921 | 0.055 |
| Day 2 | –0.001 | 0.024 | –0.060 | 0.952 |
| Day 3 | 0.029 | 0.028 | 1.056 | 0.291 |
| distance (link distance 2 > link distance 1) | –0.025 | 0.025 | –0.977 | 0.329 |
| Day 2 × distance | 0.034 | 0.036 | 0.937 | 0.349 |
| Day 3 × distance | 0.038 | 0.037 | 1.043 | 0.297 |
Appendix 1—table 19
Linear mixed-effects model results in an omnibus model of global (across-track) distance, predicting neural pattern similarity for landmark buildings in EC.
SE = standard error. To correct for multiple comparisons, we adjusted the α-value for 5 tests.
| Variable | β | SE | t | p |
|---|---|---|---|---|
| (Intercept) | 0.062 | 0.026 | 2.393 | 0.017 |
| Day 2 | 0.003 | 0.036 | 0.091 | 0.928 |
| Day 3 | –0.036 | 0.035 | –1.042 | 0.297 |
| distance | 0.002 | 0.011 | 0.194 | 0.846 |
| hemisphere | –0.031 | 0.028 | –1.096 | 0.273 |
| Day 2 × distance | –0.024 | 0.015 | –1.555 | 0.120 |
| Day 3 × distance | 0.001 | 0.016 | 0.084 | 0.933 |
| Day 2 × hemisphere | 0.008 | 0.040 | 0.208 | 0.835 |
| Day 3 × hemisphere | 0.055 | 0.041 | 1.336 | 0.182 |
| distance × hemisphere | 0.001 | 0.015 | 0.069 | 0.945 |
| Day 2 × distance × hemisphere | 0.013 | 0.021 | 0.614 | 0.540 |
| Day 3 × distance × hemisphere | 0.003 | 0.022 | 0.139 | 0.889 |
Appendix 1—table 20
Linear mixed-effects model results in a model of global (across-track) distance, predicting neural pattern similarity for landmark buildings in EC.
SE = standard error. To correct for multiple comparisons, we adjusted the α-value for 8 tests.
| Variable | β | SE | t | p |
|---|---|---|---|---|
| (Intercept) | 0.139 | 0.102 | 1.361 | 0.174 |
| Day 2 | 0.034 | 0.042 | 0.812 | 0.417 |
| Day 3 | –0.014 | 0.041 | –0.328 | 0.743 |
| distance | 0.002 | 0.008 | 0.201 | 0.841 |
| Day 2 × distance | –0.017 | 0.011 | –1.607 | 0.108 |
| Day 3 × distance | 0.003 | 0.011 | 0.260 | 0.795 |
Appendix 1—table 21
Linear mixed-effects model results in a model of local (within-track) distance, predicting neural pattern similarity for fractals in left EC.
SE = standard error. To correct for multiple comparisons, we adjusted the α-value for 10 tests.
| Variable | β | SE | t | p |
|---|---|---|---|---|
| (Intercept) | 0.094 | 0.098 | 0.965 | 0.334 |
| Day 2 | –0.041 | 0.024 | –1.664 | 0.110 |
| Day 3 | –0.023 | 0.027 | –0.851 | 0.404 |
| distance | –0.015 | 0.012 | –1.266 | 0.205 |
| Day 2 × distance | –0.007 | 0.017 | –0.422 | 0.673 |
| Day 3 × distance | 0.016 | 0.017 | 0.946 | 0.344 |
Appendix 1—table 22
Linear mixed-effects model results in a model of local (within-track) distance, predicting neural pattern similarity for fractals in right EC.
SE = standard error. To correct for multiple comparisons, we adjusted the α-value for 10 tests.
| Variable | β | SE | t | p |
|---|---|---|---|---|
| (Intercept) | 0.116 | 0.114 | 1.021 | 0.307 |
| Day 2 | –0.016 | 0.018 | –0.919 | 0.368 |
| Day 3 | 0.020 | 0.022 | 0.906 | 0.374 |
| distance | –0.004 | 0.014 | –0.253 | 0.800 |
| Day 2 × distance | –0.015 | 0.020 | –0.769 | 0.442 |
| Day 3 × distance | 0.003 | 0.020 | 0.147 | 0.883 |
Appendix 1—table 23
Linear mixed-effects model results in a model of global (across-track) distance, predicting neural pattern similarity for fractals in EC.
SE = standard error. To correct for multiple comparisons, we adjusted the α-value for 8 tests.
| Variable | β | SE | t | p |
|---|---|---|---|---|
| (Intercept) | 0.121 | 0.053 | 2.293 | 0.022 |
| Day 2 | –0.034 | 0.024 | –1.415 | 0.165 |
| Day 3 | 0.007 | 0.026 | 0.284 | 0.778 |
| distance | –0.004 | 0.003 | –1.102 | 0.271 |
| Day 2 × distance | 0.008 | 0.005 | 1.655 | 0.098 |
| Day 3 × distance | 0.004 | 0.005 | 0.778 | 0.436 |
Appendix 1—table 24
Linear mixed-effects model results from a model predicting hippocampal pattern similarity Post Local Navigation (Day 2), with performance on subsequent Global Navigation trials (median path inefficiency for across-track trials in the first four test runs of Global Navigation on Day 2) and link distance as predictors.
SE = standard error. To correct for multiple comparisons, we adjusted the α-value for 3 tests. No results survived FDR correction.
| Variable | β | SE | t | p |
|---|---|---|---|---|
| (Intercept) | 0.038 | 0.030 | 1.264 | 0.208 |
| distance | 0.006 | 0.007 | 0.814 | 0.416 |
| path inefficiency | 0.001 | 0.001 | 1.174 | 0.241 |
| distance × path inefficiency | –0.000 | 0.000 | –1.983 | 0.048 |
Appendix 1—table 25
Linear mixed-effects model results from a model predicting hippocampal pattern similarity Pre-Learning (Day 1), with performance on subsequent Global Navigation trials (median path inefficiency for across-track trials in the first four test runs of Global Navigation on Day 2) and link distance as predictors.
SE = standard error. To correct for multiple comparisons, we adjusted the α-value for 3 tests.
| Variable | β | SE | t | p |
|---|---|---|---|---|
| (Intercept) | 0.073 | 0.026 | 2.786 | 0.006 |
| distance | –0.000 | 0.007 | –0.052 | 0.959 |
| path inefficiency | –0.001 | 0.001 | –1.825 | 0.070 |
| distance × path inefficiency | 0.000 | 0.000 | 1.523 | 0.128 |
Appendix 1—table 26
Linear mixed-effects model results from a model predicting hippocampal pattern similarity Post Global Navigation (Day 3), with performance on subsequent Global Navigation trials (median path inefficiency for across-track trials in the first four test runs of Global Navigation on Day 2) and link distance as predictors.
SE = standard error. To correct for multiple comparisons, we adjusted the α-value for 3 tests.
| Variable | β | SE | t | p |
|---|---|---|---|---|
| (Intercept) | 0.056 | 0.030 | 1.847 | 0.067 |
| distance | –0.003 | 0.007 | –0.347 | 0.729 |
| path inefficiency | –0.001 | 0.001 | –1.068 | 0.288 |
| distance × path inefficiency | 0.000 | 0.000 | 1.379 | 0.168 |
Appendix 1—table 27
Linear mixed-effects model results from a model predicting median path inefficiency across first four test runs of Global Navigation on Day 2, with hippocampal pattern similarity Post Local Navigation (Day 2) for landmark pairs and the length of the optimal path as predictors.
SE = standard error.
| Variable | β | SE | t | p |
|---|---|---|---|---|
| (Intercept) | 75.944 | 12.743 | 5.960 | 3.07e-8 |
| hippocampal pattern similarity (LMA, LMB) | –41.245 | 24.163 | –1.707 | 0.088 |
| length of optimal path | 20.551 | 6.245 | 3.291 | 0.001 |
| trial type (within-track > across-track) | –0.663 | 0.183 | –3.631 | 0.0003 |
| hippocampal pattern similarity × length of optimal path | 54.618 | 43.489 | 1.256 | 0.210 |
Appendix 1—table 28
Linear mixed-effects model results from a model predicting median path inefficiency across first four test runs of Global Navigation on Day 2, with hippocampal pattern similarity Post Local Navigation (Day 2) for fractal pairs and the length of the optimal path as predictors.
SE = standard error.
| Variable | β | SE | t | p |
|---|---|---|---|---|
| (Intercept) | 71.855 | 12.352 | 5.817 | 3.98e-8 |
| hippocampal pattern similarity (FRA, FRB) | 3.026 | 27.687 | 0.109 | 0.913 |
| length of optimal path | 27.289 | 6.196 | 4.404 | 1.23e-5 |
| trial type (within-track > across-track) | –0.646 | 0.184 | –3.519 | 0.0005 |
| hippocampal pattern similarity × length of optimal path | –68.107 | 48.915 | –1.392 | 0.164 |
Appendix 1—table 29
Linear mixed-effects model results for a context model predicting neural pattern similarity that included vmPFC and hippocampus.
SE = standard error. To correct for multiple comparisons, we adjusted the α-value for 6 tests. No results survived FDR correction.
| Variable | β | SE | t | p |
|---|---|---|---|---|
| (Intercept) | 0.054 | 0.018 | 3.017 | 0.003 |
| Day 2 | –0.005 | 0.010 | –0.528 | 0.603 |
| Day 3 | –0.002 | 0.009 | –0.239 | 0.813 |
| context (same track > different tracks) | 0.001 | 0.002 | 0.525 | 0.600 |
| region | –0.005 | 0.002 | –2.195 | 0.028 |
| Day 2 × context | –0.004 | 0.003 | –1.156 | 0.248 |
| Day 3 × context | –0.002 | 0.003 | –0.720 | 0.471 |
| Day 2 × region | 0.005 | 0.003 | 1.761 | 0.078 |
| Day 3 × region | –0.005 | 0.003 | –1.660 | 0.097 |
| context × region | 0.002 | 0.004 | 0.386 | 0.700 |
| Day 2 × context × region | –0.000 | 0.006 | –0.008 | 0.993 |
| Day 3 × context × region | 0.005 | 0.006 | 0.845 | 0.398 |
Appendix 1—table 30
Linear mixed-effects model results from a context model predicting neural pattern similarity that included the hippocampus, EC, vmPFC and a visual control region.
The visual control region served as a baseline. SE = standard error. To correct for multiple comparisons, we adjusted the α-value for 18 tests. An asterisk (*) denotes findings that survived FDR correction.
| Variable | β | SE | t | p |
|---|---|---|---|---|
| (Intercept) | 0.591 | 0.019 | 30.662 | <2e-16 |
| Day 2 | –0.042 | 0.014 | –3.053 | 0.005 |
| Day 3 | –0.039 | 0.016 | –2.400 | 0.024 |
| context (same track > different tracks) | 0.002 | 0.004 | 0.425 | 0.670 |
| region (hippocampus) | –0.499 | 0.003 | –176.735 | <2e-16* |
| region (EC) | –0.513 | 0.003 | –181.929 | <2e-16* |
| region (vmPFC) | –0.480 | 0.003 | –144.553 | <2e-16* |
| Day 2 × context | –0.003 | 0.006 | –0.460 | 0.645 |
| Day 3 × context | –0.004 | 0.006 | –0.587 | 0.557 |
| Day 2 × region (hippocampus) | 0.027 | 0.004 | 7.233 | 4.74e-13* |
| Day 3 × region (hippocampus) | 0.030 | 0.004 | 7.673 | 1.68e-14* |
| Day 2 × region (EC) | 0.012 | 0.004 | 3.024 | 0.002* |
| Day 3 × region (EC) | 0.039 | 0.004 | 9.957 | <2e-16* |
| Day 2 × region (vmPFC) | 0.031 | 0.004 | 7.029 | 2.09e-12* |
| Day 3 × region (vmPFC) | 0.012 | 0.004 | 2.633 | 0.008* |
| context × region (hippocampus) | –0.001 | 0.005 | –0.116 | 0.908 |
| context × region (EC) | 0.003 | 0.005 | 0.567 | 0.570 |
| context × region (vmPFC) | 0.001 | 0.006 | 0.156 | 0.876 |
| Day 2 × context × region (hippocampus) | –0.001 | 0.008 | –0.117 | 0.907 |
| Day 3 × context × region (hippocampus) | 0.001 | 0.008 | 0.182 | 0.855 |
| Day 2 × context × region (EC) | –0.010 | 0.008 | –1.349 | 0.177 |
| Day 3 × context × region (EC) | –0.006 | 0.008 | –0.780 | 0.435 |
| Day 2 × context × region (vmPFC) | –0.001 | 0.009 | –0.109 | 0.913 |
| Day 3 × context × region (vmPFC) | 0.006 | 0.009 | 0.725 | 0.468 |
Appendix 1—table 31
Linear mixed-effects model results for a context model predicting neural pattern similarity, fit to data in vmPFC.
SE = standard error. To correct for multiple comparisons, we adjusted the α-value for 16 tests.
| Variable | β | SE | t | p |
|---|---|---|---|---|
| (Intercept) | 0.049 | 0.036 | 1.366 | 0.172 |
| Day 2 | –0.004 | 0.015 | –0.244 | 0.809 |
| Day 3 | –0.015 | 0.015 | –0.981 | 0.340 |
| context (same track > different tracks) | 0.003 | 0.004 | 0.748 | 0.455 |
| Day 2 × context | –0.004 | 0.005 | –0.731 | 0.465 |
| Day 3 × context | 0.002 | 0.005 | 0.463 | 0.643 |
Appendix 1—table 32
Linear mixed-effects model results from a distance model predicting neural pattern similarity for landmark buildings that included the hippocampus and vmPFC.
SE = standard error. To correct for multiple comparisons, we adjusted the α-value for 6 tests.
| Variable | β | SE | t | p |
|---|---|---|---|---|
| (Intercept) | 0.036 | 0.037 | 0.982 | 0.326 |
| Day 2 | 0.002 | 0.014 | 0.138 | 0.890 |
| Day 3 | –0.003 | 0.012 | –0.205 | 0.837 |
| distance | 0.004 | 0.002 | 1.853 | 0.064 |
| region | –0.005 | 0.010 | –0.544 | 0.587 |
| Day 2 × distance | –0.003 | 0.003 | –1.025 | 0.306 |
| Day 3 × distance | –0.002 | 0.003 | –0.572 | 0.567 |
| Day 2 × region | 0.022 | 0.014 | 1.543 | 0.123 |
| Day 3 × region | –0.002 | 0.014 | –0.126 | 0.900 |
| distance × region | –0.002 | 0.004 | –0.525 | 0.600 |
| Day 2 × distance × region | –0.003 | 0.005 | –0.663 | 0.508 |
| Day 3 × distance × region | 0.001 | 0.005 | 0.156 | 0.876 |
Appendix 1—table 33
Linear mixed-effects model results from a distance model predicting neural pattern similarity for landmark buildings that included the hippocampus, vmPFC, and a visual control region.
The visual control region served as a baseline. SE = standard error. To correct for multiple comparisons, we adjusted the α-value for 12 tests. An asterisk (*) denotes findings that survived FDR correction.
| Variable | β | SE | t | p |
|---|---|---|---|---|
| (Intercept) | 0.537 | 0.037 | 14.413 | <2e-16 |
| Day 2 | –0.087 | 0.020 | –4.329 | 6.55e-5 |
| Day 3 | –0.059 | 0.022 | –2.712 | 0.009 |
| distance | –0.002 | 0.003 | –0.628 | 0.530 |
| region (hippocampus) | –0.506 | 0.011 | –46.889 | <2e-16* |
| region (vmPFC) | –0.483 | 0.013 | –38.294 | <2e-16* |
| Day 2 × distance | 0.008 | 0.005 | 1.655 | 0.098 |
| Day 3 × distance | –0.001 | 0.005 | –0.233 | 0.816 |
| Day 2 × region (hippocampus) | 0.077 | 0.015 | 5.102 | 3.38e-7* |
| Day 3 × region (hippocampus) | 0.047 | 0.015 | 3.079 | 0.002* |
| Day 2 × region (vmPFC) | 0.089 | 0.017 | 5.129 | 2.92e-7* |
| Day 3 × region (vmPFC) | 0.028 | 0.018 | 1.549 | 0.121 |
| distance × region (hippocampus) | 0.006 | 0.004 | 1.387 | 0.165 |
| distance × region (vmPFC) | 0.005 | 0.005 | 1.073 | 0.283 |
| Day 2 × distance × region (hippocampus) | –0.010 | 0.006 | –1.821 | 0.069 |
| Day 3 × distance × region (hippocampus) | –0.000 | 0.006 | –0.041 | 0.967 |
| Day 2 × distance × region (vmPFC) | –0.015 | 0.007 | –2.296 | 0.022* |
| Day 3 × distance × region (vmPFC) | –0.001 | 0.007 | –0.086 | 0.931 |
Appendix 1—table 34
Linear mixed-effects model results from a model of local (within-track) distance, predicting neural pattern similarity for landmark buildings in vmPFC.
SE = standard error. To correct for multiple comparisons, we adjusted the α-value for 10 tests.
| Variable | β | SE | t | p |
|---|---|---|---|---|
| (Intercept) | 0.144 | 0.167 | 0.866 | 0.387 |
| Day 2 | –0.005 | 0.027 | –0.174 | 0.862 |
| Day 3 | –0.024 | 0.027 | –0.867 | 0.386 |
| distance (link distance 2 > link distance 1) | –0.005 | 0.020 | –0.234 | 0.815 |
| Day 2 × distance | 0.025 | 0.028 | 0.910 | 0.363 |
| Day 3 × distance | 0.021 | 0.029 | 0.745 | 0.456 |
Appendix 1—table 35
Linear mixed-effects model results from the model of global (across-track) distance, predicting neural pattern similarity for landmark buildings in vmPFC.
SE = standard error. To correct for multiple comparisons, we adjusted the α-value for 8 tests.
| Variable | β | SE | t | p |
|---|---|---|---|---|
| (Intercept) | 0.055 | 0.119 | 0.462 | 0.644 |
| Day 2 | 0.043 | 0.044 | 0.993 | 0.321 |
| Day 3 | –0.001 | 0.046 | –0.012 | 0.990 |
| distance | 0.008 | 0.009 | 0.955 | 0.340 |
| Day 2 × distance | –0.013 | 0.013 | –1.071 | 0.284 |
| Day 3 × distance | –0.004 | 0.013 | –0.320 | 0.749 |
Appendix 1—table 36
Linear mixed-effects model results from the model of local (within-track) distance, predicting neural pattern similarity for fractals in vmPFC.
SE = standard error. To correct for multiple comparisons, we adjusted the α-value for 10 tests.
| Variable | β | SE | t | p |
|---|---|---|---|---|
| (Intercept) | –0.009 | 0.085 | –0.107 | 0.914 |
| Day 2 | 0.004 | 0.021 | 0.172 | 0.864 |
| Day 3 | –0.002 | 0.022 | –0.094 | 0.926 |
| distance | 0.009 | 0.010 | 0.865 | 0.387 |
| Day 2 × distance | –0.005 | 0.015 | –0.347 | 0.729 |
| Day 3 × distance | –0.021 | 0.015 | –1.403 | 0.161 |
Appendix 1—table 37
Linear mixed-effects model results from the model of global (across-track) distance, predicting neural pattern similarity for fractals in vmPFC.
SE = standard error. To correct for multiple comparisons, we adjusted the α-value for 8 tests.
| Variable | β | SE | t | p |
|---|---|---|---|---|
| (Intercept) | –0.055 | 0.058 | –0.958 | 0.338 |
| Day 2 | 0.001 | 0.023 | 0.022 | 0.982 |
| Day 3 | –0.046 | 0.024 | –1.974 | 0.053 |
| distance | 0.002 | 0.004 | 0.432 | 0.666 |
| Day 2 × distance | –0.001 | 0.006 | –0.136 | 0.892 |
| Day 3 × distance | 0.009 | 0.006 | 1.632 | 0.103 |
Appendix 1—table 38
Linear mixed-effects model results from a model predicting neural pattern similarity between pairs of items in vmPFC, with scan session, hippocampal pattern similarity, and pattern similarity in a visual control region (calcarine) as predictors.
SE = standard error. To correct for multiple comparisons, we adjusted the α-value for 2 tests. An asterisk (*) denotes findings that survived FDR correction.
| Variable | β | SE | t | p |
|---|---|---|---|---|
| (Intercept) | –0.007 | 0.022 | –0.331 | 0.743 |
| Day 2 | –0.006 | 0.019 | –0.298 | 0.768 |
| Day 3 | 0.004 | 0.020 | 0.199 | 0.844 |
| hippocampal pattern similarity (ItemA, ItemB) | 0.414 | 0.029 | 14.387 | 1.25e-14 |
| calcarine pattern similarity (ItemA, ItemB) | 0.108 | 0.020 | 5.465 | 4.83e-6 |
| Day 2 × hippocampal pattern similarity (ItemA, ItemB) | –0.094 | 0.016 | –5.713 | 1.11e-8 |
| Day 3 × hippocampal pattern similarity (ItemA, ItemB) | –0.076 | 0.017 | –4.355 | 1.34e-5 |
| Day 2 × calcarine pattern similarity (ItemA, ItemB) | 0.019 | 0.013 | 1.427 | 0.154 |
| Day 3 × calcarine pattern similarity (ItemA, ItemB) | –0.020 | 0.014 | –1.433 | 0.152 |
Appendix 1—table 39
Linear mixed-effects model results from a context model predicting neural pattern similarity, fit to data from a visual control region.
SE = standard error. To correct for multiple comparisons, we adjusted the α-value for 16 tests.
| Variable | β | SE | t | p |
|---|---|---|---|---|
| (Intercept) | 0.554 | 0.043 | 13.030 | <2e-16 |
| Day 2 | –0.021 | 0.025 | –0.820 | 0.412 |
| Day 3 | –0.039 | 0.041 | –0.944 | 0.345 |
| stimulus type (landmark > fractal) | –0.024 | 0.003 | –7.009 | 2.45e-12 |
| context (same track > different tracks) | 0.001 | 0.003 | 0.245 | 0.806 |
| Day 2 × stimulus type | 0.005 | 0.005 | 1.088 | 0.277 |
| Day 3 × stimulus type | –0.002 | 0.005 | –0.407 | 0.684 |
| Day 2 × context | –0.003 | 0.005 | –0.717 | 0.474 |
| Day 3 × context | –0.002 | 0.005 | –0.416 | 0.678 |
| stimulus type × context | –0.008 | 0.007 | –1.252 | 0.211 |
| Day 2 × stimulus type × context | –0.004 | 0.009 | –0.377 | 0.706 |
| Day 3 × stimulus type × context | 0.014 | 0.010 | 1.509 | 0.131 |
Appendix 1—table 40
Linear mixed-effects model results from a model of local (within-track) distance predicting neural pattern similarity, fit to data from a visual control region.
SE = standard error. To correct for multiple comparisons, we adjusted the α-value for 10 tests.
| Variable | β | SE | t | p |
|---|---|---|---|---|
| (Intercept) | 0.317 | 0.135 | 2.343 | 0.019 |
| Day 2 | –0.040 | 0.030 | –1.351 | 0.177 |
| Day 3 | –0.025 | 0.044 | –0.577 | 0.564 |
| distance (link distance 2 > link distance 1) | 0.014 | 0.016 | 0.870 | 0.384 |
| Day 2 × distance | 0.007 | 0.022 | 0.304 | 0.761 |
| Day 3 × distance | –0.035 | 0.022 | –1.570 | 0.117 |
Appendix 1—table 41
Linear mixed-effects model results from a model of global (across-track) distance predicting neural pattern similarity, fit to data from a visual control region.
SE = standard error. To correct for multiple comparisons, we adjusted the α-value for 8 tests.
| Variable | β | SE | t | p |
|---|---|---|---|---|
| (Intercept) | 0.418 | 0.095 | 4.379 | 1.31e-5 |
| Day 2 | –0.003 | 0.040 | –0.082 | 0.935 |
| Day 3 | –0.061 | 0.051 | –1.190 | 0.234 |
| distance | –0.005 | 0.007 | –0.783 | 0.434 |
| Day 2 × distance | –0.003 | 0.010 | –0.261 | 0.794 |
| Day 3 × distance | 0.007 | 0.010 | 0.727 | 0.468 |
Additional files
Download links
A two-part list of links to download the article, or parts of the article, in various formats.
Downloads (link to download the article as PDF)
Open citations (links to open the citations from this article in various online reference manager services)
Cite this article (links to download the citations from this article in formats compatible with various reference manager tools)
Representational integration and differentiation in the human hippocampus following goal-directed navigation
eLife 12:e80281.
https://doi.org/10.7554/eLife.80281


