Weakening of the cognition and height association from 1957 to 2018: Findings from four British birth cohort studies
- Centre for Longitudinal Studies, Social Research Institute, University College London, United Kingdom
- MRC IEU, University of Bristol, United Kingdom
- K.G. Jebsen Center for Genetic Epidemiology, Department of Public Health and Nursing, NTNU, Norwegian University of Science and Technology, Norway
Figures
Figure 1

Illustrative causal diagrams of two alternative processes which may either (or both in some combination) generate associations between child cognition and height: (right) shared genetic and environmental factors and (left) assortative mating of parental cognition and height (within and across each trait).
Figure 2 with 2 supplements
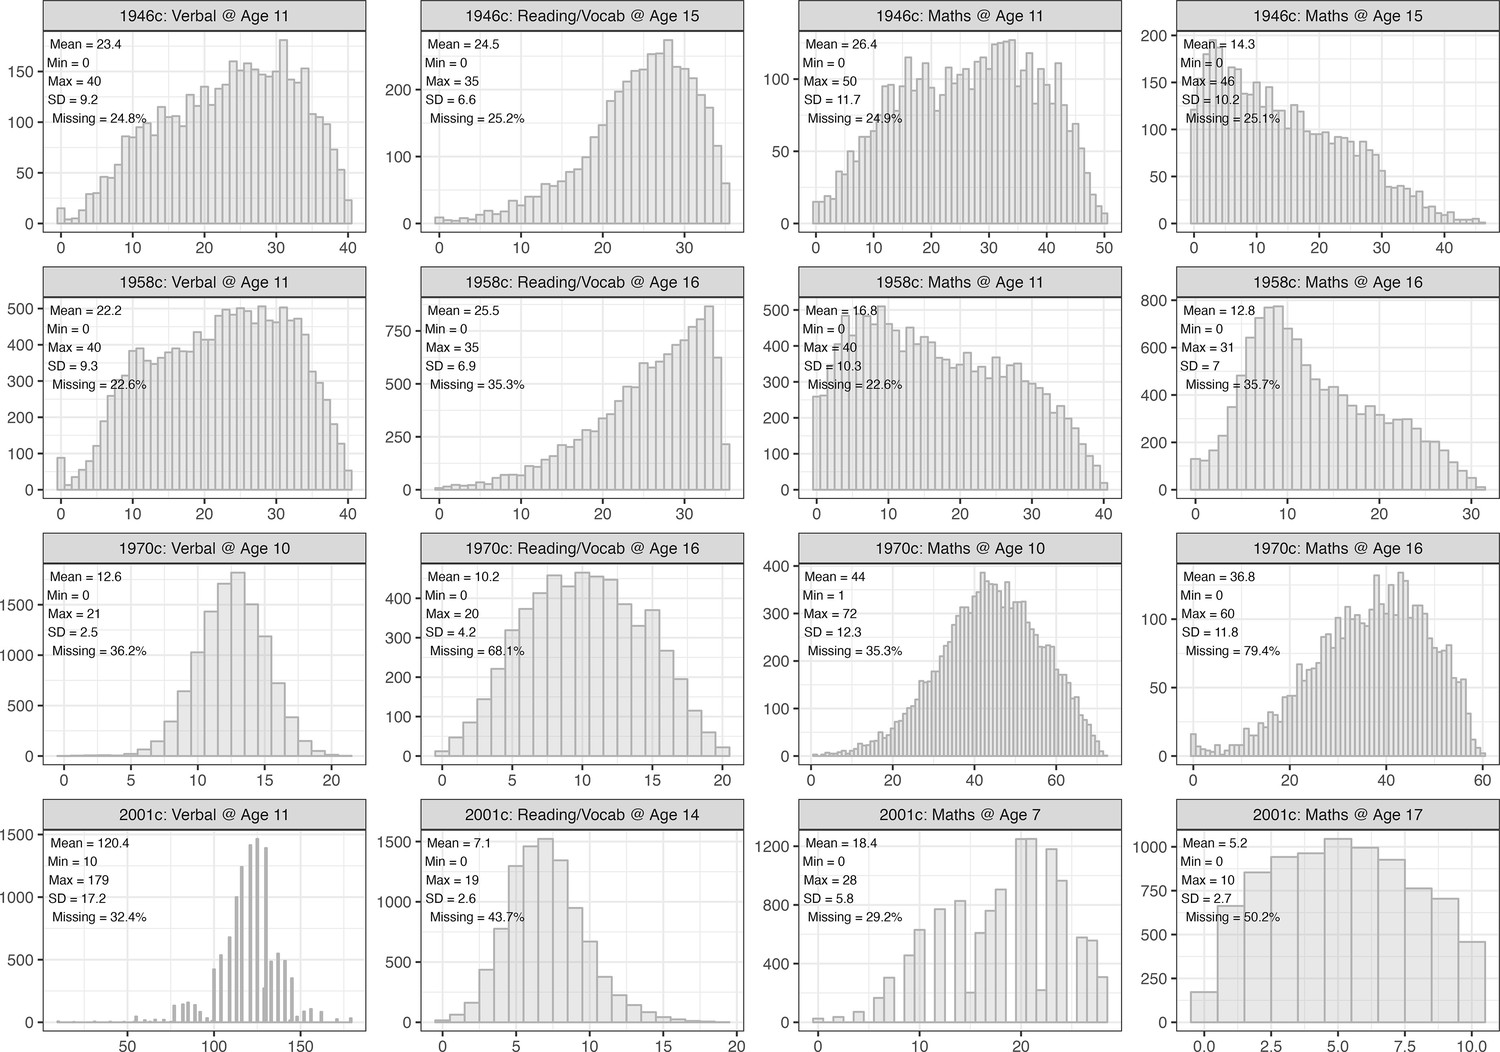
Distribution of cognition scores, by cohort and test.
Observed data.
Figure 2—figure supplement 1
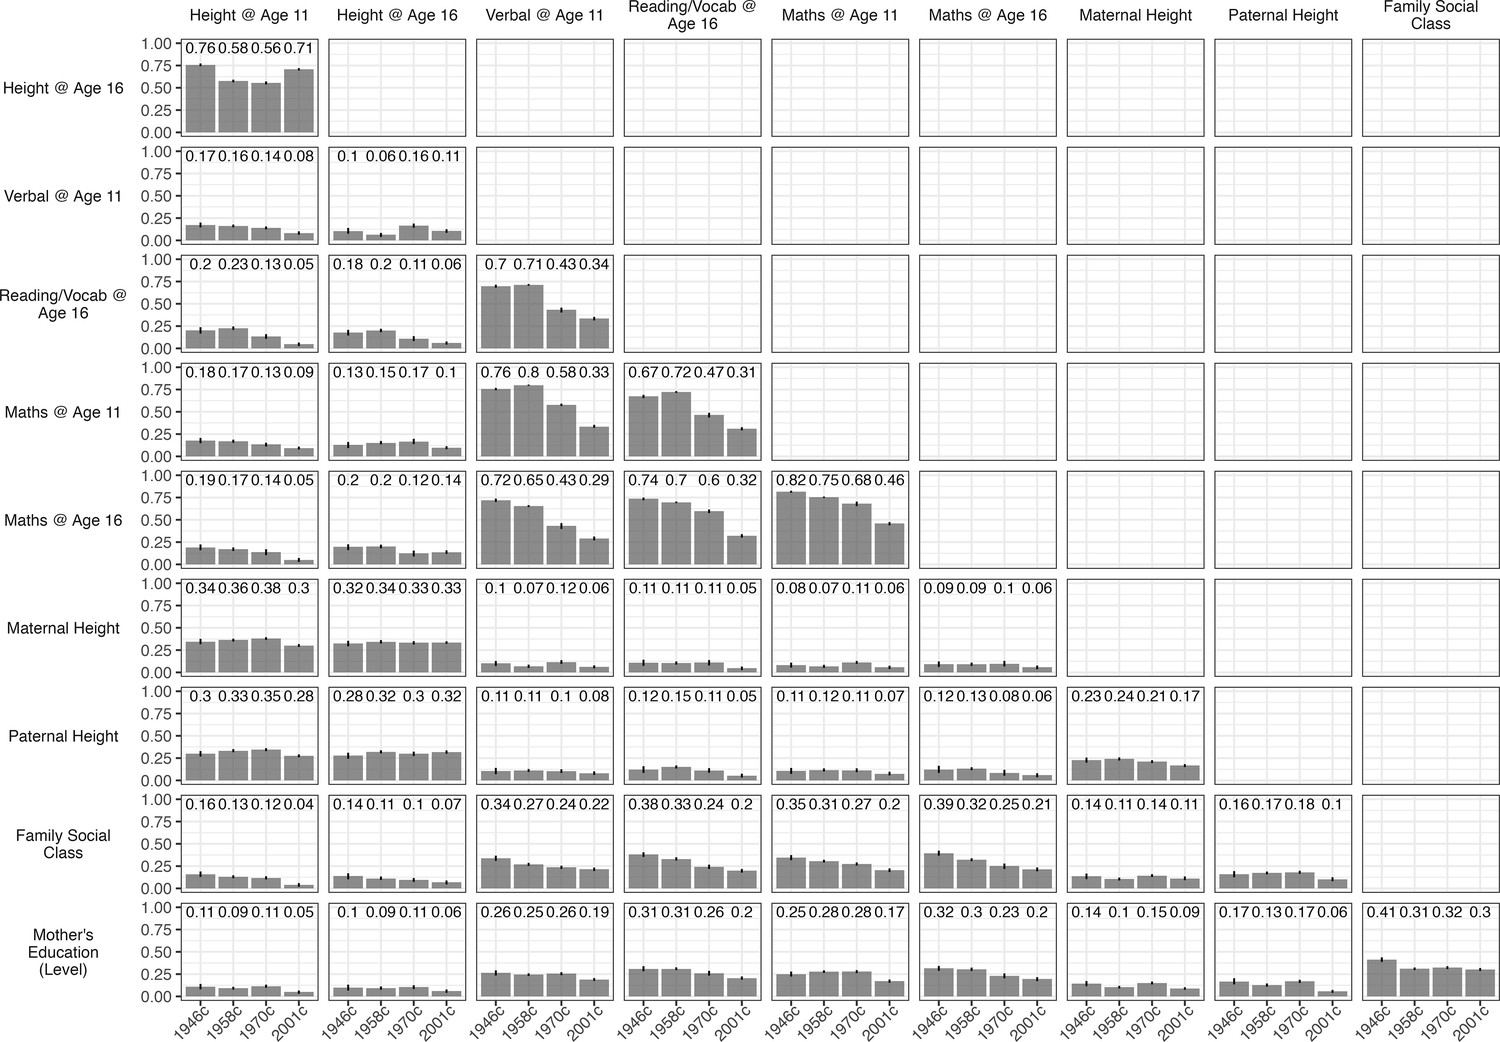
Spearman correlation between study variables by cohort.
95% CI intervals were calculated using bootstrapping (200 bootstrap samples). Pairwise complete cases. Note, for correlations between cognition scores and height at the same stated age in the 2001 c, contemporaneous height was used (e.g. as maths was available for 7y only in 2001 c, height at 7y was used in analyses for this correlation).
Figure 2—figure supplement 2
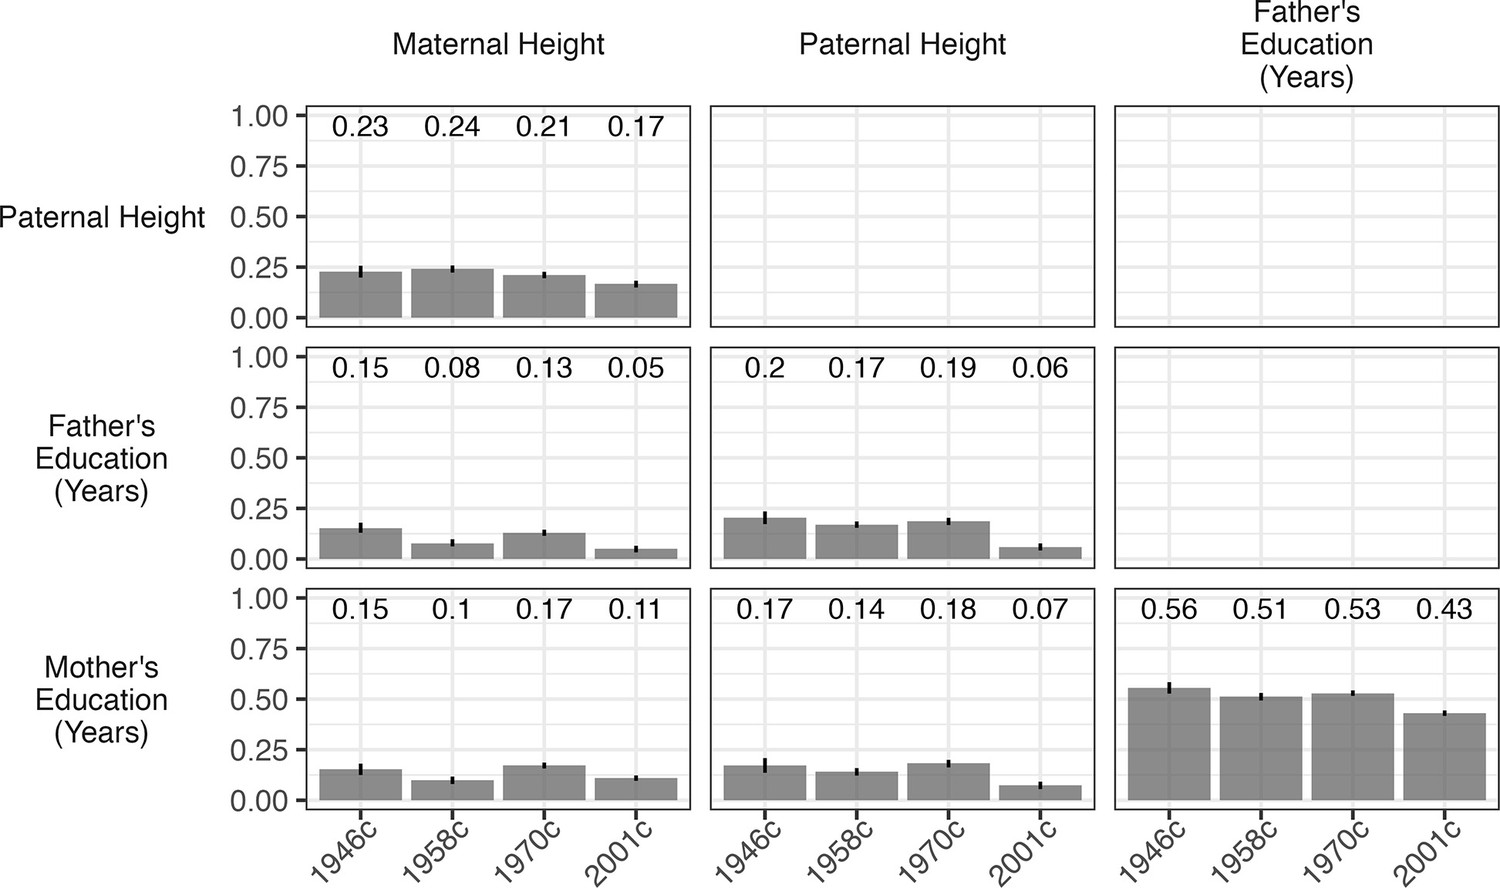
Spearman correlation between paternal and maternal height and education (years) by cohort.
95% CI intervals were calculated using bootstrapping (200 bootstrap samples).
Figure 3 with 4 supplements

Association between height and cognition in four birth cohort studies.
Cognition scores are the independent variables and height (age-adjusted z-scores) are the dependent variables; estimates are from separate linear regression models (95% CIs): each estimate shows the mean difference in height (z-score) comparing the highest with lowest cognition test score. Models were sequentially adjusted for sex (left panel); sex, mother’s education, and father’s social class (middle panel), and additionally for maternal and paternal height (right panel).
Figure 3—figure supplement 1
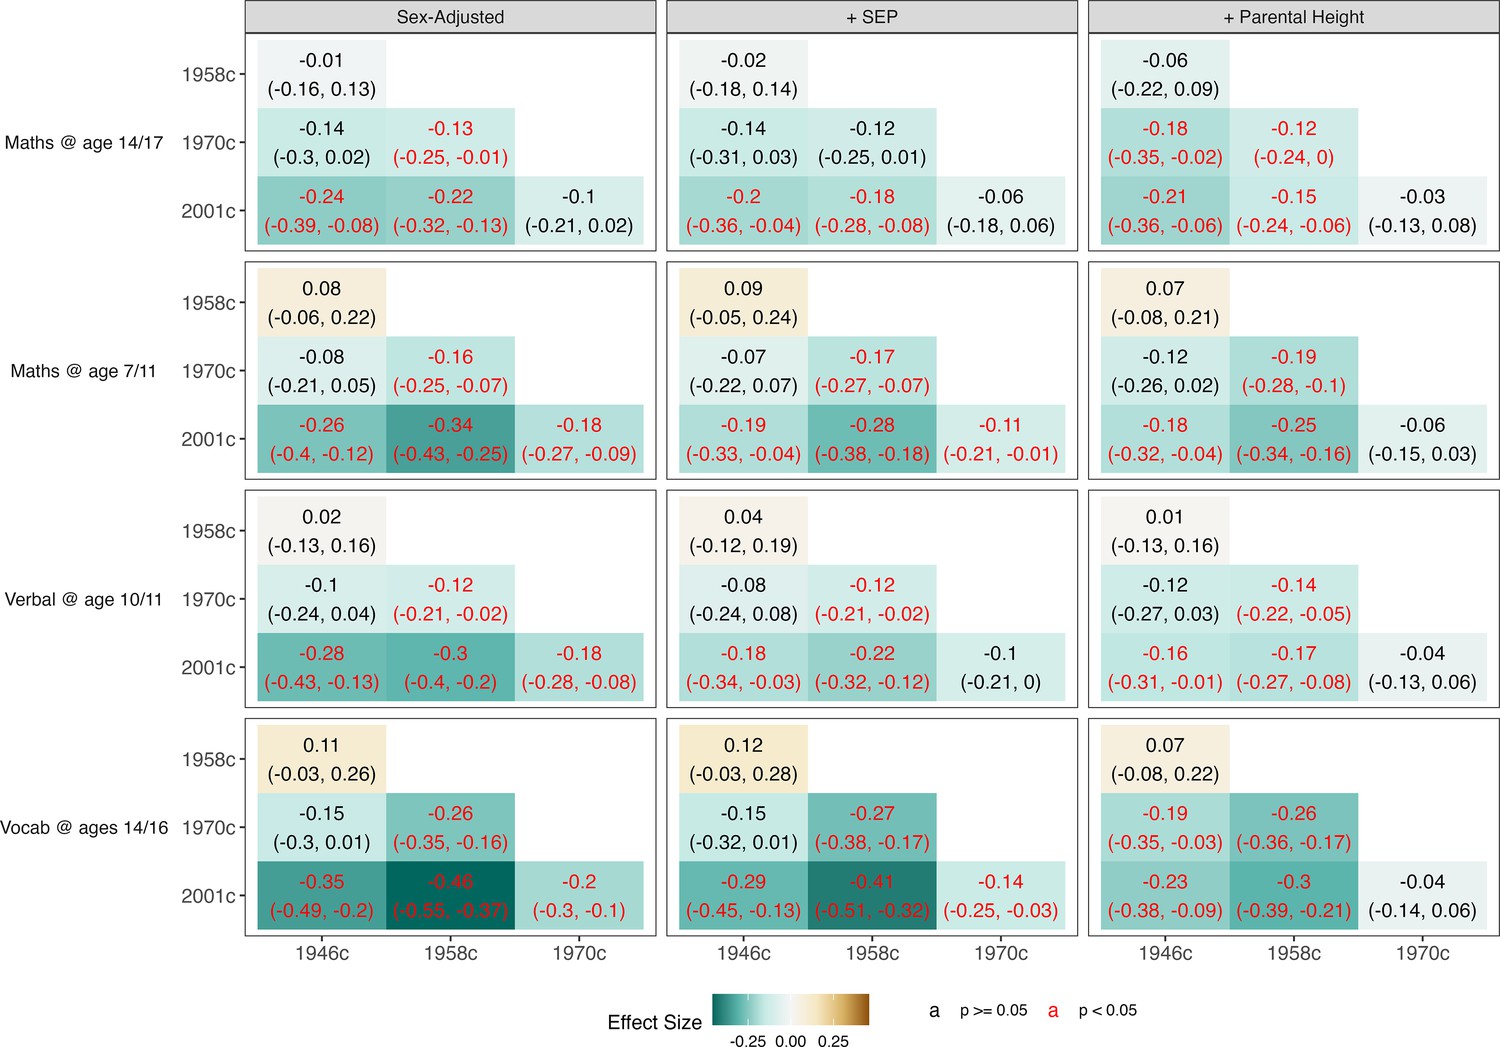
Difference in the association (+95% CI) between height and cognition by cohort and test.
Derived from pooled OLS models (32 imputed datasets), with the interaction between cohort and cognition and cohort and other covariates. Covariates included in each model were: sex (left panel); sex, mother’s education and father’s social class (middle panel); and sex, mother’s education, father’s social class, and paternal and maternal height (right panel). Height harmonized across cohorts using growth charts from a 1990 UK growth study. Cognition scores harmonized using ridit scoring (range 0–1). Text refers to the difference in the association between the cohort in the rows and the cohort in the columns (a negative number indicates the association between cognition and height was smaller in the row cohort than the column cohort).
Figure 3—figure supplement 2
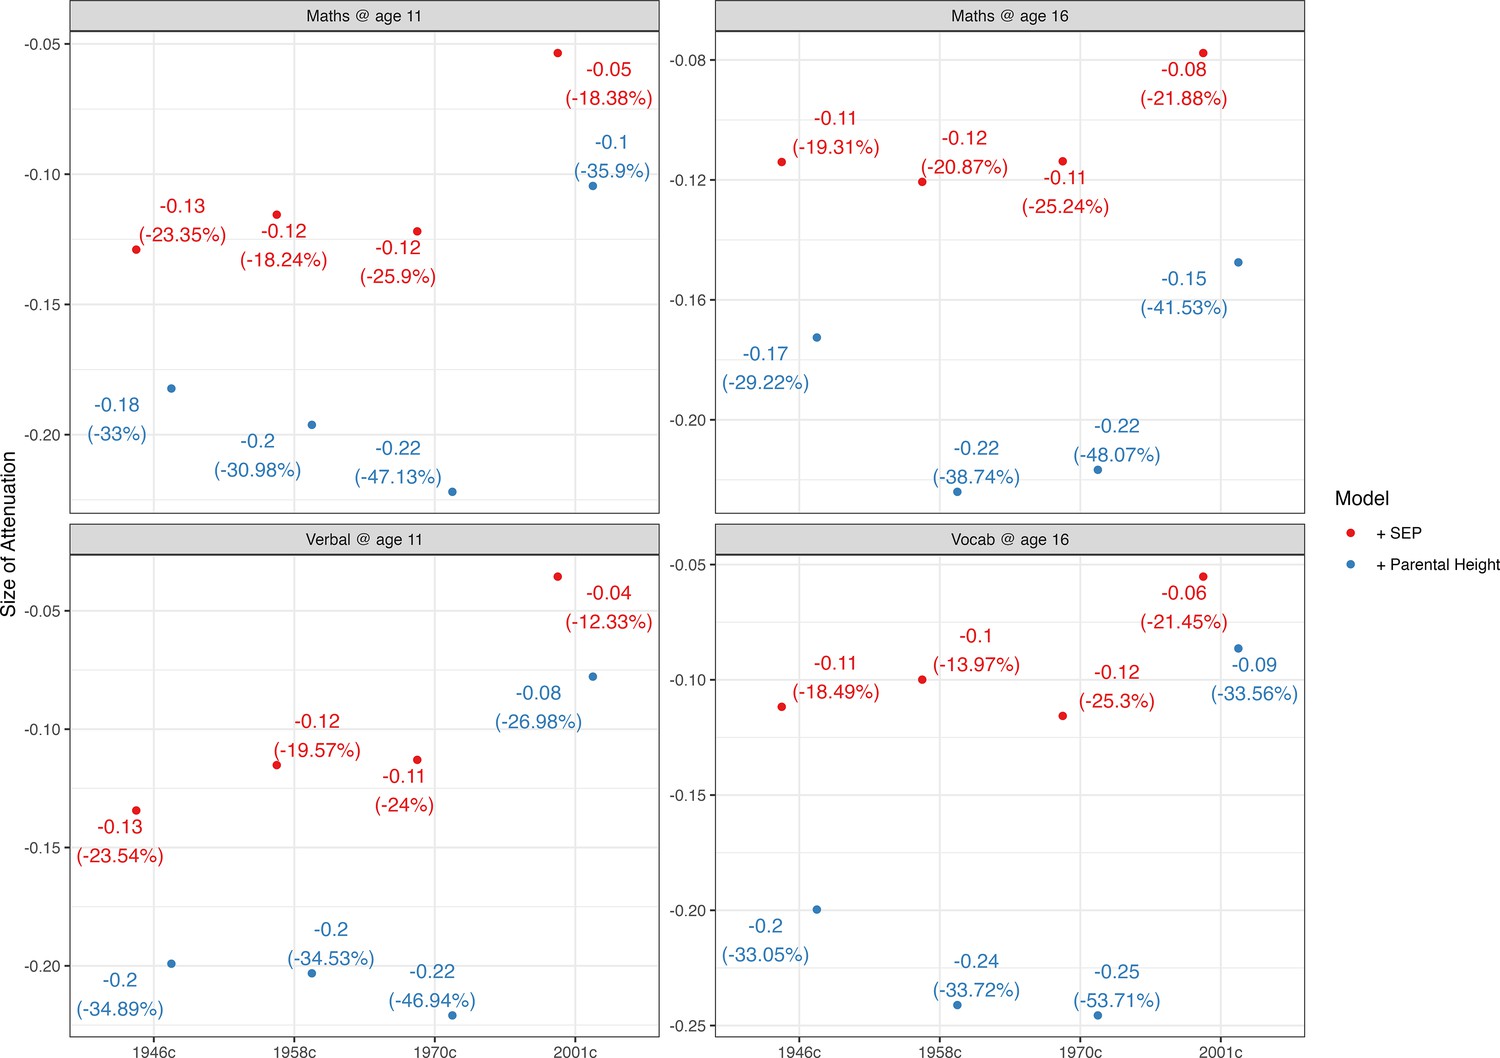
Attenuation (absolute and proportional) in the association (+95% CI) between height and cognition by cohort, test, and covariates added to models.
Derived from pooled OLS models (32 imputed datasets) comparing results when adjusting for sex and when further adjusting for: mother’s education and father’s social class (red points) mother’s education, father’s social class and paternal and maternal height (blue points). Height harmonized across cohorts using growth charts from a 1990 UK growth study. Cognition scores harmonized using ridit scoring (range 0–1).
Figure 3—figure supplement 3
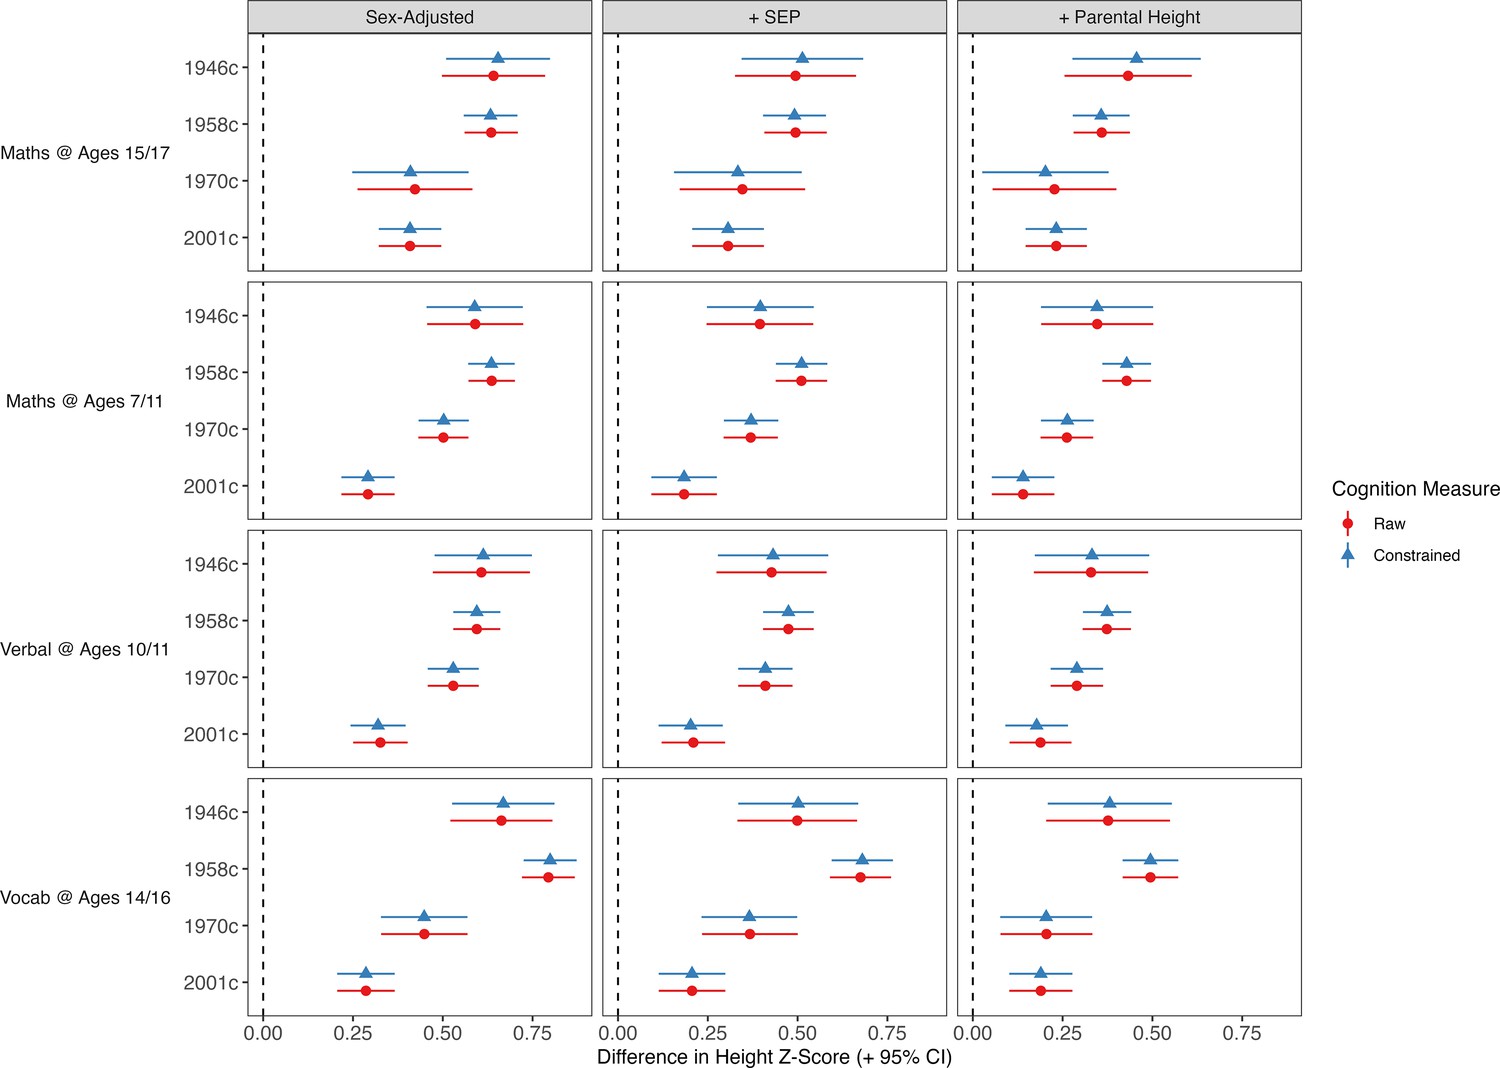
Association between height and cognition by cohort and test and method used to score cognition measures.
Derived from OLS models using complete case data and adjusting for: sex (left panel); sex, mother’s education and father’s social class (middle panel), and sex, mother’s education, father’s social class, and paternal and maternal height (right panel). Height harmonized across cohorts using growth charts from a 1990 UK growth study. Cognition scores harmonized using ridit scoring (range 0–1) and inputted using observed range (red points) or constrained for each test to have the same range of integers in each cohort (blue triangles).
Figure 3—figure supplement 4
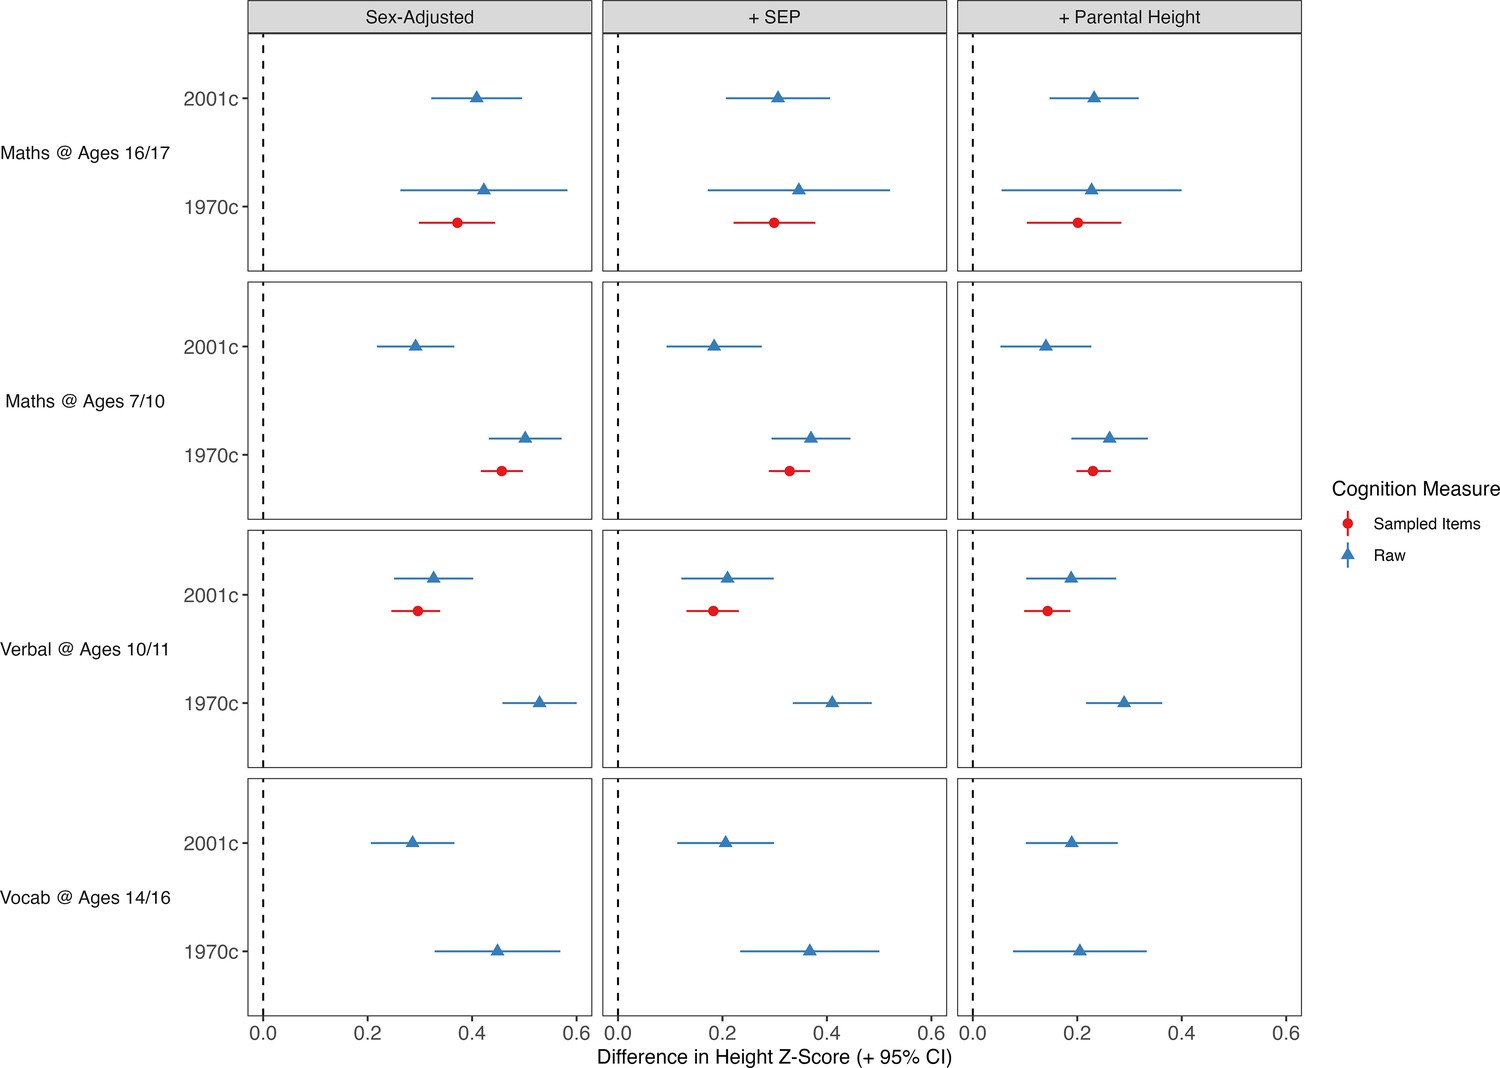
Association between height and cognition by cohort and test and method used to score cognition measures.
Derived from OLS models using complete case data and adjusting for: sex (left panel); sex, mother’s education and father’s social class (middle panel), and sex, mother’s education, father’s social class, and paternal and maternal height (right panel). Height harmonized across cohorts using growth charts from a 1990 UK growth study. Cognition scores harmonized using ridit scoring (range 0–1) and inputted using all items (blue triangles) or repeated samples of items such that each test used the same number of items in each cohort (red points); the latter was conducted using a random sample of 500 items (upper and lower error bars represent estimates from 2.5th and 97.5th draws; midpoint [triangle] is the estimate at the 50th percentile).
Figure 4

Association between height and cognition in four birth cohort studies.
Cognition scores are the independent variables and height (age-adjusted z-scores) are the dependent variables; estimates are from separate quantile regression models (95% CIs): each estimate shows the difference in height (z-score) comparing the highest with lowest cognition test score, repeated for each decile of height (x-axis), cohort (panel columns) and measure of cognition (panel rows). Quantile regression results are interpreted similarly to those from linear regression. For example, the 50th centile shows the estimated difference in height at the median (linear regression would show the mean difference). Results were drawn from pooled quantile regression models (32 imputed datasets) with adjustment for sex. Shaded areas are 95% CIs (200 bootstraps per imputed dataset; centile method) for the specific cohort and cognition measure examined. Dashed lines show estimates for other cohorts to aid cross-cohort comparisons.
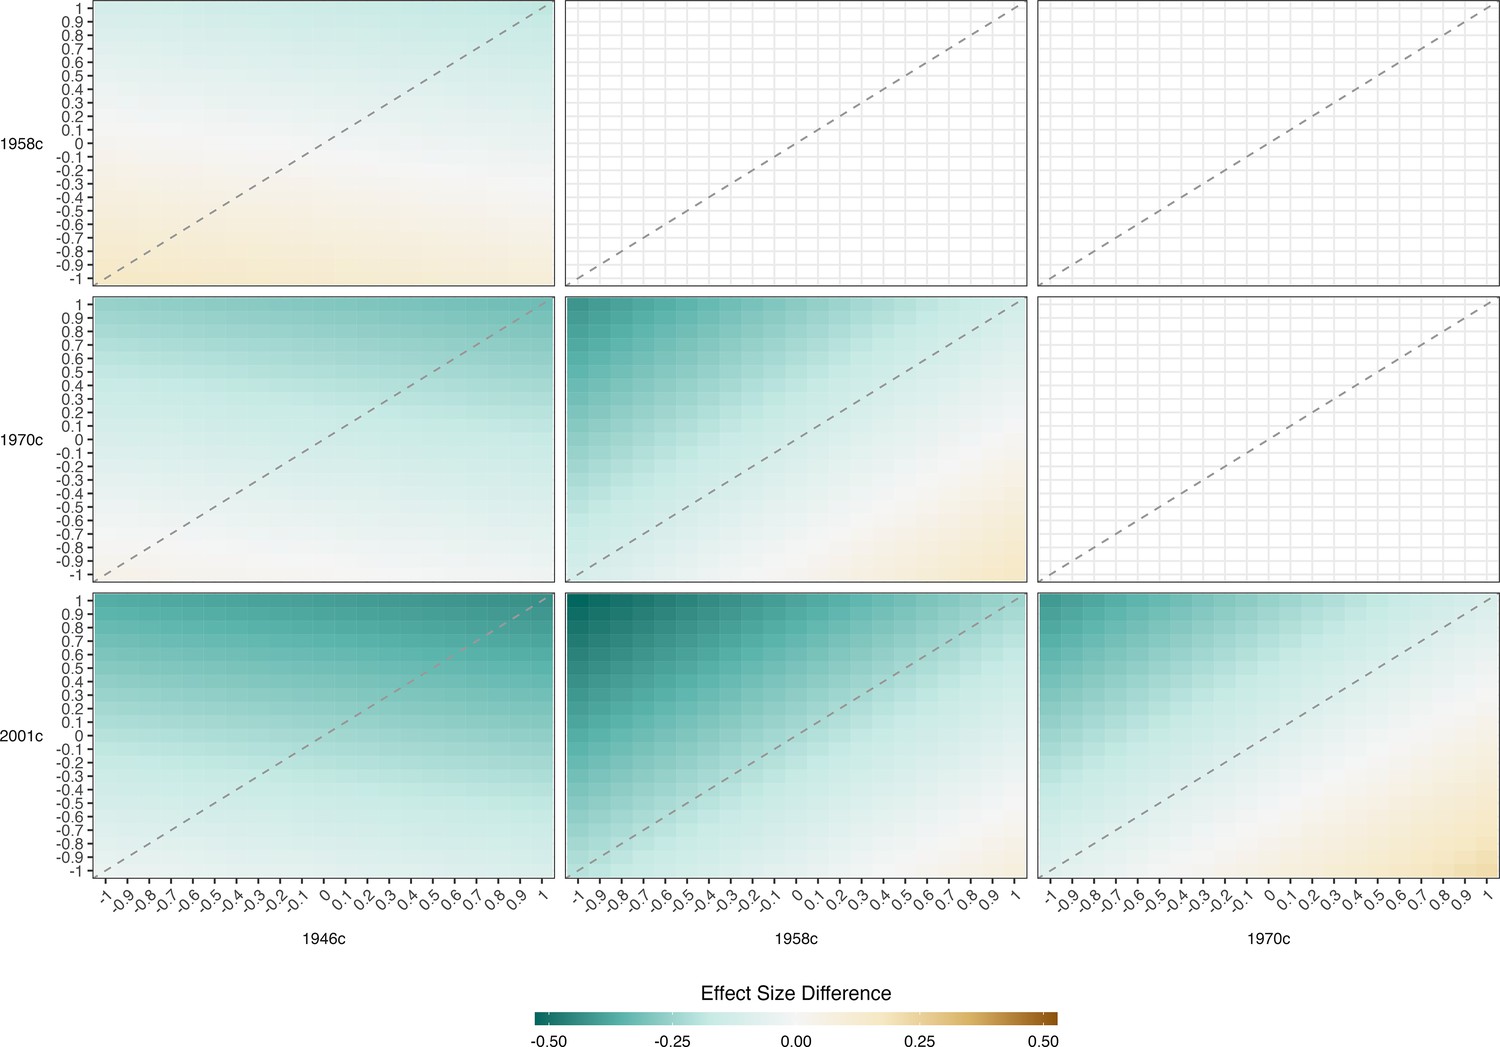
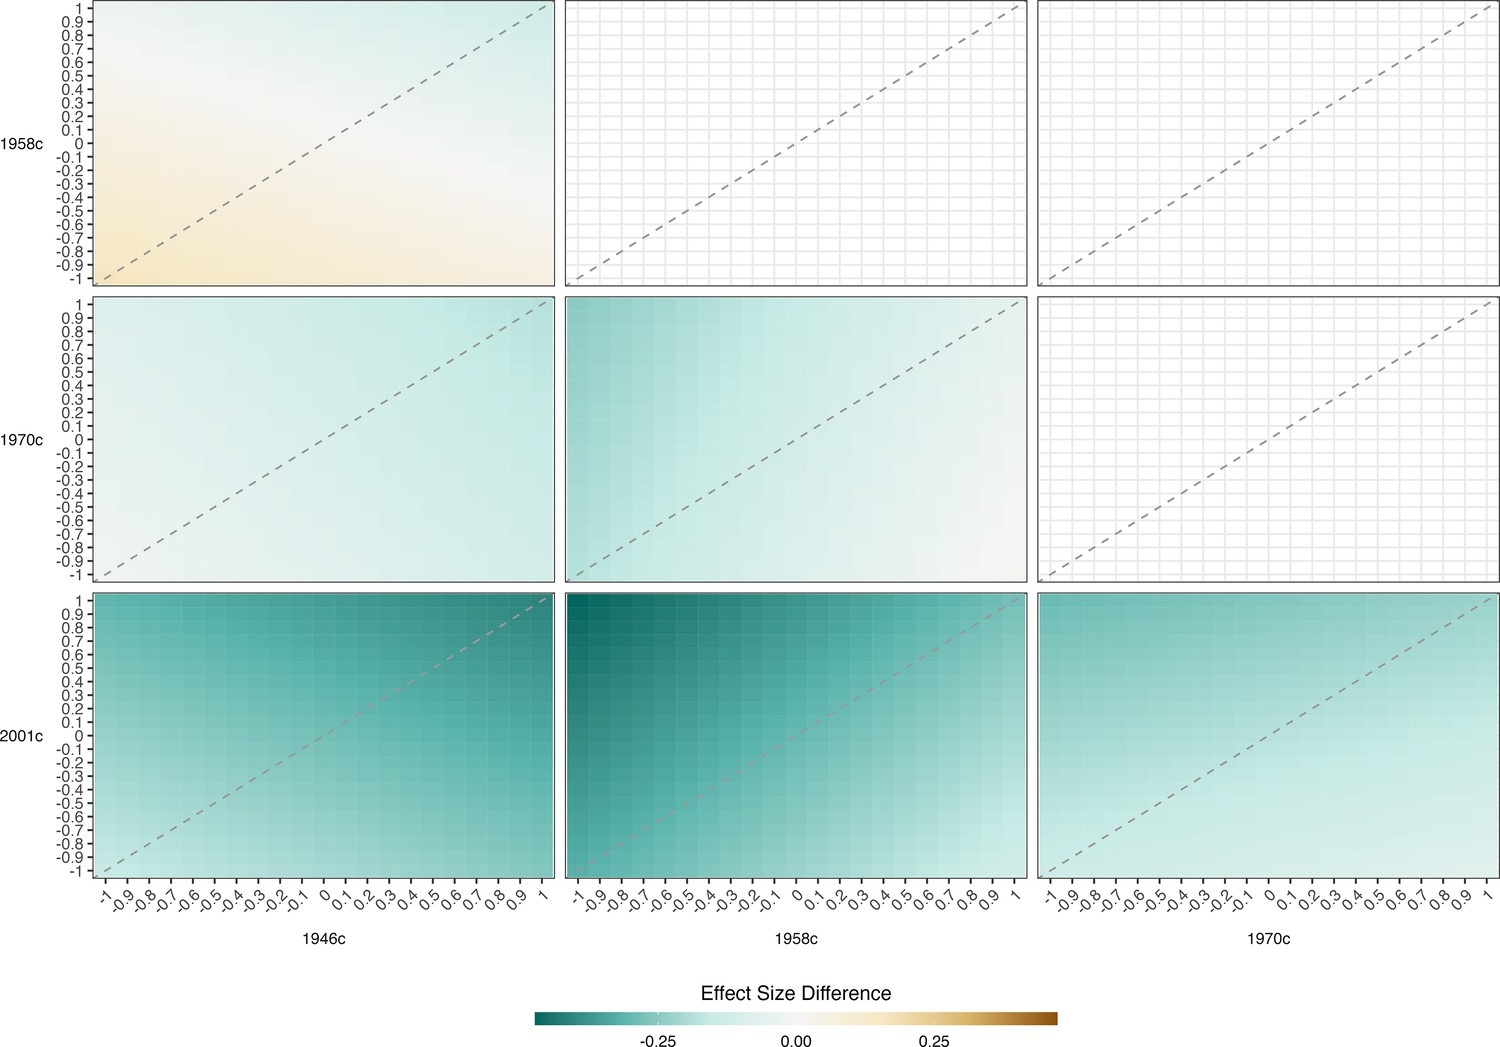
Figure 5 with 3 supplements

Result of pattern mixture models.
Difference in the association between height and maths @ age 11 across the cohort. Derived from pooled OLS models (32 imputed datasets) including adjustment for sex. OLS models repeated with imputed height values adjusted by a constant factor given in columns and rows. The color of each square indicates the difference in the association between height and cognition between two cohorts with the coefficient for the cohort on the horizontal subtracted from that on the horizontal (with given adjustment factors used). Height harmonized across cohorts using growth charts from a 1990 UK growth study. Cognition scores harmonized using ridit scoring (range 0–1).
Figure 5—figure supplement 1
Result of pattern mixture models.
Difference in the association between height and maths @ age 16 across the cohort. Derived from pooled OLS models (32 imputed datasets) including adjustment for sex. OLS models repeated with imputed height values adjusted by a constant factor given in columns and rows. The color of each square indicates the difference in the association between height and cognition between two cohorts with the coefficient for the cohort on the horizontal subtracted from that on the horizontal (with given adjustment factors used). For instance, in the bottom left panel, the coordinate 1,–1 refers to the difference in coefficients where + 1 SD was added to imputed height values in 1946 c and –1 SD was added to imputed height values in 2001 c. Height harmonized across cohorts using growth charts from a 1990 UK growth study. Cognition scores harmonized using ridit scoring (range 0–1).
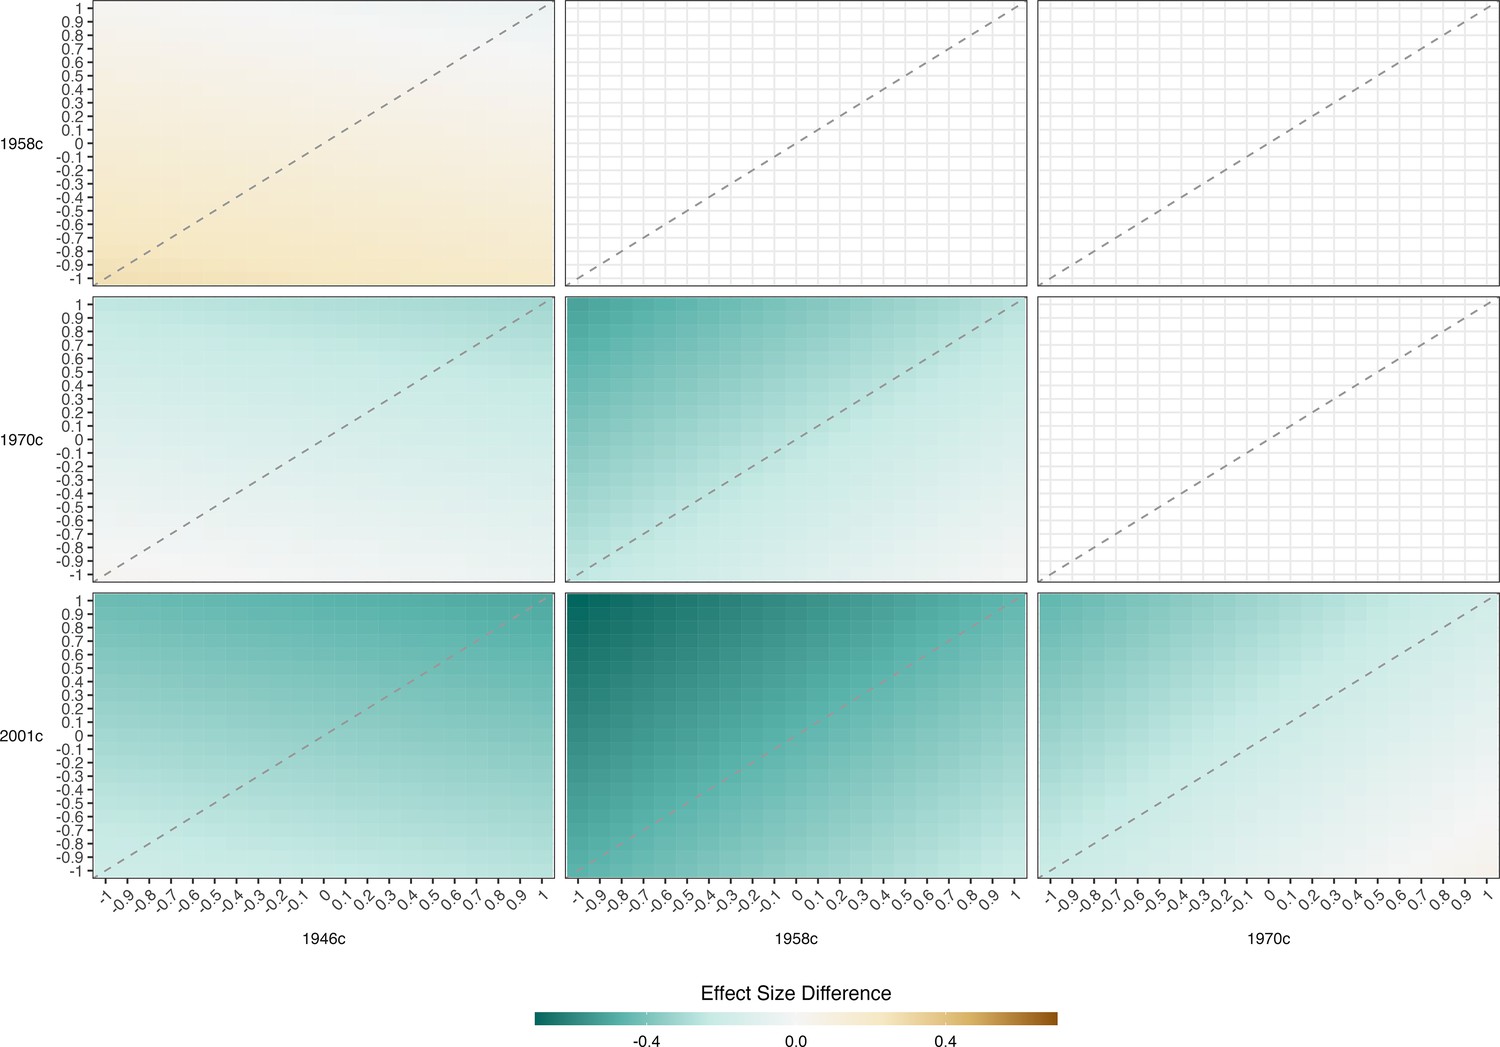
Figure 5—figure supplement 2
Result of pattern mixture models.
Difference in the association between height and verbal similarity @ age 11 across the cohort. Derived from pooled OLS models (32 imputed datasets) including adjustment for sex. OLS models repeated with imputed height values adjusted by a constant factor given in columns and rows. The color of each square indicates the difference in the association between height and cognition between two cohorts with the coefficient for the cohort on the horizontal subtracted from that on the horizontal (with given adjustment factors used). For instance, in the bottom left panel, the coordinate 1,–1 refers to the difference in cofficients where + 1 SD was added to imputed height values in 1946 c and –1 SD was added to imputed height values in 2001 c. Height harmonized across cohorts using growth charts from a 1990 UK growth study. Cognition scores harmonized using ridit scoring (range 0–1).
Figure 5—figure supplement 3
Result of pattern mixture models.
Difference in the association between height and vocabulary/comprehension @ age 16 across the cohort. Derived from pooled OLS models (32 imputed datasets) including adjustment for sex. OLS models repeated with imputed height values adjusted by a constant factor given in columns and rows. The color of each square indicates the difference in the association between height and cognition between two cohorts with the coefficient for the cohort on the horizontal subtracted from that on the horizontal (with given adjustment factors used). For instance, in the bottom left panel, the coordinate 1,–1 refers to the difference in cofficients where + 1 SD was added to imputed height values in 1946 c and –1 SD was added to imputed height values in 2001 c. Height harmonized across cohorts using growth charts from the 1990 UK growth study. Cognition scores harmonized using ridit scoring (range 0–1).
Tables
Table 1
Participant characteristics: Data from four British cohort studies.
| Cohort study, birth year | ||||
|---|---|---|---|---|
| 1946 c | 1958 c | 1970 c | 2001 c | |
| Cohort characteristics and outcomes | ||||
| Sample size | 5,348 | 17,490 | 17,617 | 17,057 |
| Males (%) | 52.6% | 51.7% | 51.9% | 51.4% |
| Height at 11 years, mean (SD) z-score | –0.41 (1.03) | –0.25 (1.03) | –0.18 (1.01) | 0.29 (1.00) |
| Height at 16 years, mean (SD) z-score | –0.54 (1.03) | –0.35 (1.02) | –0.14 (1.16) | 0.27 (0.98) |
| Confounding variables | ||||
| Social class | ||||
| I Professional | 3.0% | 5.4% | 6.1% | 5.0% |
| II Managerial and technical | 14% | 18.2% | 23.6% | 43.1% |
| III Skilled Manual | 46.7% | 43.4% | 44.5% | 21.7% |
| III Skilled Non-Manual | 9.1% | 9.3% | 9.2% | 13.2% |
| IV Partly Skilled | 19.0% | 17.6% | 12.5% | 14.0% |
| V Unskilled | 8.2% | 6.1% | 4.1% | 2.9% |
| Maternal education, % post compulsory | 20.86% | 25.1% | 34.5% | 52.8% |
| Maternal height, mean (SD) cm | 160.81 (6.38) | 161.99 (6.45) | 161.28 (6.63) | 164.14 (6.93) |
| Paternal height, mean (SD) cm | 172.68 (8.07) | 174.47 (7.42) | 175.21 (7.51) | 178.28 (7.23) |
-
Note: Data are imputed (32 imputations); see methods for details and exact age of measurement in each cohort.
Additional files
-
MDAR checklist
- https://cdn.elifesciences.org/articles/81099/elife-81099-mdarchecklist1-v1.docx
-
Supplementary file 1
Supplementary file for: Weakening of the cognition and height association from 1957 to 2018: findings from four British birth cohort studies.
(a) Cognitive measures in four British birth cohort studies used in subsequent cross-cohort analysis: procedures and scoring, with links provided to further information. (b) The numbers of unique scores in each cognition test ) The numbers of unique scores in each cognition test. (c) Descriptive statistics, observed and imputed data. Imputed data drawn from 32 imputations.
- https://cdn.elifesciences.org/articles/81099/elife-81099-supp1-v1.docx
Download links
A two-part list of links to download the article, or parts of the article, in various formats.
Downloads (link to download the article as PDF)
Open citations (links to open the citations from this article in various online reference manager services)
Cite this article (links to download the citations from this article in formats compatible with various reference manager tools)
Weakening of the cognition and height association from 1957 to 2018: Findings from four British birth cohort studies
eLife 12:e81099.
https://doi.org/10.7554/eLife.81099


