The impact of the COVID-19 pandemic on Italian population-based cancer screening activities and test coverage: Results from national cross-sectional repeated surveys in 2020
- Azienda Unità Sanitaria Locale - IRCCS di Reggio Emilia, Italy
- Azienda Unità Sanitaria Locale Di Modena, Italy
- Istituto per lo Studio, la Prevenzione e la Rete Oncologica (ISPRO), Italy
- Registro Tumori del Veneto, Azienda Zero, Italy
- Centro di Prevenzione Oncologica, Azienda Ospedaliero-Universitaria Città della Salute e della Scienza di Torino, Italy
- Servizio Prevenzione Collettiva e Sanità Pubblica, Direzione Generale Cura della Persona, Salute e Welfare, Regione Emilia-Romagna, Italy
- Istituto Superiore di Sanita, Italy
- Osservatorio Nazionale Screening, Italy
Figures
Figure 1
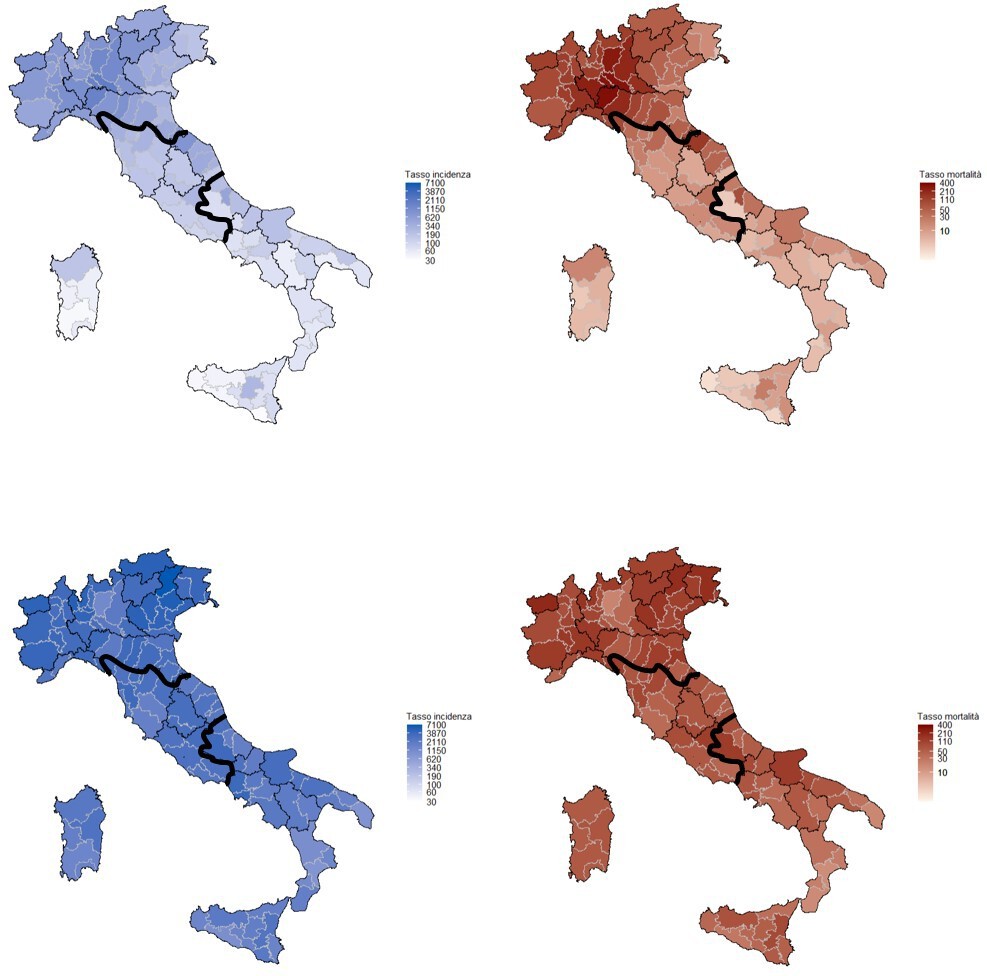
Cumulative incidence (left) and mortality (right) rates in the first (upper panel, March–June 2020) and second COVID-19 wave (lower panel, July–December 2020) per 100,000 inhabitants.
Mortality is referred to the date of incidence. Rates are computed by province, bold lines define the macro areas, North, Center, and South, and Islands. Data from the National Institute of Health, Italy, 2020.
Figure 2
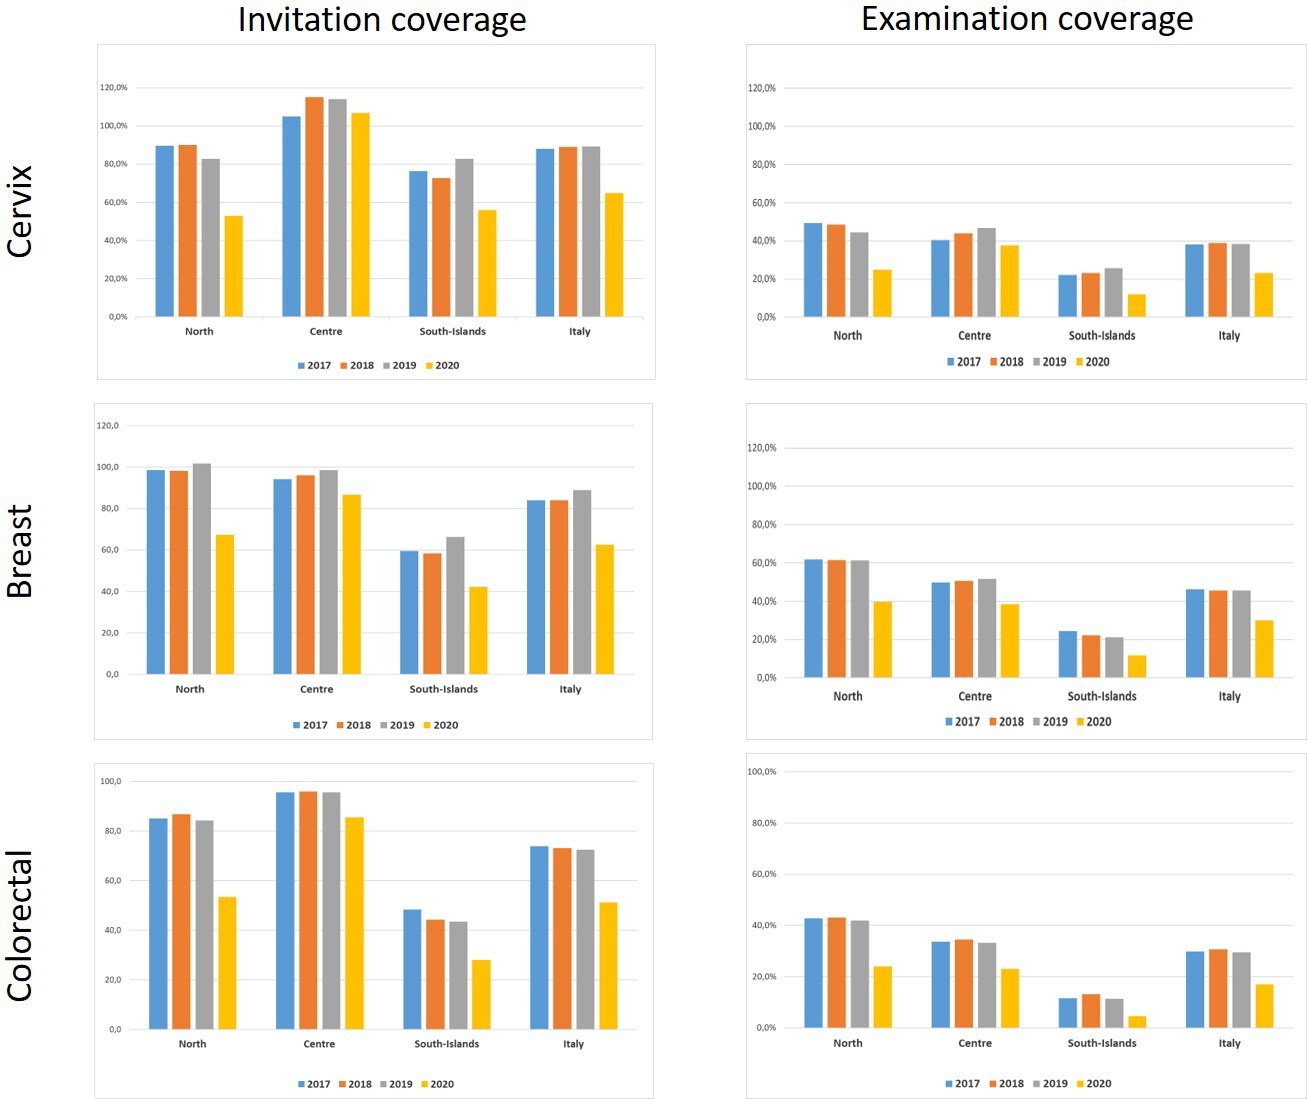
Invitation and examination coverage for cervical, breast, and colorectal cancer screening in Italy, by year and geographical macro area.
The invitation coverage (right panel) is computed as the number of invitations sent during the year divided by the expected target population to be invited in 1 year. Test coverage (right panel) is computed as the number of tests performed during the year divided by the expected target population in that year. For breast and colorectal cancer, the target population is expected to be invited in 2 years, for cervical cancer the target population is expected to be invited in 3 years if the last test was a Pap test and every 5 years if the last test was an HPV test.
Figure 3
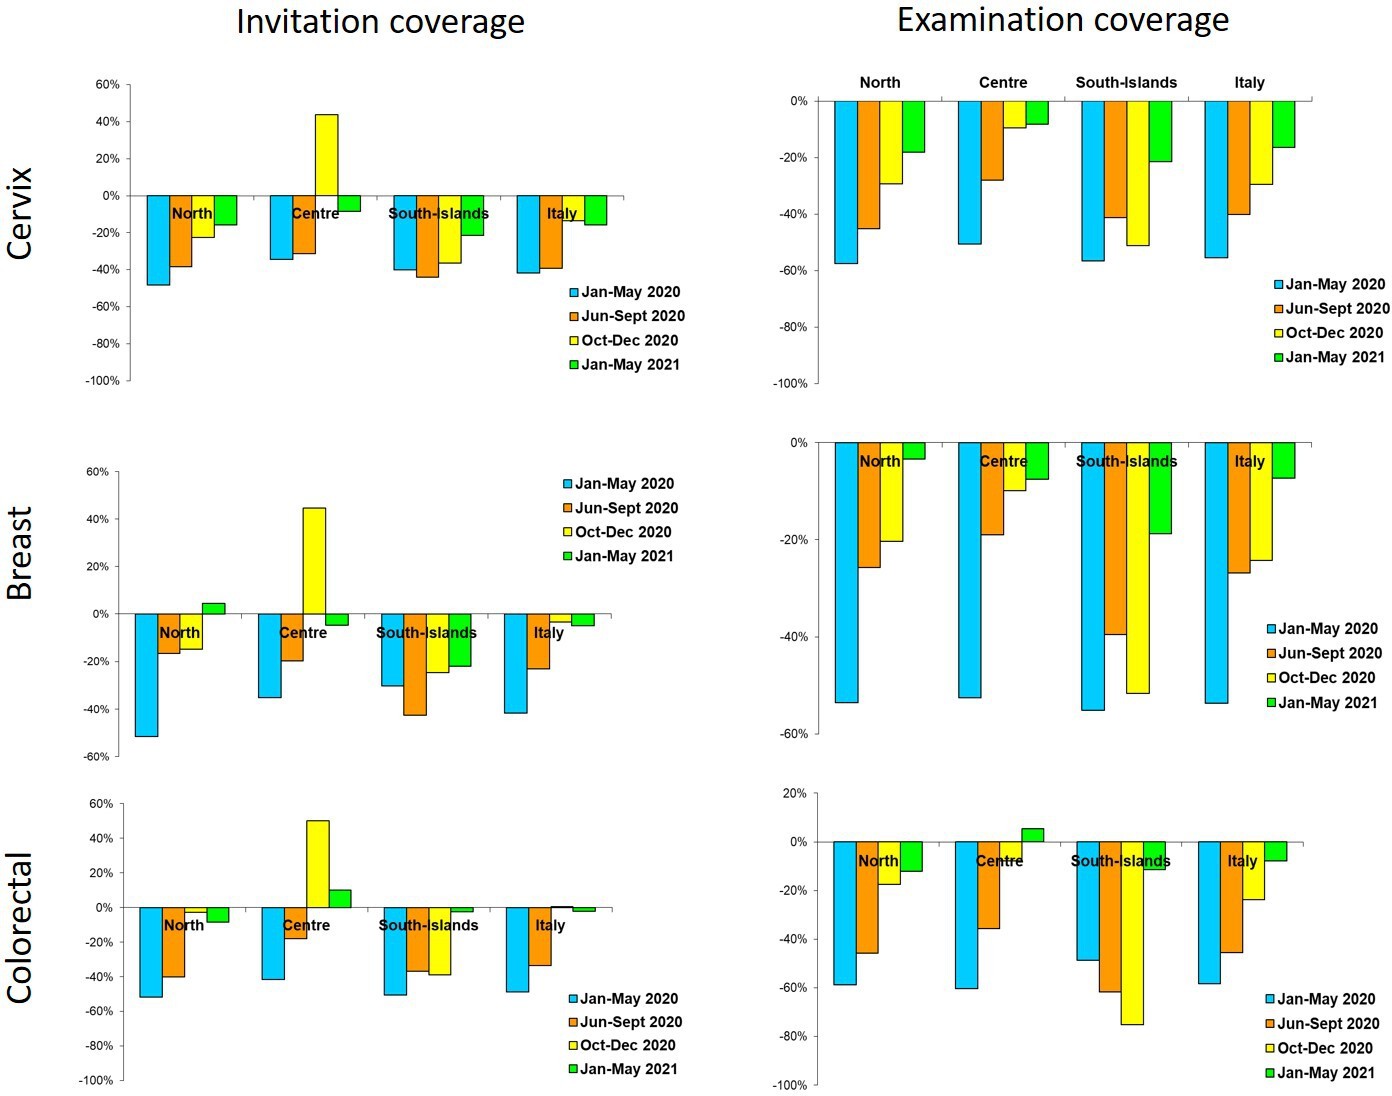
Changes in the number of invitations sent (left panel) and screening tests (right panel) performed by screening programs in 2020–2021 compared to the same months in 2019, by period and geographic macro area.
Data from ONS survey.
Figure 4
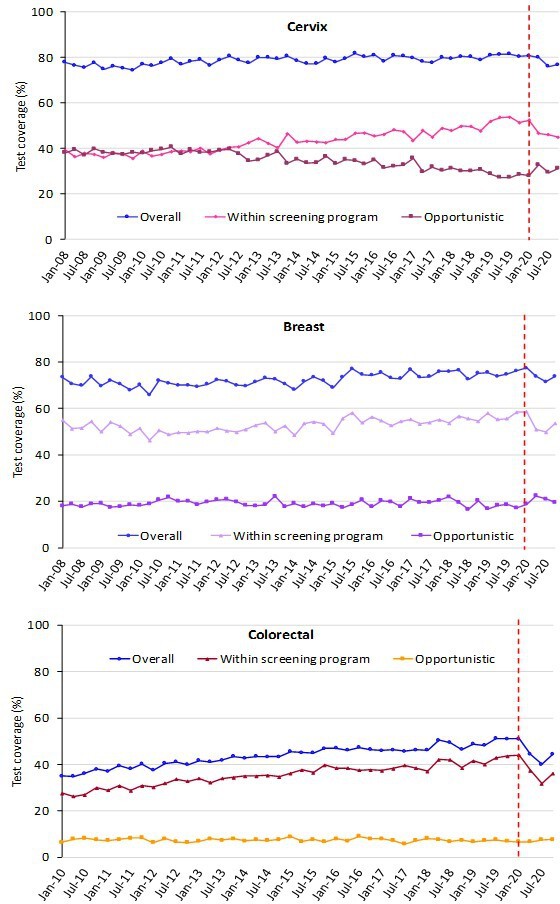
Trends of the proportion of the screening target population who declared to have had a test in due time, overall, and by the setting of the last test.
Data from the PASSI interviews. For breast cancer, we considered as being eligible the female population aged 50–69 years and those who reported as having had a mammogram in the last 2 years as up to date with screening; for cervical cancer, we considered as being eligible the female population aged 25–64 years and those having had a Pap test in the last 3 years or an HPV-DNA test in the last 5 years as up to date with screening; for colorectal cancer, we considered as being eligible males and females aged 50–69 years and those who reported as having had a fecal occult blood test (FOBT) in the last 2 years or a colonoscopy or sigmoidoscopy in the last 5 years as up to date with screening.
Figure 5

Trends of the proportion of the screening target population who declared to have had a test in due time, by geographical macro area.
Data from the PASSI interviews. For breast cancer, we considered as being eligible the female population aged 50–69 years and those who reported as having had a mammogram in the last 2 years as up to date with screening; for cervical cancer, we considered as being eligible the female population aged 25–64 years and those having had a Pap test in the last 3 years or an HPV-DNA test in the last 5 years as up to date with screening; for colorectal cancer, we considered as being eligible males and females aged 50–69 years and those who reported having had a fecal occult blood test (FOBT) in the last 2 years or a colonoscopy or sigmoidoscopy in the last 5 years as up to date with screening.
Figure 6
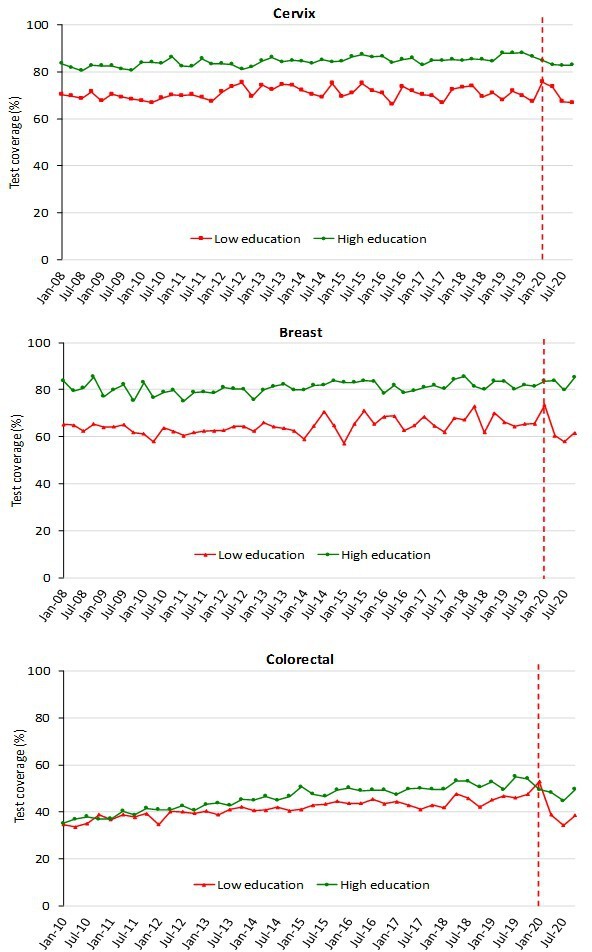
Trends of the proportion of the screening target population who declared to have had a test in due time, by education.
Data from the PASSI interviews. For breast cancer, we considered as being eligible the female population aged 50–69 years and those who reported as having had a mammogram in the last 2 years as up to date with screening; for cervical cancer, we considered as being eligible the female population aged 25–64 years and those having had a Pap test in the last 3 years or an HPV-DNA test in the last 5 years as up to date with screening; for colorectal cancer, we considered as being eligible males and females aged 50–69 years and those who reported as having had a fecal occult blood test (FOBT) in the last 2 years or a colonoscopy or sigmoidoscopy in the last 5 years as up to date with screening. Educational attainment was groped in two categories: low (no title, elementary school, or middle school); high (high school or higher education).
Figure 7
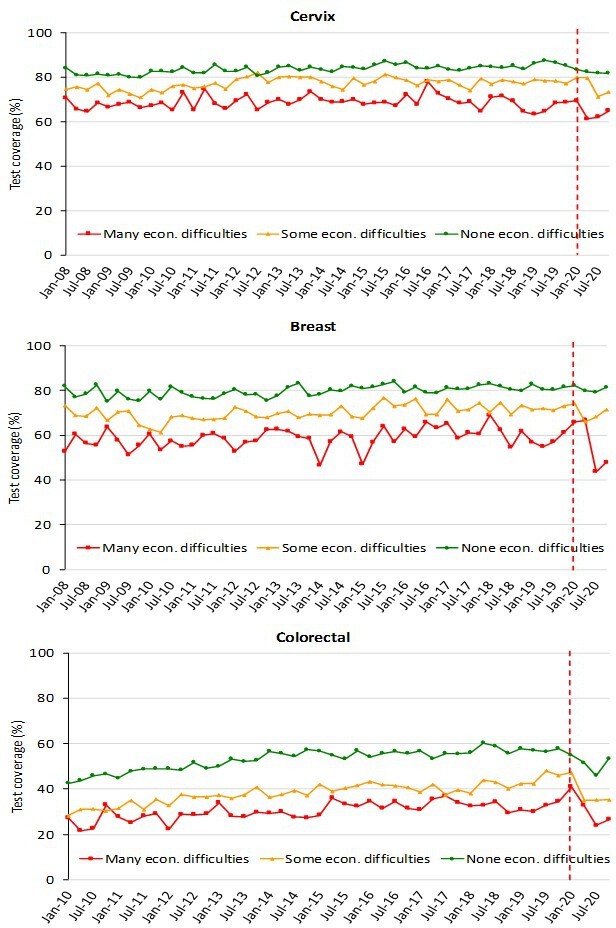
Trends of the proportion of the screening target population who declared to have had a test in due time, by economic difficulties, Data from the PASSI interviews.
For breast cancer, we considered as being eligible the female population aged 50–69 years and those who reported as having had a mammogram in the last 2 years as up to date with screening; for cervical cancer, we considered as being eligible the female population aged 25–64 years and those having had a Pap test in the last 3 years or an HPV-DNA test in the last 5 years as up to date with screening; for colorectal cancer, we considered as being eligible males and females aged 50–69 years and those who reported as having had a fecal occult blood test (FOBT) in the last 2 years or a colonoscopy or sigmoidoscopy in the last 5 years as up to date with screening. Economic difficulties are classified into three categories: many economic difficulties; some economic difficulties; no economic difficulties.
Figure 8

Proportion of the target population who declared having had the screening test in the last year, by year and setting where the test was last performed.
Data from the PASSI interviews.
Tables
Table 1
Italian Ministry of Health recommendations for cancer screening programs.
| Target population | Test | Interval | |
|---|---|---|---|
| Cervical cancer | Women 25–64 years | Pap test (25 to 29/34 years) HPV test (30/35–64 years) | 3 years after negative Pap 5 years after negative HPV |
| Breast cancer | To be implemented: Women 50–69 years Suggested: Women 45–49 years Women 70–74 years | Mammography | 2 years for women 50–74 1 year for women 45–49 |
| Colorectal cancer | To be implemented: Women and men 50–69 years Suggested: Women and men 70–74 years | Fecal immunochemical test (FIT) or Sigmoidoscopy at 58/60 years | 2 years after negative FIT Once in a life sigmoidoscopy |
Table 2
Cumulative reduction of tests performed in Italian screening programs and average cumulated delay in testing, with ranges between regions, by geographical macro area.
January 2020 to May 2021. Data from ONS survey.
| Cervix | Breast | Colorectal | ||||||||||
|---|---|---|---|---|---|---|---|---|---|---|---|---|
| Macro area | Test cumulative reduction Jan 2020–May 2021 | Average delay in months | Range between regions | Test cumulative reduction Jan 2020–May 2021 | Average delay in months | Range between regions | Test cumulative reduction Jan 2020–May 2021 | Average delay in months | Range between regions | |||
| Minimum | Maximum | Minimum | Maximum | Minimum | Maximum | |||||||
| North | –409,092 | –6.4 | –12.1 | +7.5 | –438,744 | –4.5 | –10.1 | –0.9 | –800,101 | –5.9 | –14 | +2.7 |
| Center | –136,393 | –4.2 | –6.6 | –0.5 | –154,783 | –4.0 | –6.0 | –1.4 | –213,418 | –4.4 | –6.3 | –0.8 |
| South and Islands | –239,275 | –7.2 | –12.7 | –5.6 | –223,439 | –6.9 | –11.2 | –5.8 | –182,468 | –8.4 | –13.4 | -2 |
| Italy | –784,760 | –6.0 | –816,966 | –4.8 | –1,195,987 | –5.8 | ||||||
-
ONS: National Screening Monitoring Centre.
Table 3
Multivariable Poisson regression models comparing the prevalence of having had a test in the last year by age, sex, familial status, socioeconomic characteristics, citizenship, and pre-pandemic and pandemic period for cervical, breast, and colorectal cancer screening in Italy.
PRR: Prevalence Rate Ratio.
| Cervix | Breast | Colorectal | |||||||
|---|---|---|---|---|---|---|---|---|---|
| PRR | 95% CI | PRR | 95% CI | PRR | 95% CI | ||||
| Age (years) | |||||||||
| 25–34 | 1.06 | 1.01 | 1.11 | ||||||
| 35–49 | 1.10 | 1.06 | 1.14 | ||||||
| 50–64 | ref. | ||||||||
| 50–59 | 1.13 | 1.08 | 1.18 | ref. | |||||
| 60–69 | ref. | 1.15 | 1.10 | 1.20 | |||||
| Sex | |||||||||
| Male | ref. | ||||||||
| Female | 0.99 | 0.95 | 1.03 | ||||||
| Familial status | |||||||||
| Married or with partner | 1.09 | 1.05 | 1.13 | 1.03 | 0.99 | 1.08 | |||
| Alone | ref. | ref. | |||||||
| Educational level | |||||||||
| No title/elementary | ref. | ref. | ref. | ||||||
| Middle school | 1.27 | 1.14 | 1.42 | 1.14 | 1.05 | 1.24 | 1.12 | 1.03 | 1.22 |
| High school | 1.46 | 1.31 | 1.63 | 1.21 | 1.12 | 1.32 | 1.20 | 1.10 | 1.30 |
| Degree | 1.65 | 1.47 | 1.84 | 1.27 | 1.16 | 1.39 | 1.12 | 1.01 | 1.23 |
| Economic difficulties | |||||||||
| Many | ref. | ref. | ref. | ||||||
| Some | 1.05 | 0.99 | 1.12 | 1.08 | 1.00 | 1.16 | 1.27 | 1.16 | 1.38 |
| None | 1.20 | 1.12 | 1.28 | 1.27 | 1.18 | 1.37 | 1.74 | 1.59 | 1.89 |
| Citizenship | |||||||||
| Italian | |||||||||
| Foreigner | 0.95 | 0.89 | 1.01 | 0.81 | 0.73 | 0.90 | 0.99 | 0.87 | 1.12 |
| Period | |||||||||
| 2017–2019 | ref. | ref. | ref. | ||||||
| 2020 | 0.76 | 0.73 | 0.80 | 0.83 | 0.78 | 0.89 | 0.74 | 0.69 | 0.79 |
Table 4
Multivariable Poisson regression models comparing the prevalence of having had a test in the last year by age, sex, familial status, socioeconomic characteristics, and citizenship in the pandemic and pre-pandemic period for cervical, breast, and colorectal cancer screening in Italy.
| Cervix | Breast | Colorectal | ||||||||||||||||
|---|---|---|---|---|---|---|---|---|---|---|---|---|---|---|---|---|---|---|
| 2017–2019 | 2020 | 2017–2019 | 2020 | 2017–2019 | 2020 | |||||||||||||
| PRR | 95% CI | PRR | 95% CI | PRR | 95% CI | PRR | 95% CI | PRR | 95% CI | PRR | 95% CI | |||||||
| Age (years) | ||||||||||||||||||
| 25–34 | 1.05 | 1.00 | 1.10 | 1.11 | 0.96 | 1.27 | ||||||||||||
| 35–49 | 1.10 | 1.06 | 1.14 | 1.10 | 0.98 | 1.24 | ||||||||||||
| 50–64 | ref. | ref. | ||||||||||||||||
| 50–59 | 1.13 | 1.08 | 1.18 | 1.14 | 1.00 | 1.29 | ref. | ref. | ||||||||||
| 60–69 | ref. | ref. | 1.15 | 1.10 | 1.20 | 1.15 | 1.01 | 1.31 | ||||||||||
| Sex | ||||||||||||||||||
| Male | ref. | ref. | ||||||||||||||||
| Female | 0.98 | 0.94 | 1.02 | 1.01 | 0.89 | 1.15 | ||||||||||||
| Familial status | ||||||||||||||||||
| Married or with partner | 1.09 | 1.05 | 1.13 | 1.10 | 0.99 | 1.22 | 1.04 | 0.99 | 1.09 | 1.01 | 0.88 | 1.15 | ||||||
| Alone | ref. | ref. | ref. | ref. | ||||||||||||||
| Educational level | ||||||||||||||||||
| No title/elementary | ref. | ref. | ref. | ref. | ref. | ref. | ||||||||||||
| Middle school | 1.24 | 1.11 | 1.39 | 1.56 | 0.98 | 2.49 | 1.10 | 1.02 | 1.20 | 1.52 | 1.14 | 2.02 | 1.10 | 1.01 | 1.20 | 1.29 | 0.94 | 1.77 |
| High school | 1.41 | 1.26 | 1.58 | 1.89 | 1.19 | 3.00 | 1.17 | 1.08 | 1.27 | 1.62 | 1.21 | 2.17 | 1.18 | 1.08 | 1.29 | 1.37 | 1.00 | 1.89 |
| Degree | 1.58 | 1.41 | 1.77 | 2.21 | 1.38 | 3.54 | 1.23 | 1.12 | 1.36 | 1.61 | 1.18 | 2.21 | 1.06 | 0.96 | 1.17 | 1.47 | 1.04 | 2.09 |
| Economic difficulties | ||||||||||||||||||
| Many | ref. | ref. | ref. | ref. | ref. | ref. | ||||||||||||
| Some | 1.06 | 1.00 | 1.13 | 1.03 | 0.82 | 1.29 | 1.08 | 1.00 | 1.17 | 1.04 | 0.81 | 1.34 | 1.27 | 1.16 | 1.39 | 1.27 | 0.95 | 1.70 |
| None | 1.20 | 1.13 | 1.28 | 1.18 | 0.94 | 1.47 | 1.27 | 1.17 | 1.37 | 1.29 | 1.00 | 1.67 | 1.72 | 1.58 | 1.88 | 1.83 | 1.38 | 2.42 |
| Citizenship | ||||||||||||||||||
| Italian | ref. | ref. | ref. | ref. | ref. | ref. | ||||||||||||
| Foreigner | 0.93 | 0.87 | 0.99 | 1.06 | 0.88 | 1.27 | 0.83 | 0.74 | 0.92 | 0.72 | 0.52 | 1.01 | 0.93 | 0.82 | 1.05 | 1.31 | 0.94 | 1.82 |
Additional files
-
Supplementary file 1
ONS dataset.
Cervical cancer screening invitation and examination coverage 2017–2020 in Italy.
- https://cdn.elifesciences.org/articles/81804/elife-81804-supp1-v2.xlsx
-
Supplementary file 2
ONS dataset.
Breast cancer screening invitation and examination coverage 2017–2020 in Italy.
- https://cdn.elifesciences.org/articles/81804/elife-81804-supp2-v2.xlsx
-
Supplementary file 3
ONS dataset.
Colorectal cancer screening invitation and examination coverage 2017–2020 in Italy.
- https://cdn.elifesciences.org/articles/81804/elife-81804-supp3-v2.xlsx
-
Supplementary file 4
PASSI dataset.
Cervical cancer screening: trend of the proportion of the screening target population who declared to have had a test in due time, overall and by setting of the last test, geographical macro area, education, and economic difficulties.
- https://cdn.elifesciences.org/articles/81804/elife-81804-supp4-v2.xlsx
-
Supplementary file 5
PASSI dataset.
Breast cancer screening: trend of the proportion of the screening target population who declared to have had a test in due time, overall and by setting of the last test, geographical macro area, education, and economic difficulties.
- https://cdn.elifesciences.org/articles/81804/elife-81804-supp5-v2.xlsx
-
Supplementary file 6
PASSI dataset.
Colorectal cancer screening: trend of the proportion of the screening target population who declared to have had a test in due time, overall and by setting of the last test, geographical macro area, education, and economic difficulties.
- https://cdn.elifesciences.org/articles/81804/elife-81804-supp6-v2.xlsx
-
Supplementary file 7
Number of interviews included in the analysis of PASSI's survey.
- https://cdn.elifesciences.org/articles/81804/elife-81804-supp7-v2.docx
-
MDAR checklist
- https://cdn.elifesciences.org/articles/81804/elife-81804-mdarchecklist1-v2.pdf
Download links
A two-part list of links to download the article, or parts of the article, in various formats.
Downloads (link to download the article as PDF)
Open citations (links to open the citations from this article in various online reference manager services)
Cite this article (links to download the citations from this article in formats compatible with various reference manager tools)
The impact of the COVID-19 pandemic on Italian population-based cancer screening activities and test coverage: Results from national cross-sectional repeated surveys in 2020
eLife 12:e81804.
https://doi.org/10.7554/eLife.81804


