Memory for incidentally learned categories evolves in the post-learning interval
- Department of Special Education and the Edmond J. Safra Brain Research Center for the Study of Learning Disabilities, University of Haifa, Abba Khoushy Ave 199, Israel
- Sagol Department of Neurobiology and the Edmond, J. Safra Brain Research Center for the Study of Learning Disabilities, University of Haifa, Israel
- Department of Psychology and Neuroscience Institute, Carnegie Mellon University, United States
Figures
Figure 1
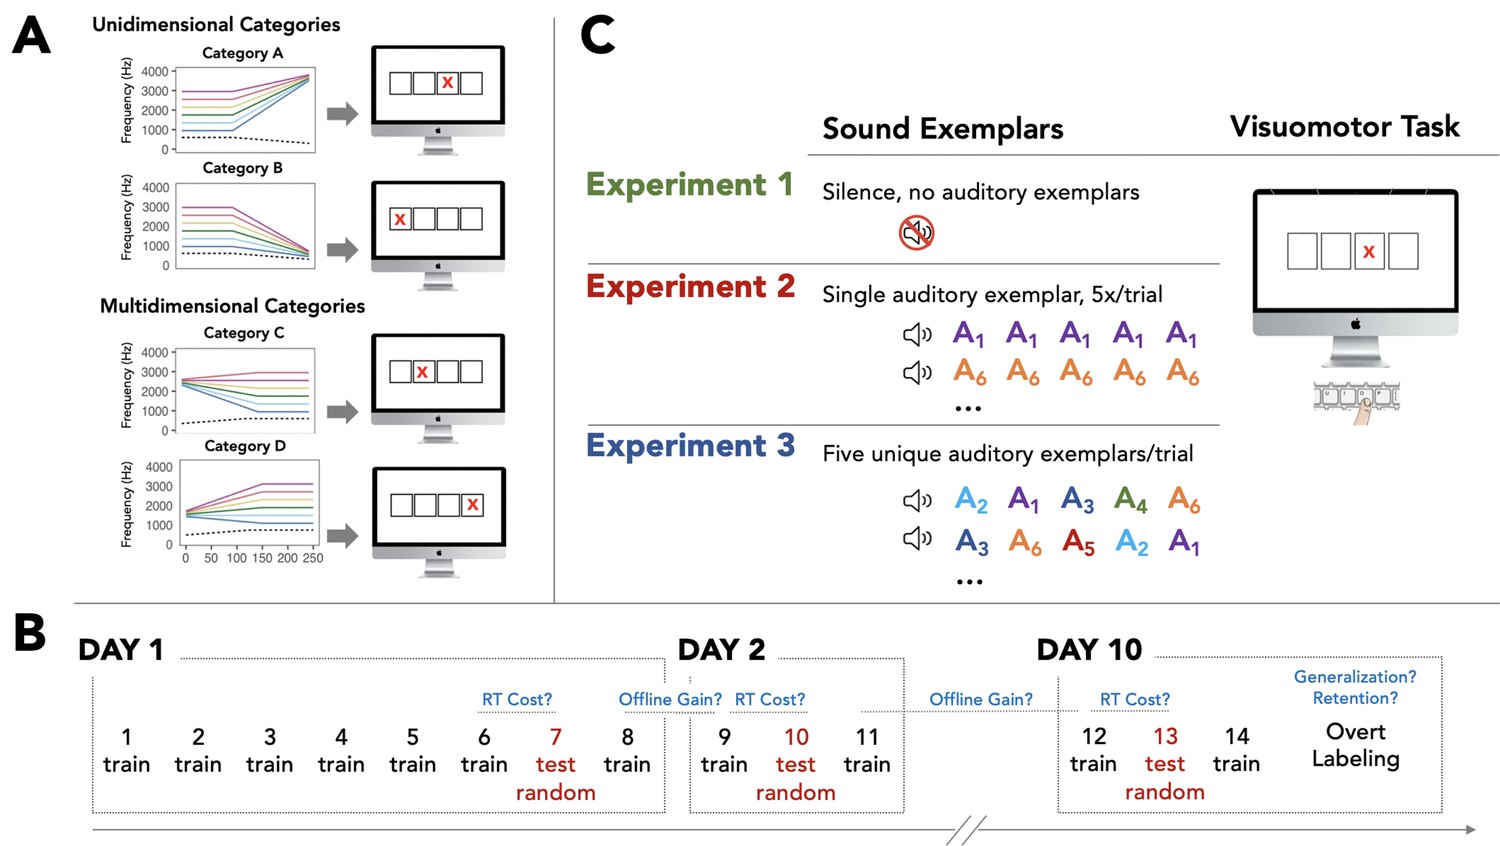
Overview of stimuli and paradigm.
(A) Four nonspeech auditory categories are defined across six exemplars (differentiated by the higher frequency component shown as different colors on the same axes, with a common lower-frequency component shown as a dashed grey line). Categories A and B are characterized by a unidimensional acoustic attribute (offset rises or falls) whereas Categories C and D cannot be defined by a single acoustic attribute and instead are multidimensional, with distributional structure in higher-order perception space (see 15). In the Systematic Multimodal Association Reaction Time (SMART) task each auditory category uniquely predicts the upcoming location of a visual target. Participants respond with a keypress to indicate the visual target location. (B) Each of three experiments involves three behavioral testing sessions (Day 1, Day 2, Day 10). The blocks labeled ‘train’ involve a consistent mapping from auditory category to visual target location (and visuomotor response), as shown in (A). Blocks 7, 10, and 13 destroy this relationship through randomization of sounds to locations to examine the impact on visuomotor response (as a response time cost). Examination of performance on Day 2 and Day 10 informs offline gains (response time facilitation), consolidation of incidental category learning, and its retention. A final overt labeling task on Day 10 measures generalization of incidental category learning to novel category exemplars (not plotted in Panel A) in an overt labeling task. (C) Exp 1 examines visuomotor task demands without auditory exemplars preceding the visual target to characterize putative visuomotor learning, consolidation and retention. Exp 2 examines incidental auditory category when, on each trial, a single category exemplar is repeated five times and predicts the upcoming location of the visual target; exemplar variability is experienced across, not within, trials. Exp 3 examines incidental learning when within-category variability is more tightly coupled to visuomotor task demands; five unique exemplars are sampled from a category on each trial and, as in Exp 2, the category identity predicts the location of the upcoming visual target.
Figure 2
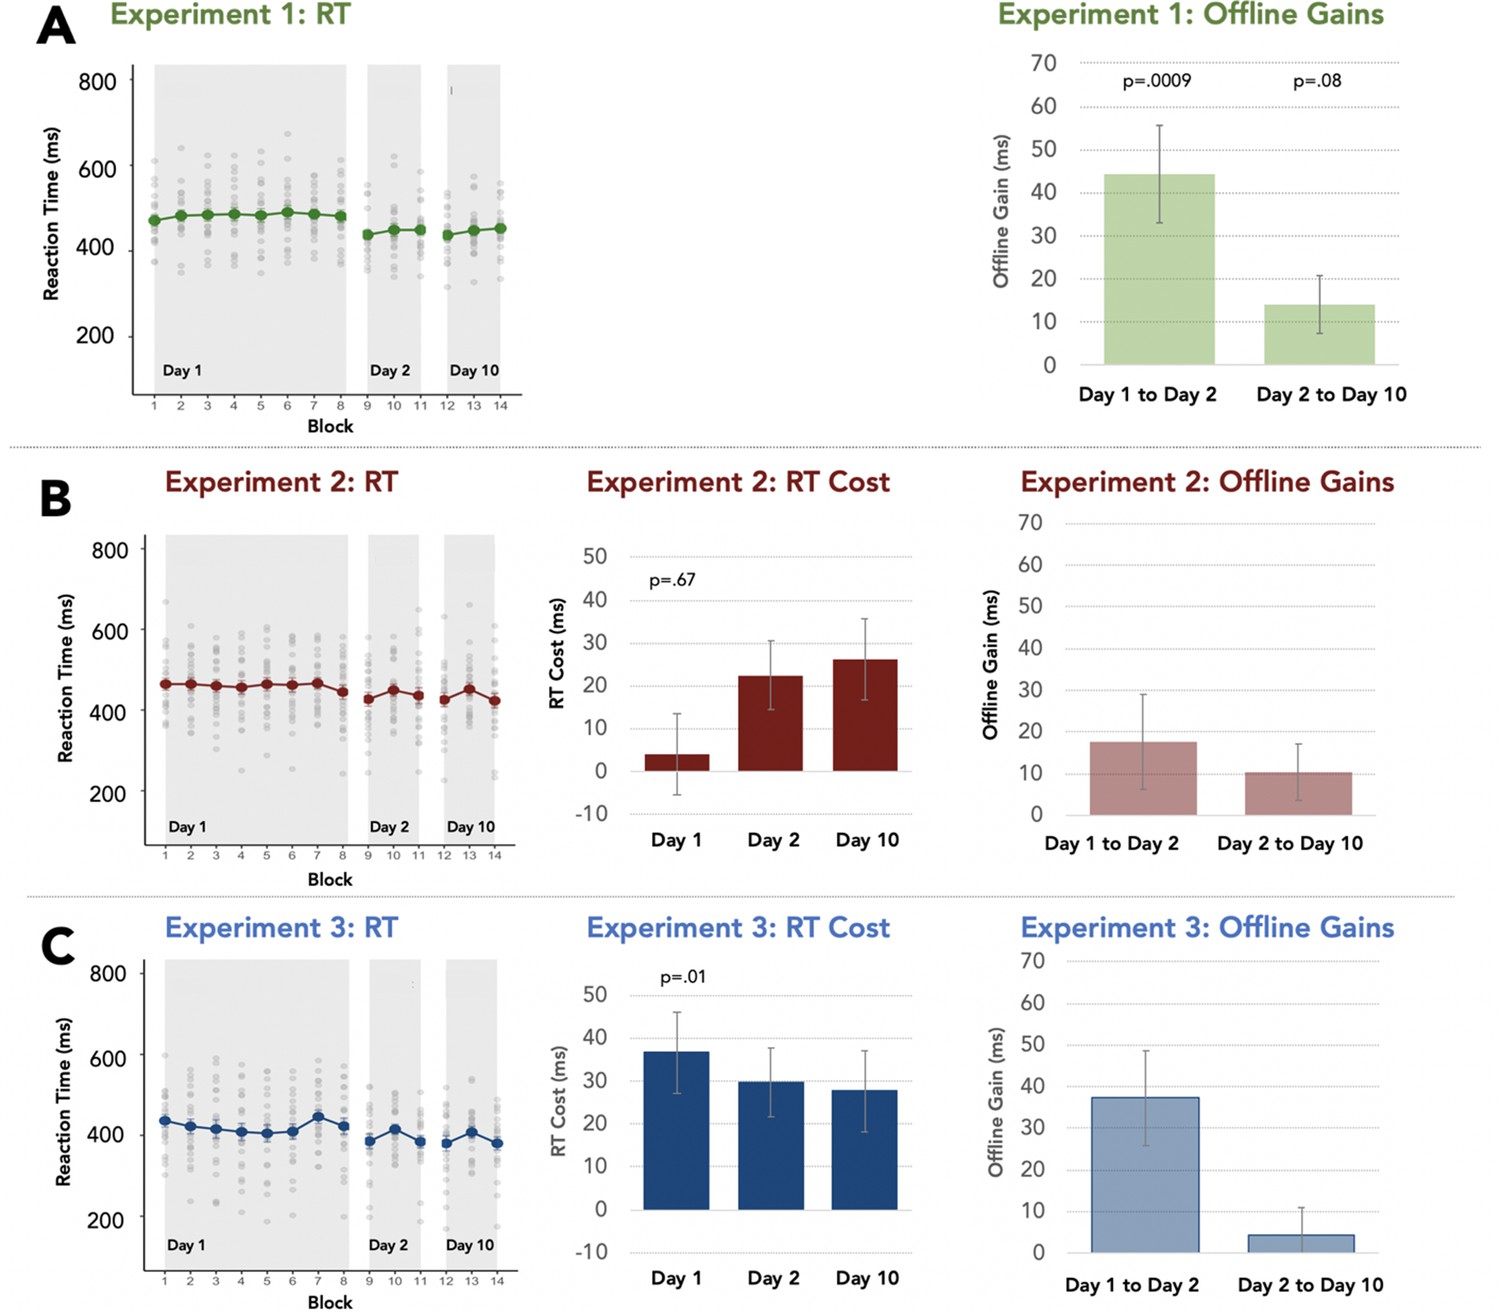
Visuomotor SMART task behavior: Response time (RT).
Across all panels, the leftmost graph shows the mean and standard error of the response time (RT) to respond to the visual target, with individuals' data plotted as light grey dots across blocks in Day-1, Day-2, and Day-10 sessions. The middle graph plots the RT Cost of the Random block (Blocks 7, 10, 13) as a function of the preceding block. The rightmost graph shows the offline gain from the last block of a preceding session to the first block of the next session (Day-1 to Day-2, Day2 to Day-10). (A) Exp 1 (n=22) characterizes putative visuomotor learning, consolidation and retention without sounds preceding visual targets. (B) In Exp 2 (n=24), a consistent category-to-location association is conveyed by a single category exemplar, repeated five times on a trial; different exemplars occurred on different trials. (C) In Exp 3 (n=22), the consistent category-to-location association was conveyed by five unique category exemplars sampled from the category on each trial.
Figure 3
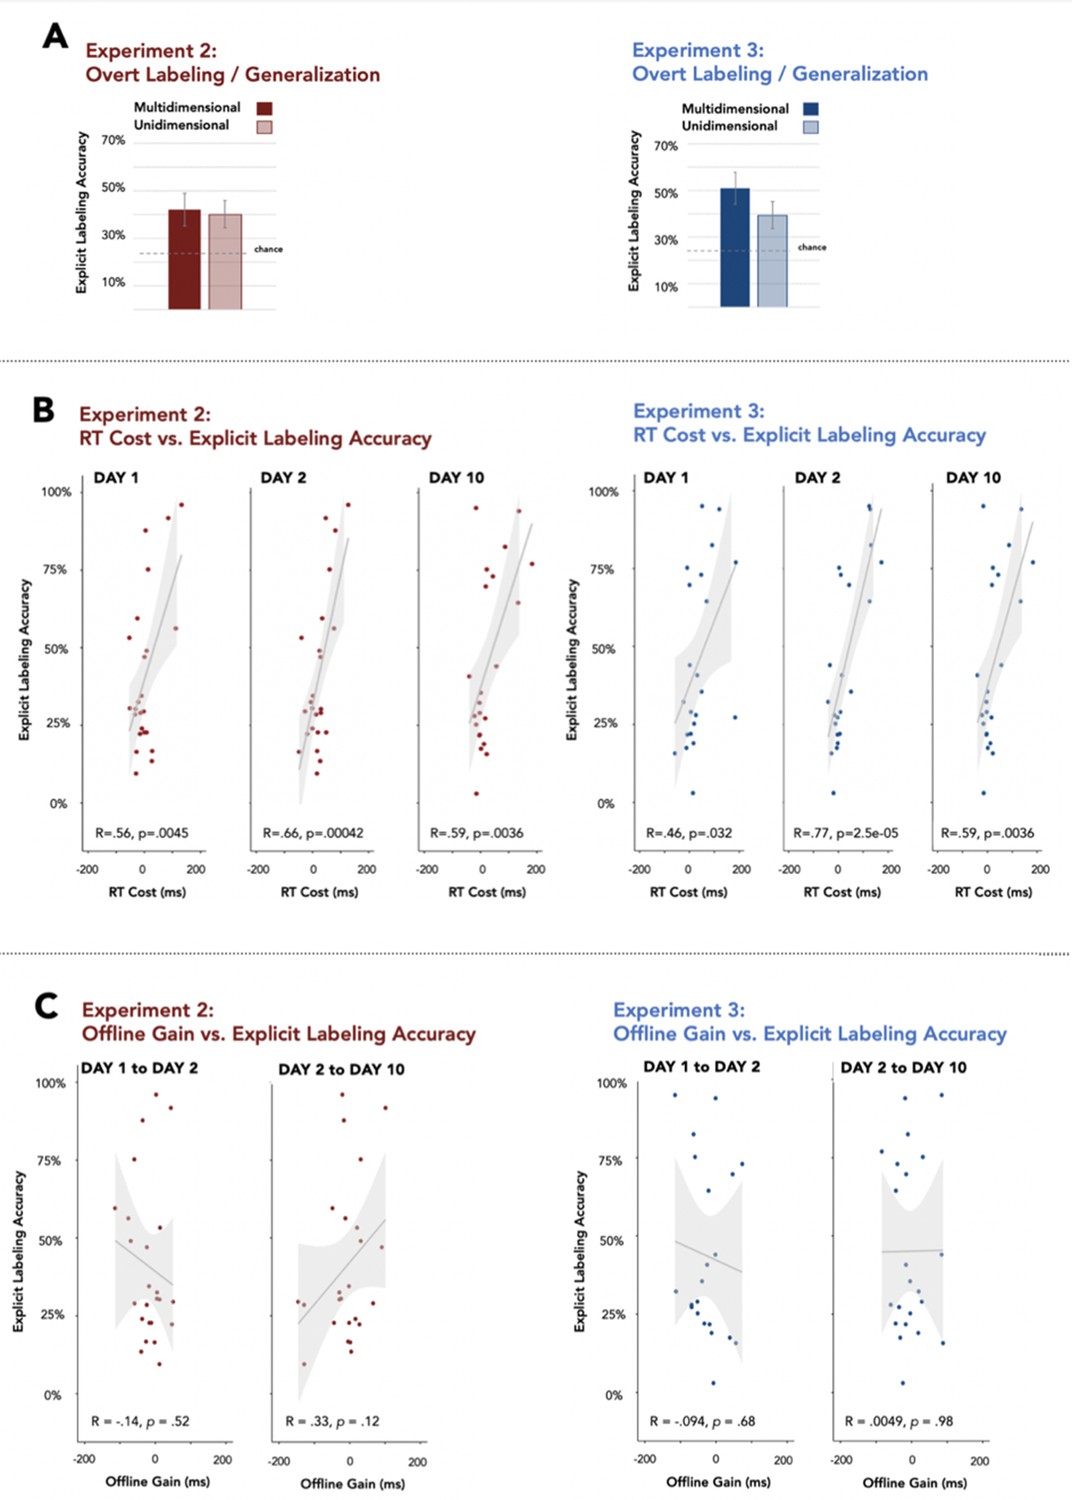
Retention and generalization of category knowledge.
(A) Participants label novel category exemplars at the end of the Day-10 session at above chance performance for both unidimensional and multidimensional categories in Exp 2 and Exp 3 (minimum p level = .019). (B) Generalization of category knowledge in the Day-10 explicit labeling task was positively associated with RT Cost for each session (Day-1, Day-2, and Day-10) for both Exp 2 and Exp 3. (C) In contrast, generalization of category knowledge in the Day-10 explicit labeling task was not associated with offline gains in RT (from Day-1 to Day-2 and from Day-2 to Day-10), consistent with observation of offline gains in the Exp 1 visuomotor task with no auditory stimuli.
Appendix 1—figure 1
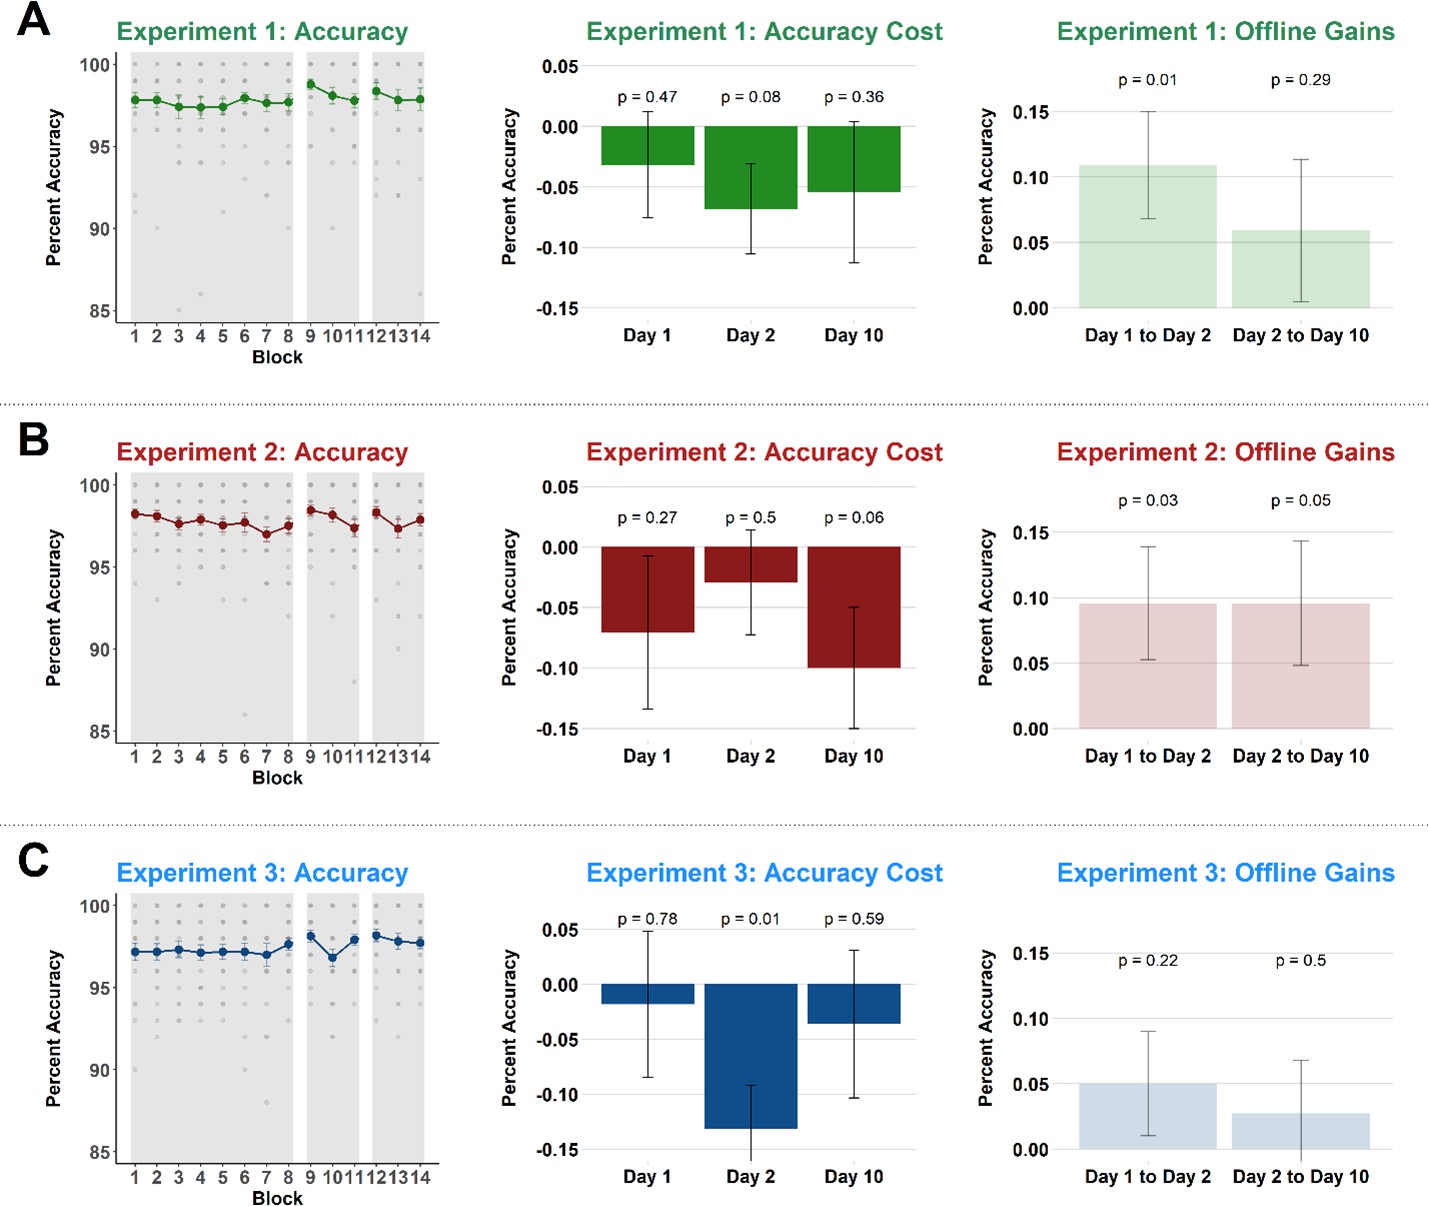
Visuomotor SMART Task Behavior (Accuracy).
Across all panels, the leftmost graph shows the mean and standard error of accuracy in responding to the visual target, with individual participants’ data plotted as light grey dots across blocks in Day 1, Day 2 and Day 10 sessions. The middle graph plots the Accuracy Cost of the Random block (Blocks 7, 10, 13) as a function of the preceding block. The rightmost graph shows the offline gain from the last block of a preceding session to the first block of the next session (Day 1–2, Day 2–10). (A) Exp 1 characterizes putative visuomotor learning, consolidation and retention without sounds preceding visual targets. (B) In Exp 2, a consistent category-to-location association is conveyed by a single category exemplar, repeated five times on a trial; different exemplars occurred on different trials. (C) In Exp 3, the consistent category-to-location association was conveyed by five unique category exemplars sampled from the category on each trial.
Additional files
-
Supplementary file 1
Comparison of Experiment 2 versus Experiment 3 Outcomes.
Supplemental Table 1 - RT Facilitation as a function of Experiment, ANOVA. Supplemental Table 2 - RT Cost as a function of Session and Experiment, ANOVA. Supplemental Table 3 - RT Facilitation across Day-1 to Day-2 as a function of Experiment, ANOVA. Supplemental Table 4 - Retention RT as a function of Experiment, ANOVA. Supplemental Table 5 - Posttest generalization accuracy as a function Category Type and Experiment, ANOVA.
- https://cdn.elifesciences.org/articles/81855/elife-81855-supp1-v2.xlsx
-
MDAR checklist
- https://cdn.elifesciences.org/articles/81855/elife-81855-mdarchecklist1-v2.docx
Download links
A two-part list of links to download the article, or parts of the article, in various formats.
Downloads (link to download the article as PDF)
Open citations (links to open the citations from this article in various online reference manager services)
Cite this article (links to download the citations from this article in formats compatible with various reference manager tools)
Memory for incidentally learned categories evolves in the post-learning interval
eLife 12:e81855.
https://doi.org/10.7554/eLife.81855


