Maximizing CRISPRi efficacy and accessibility with dual-sgRNA libraries and optimal effectors
- Medical Scientist Training Program, University of California, San Francisco, United States
- Department of Cellular and Molecular Pharmacology, University of California, San Francisco, United States
- Howard Hughes Medical Institute, Massachusetts Institute of Technology, United States
- Whitehead Institute for Biomedical Research, United States
- Department of Microbiology, Harvard Medical School, United States
- Institute for Neurodegenerative Disease, University of California, San Francisco, United States
- Center for Alzheimer's Disease and Related Dementias, National Institutes of Health, United States
- National Institute on Aging, National Institutes of Health, United States
- National Institute of Neurological Disorders and Stroke, National Institutes of Health, United States
- Department of Urology and Helen Diller Family Comprehensive Cancer Center, University of California, San Francisco, United States
- Arc Institute, United States
- Department of Biochemistry and Biophysics, University of California, San Francisco, United States
- Department of Biology, Massachusetts Institute of Technology, United States
- David H. Koch Institute for Integrative Cancer Research, Massachusetts Institute of Technology, United States
Figures
Figure 1 with 1 supplement
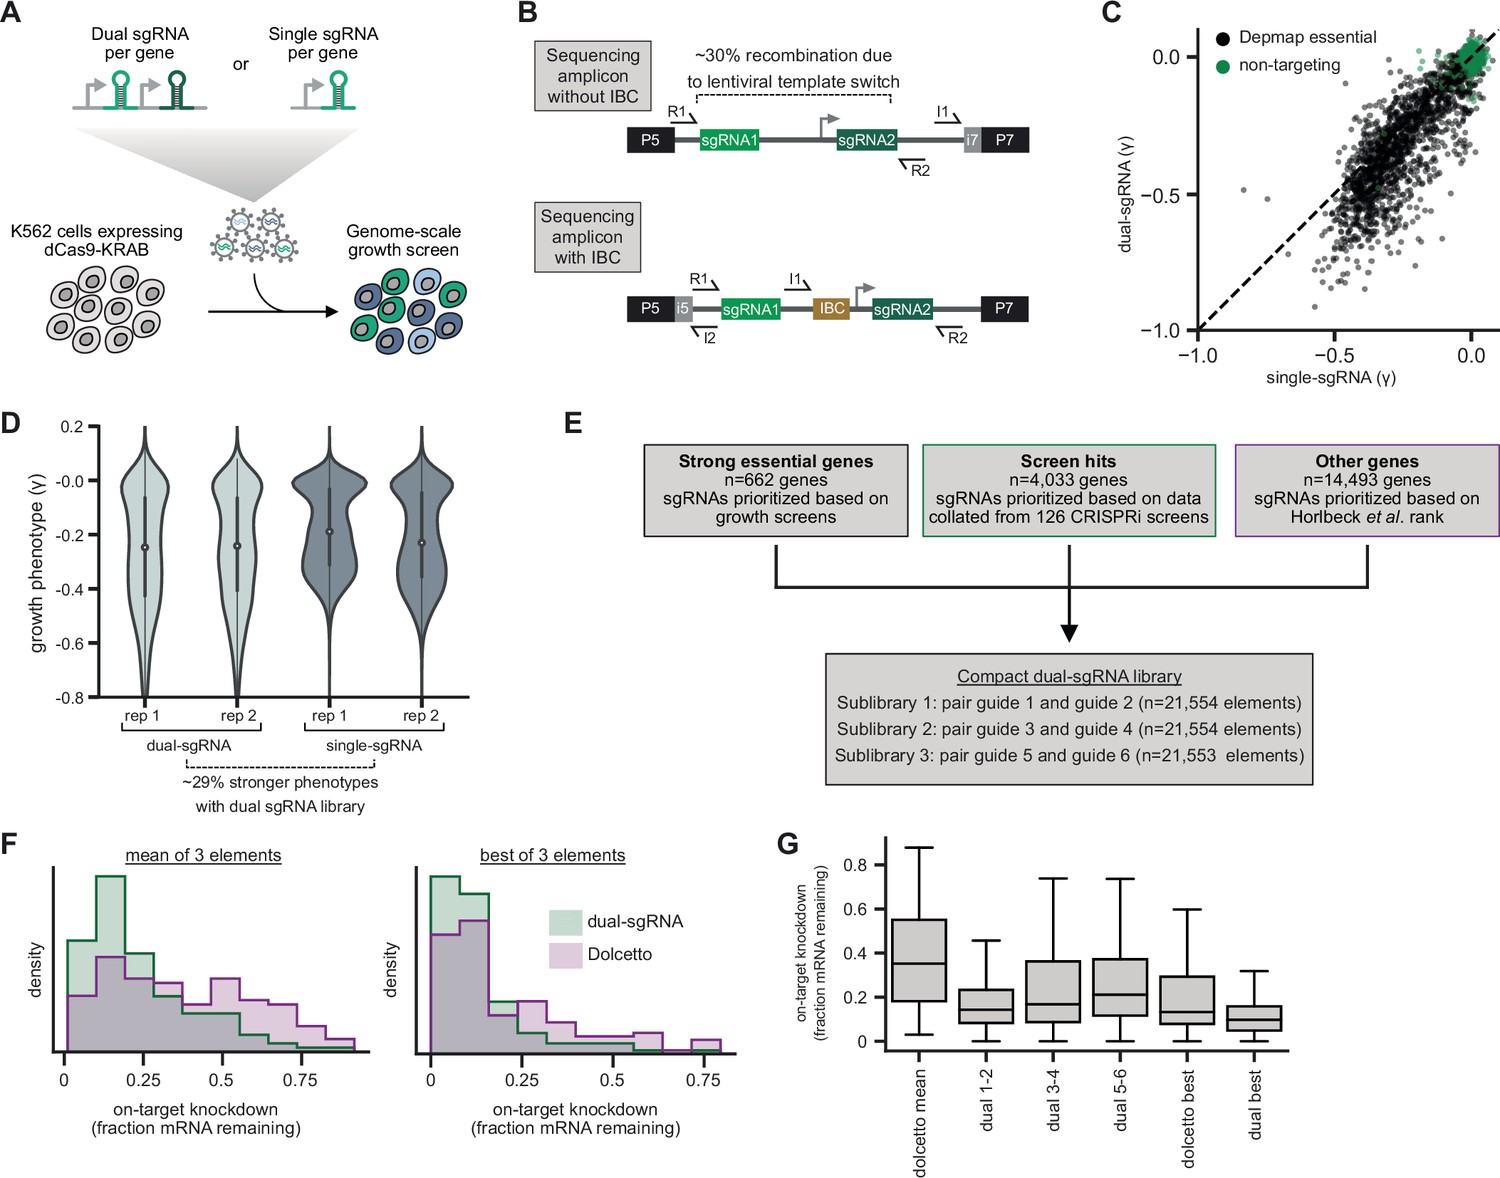
Design and validation of ultra-compact dual-single guide RNA (sgRNA) CRISPR interference (CRISPRi) libraries.
(A) Schematic of growth screen used to compare single- and dual-sgRNA libraries. (B) Schematic of dual-sgRNA library sequencing strategies. (C) Comparison of growth phenotypes for DepMap essential genes between single- and dual-sgRNA libraries. Sequencing libraries were prepared using the strategy labeled ‘Sequencing amplicon without IBC’ in panel B. Growth phenotypes are reported as γ (log2 fold-enrichment of Tfinal over T0, per doubling) and well correlated between libraries (r=0.91). Only values between –1 and 0.1 are shown. (D) Comparison of growth phenotypes for DepMap essential genes between single- and dual-sgRNA libraries. In the violin plot, the violin displays the kernel density estimate, the central white point represents the median, and the central black bar represents the interquartile range (IQR). (E) Design of final dual-sgRNA library. (F) Comparison of target gene knockdown by dual-sgRNA library versus Dolcetto library. Target gene knockdown was measured by single-cell RNA-sequencing (Perturb-seq). For each library, the ‘mean of 3 elements’ was calculated as the mean knockdown of all three elements targeting each gene. The ‘best of 3 elements’ represents the element with the best knockdown per each gene. (G) Comparison of target gene knockdown across elements in dual-sgRNA library versus Dolcetto. In the box plot, the box shows the IQR, the line dividing the box shows the median value, and the whiskers extend to show 1.5× the IQR. Outlier observations >1.5× IQR are not shown.
Figure 1—figure supplement 1
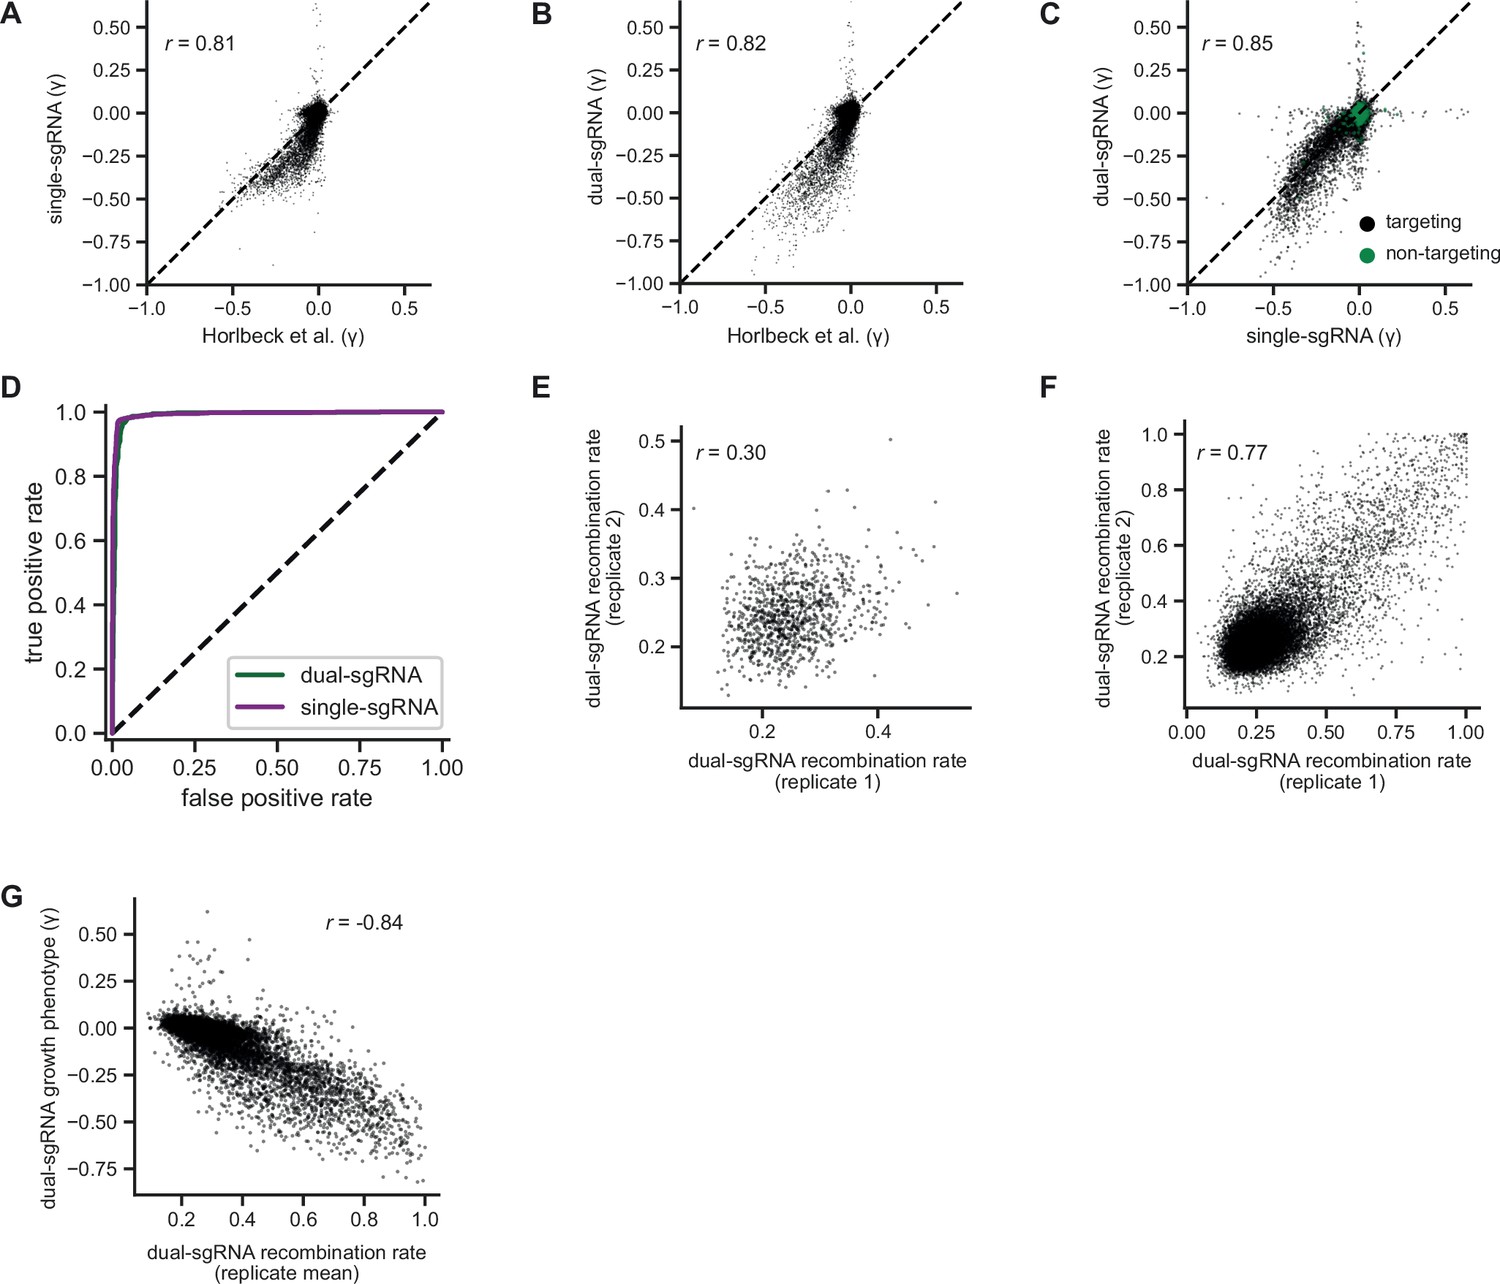
Additional comparisons of pilot single- and dual-single guide RNA (sgRNA) library screens.
(A) Comparison of growth phenotypes for all elements between our pilot single-sgRNA library and Horlbeck et al. data, merged by gene name (n=20,228 elements). Growth phenotypes are reported as γ (log2 fold-enrichment of Tfinal over T0, per doubling) and correlated between experiments (r=0.82). (B) Comparison of growth phenotypes for all elements between our pilot dual-sgRNA library and Horlbeck et al. data, merged by gene name (n=20,228 elements). Growth phenotypes are reported as γ and correlated between experiments (r=0.83). (C) Comparison of growth phenotypes for all elements between our pilot single- and dual-sgRNA libraries, merged by gene name (n=21,239 with 20,228 targeting elements and 1011 non-targeting elements). Growth phenotypes are reported as γ and correlated between experiments (r=0.86). (D) Comparison of true and false-positive rates in single element screens. ‘Positives’ (n=1363 elements) were defined as genes with a K562 CRISPRi growth screen p-value <0.001 and γ<–0.05 (Horlbeck et al., 2016a), and ‘negatives’ were defined as non-targeting control sgRNA pairs (n=1011 elements). (E) Comparison of recombination rates for non-targeting dual-sgRNA elements between replicates of our K562 growth screen. Non-targeting elements with a growth phenotype (γ>0.05 or γ<−0.05) were excluded (n=973 elements). Recombination rates were weakly correlated between replicates (r=0.30). (f) Comparison of recombination rates for all dual-sgRNA elements between replicates of our K562 growth screen (n=20,387 elements). Recombination rates were strongly correlated between replicates (r=0.77). (G) Comparison of recombination rates and growth phenotypes for all dual-sgRNA elements in our K562 growth screen (n=20,387 elements). Growth phenotypes are reported as γ. Recombination rates were strongly anticorrelated with growth phenotypes (r=−0.84).
Figure 2 with 1 supplement
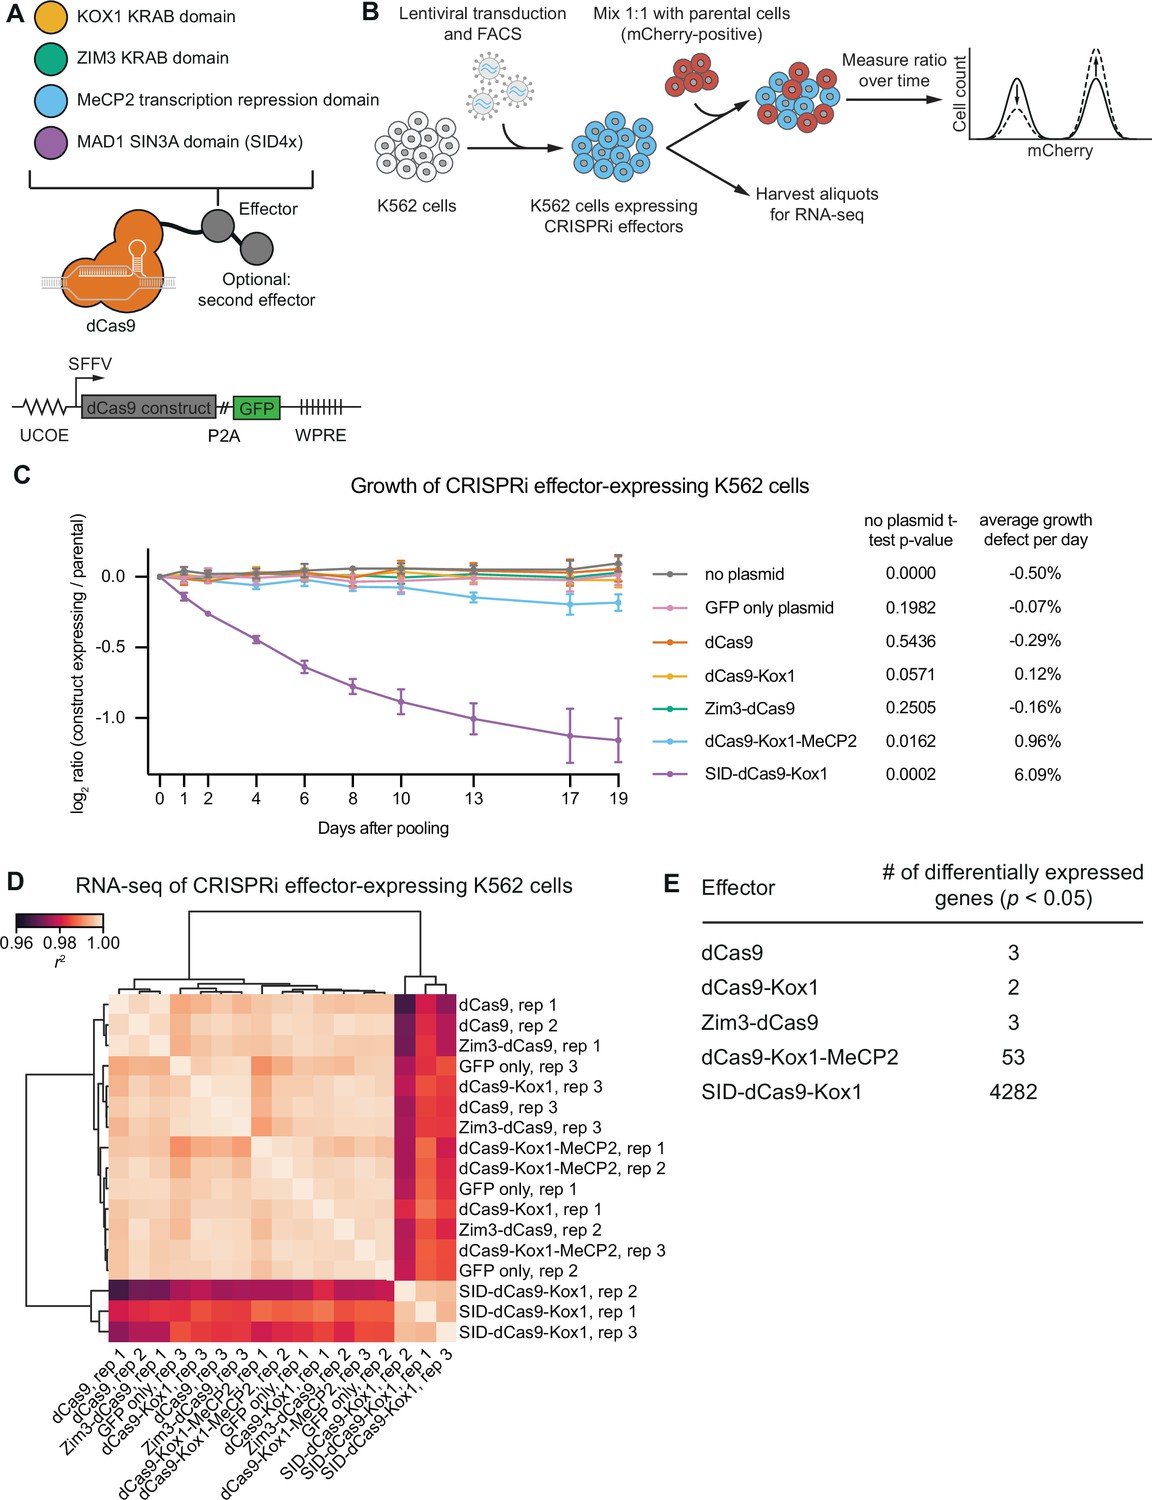
CRISPR interference (CRISPRi) effectors containing SID or MeCP2 domains have non-specific effects on cell viability and gene expression.
(A) Schematics of CRISPRi transcription repressor domains and general lentiviral expression construct used for all CRISPRi effectors. UCOE = ubiquitous chromatin opening element; SFFV = spleen focus-forming virus promoter; P2A = ribosomal skipping sequence; WPRE = woodchuck hepatitis virus post-transcriptional regulatory element. Further information on repressor domains and lentiviral expression constructs can be found in the main text and Materials and methods. (B) Experimental design to test effects of stable expression of each CRISPRi effector on growth and transcription in K562 cells. (C) Growth defects of effector-expressing cells, measured as the log2 of the ratio of mCherry-negative (effector-expressing) to mCherry-positive (not effector-expressing) cells in each well normalized to the same ratio on day 0. mCherry levels were measured for 19 days after pooling cells. Data represent mean ± SD from three independent transductions of expression constructs. p-Values are from an unpaired two-tailed t-test comparing D19 values for each sample to the D19 value for the ‘no plasmid’ sample. Average percent growth defect per day is the log2 D19 value divided by the number of days, multiplied by 100 for a percent value. (D) Clustered heatmap of correlation of transcript counts from K562 cells expressing indicated CRISPRi effectors or a GFP control. Correlations across samples were calculated using normalized counts (reads per million) for all genes with mean normalized count >1 and then clustered using the Ward variance minimization algorithm implemented in scipy. r2 is squared Pearson correlation. Data represent three independent transductions of expression constructs. (E) Number of differentially expressed genes (p<0.05) for cells expressing each effector versus cells expressing GFP only. p-Values were calculated using a Wald test and corrected for multiple hypothesis testing as implemented in DeSeq2.
-
Figure 2—source data 1
p-Values and growth defects depicted in Figure 2C.
- https://cdn.elifesciences.org/articles/81856/elife-81856-fig2-data1-v2.xlsx
-
Figure 2—source data 2
Data depicted in Figure 2E.
- https://cdn.elifesciences.org/articles/81856/elife-81856-fig2-data2-v2.xlsx
Figure 2—figure supplement 1
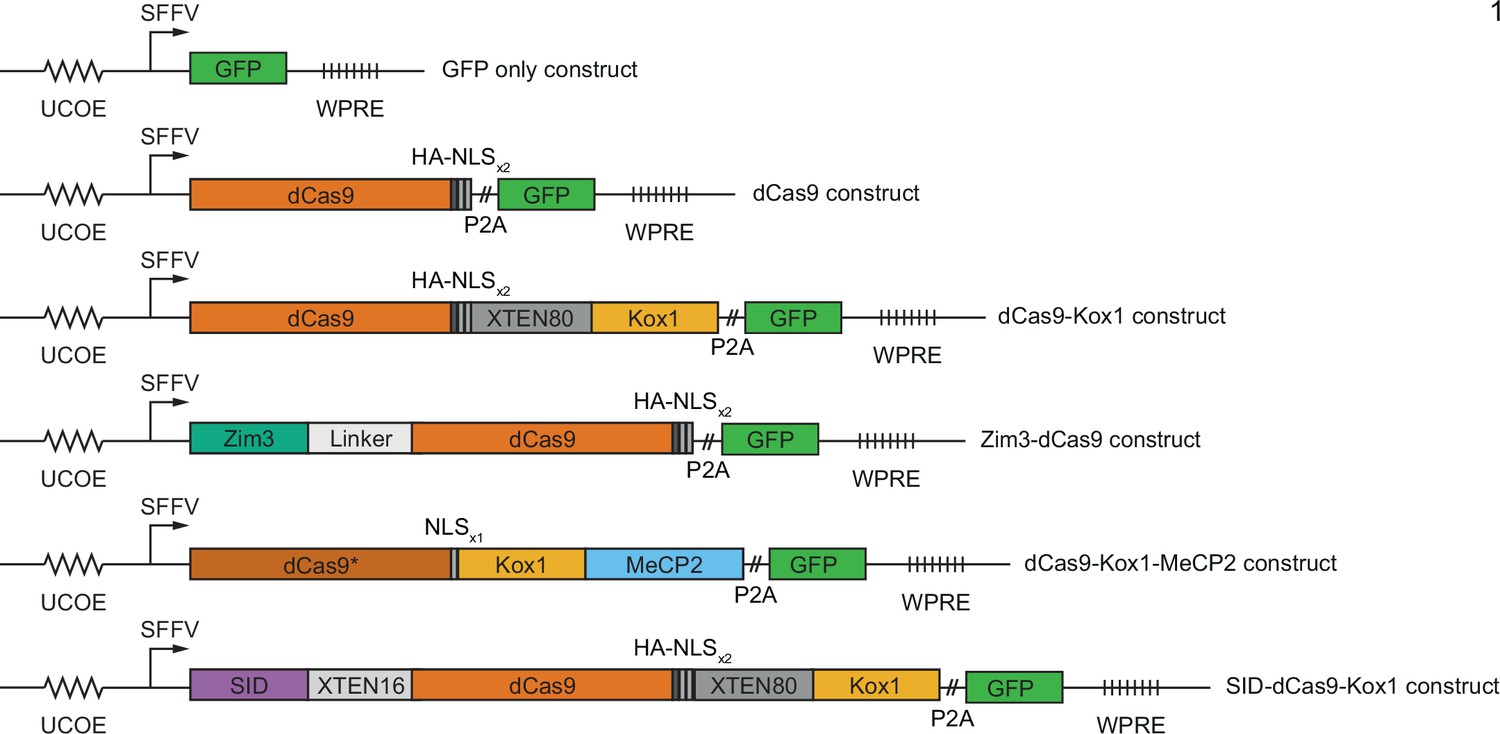
Design of constructs for CRISPR interference (CRISPRi) effector expression.
Figure 3 with 1 supplement
Zim3-dCas9 and dCas9-Kox1-MeCP2 mediate strongest knockdown.
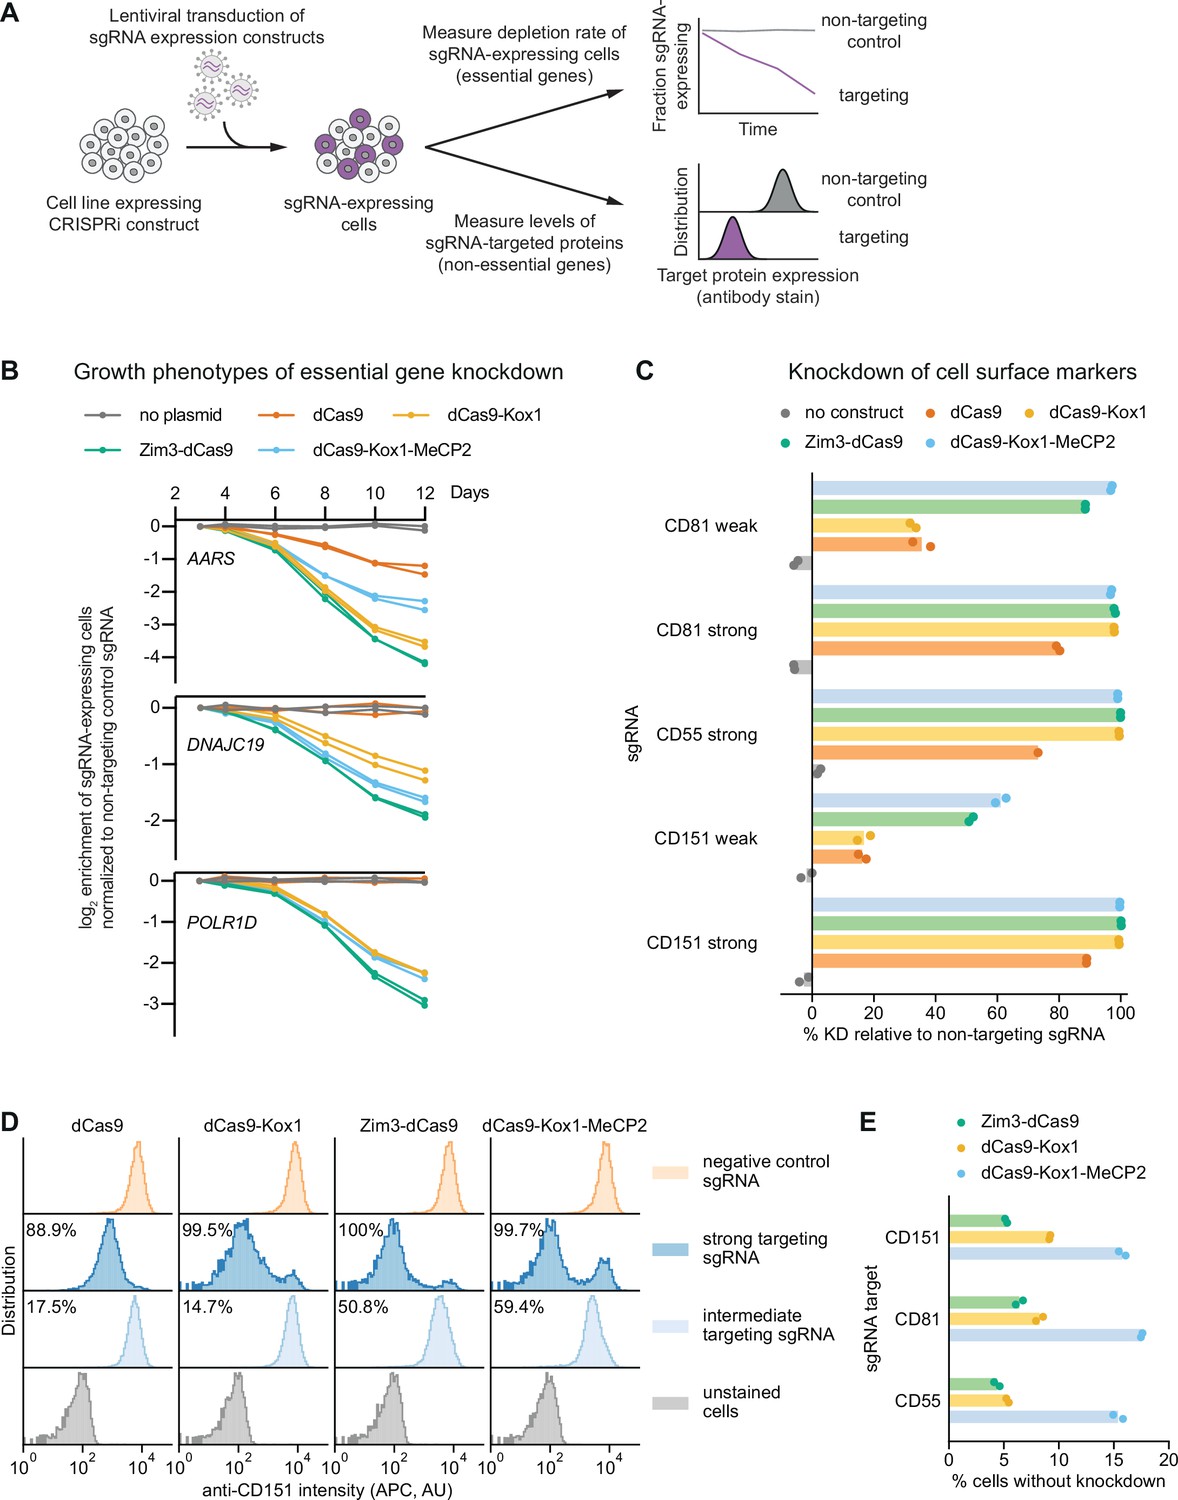
(A) Experimental design to measure knockdown mediated by different CRISPR interference (CRISPRi) effectors by delivering single guide RNAs (sgRNAs) targeting either essential genes or cell surface markers. (B) Depletion of K562 cells expressing essential gene-targeting sgRNAs and different CRISPRi effectors, measured as the ratio of mCherry-positive (sgRNA-expressing) to mCherry-negative (not sgRNA-expressing) cells in a given well. mCherry levels were measured for 12 days after transduction, starting on day 3. Data from two replicate transductions. (C) Percent knockdown of cell surface markers by different CRISPRi effectors in K562 cells. Cell surface marker levels were measured on day 6 post-transduction by staining with an APC-conjugated antibody. Knockdown was calculated as the ratio of median APC signal in sgRNA-expressing cells and median APC signal in cells expressing a non-targeting control sgRNA after subtraction of background APC signal. Data from two replicate transductions. Cells expressing dCas9 and a strong CD55-targeting sgRNA are represented by a single replicate. (D) Distribution of anti-CD151 signal intensity (APC) in individual cells from one representative transduction. Data from second replicate are shown in Figure 3—figure supplement 1B. Knockdown was quantified as in C as the ratio of the median APC signals. (E) Percentage of cells without observable knockdown despite expressing a strong sgRNA, as quantified from the fluorescence distributions.
Figure 3—figure supplement 1
Additional measurements of on-target activity of CRISPR interference (CRISPRi) effectors.
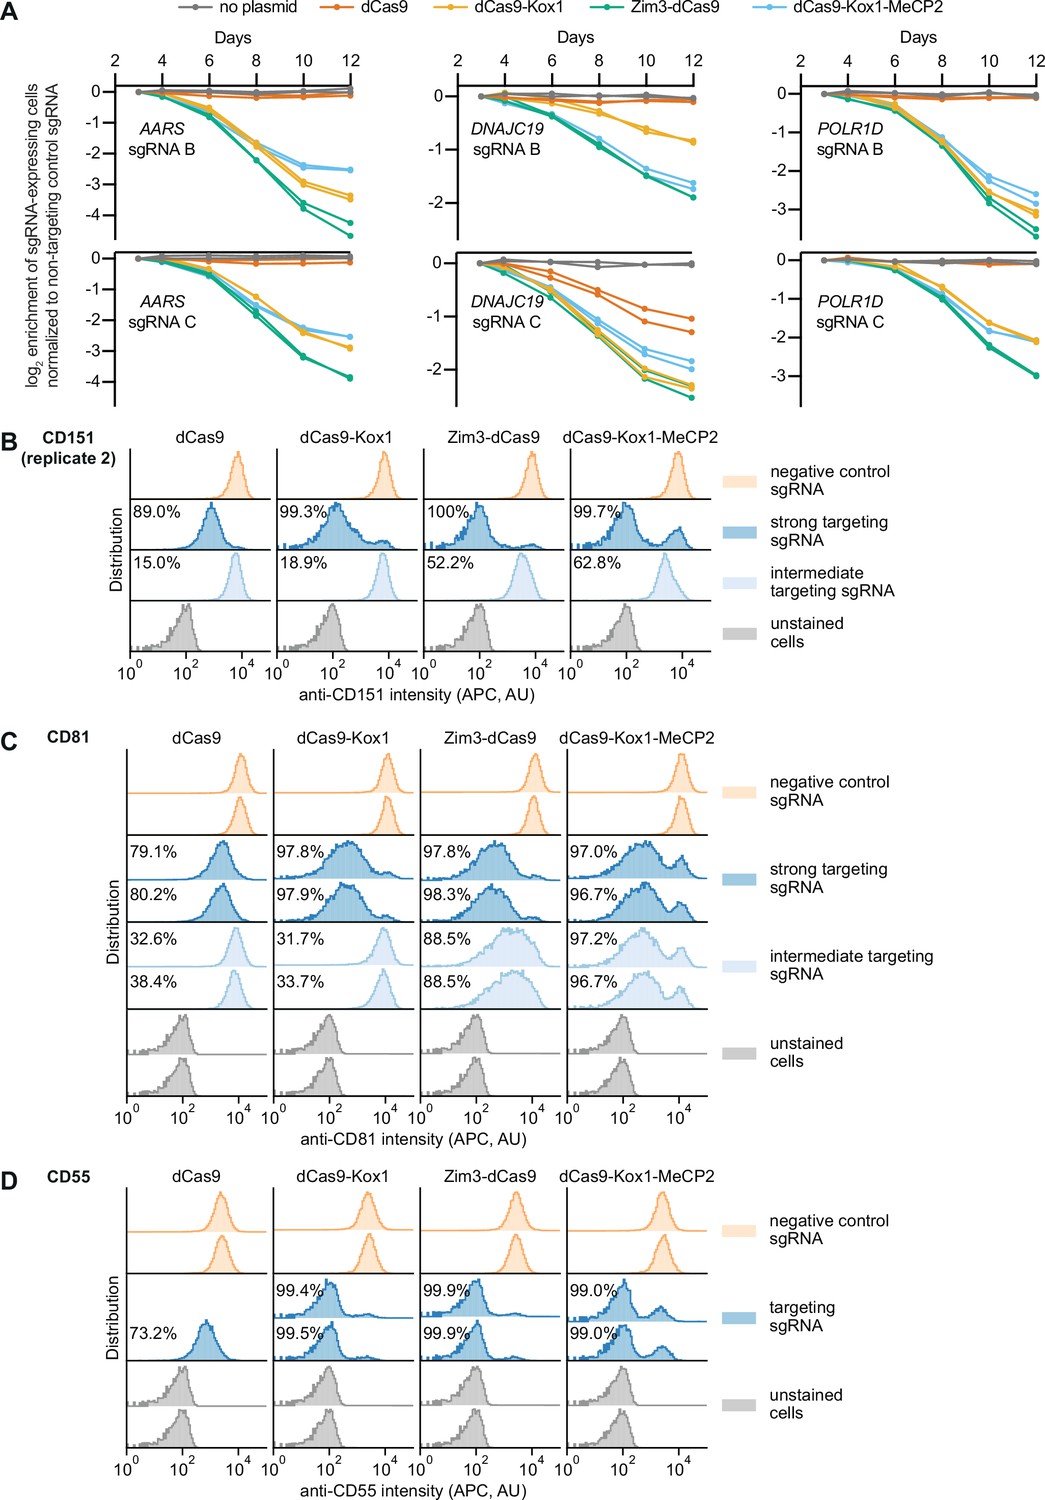
(A) Depletion of K562 cells expressing essential gene-targeting single guide RNAs (sgRNAs) and different CRISPRi effectors, measured as the ratio of mCherry-positive (sgRNA-expressing) to mCherry-negative (not sgRNA-expressing) cells in a given well, as in Figure 3A. mCherry levels were measured for 12 days after transduction, starting on day 3. Data from two replicate transductions. (B) Distribution of anti-CD151 signal intensity (APC) in K562 cells expressing indicated CRISPRi effectors from second replicate transduction. Knockdown was quantified as in Figure 3C. (C) Distribution of anti-CD81 signal intensity (APC) in K562 cells expressing indicated CRISPRi effectors from two replicate transductions. Knockdown was quantified as in Figure 3C. (D) Distribution of anti-CD55 signal intensity (APC) in K562 cells expressing indicated CRISPRi effectors from two replicate transductions. Cells expressing dCas9 and the CD55-targeting sgRNA are represented by a single replicate. Knockdown was quantified as in Figure 3C.
Figure 4 with 2 supplements
Validation of a suite of optimized Zim3-dCas9 cell lines.
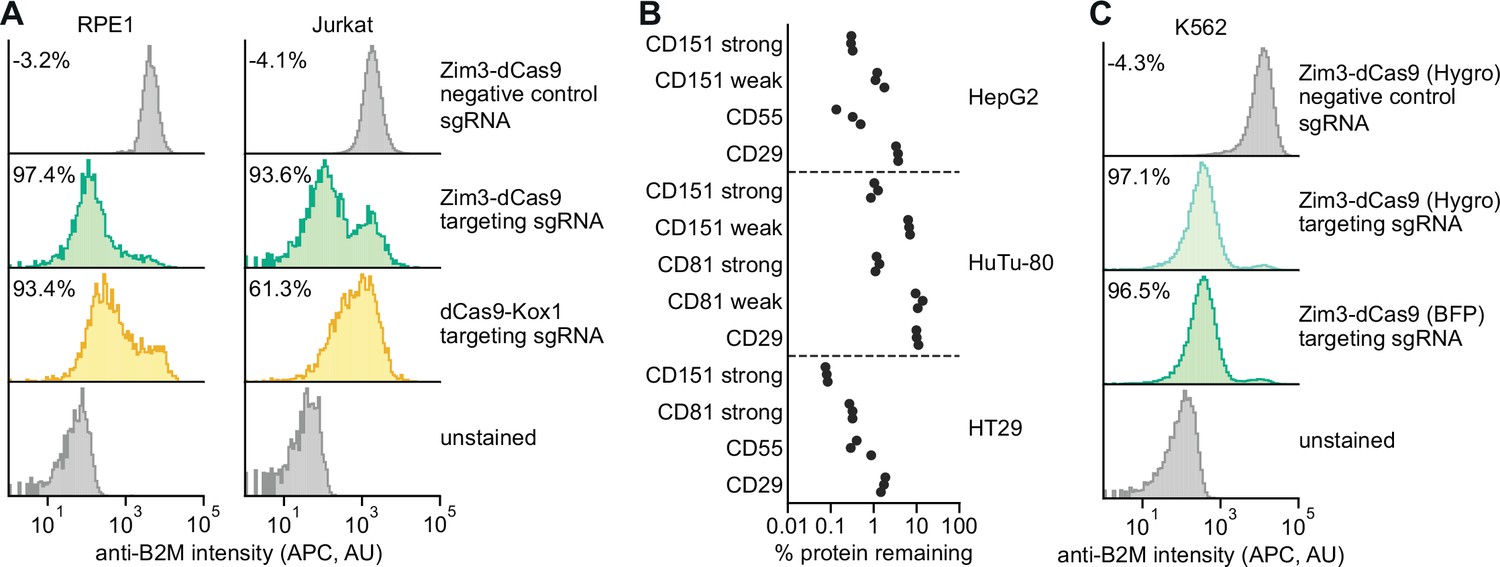
(A) Distribution of anti-B2M signal intensity (APC) in individual RPE1 (left) and Jurkat (right) cells expressing indicated CRISPR interference (CRISPRi) effectors and single guide RNAs (sgRNAs). Knockdown was calculated as the ratio of median APC signal in transduced (sgRNA-expressing) cells and median APC signal in non-transduced cells in the same well, after subtraction of background APC signal. (B) Depletion of indicated cell surface markers in HepG2 (top), HuTu-80 (middle), and HT29 (bottom) cells expressing Zim3-dCas9. Cell surface marker levels were measured 6–14 days post-transduction by staining with APC-conjugated antibodies. Knockdown was calculated as the ratio of median APC signal in sgRNA-expressing cells and median APC signal in cells expressing a non-targeting control sgRNA after subtraction of background APC signal. (C) Distribution of anti-B2M signal intensity (APC) in individual K562 cells expressing indicated CRISPRi effectors and sgRNAs. The Zim3-dCas9 (Hygro) cell line was generated by transduction followed by hygromycin selection and does not express a fluorescent protein. Knockdown was calculated as in A.
Figure 4—figure supplement 1
Single-cell distributions of knockdown in different Zim3-dCas9 cell lines.
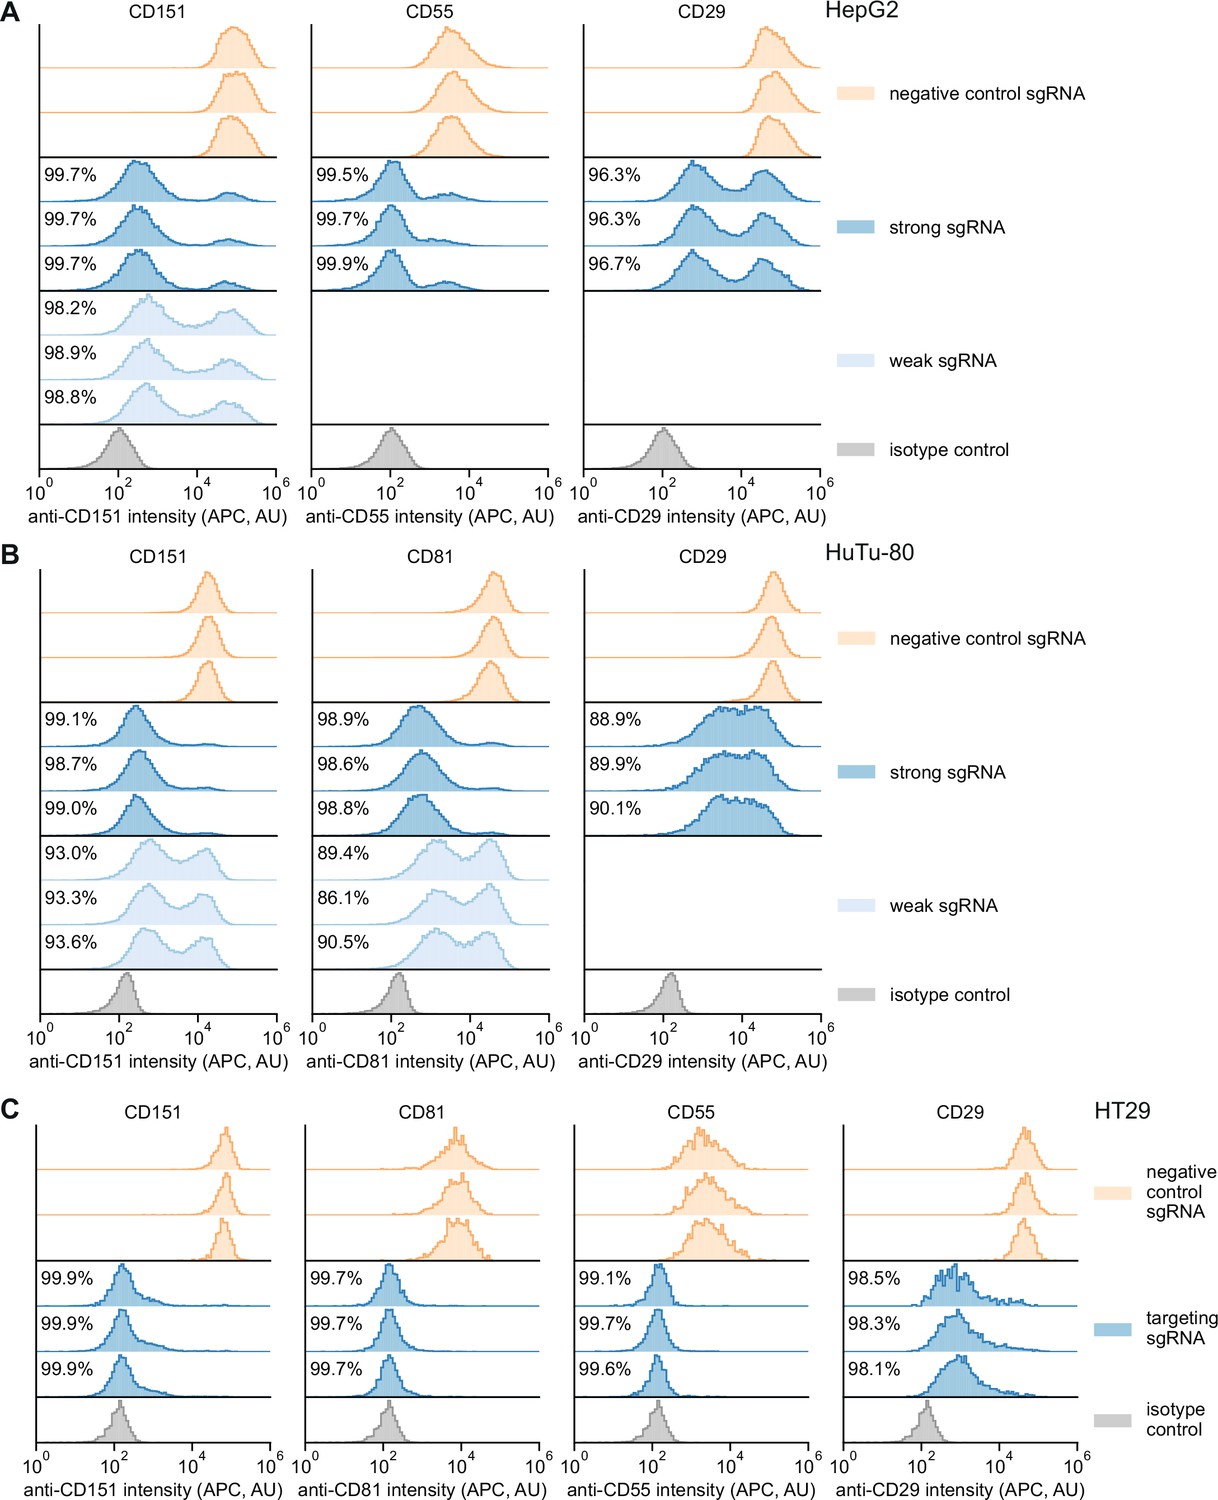
(A) Distribution of anti-CD151, anti-CD55, and anti-CD29 signal intensities (APC) in HepG2 cells expressing Zim3-dCas9. Data from three independent transductions are shown. A weak targeting single guide RNA (sgRNA) was only included for CD151. For the isotype control, cells expressing the negative control sgRNA were stained with an APC-conjugated isotype control antibody. A single replicate is shown for the isotype control. Knockdown was calculated as in Figure 4B. (B) Distribution of anti-CD151, anti-CD81, and anti-CD29 signal intensities (APC) in HuTu-80 cells expressing Zim3-dCas9. Data from three independent transductions are shown. A weak targeting sgRNA was only included for CD151 and CD81. For the isotype control, cells expressing the negative control sgRNA were stained with an APC-conjugated isotype control antibody. A single replicate is shown for the isotype control. Knockdown was calculated as in Figure 4B. (C) Distribution of anti-CD151, anti-CD81, anti-CD55, and anti-CD29 signal intensities (APC) in HT29 cells expressing Zim3-dCas9. Data from three independent transductions are shown. Only strong targeting sgRNAs were included. For the isotype control, cells expressing the negative control sgRNA were stained with an APC-conjugated isotype control antibody. A single replicate is shown for the isotype control. Knockdown was calculated as in Figure 4B.
Figure 4—figure supplement 2
Growth of different Zim3-dCas9-expressing cell lines.
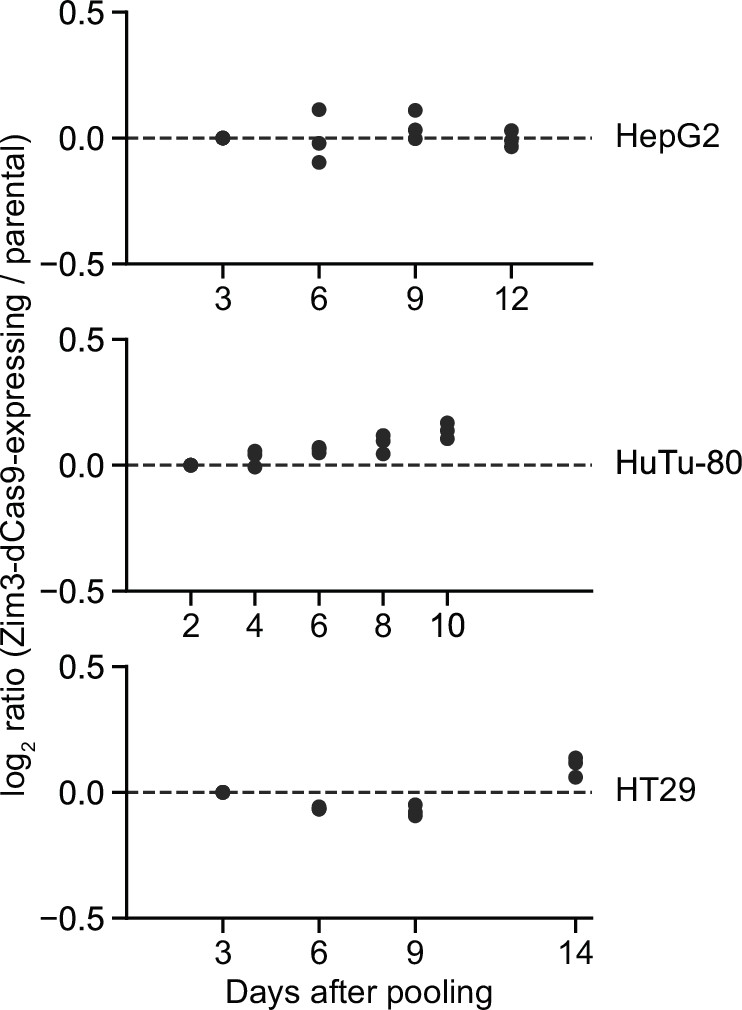
Growth rates of HepG2, HuTu-80, and HT29 cells expressing Zim3-dCas9, measured as the log2 of the ratio of BFP-negative (effector-expressing) to BFP-positive (not effector-expressing) cells normalized to the same ratio at the first measurement day. Data represent three independent mixtures of cells that were cultured in parallel. BFP levels dropped slightly over time in HuTu-80 cells, leading to the apparent increase in Zim3-dCas9-expressing cells.
Tables
Appendix 1—key resources table
| Reagent type (species) or resource | Designation | Source or reference | Identifiers | Additional information |
|---|---|---|---|---|
| Cell line (Human) | K562 CRISPRi (BFP) | This paper | N/A | Stable cell line with SFFV Zim3-dCas9 P2A BFP |
| Cell line (Human) | K562 CRISPRi (GFP) | This paper | N/A | Stable cell line with SFFV Zim3-dCas9 P2A GFP |
| Cell line (Human) | K562 CRISPRi (no fluorescent marker) | This paper | N/A | Stable cell line with SFFV Zim3-dCas9 P2A Hygro |
| Cell line (Human) | RPE1 CRISPRi (Zim3) | Replogle et al., 2022 | N/A | Stable cell line with SFFV Zim3-dCas9 P2A BFP |
| Cell line (Human) | Jurkat CRISPRi (Zim3) | This paper | N/A | Stable cell line with EF1alpha Zim3-dCas9 P2A mCherry |
| Cell line (Human) | HepG2 CRISPRi | This paper | N/A | Stable cell line with EF1alpha Zim3-dCas9 P2A mCherry |
| Cell line (Human) | HT29 CRISPRi | This paper | N/A | Stable cell line with EF1alpha Zim3-dCas9 P2A mCherry |
| Cell line (Human) | HuTu-80 CRISPRi | This paper | N/A | Stable cell line with EF1alpha Zim3-dCas9 P2A mCherry |
| Antibody | Anti-human CD55 (clone JS11, mouse monoclonal), APC | BioLegend | Cat#: 311311; RRID:AB_2075857 | Flow cytometry; 1:100 in PBS with 5% (v/v) FBS |
| Antibody | Anti-human CD81 (clone 5A6, mouse monoclonal), APC | BioLegend | Cat#: 349509; RRID:AB_2564020 | Flow cytometry; 1:100 in PBS with 5% (v/v) FBS |
| Antibody | Anti-human CD151 (clone 50–6, mouse monoclonal), APC | BioLegend | Cat#: 350405; RRID:AB_10661726 | Flow cytometry; 1:100 in PBS with 5% (v/v) FBS |
| Antibody | Anti-human CD29 (clone TS2/16, mouse monoclonal), APC | BioLegend | Cat#: 303007; RRID:AB_314323 | Flow cytometry; 1:100 in PBS with 5% (v/v) FBS |
| Antibody | Anti-human B2M (clone 2M2, mouse monoclonal), APC | BioLegend | Cat#: 316312; RRID:AB_10641281 | Flow cytometry; 1:100 in PBS with 5% (v/v) FBS |
| Antibody | Mouse IgG1, κ Isotype Ctrl (clone MOPC-21, mouse monoclonal), APC | BioLegend | Cat#: 981806 | Flow cytometry; 1:100 in PBS with 5% (v/v) FBS |
| Recombinant DNA reagent | Plasmid pJB120_pHR-UCOE-SFFV-EGFP | This paper | Addgene: 188900 | Further information in Supplementary file 7 |
| Recombinant DNA reagent | Plasmid pJB074_pHR-UCOE-SFFV-dCas9-HA-2xNLS-P2A-EGFP | This paper | Addgene: 188898 | Further information in Supplementary file 7 |
| Recombinant DNA reagent | Plasmid pJB069_pHR-UCOE-SFFV-Zim3-NLS-dCas9-HA-2xNLS-P2A-EGFP | This paper | Addgene: 188899 | Further information in Supplementary file 7 |
| Recombinant DNA reagent | Plasmid pCL63_pHR-UCOE-SFFV-SID4x-dCas9-HA-2xNLS-XTEN80-KRAB(Kox1)-P2A-EGFP | This paper | Addgene: 188901 | Further information in Supplementary file 7 |
| Recombinant DNA reagent | Plasmid pCL51_pHR-UCOE-SFFV-dCas9-NLS-KRAB(Kox1)-MeCP2-P2A-EGFP | This paper | Addgene: 188902 | Further information in Supplementary file 7 |
| Recombinant DNA reagent | Plasmid pCL35_pHR-UCOE-SFFV-dCas9-HA-2xNLS-XTEN80-KRAB(Kox1)-P2A-EGFP | This paper | Addgene: 188765 | Further information in Supplementary file 7 |
| Recombinant DNA reagent | Plasmid pAG389_pHR-UCOE-SFFV-Zim3-NLS-dCas9-HA-2xNLS-P2A-Hygro | This paper | Addgene: 188768 | Further information in Supplementary file 7 |
| Recombinant DNA reagent | Plasmid pNM1130_pHR-UCOE-EF1a-Zim3-NLS-dCas9-HA-2xNLS-loxP-P2A-EGFP-loxP | This paper | Addgene: 188773 | Further information in Supplementary file 7 |
| Recombinant DNA reagent | Plasmid pNM1129_pHR-UCOE-SFFV-Zim3-NLS-dCas9-HA-2xNLS-loxP-P2A-EGFP-loxP | This paper | Addgene: 188774 | Further information in Supplementary file 7 |
| Recombinant DNA reagent | Plasmid pNM1128_pHR-UCOE-EF1a-Zim3-NLS-dCas9-HA-2xNLS-mTagBFP2 | This paper | Addgene:188775 | Further information in Supplementary file 7 |
| Recombinant DNA reagent | Plasmid pNM1127_pHR-UCOE-SFFV-Zim3-NLS-dCas9-HA-2xNLS-mTagBFP2 | This paper | Addgene: 188776 | Further information in Supplementary file 7 |
| Recombinant DNA reagent | Plasmid pNM1125_pHR-UCOE-EF1a-Zim3-NLS-dCas9-HA-2xNLS-P2A-mTagBFP2 | This paper | Addgene:188777 | Further information in Supplementary file 7 |
| Recombinant DNA reagent | Plasmid pNM1124_pHR-UCOE-EF1a-Zim3-NLS-dCas9-HA-2xNLS-P2A-EGFP | This paper | Addgene: 188778 | Further information in Supplementary file 7 |
| Recombinant DNA reagent | Plasmid pNM1123_pHR-UCOE-SFFV-Zim3-NLS-dCas9-HA-2xNLS-P2A-mCherry | This paper | Addgene: 188779 | Further information in Supplementary file 7 |
| Recombinant DNA reagent | Plasmid pJB109_pHR-UCOE-EF1a-Zim3-NLS-dCas9-HA-2xNLS-P2A-mCherry | This paper | Addgene: 188766 | Further information in Supplementary file 7 |
| Recombinant DNA reagent | Plasmid pJB108_pHR-UCOE-SFFV-Zim3-NLS-dCas9-HA-2xNLS-P2A-mTagBFP2 | This paper | Addgene: 188767 | Further information in Supplementary file 7 |
| Recombinant DNA reagent | Plasmid pRAP0006_pHR-UCOE-EF1a-dCas9-HA-2xNLS-XTEN80-KRAB(Kox1)-IRES-mCherry | This paper | Addgene: 188769 | Further information in Supplementary file 7 |
| Recombinant DNA reagent | Plasmid pRAP0003_pHR-UCOE-SFFV-dCas9-HA-2xNLS-XTEN80-KRAB(Kox1)-IRES-mCherry | This paper | Addgene: 188770 | Further information in Supplementary file 7 |
| Recombinant DNA reagent | Plasmid pCL75_pHR-UCOE-EFS-dCas9-HA-2xNLS-XTEN80-KRAB(Kox1)-P2A-EGFP | This paper | Addgene: 188771 | Further information in Supplementary file 7 |
| Recombinant DNA reagent | Plasmid pCL74_pHR-UCOE-CMV-dCas9-HA-2xNLS-XTEN80-KRAB(Kox1)-P2A-EGFP | This paper | Addgene: 188772 | Further information in Supplementary file 7 |
| Recombinant DNA reagent | Plasmid pCRISPRia-v2 (parent vector) | DOI: 10.7554/eLife.19760 | Addgene: 84832 | |
| Recombinant DNA reagent | Plasmid pU6-sgRNA EF1alpha-puro-T2A-mCherry | This paper | Addgene: 188780 | Further information in Supplementary file 7 |
| Recombinant DNA reagent | pJR98 | This paper | Addgene: 187239 | CR3 constant region – hU6 sgRNA promoter flanked by BsmBI sites. Further information in Supplementary file 7 |
| Recombinant DNA reagent | pJR100 | This paper | Addgene: 187240 | Lentiviral sgRNA vector for Perturb-seq with mU6 sgRNA promoter, CR1 constant region with CS1 capture sequence in stem loop, and UCOE EF1alpha driving PURO-BFP marker expression. Further information in Supplementary file 7 |
| Recombinant DNA reagent | pJR101 | DOI: 10.1016/j.cell.2022.05.013/this paper | Addgene: 187241 | Lentiviral sgRNA vector for Perturb-seq with mU6 sgRNA promoter, CR1 constant region with CS1 capture sequence in stem loop, and UCOE EF1alpha driving PURO-GFP marker expression. Further information in Supplementary file 7 |
| Recombinant DNA reagent | pJR103 | This paper | Addgene: 187242 | Lentiviral sgRNA vector with mU6 sgRNA promoter, CR1 constant region, and UCOE EF1alpha driving PURO-BFP marker expression. Further information in Supplementary file 7 |
| Recombinant DNA reagent | pJR104 | This paper | Addgene: 187243 | Lentiviral sgRNA vector with mU6 sgRNA promoter, CR1 constant region, and UCOE EF1alpha driving PURO-GFP marker expression. Further information in Supplementary file 7 |
| Recombinant DNA reagent | pJR106 | This paper | Addgene: 187244 | Lentiviral sgRNA vector for CROP-seq with mU6 sgRNA promoter, CR1 constant region, and UCOE EF1alpha driving PURO-BFP marker expression. Further information in Supplementary file 7 |
| Recombinant DNA reagent | pJR107 | This paper | Addgene: 187245 | Lentiviral sgRNA vector for CROP-seq with mU6 sgRNA promoter, CR1 constant region, and UCOE EF1alpha driving PURO-GFP marker expression. Further information in Supplementary file 7 |
| Commercial assay or kit | Direct-zol RNA Miniprep | Zymo Research | Cat#: R2051 | |
| Commercial assay or kit | Qubit RNA Broad Range (BR) Kit | Thermo Fisher Scientific | Cat#: Q10211 | |
| Commercial assay or kit | NucleoSpin Blood kit (XL or L) | Macherey-Nagel | Cat#: 740950 (XL) or 740954 (L) | Purification of genomic DNA from cell pellets |
| Commercial assay or kit | NEBNext Ultra II Q5 PCR MasterMix | NEB | Cat#: M0544 | PCR amplification of dual-sgRNA elements from genomic DNA |
| Other | TransIT-LT1 Transfection Reagent | Mirus Bio | Cat#: MIR 2300 | Transfection reagent for lentivirus production |
| Software, algorithm | Python scripts to count dual-sgRNA elements in sequencing data and remove recombined elements | This paper | N/A | https://github.com/josephreplogle/CRISPRi-dual-sgRNA-screens, Replogle, 2022 |
| Sequence-based reagent | Sequences of individual sgRNAs to target benchmarking genes | This paper | N/A | Sequences listed in Supplementary file 8 |
| Sequence-based reagent | Library dJR004, Pilot genome-wide single-sgRNA human CRISPRi library | This paper | N/A | sgRNA targeting sequences in Supplementary file 1 |
| Sequence-based reagent | Library dJR020, Pilot genome-wide dual-sgRNA human CRISRi library | This paper | N/A | sgRNA targeting sequences in Supplementary file 1 |
| Sequence-based reagent | Library dJR072, Final genome-wide, sgRNA 1+2, dual-sgRNA human CRISPRi library with UMIs | This paper | Addgene: 187246 | sgRNA targeting sequences in Supplementary file 4 |
| Sequence-based reagent | Library dJR073, Final genome-wide, sgRNA 3+4, dual-sgRNA human CRISPRi library with UMIs | This paper | Addgene: 187247 | sgRNA targeting sequences in Supplementary file 4 |
| Sequence-based reagent | Library dJR074, Final genome-wide, sgRNA 5+6, dual-sgRNA human CRISPRi library with UMIs | This paper | Addgene: 187248 | sgRNA targeting sequences in Supplementary file 4 |
| Sequence-based reagent | Library dJR075, Final genome-wide, sgRNA 1+2, dual-sgRNA human CRISPRa library with UMIs | This paper | Addgene: 187249 | sgRNA targeting sequences in Supplementary file 9 |
| Sequence-based reagent | Library dJR076, Final genome-wide, sgRNA 3+4, dual-sgRNA human CRISPRa library with UMIs | This paper | Addgene: 187250 | sgRNA targeting sequences in Supplementary file 9 |
| Sequence-based reagent | Library dJR077, Final genome-wide, sgRNA 5+6, dual-sgRNA human CRISPRa library with UMIs | This paper | Addgene: 187251 | sgRNA targeting sequences in Supplementary file 9 |
Additional files
-
Supplementary file 1
Table with dual- and single-single guide RNA (sgRNA) sequences used for preliminary comparison.
- https://cdn.elifesciences.org/articles/81856/elife-81856-supp1-v2.xlsx
-
Supplementary file 2
Table with read counts and growth phenotypes from pilot screen.
- https://cdn.elifesciences.org/articles/81856/elife-81856-supp2-v2.csv
-
Supplementary file 3
Table with aggregated CRISPR interference (CRISPRi) single guide RNA (sgRNA) performance across screens.
- https://cdn.elifesciences.org/articles/81856/elife-81856-supp3-v2.xlsx
-
Supplementary file 4
Table with finalized dual-single guide RNA (sgRNA) human CRISPR interference (CRISPRi) libraries.
- https://cdn.elifesciences.org/articles/81856/elife-81856-supp4-v2.xlsx
-
Supplementary file 5
List of integration barcodes.
- https://cdn.elifesciences.org/articles/81856/elife-81856-supp5-v2.xlsx
-
Supplementary file 6
Table with Dolcetto versus dual-single guide RNA (sgRNA) Perturb-seq comparison.
- https://cdn.elifesciences.org/articles/81856/elife-81856-supp6-v2.xlsx
-
Supplementary file 7
Table of plasmids.
- https://cdn.elifesciences.org/articles/81856/elife-81856-supp7-v2.xlsx
-
Supplementary file 8
Table with sequences of single guide RNAs (sgRNAs) used for individual validation.
- https://cdn.elifesciences.org/articles/81856/elife-81856-supp8-v2.xlsx
-
Supplementary file 9
Table with dual-single guide RNA (sgRNA) human CRISPR activation (CRISPRa) libraries.
- https://cdn.elifesciences.org/articles/81856/elife-81856-supp9-v2.xlsx
-
Supplementary file 10
Table with in silico dual-single guide RNA (sgRNA) mouse CRISPR interference (CRISPRi) libraries.
- https://cdn.elifesciences.org/articles/81856/elife-81856-supp10-v2.xlsx
-
Supplementary file 11
Table with in silico dual-single guide RNA (sgRNA) mouse CRISPR activation (CRISPRa) libraries.
- https://cdn.elifesciences.org/articles/81856/elife-81856-supp11-v2.xlsx
-
Supplementary file 12
Table with dual-single guide RNA (sgRNA) human CRISPR interference (CRISPRi) library targeting DepMap Common Essential genes.
- https://cdn.elifesciences.org/articles/81856/elife-81856-supp12-v2.csv
-
MDAR checklist
- https://cdn.elifesciences.org/articles/81856/elife-81856-mdarchecklist1-v2.docx
Download links
A two-part list of links to download the article, or parts of the article, in various formats.
Downloads (link to download the article as PDF)
Open citations (links to open the citations from this article in various online reference manager services)
Cite this article (links to download the citations from this article in formats compatible with various reference manager tools)
Maximizing CRISPRi efficacy and accessibility with dual-sgRNA libraries and optimal effectors
eLife 11:e81856.
https://doi.org/10.7554/eLife.81856


