Predictive performance of multi-model ensemble forecasts of COVID-19 across European nations
- London School of Hygiene & Tropical Medicine, United Kingdom
- European Centre for Disease Prevention and Control (ECDC), Sweden
- Karlsruhe Institute of Technology, Germany
- Robert Koch Institute, Germany
- University of Massachusetts Amherst, United States
- Boston Children’s Hospital and Harvard Medical School, United States
- Third Faculty of Medicine, Charles University, Czech Republic
- Ecole Polytechnique Federale de Lausanne, Switzerland
- Éducation nationale, France
- Eidgenossische Technische Hochschule, Switzerland
- Forschungszentrum Jülich GmbH, Germany
- Frankfurt Institute for Advanced Studies, Germany
- Fraunhofer Institute for Industrial Mathematics, Germany
- Heidelberg University, Germany
- Helmholtz Centre for Infection Research, Germany
- IEM, Inc, United States
- Independent researcher, Austria
- Independent researcher, United States
- Institut d’Investigacions Biomèdiques August Pi i Sunyer, Universitat Pompeu Fabra, Spain
- Institute of Computer Science of the CAS, Czech Republic
- Institute of Information Theory and Automation of the CAS, Czech Republic
- Inverence, Spain
- Los Alamos National Laboratory, United States
- LUMSA University, Italy
- Masaryk University, Czech Republic
- Massachusetts Institute of Technology, United States
- Max-Planck-Institut für Dynamik und Selbstorganisation, Germany
- Medical University of Gdansk, Poland
- Paul Scherrer Institute, Switzerland
- Politecnico di Milano, Italy
- Technical University of Kaiserlautern, Germany
- Technische Universität Ilmenau, Germany
- Universidad Carlos III de Madrid, Spain
- Universidad Nacional de Educación a Distancia (UNED), Spain
- Universitat de Barcelona, Spain
- Universitat Politècnica de Catalunya, Spain
- Universitat Trier, Germany
- University of Cologne, Germany
- University of Halle, Germany
- University of Ljubljana, Slovenia
- University of Milano-Bicocca, Italy
- University of Molise, Italy
- University of Oxford, United Kingdom
- University of Palermo, Italy
- University of Pavia, Italy
- University of Perugia, Italy
- University of Rome "La Sapienza", Italy
- University of Rome "Tor Vergata", Italy
- University of Southern California, United States
- University of Sydney, Australia
- University of Virginia, United States
- University of Warsaw, Poland
- University of Bialystok, Poland
- University of Wroclaw, Poland
- Universtät Leipzig, Germany
- Warsaw University of Technology, Poland
- Wroclaw University of Science and Technology, Poland
Figures
Figure 1
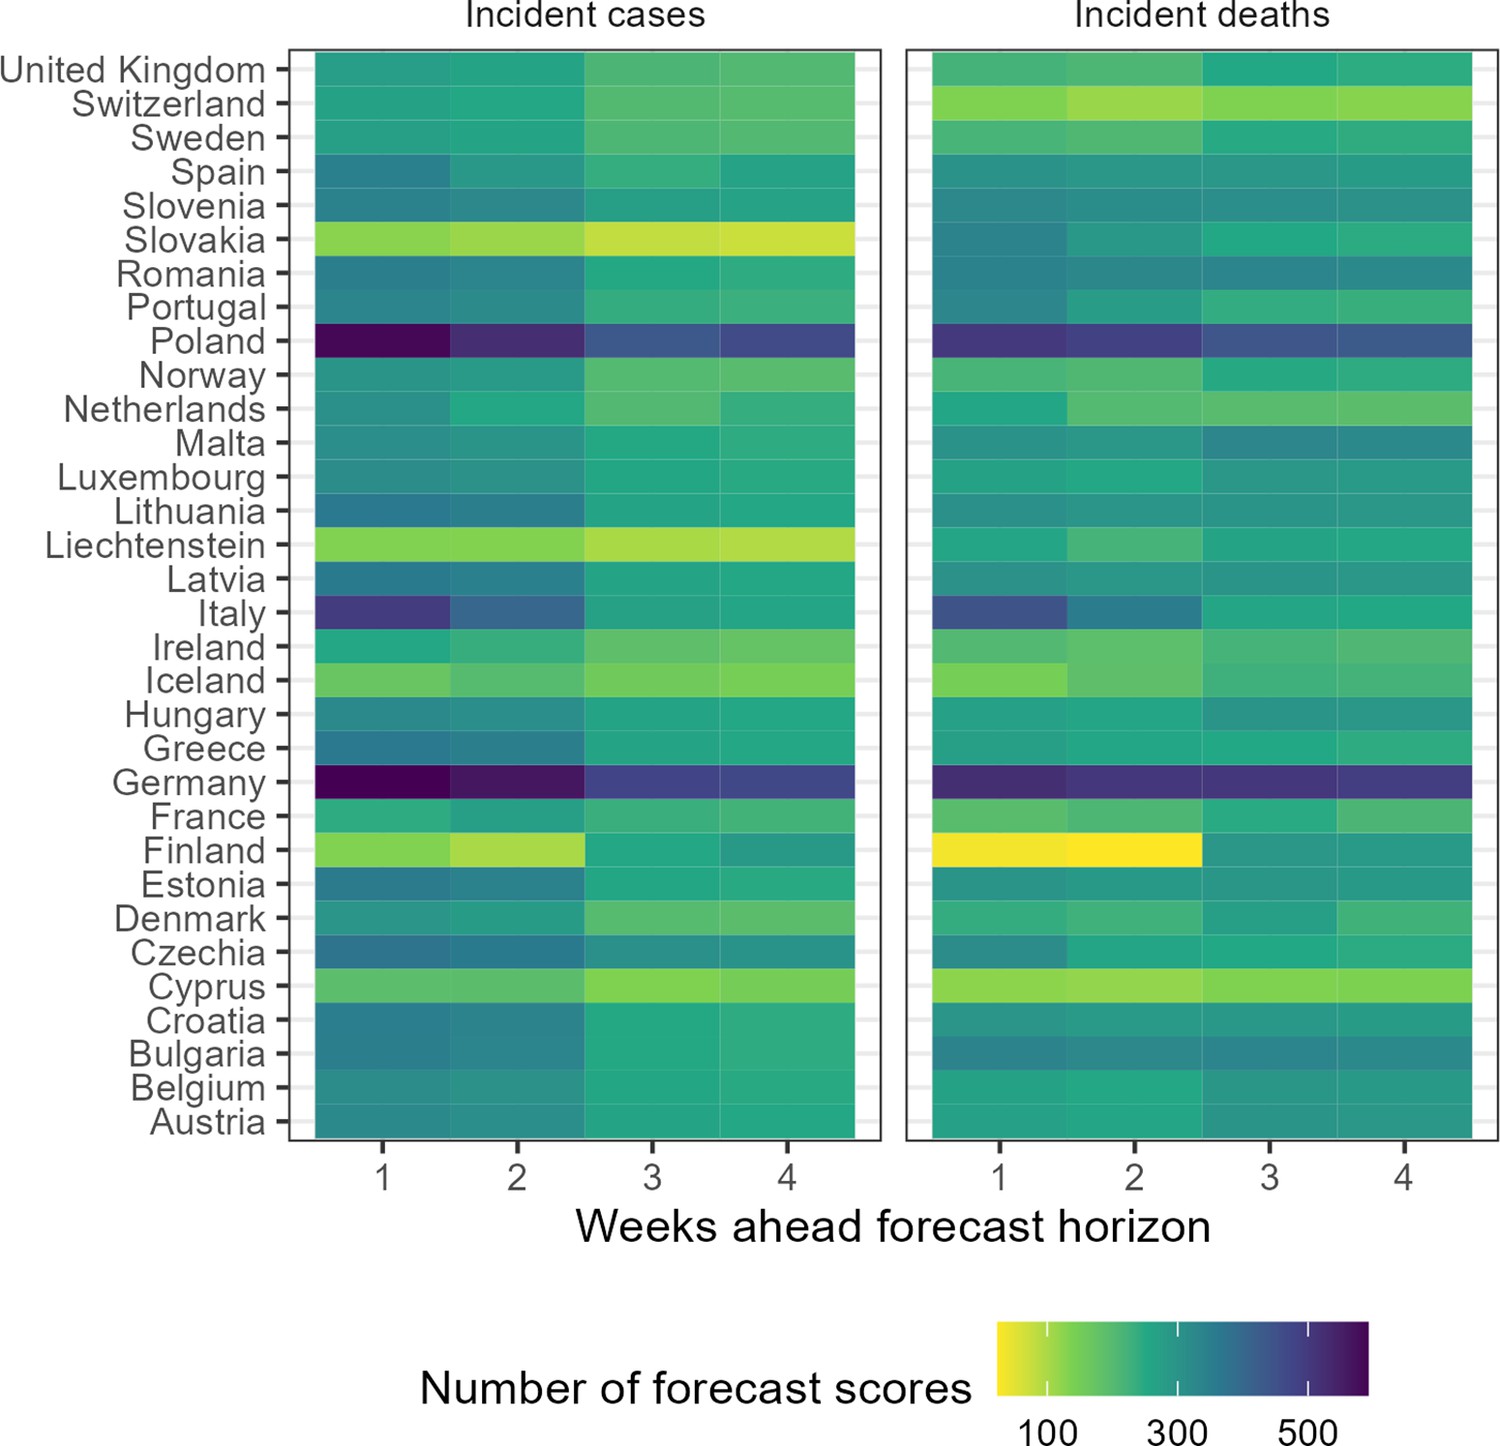
Total number of forecasts included in evaluation, by target location, week ahead horizon, and variable.
Figure 2

Ensemble forecasts of weekly incident cases in Germany over periods of increasing SARS-CoV-2 variants Delta (B.1.617.2, left) and Omicron (B.1.1.529, right).
Black indicates observed data. Coloured ribbons represent each weekly forecast of 1–4 weeks ahead (showing median, 50%, and 90% probability). For each variant, forecasts are shown over an x-axis bounded by the earliest dates at which 5% and 99% of sequenced cases were identified as the respective variant of concern, while vertical dotted lines indicate the approximate date that the variant reached dominance (>50% sequenced cases).
Figure 3

Performance of short-term forecasts aggregated across all individually submitted models and the Hub ensemble, by horizon, forecasting cases (left) and deaths (right).
Performance measured by relative weighted interval score scaled against a baseline (dotted line, 1), and coverage of uncertainty at the 50% and 95% levels. Boxplot, with width proportional to number of observations, show interquartile ranges with outlying scores as faded points. The target range for each set of scores is shaded in yellow.
Figure 4
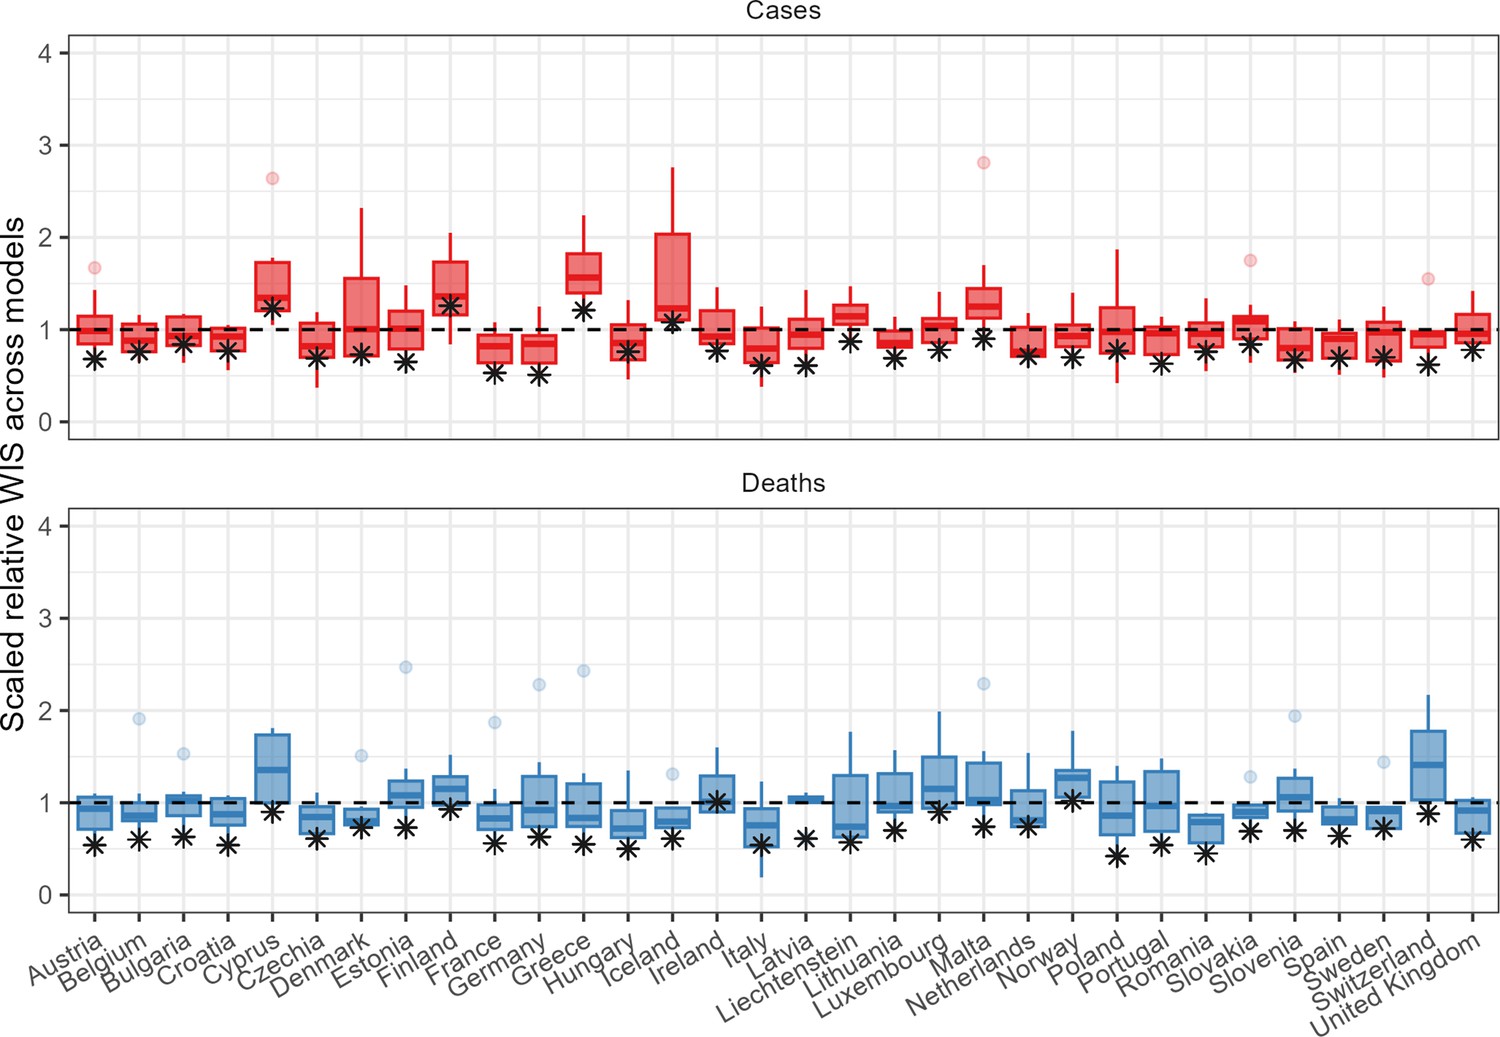
Performance of short-term forecasts across models and median ensemble (asterisk), by country, forecasting cases (top) and deaths (bottom) for 2-week ahead forecasts, according to the relative weighted interval score.
Boxplots show interquartile ranges, with outliers as faded points, and the ensemble model performance is marked by an asterisk. y-axis is cut-off to an upper bound of 4 for readability.
Tables
Table 1
Predictive performance of main ensembles, as measured by the mean ratio of interval scores against the baseline ensemble.
| Horizon | Weighted mean | Weighted median | Unweighted mean | Unweighted median |
|---|---|---|---|---|
| Cases | ||||
| 1 week | 0.63 | 0.64 | 0.61 | 0.64 |
| 2 weeks | 0.72 | 0.71 | 0.69 | 0.69 |
| 3 weeks | 0.82 | 0.76 | 0.82 | 0.72 |
| 4 weeks | 1.07 | 0.86 | 1.12 | 0.78 |
| Deaths | ||||
| 1 week | 0.65 | 0.61 | 1.81 | 0.61 |
| 2 weeks | 0.58 | 0.54 | 1.29 | 0.54 |
| 3 weeks | 0.64 | 0.57 | 1.17 | 0.53 |
| 4 weeks | 0.82 | 0.67 | 0.84 | 0.62 |
Additional files
-
Supplementary file 1
EPIFORGE reporting guidelines Completed checklist following reporting guidelines on epidemic forecasting research.
- https://cdn.elifesciences.org/articles/81916/elife-81916-supp1-v2.csv
-
Supplementary file 2
Participating team metadata Team metadata for teams participating in the European Forecast Hub and evaluated in this study.
- https://cdn.elifesciences.org/articles/81916/elife-81916-supp2-v2.csv
-
MDAR checklist
- https://cdn.elifesciences.org/articles/81916/elife-81916-mdarchecklist1-v2.pdf
Download links
A two-part list of links to download the article, or parts of the article, in various formats.
Downloads (link to download the article as PDF)
Open citations (links to open the citations from this article in various online reference manager services)
Cite this article (links to download the citations from this article in formats compatible with various reference manager tools)
Predictive performance of multi-model ensemble forecasts of COVID-19 across European nations
eLife 12:e81916.
https://doi.org/10.7554/eLife.81916


