Mechanical basis and topological routes to cell elimination
- Division of Engineering and Applied Science, California Institute of Technology, United States
- Niels Bohr Institute, University of Copenhagen, Denmark
Figures
Figure 1
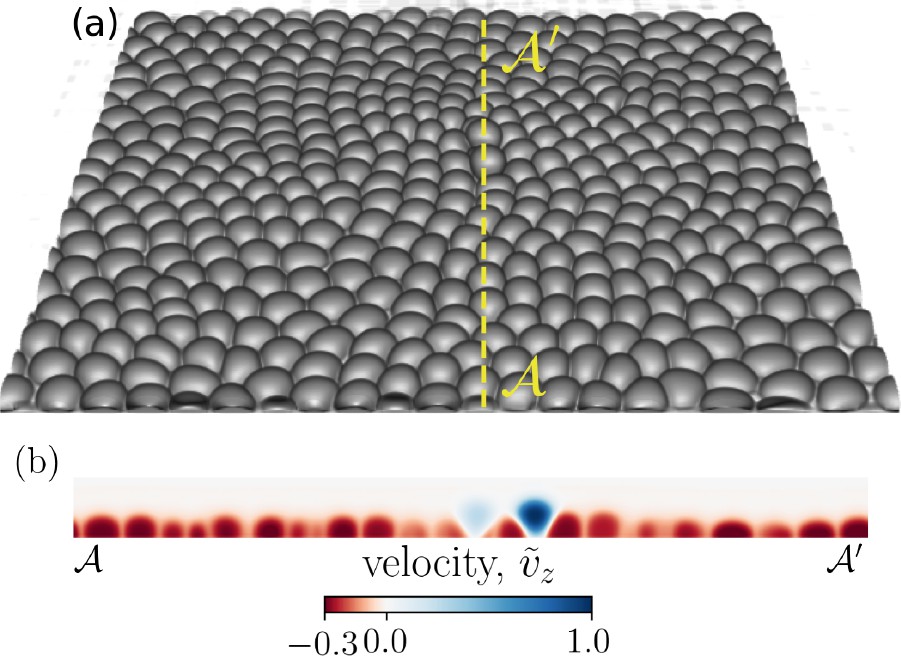
Cell extrusion in a 3D representation of a confluent cell layer.
(a) A representative simulation snapshot (cell–substrate adhesion and relative cell–cell adhesion ) of a three-dimensional cell monolayer. Two cells are visibly extruding. (b) A cross-section (dotted yellow line ) of the cell monolayer highlighting the two extruding cells via the normalized out-of-plane velocity (), where is the maximum value of the vz component of the velocity field in the shown cross-section.
Figure 2

Nematic and hexatic disclinations govern cell extrusion.
A representative analysis corresponding to the configuration shown in Figure 1a and projected into plane (, i.e., the basal side). (a) A coarse-grained director field with coarse-graining length of one cell size and +1/2 (filled circles with the line indicating orientation) and -1/2 (three connected lines with threefold symmetry) nematic defects. (b) Number of neighbors for each cell, including fivefold and sevenfold disclinations mapped into the monolayer. The symbol + denotes the center of mass for two extruding cells. (c, d) Probability densities of the normalized minimum distance between extruding cells and the nearest ±1/2 defect, , for varying cell–cell to cell–substrate adhesion ratios for (c) -1/2 and (d) +1/2 topological defects (inset: distribution mean vs. ). (e) The probability density of average coordination number for an extruding cell during , where denotes extrusion time, and for varying cell–substrate to cell–cell adhesion ratios . The data in (c–e) corresponds to four different realizations.
Figure 3
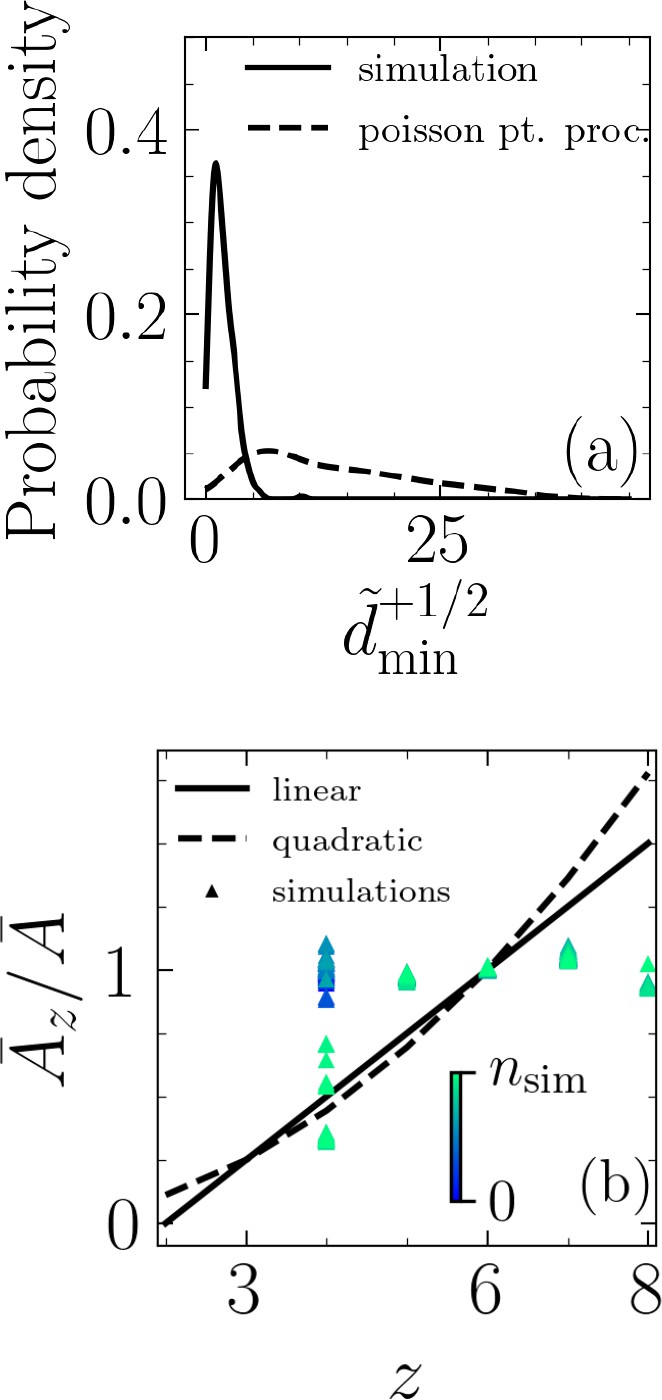
Topological, rather than geometrical, route to cell extrusion.
(a) Probability density functions for normalized minimum distance between an extrusion event and a +1/2 defect, , based on simulation results and randomly generated through a Poisson point process and for . (b) Comparison of Lewis’s linear and quadratic relations with our simulations. is the average area for cells with neighbors and is the average area of all cells. The color bar indicates simulation time step, and the data correspond to the case and .
Figure 4
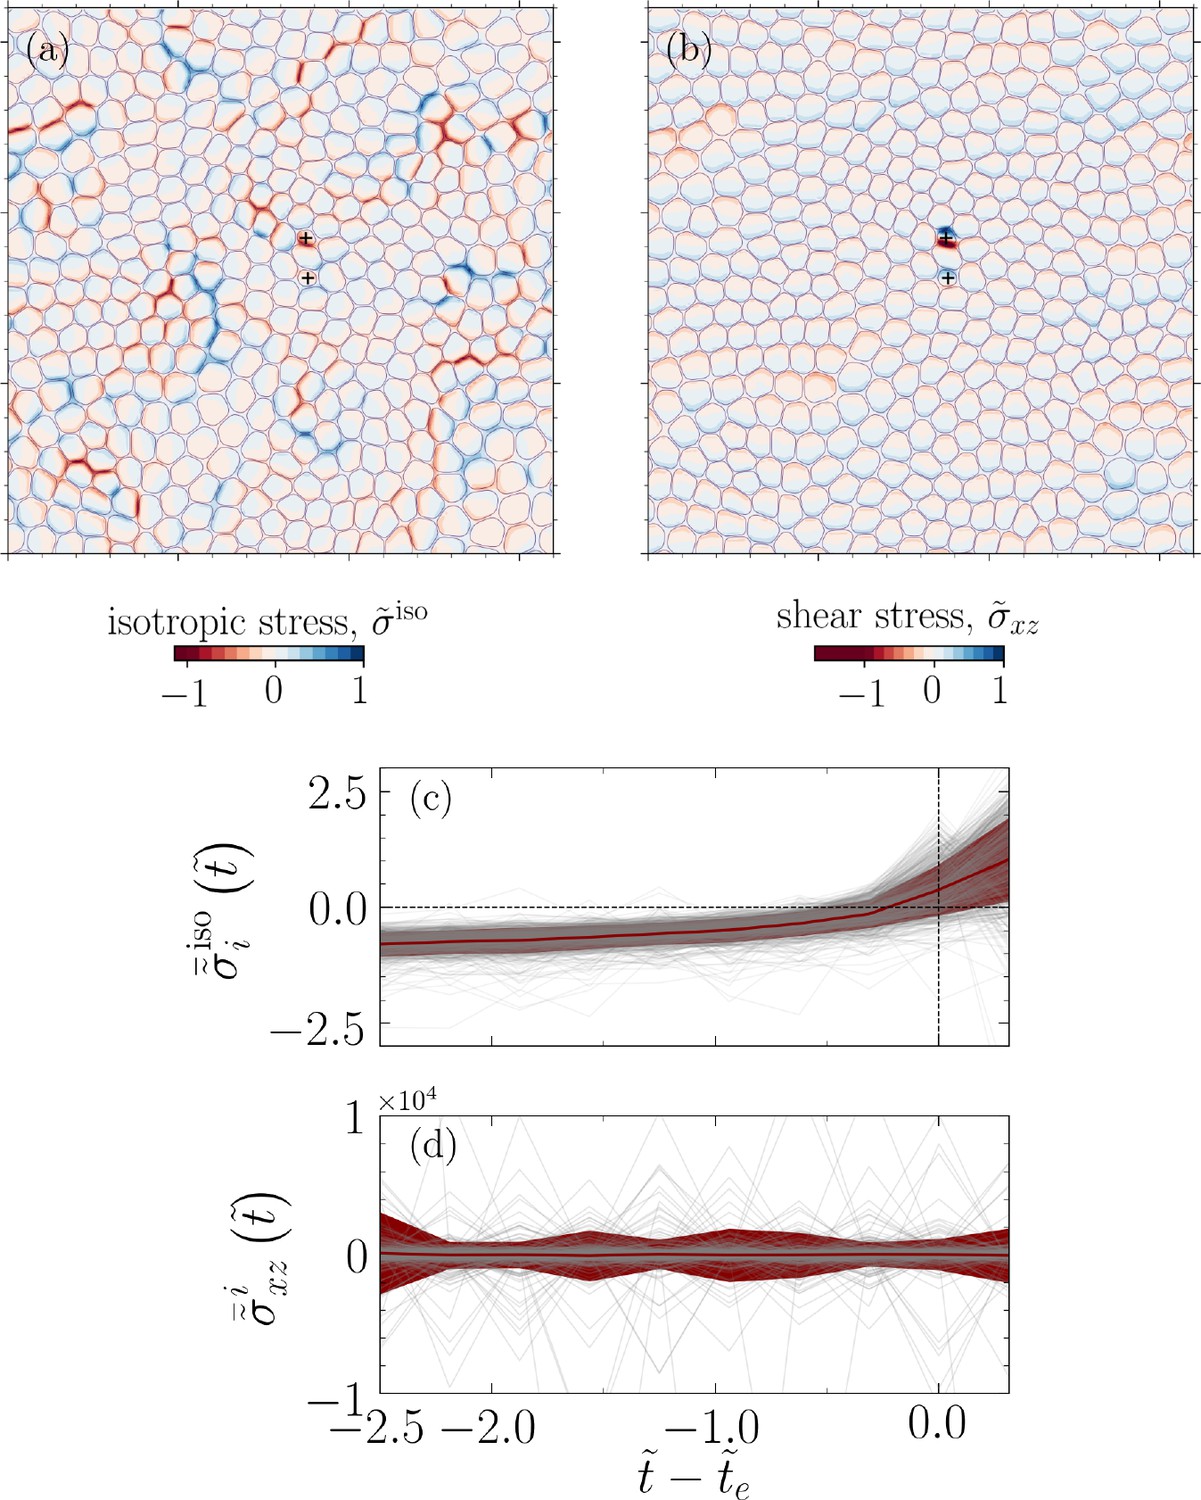
Temporal build-up of mechanical stress before extrusion events.
A representative analysis corresponding to the configuration shown in Figure 1a and projected into plane (, i.e., the basal side). (a) Normalized isotropic stress field , where is the maximum value of the isotropic stress field, and (b) normalized shear stress field, , where is the maximum value of field. The symbol + denotes the center of mass for two extruding cells. (c) Cell (spatially) averaged normalized isotropic stress and (d) shear stress for an extruding cell during , where denotes extrusion time and . The data shown in (c, d) correspond to all the considered parameters for cell–substrate () and relative cell–cell adhesions () and for four distinct realizations. Each gray line in the background represents an extruding cell, and the red line shows the mean and the standard deviation of the normalized stresses.
Figure 5
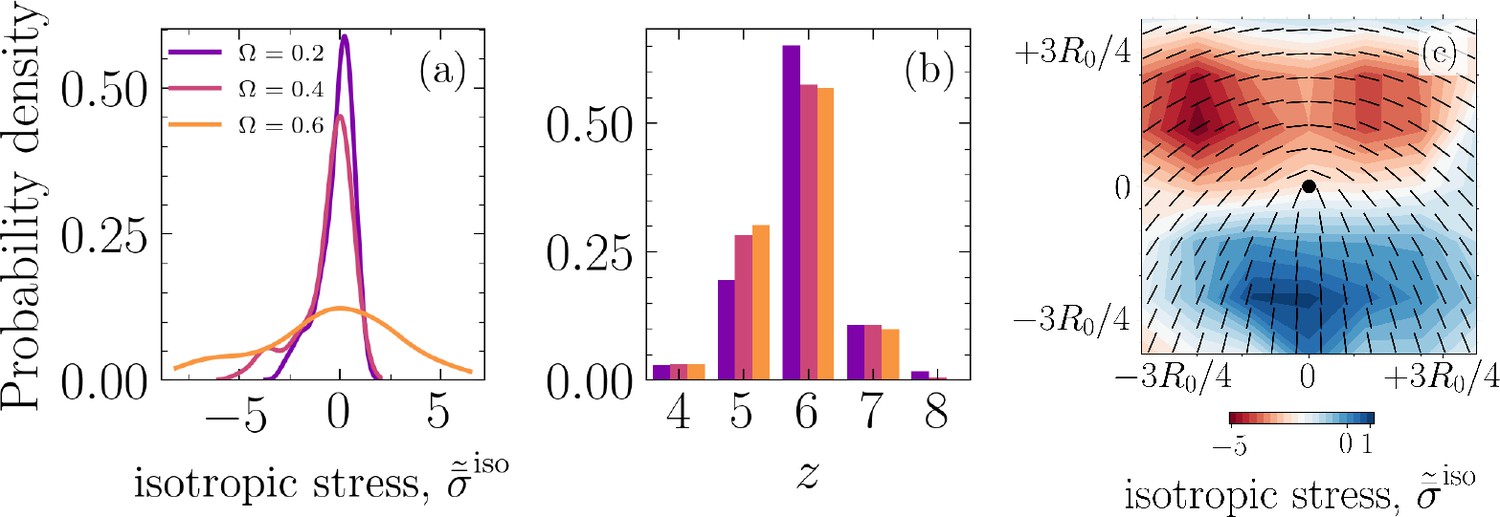
Spatial localization of mechanical stress leading to extrusion events.
(a) Probability density function for the normalized, ensemble average of isotropic stress field, , projected into -plane with , that is, the basal side, around +1/2 defects for various cell–cell to cell–substrate adhesion ratios (colors correspond to legend in [a]). (b) Probability density function for the number of neighbors and various , for all cells and simulation time steps. (c) Normalized, ensemble average of isotropic stress field, , with representing the average field during defect life time, for nucleated defects, and is the maximum of the average field, for the case and .
Appendix 1—figure 1
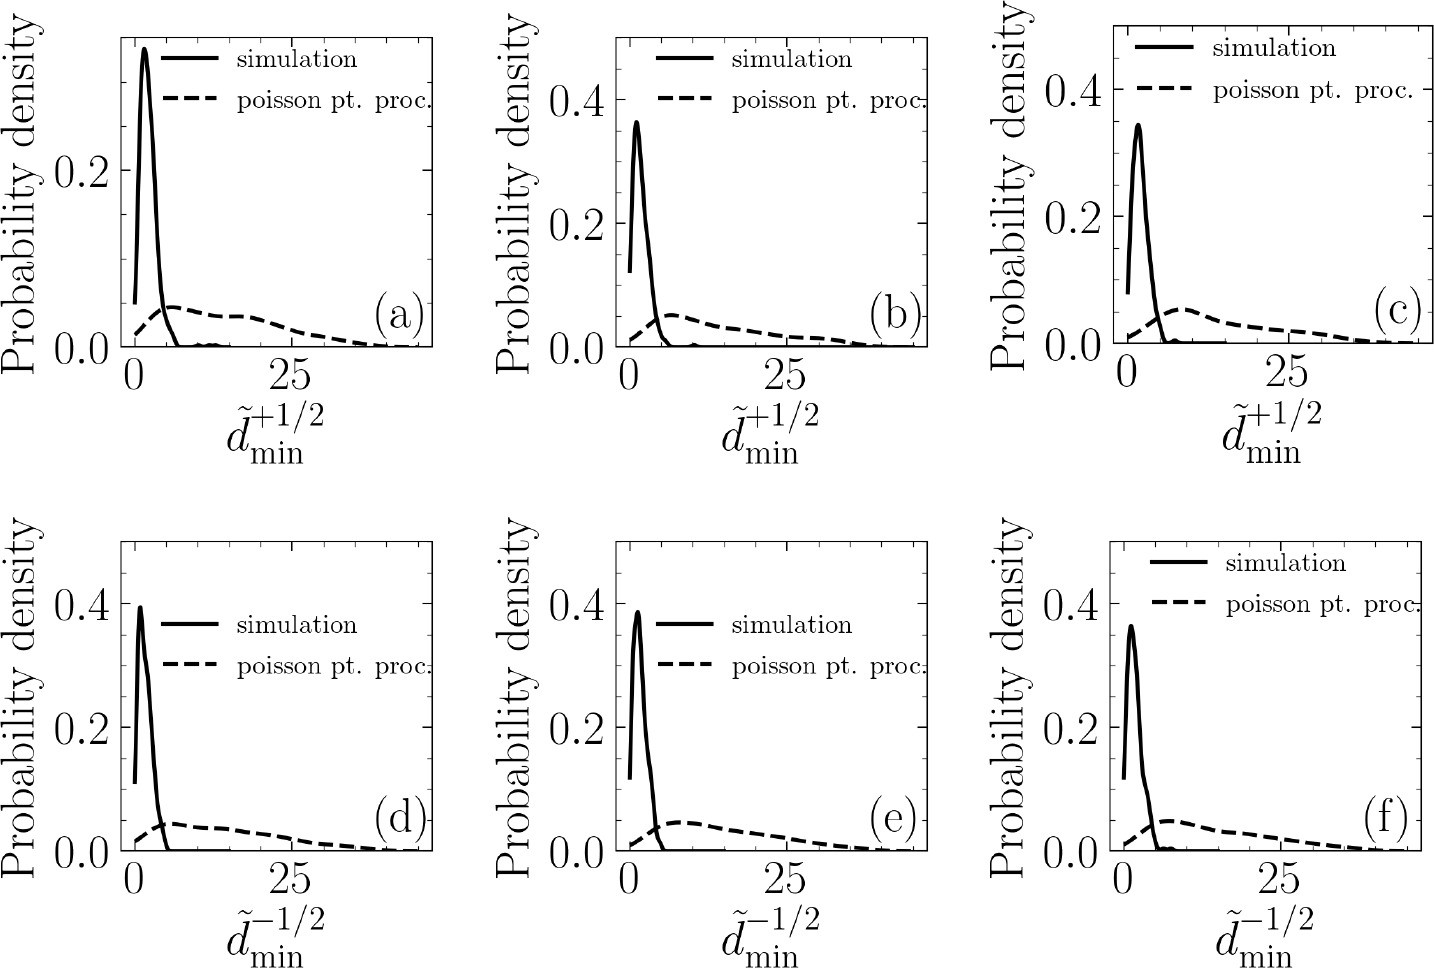
Establishing the correlation between extrusion events and half-integer nematic defects via hypothesis testing.
Probability density of the normalized minimum distance, between an extrusion event and the nearest +1/2 topological defect (a–c) for (a), (b), and (c). Probability density of the normalized minimum distance, between an extrusion event and the nearest -1/2 topological defect (d–f) for (d), (e), and (f).
Appendix 1—figure 2

Lewis's relationship for extruding cells.
(a–i) Lewis’s relationship compared with our simulations for and (a), (b), and (c); and (d), (e), and (f); and and (g), (h), and (i).
Appendix 1—figure 3
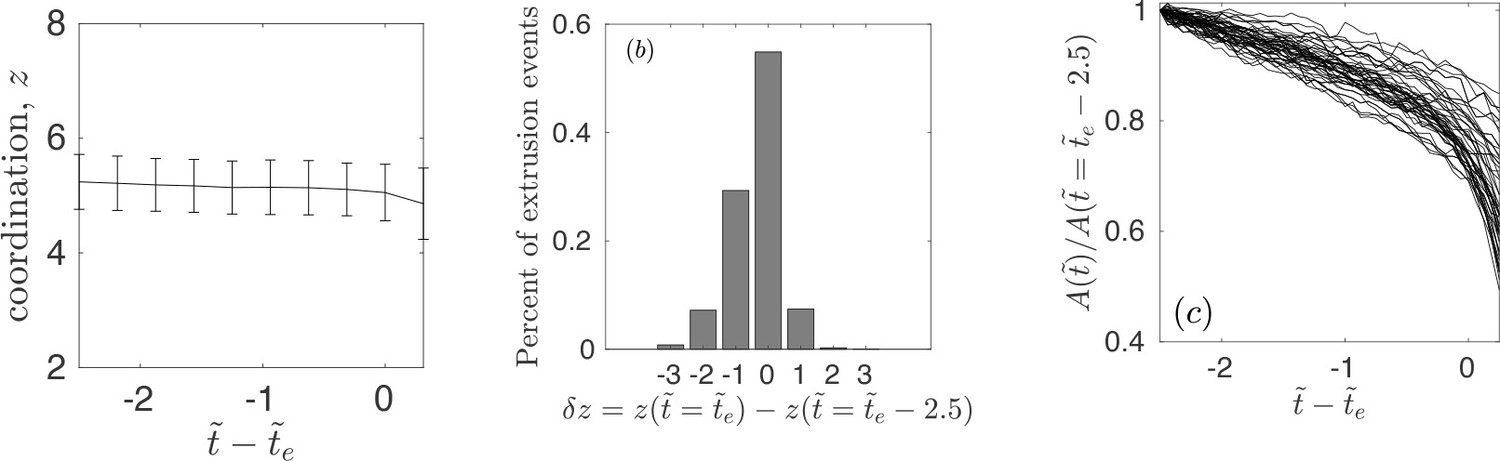
Coordination and area statistics of extruding cells.
(a) The average and standard deviation of coordination number – number of interacting neighbors – for an extruding cell. The data corresponds to all simulations and the four distinct realizations considered in the article. (b) Percent of extrusion events with a given – characterizing the change in number of interacting neighbors at extrusion time and . The data corresponds to all simulations and the four distinct realizations considered in the article. (c) The temporal evolution of area for extruding cells normalized with the area at , for one of the realizations.
Appendix 1—figure 4
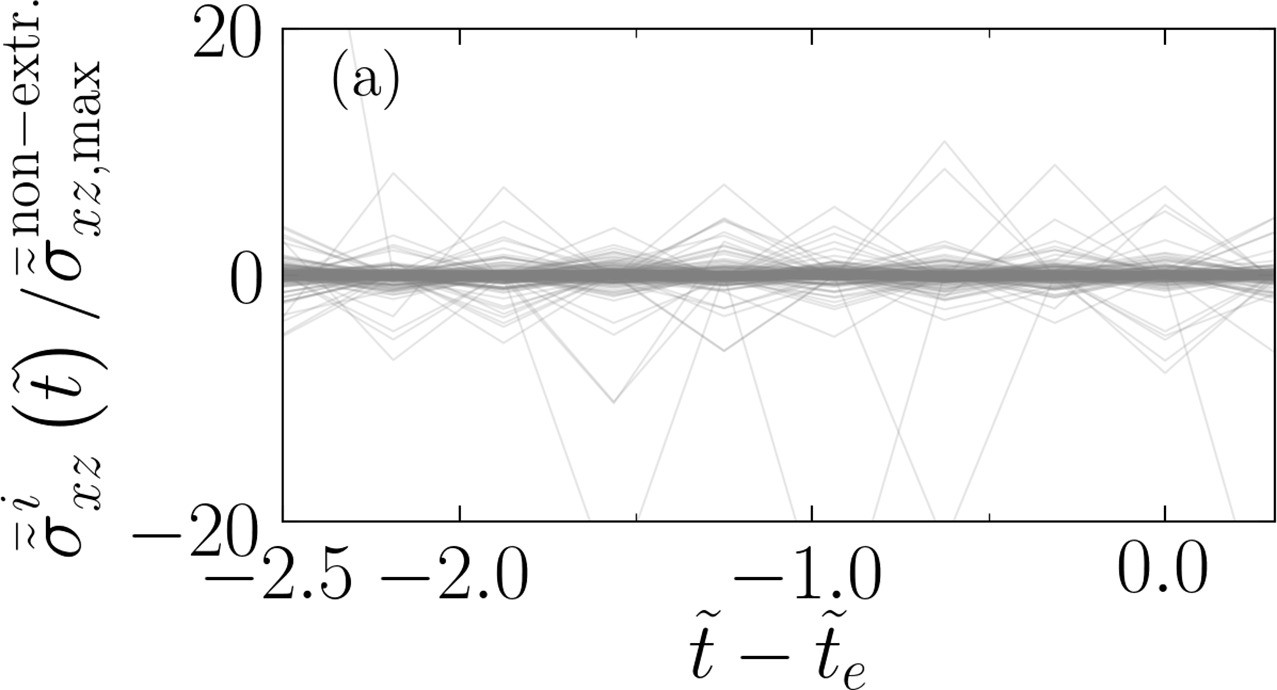
Oscillations of out-of-plane shear stress for extruding cells relative to non-extruding cells.
(a) Temporal evolution of the out-of-plane shear stress for an extruding cell normalized by the maximum of the out-of-plane shear for all non-extruding cells within the same temporal window.
Appendix 1—figure 5

Defect statistics.
(a) The probability density of +1∕2 and (b) -1/2 defect lifetimes.
Appendix 1—figure 6
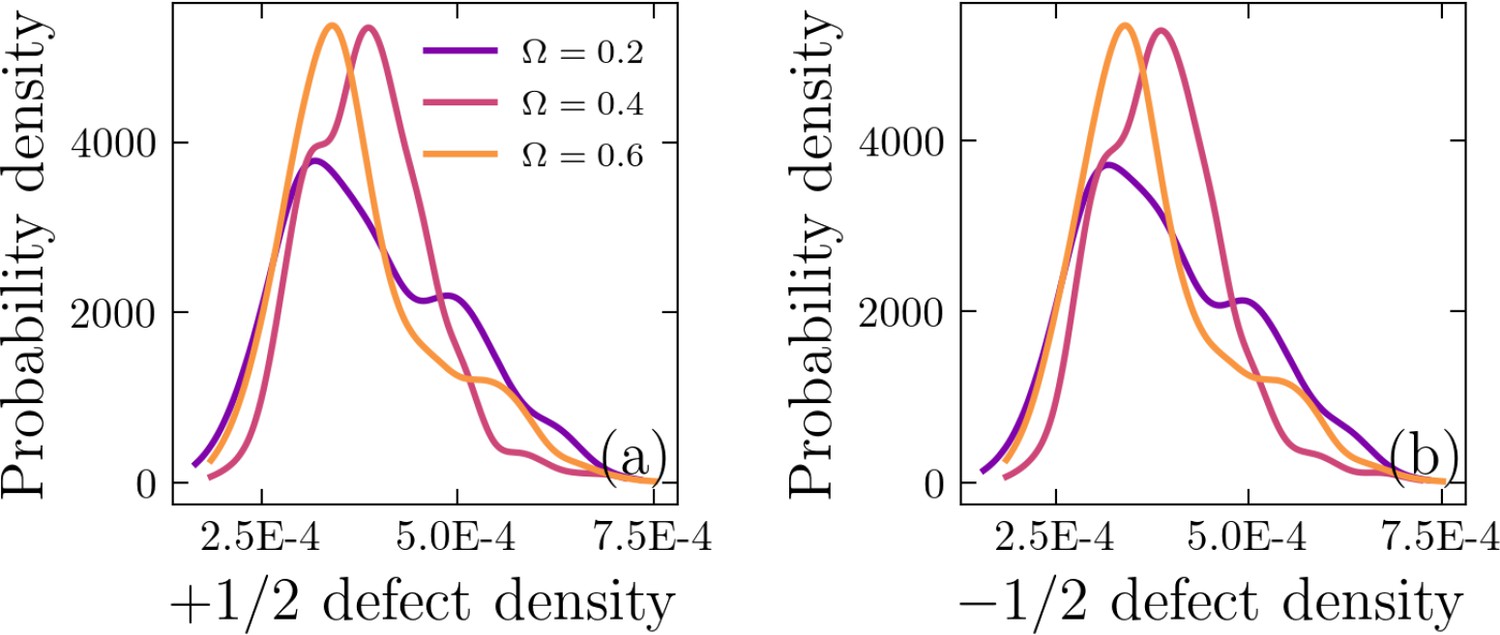
Probability density of (a) +1∕2 and (b) −1∕2 defect density distributions.
Appendix 1—figure 7
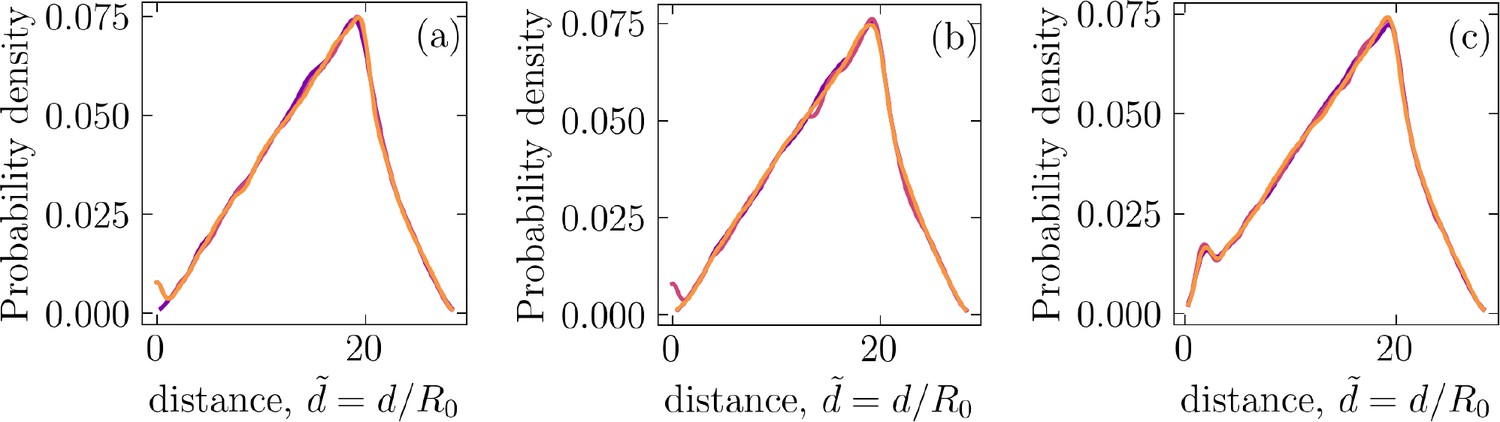
Probability density of pairwise distance between (a) +1∕2 and +1∕2 defects, (b) −1∕2 and −1∕2 defects, and (c) +1∕2 and −1∕2 defects.
Appendix 1—figure 8

Extrusion phase diagram.
(a) Mean and (b) standard deviation of the number of extrusions for a range of values for and cell–substrate adhesion, , over the range of 29,000 times steps and for four realizations.
Appendix 1—figure 9
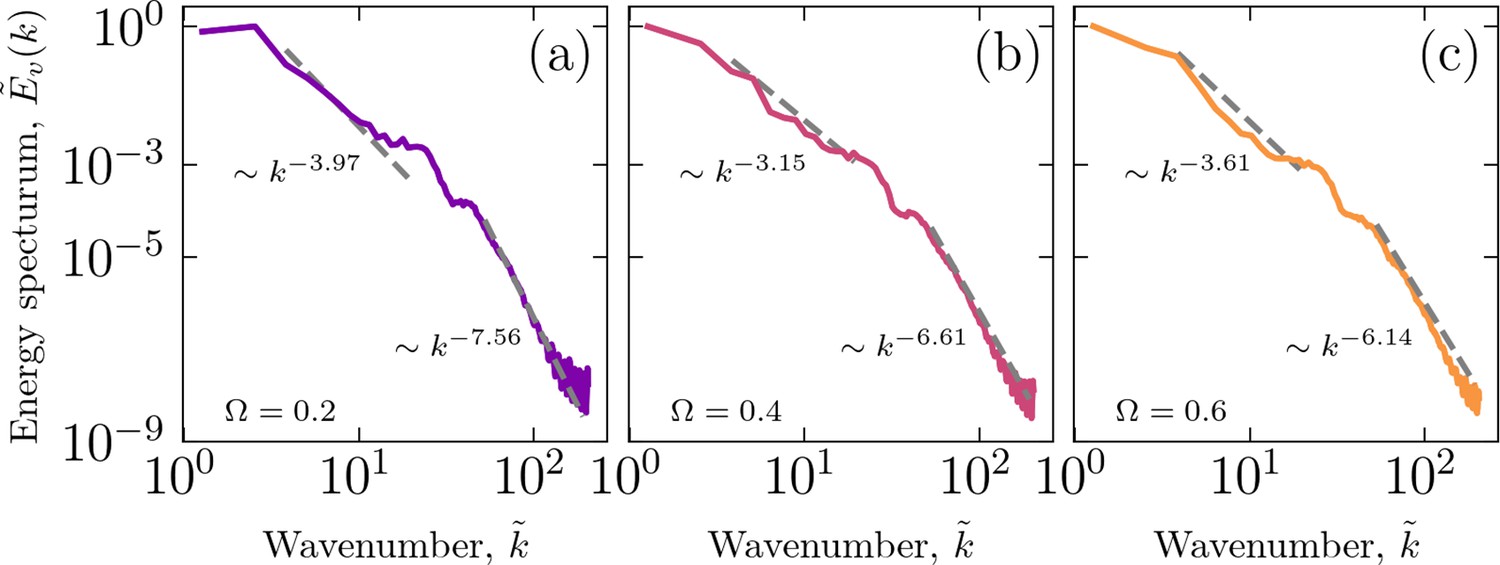
Energy spectra for three sample simulations with (a) , (b) , and (c) .
Appendix 1—figure 10

Temporal evolution of nematic order parameter (a) and hexatic order parameter (b) for various relative cell–cell adhesions, .
Appendix 1—figure 11
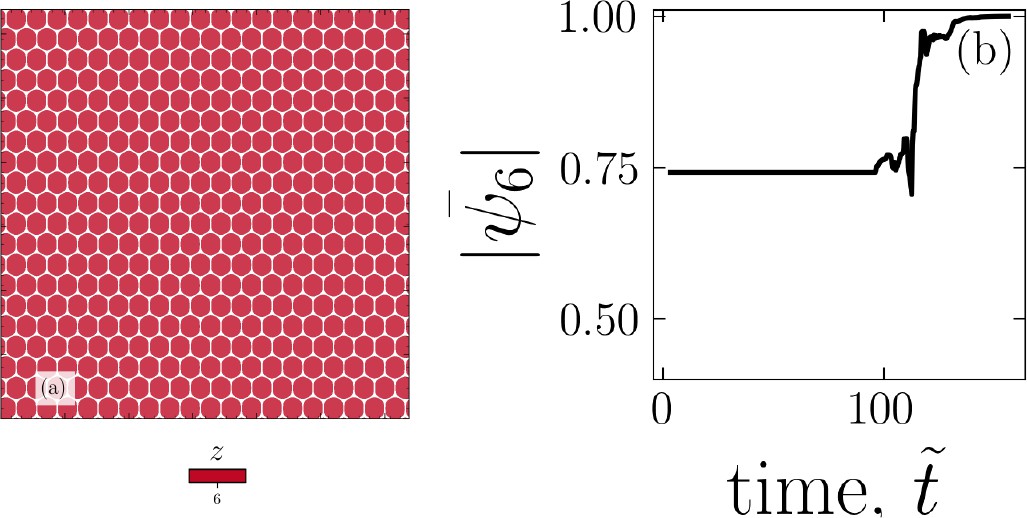
In the absence of active forces, cells tend to equilibrate into a hexagonal lattice.
An example configuration (a) and evolution of the hexatic order parameter as the systems equilibrates (b).
Author response image 1
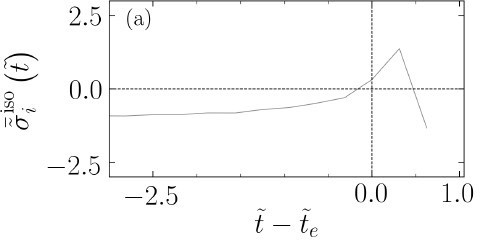
The evolution of average isotropic stress for an extruding cell with extended temporal window, relative to Figure 4(c) in the main text.
Author response image 2

The significance of the three-dimensional isotropic stress.
(a) Temporal evolution of isotropic stress in two-dimensions and (b) three-dimensions for a number of extruding cells highlighting the difference between 2D and 3D isotropic stress.
Author response image 3
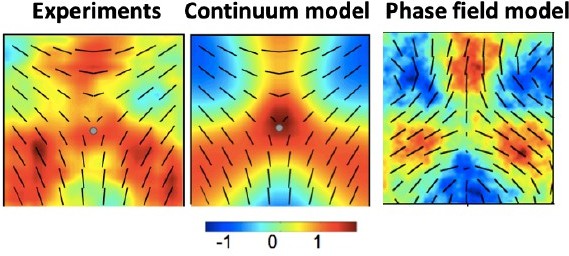
Comparison of the isotropic stress patterns around −1/2 defects.
The emergence of compressive regions away from the core, but around the arms of the defect is evident. The colormap shows isotropic stress normalized by its maximum value. The patterns corresponding to Experiments and the Continuum model of active nematics are adapted from Saw et al., Nature (2017).
Tables
Appendix 1—table 1
Results of the Kolmogorov–Smirnov (KS) tests for various cell–cell to cell–substrate adhesion ratio () and for half-integer topological defects.
Both statistics and p-value are KS test results and corresponds to the number of samples in each distribution, for both simulations and the extrusion events generated through a Poisson point process.
| Probability density | statistics | p-Value | (simulations) | (randomly generated) |
|---|---|---|---|---|
| (+1/2) | 0.8221 | 426 | 402 | |
| (+1/2) | 0.228 | 648 | 605 | |
| (+1/2) | 0.827 | 551 | 570 | |
| (–1/2) | 0.802 | 426 | 423 | |
| (–1/2) | 0.840 | 648 | 660 | |
| (–1/2) | 0.824 | 551 | 507 |
Additional files
Download links
A two-part list of links to download the article, or parts of the article, in various formats.
Downloads (link to download the article as PDF)
Open citations (links to open the citations from this article in various online reference manager services)
Cite this article (links to download the citations from this article in formats compatible with various reference manager tools)
Mechanical basis and topological routes to cell elimination
eLife 12:e82435.
https://doi.org/10.7554/eLife.82435


