A modelled evaluation of the impact of COVID-19 on breast, bowel, and cervical cancer screening programmes in Australia
- Daffodil Centre, The University of Sydney, a Joint Venture with Cancer Council NSW, Australia
- Melbourne School of Population and Global Health, University of Melbourne, Australia
- Prevention Division, Cancer Council Victoria, Australia
- Department of Medicine, The Royal Melbourne Hospital, University of Melbourne, Australia
- Breast Service, The Royal Women's and Royal Melbourne Hospital, Australia
- Department of Surgery, University of Melbourne, Australia
Figures
Figure 1
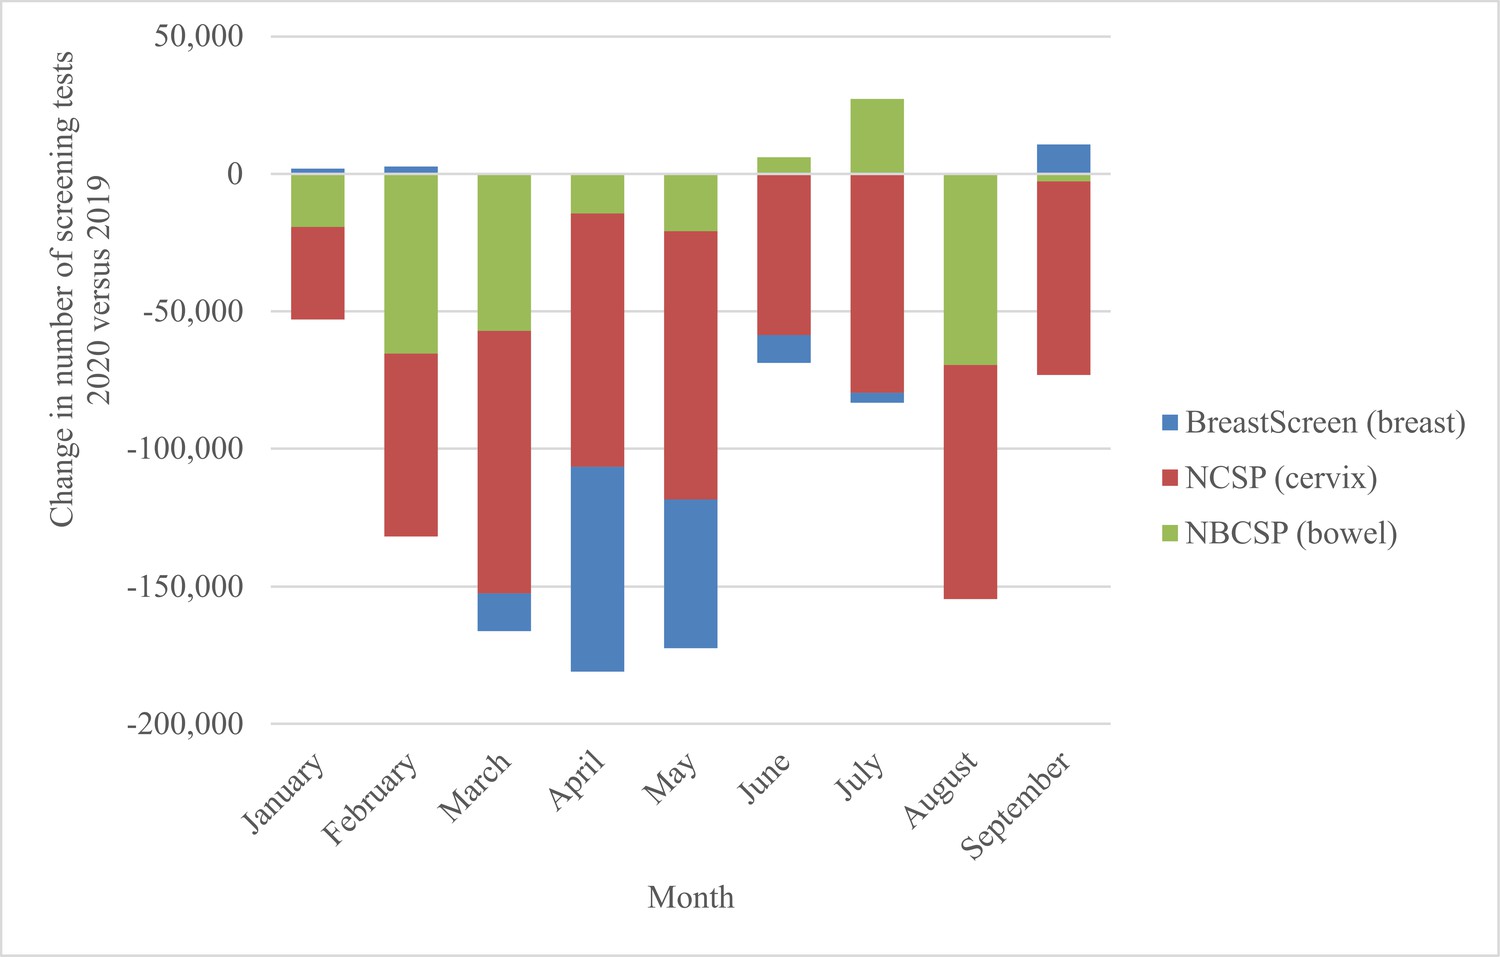
National change in number of screening tests by month, 2020 vs. 2019, for the breast, bowel, and cervical screening programmes.
Derived from AIHW 2020 report – Cancer Screening and COVID19 in Australia. Australian Institute of Health and Welfare, 2020b. Note: cervical screening test volumes were anticipated to be lower in 2020 than in 2019 due to the extension from a 2-y to a 5-y screening interval (Smith et al., 2016).
Figure 2
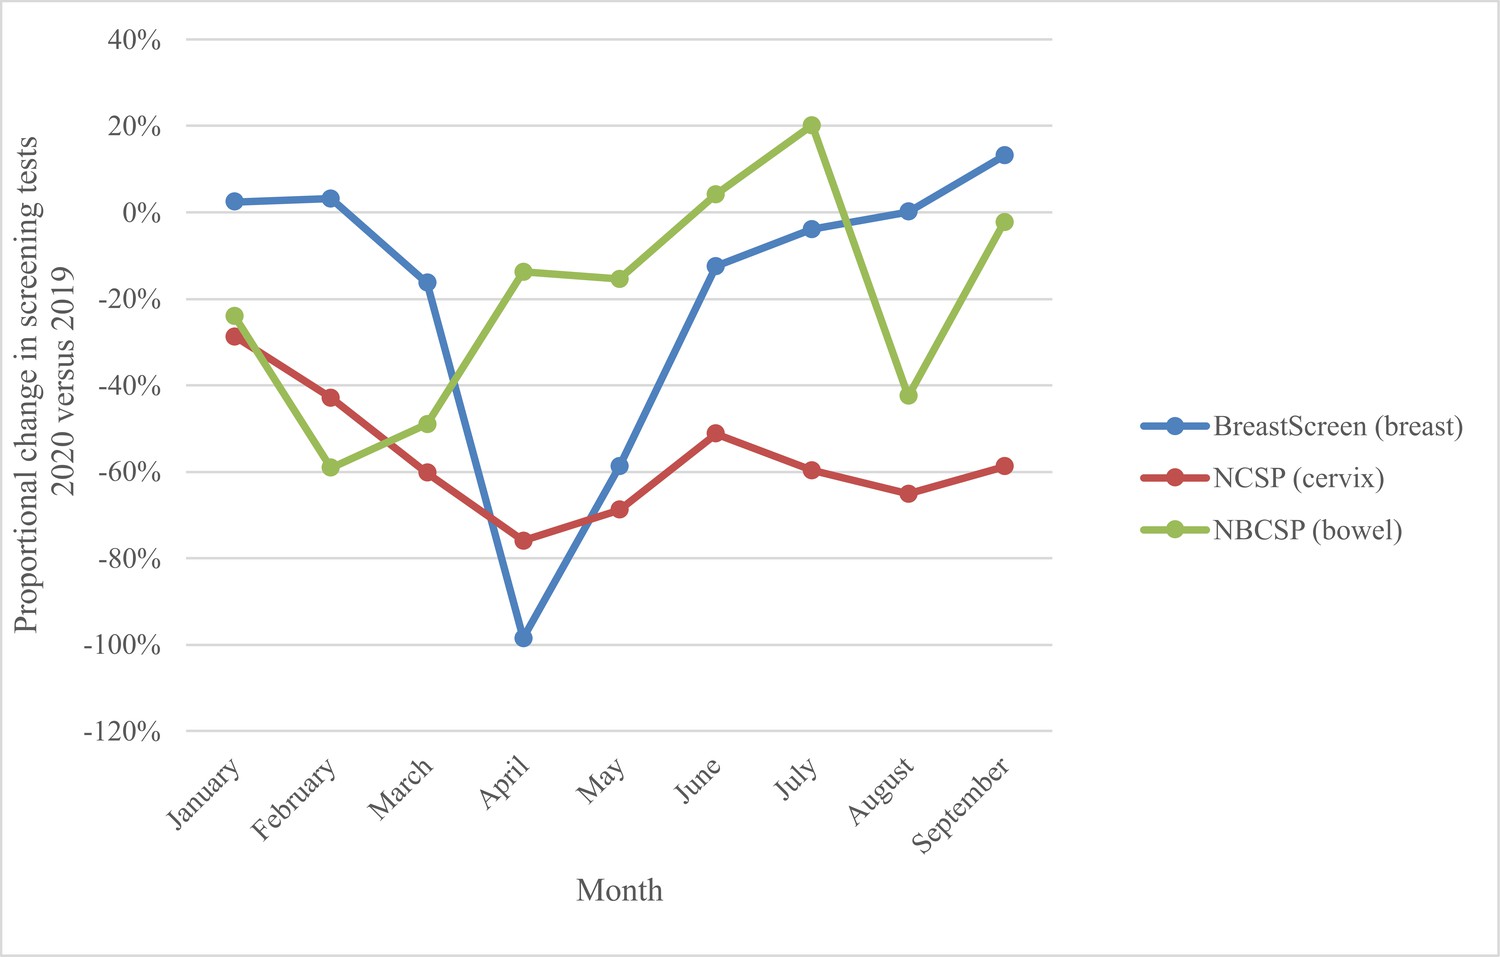
National proportional change in number of screening tests by month, 2020 vs. 2019, for the breast, bowel, and cervix screening programmes.
Derived from AIHW 2020 report – Cancer Screening and COVID19 in Australia. Australian Institute of Health and Welfare, 2020b. Note: cervical screening test volumes were anticipated to be lower in 2020 than in 2019 due to the extension from a 2-y to a 5-y screening interval (Smith et al., 2016).
Tables
Table 1
Scenarios modelled for each of the three screening programmes and key outcomes reported.
Each scenario is compared to status quo outcomes, which incorporate various population projections based on pre-COVID observed data.
| Screening programme | Disruption scenario by period | Outcomes | |||||
|---|---|---|---|---|---|---|---|
| 12 mo | 9 mo | 6 mo | 3 mo | Cancer diagnoses | Delayed diagnoses/cancer staging | Screening episodes | |
| Breast screening (females, 50–74 y)* | 12-mopause assuming gradual recovery over 6 mo, to 50% higher screening capacity than status quo | N/A | 6-mo pause assuming gradual recovery over 6 mo, to status quo screening capacity | 3-mo pause assuming gradual recovery over 6 mo, to status quo screening capacity | Invasive breast cancers (2020–2021) | Interval cancer rates, tumour size, grade and nodal involvement at diagnosis (2020–2021) | Screening episodes (1 April 2020 to 31 March 2021) |
| Bowel screening (persons, 50–74 y)† | 12-mopause | N/A | 6-mo pause | 3-mo pause | CRC cases (2020–2021; 2020–2060) | Adenomas missed or delayed (2020–2021) CRC cases detected at a later stage (2020–2060) | Number of iFOBT screening kits returned (2020–2021) |
| Cervical screening (females, 25–74 y) ‡ | 12-modisruption; assuming a 95% reduction in primary screening attendance | 9-modisruption assuming a 75% reduction in primary screening attendance | 6-mo disruption assuming a 50% reduction in primary screening attendance | N/A | Additional cervical cancers (2020–2022) | Cervical cancers detected at a later stage (2020–2022) | Number of women screening (2020–2022) |
-
*
Breast screening: status quo: biennial mammography for women 50–74 y old; invitation letter sent at age 50 y; 55% participation rate. All scenarios assume no throughput during the pause period then a gradual recovery of screening throughput, with 3- and 6-mo disruption scenarios reach status quo rates by the seventh month after screening resumption, and the 12-mo disruption scenario reaching screening capacity at 50% higher than status quo by the seventh month after screening resumption. Breast screening outcomes are reported for women aged 50–74 at any time during the reporting period. Two-year reporting periods align with routine reporting of BreastScreen outcomes due to the programme being mostly biennial. Breast programme recall rates describe mammographic screening episodes referred for further assessment, and false-positive recall rates describe recalled screens with a benign final outcome after assessment. Screening programme sensitivity describes the screen-detected cancers as a proportion of screen-detected cancers and interval cancers.
-
†
Bowel screening: status quo: biennial iFOBT screening of men and women 50–74 y old; invitation letter with test sent at age 50 y; participation rate 43.5%. No throughput is assumed during the pause period. Bowel screening outcomes are reported for individuals age-eligible (aged 50–74 y) for screening in either 2020 or 2021, i.e., individuals born in 1945–1971, with reporting periods selected to indicate both the immediate effect and the lifetime effect of the eligible cohort. Outcomes describe the expected number of incident colorectal cancers in the screening cohort only.
-
‡
Cervical screening: status quo: 5-yearly HPV screening of women 25–74 y old; invitation letter sent at age 25 y; participation rate at 46%. Primary screening tests describe women attending for a primary screening test. Scenarios assume women who miss screening in 2020, instead attend over 2021–2022, no disruption to surveillance or colposcopy visits, and no changes to rates of women presenting with symptoms. Cervical screening outcomes are reported for women age-eligible (aged 25–74 y) for screening at any time during 2020–2022, reporting the period 2020–2022 because all women who missed screening in 2020 were assumed to re-attend by 2022, and because 2022 aligns with the last year in the first 5-y-round of primary HPV screening.
-
CRC: colorectal cancer; iFOBT: immunochemical faecal occult blood test.
Table 2
Modelled screening episodes (number of screens and as a proportion of status quo screens) provided under each scenario over the period 1 April 2020–31 March 2021 for people in the target age range (eligible for screening during the affected period) and sex.
| Programme (target sex and age range) | Disruption scenario by period | Observed number of tests as a proportion of status quo, Jan–Sept 2020 (by quarter and for whole period) (Q1, Q2, Q3, Q1–Q3) | ||||
|---|---|---|---|---|---|---|
| Status quo (comparator) | 12 mo | 9 mo | 6 mo | 3 mo | ||
| Breast (females, 50–74) | 973,019 (100%) | 0 (0%) | N/A | 298,113 (31%) | 518,680 (53%) | (98%, 44%, 105%, 82%)* |
| Bowel (persons, 50–74) | 1,353,875 (100%) | 0 (0%)† | N/A | 680,259 (50%) | 1,016,915 (75%) | (54%, 92%, 97%, 81%) ‡ |
| Cervical (females, 25–74) § | 1,413,888 (100%) | 386,451 (27%) | 805,537 (57%) | 1,143,510 (81%) | N/A | (55%, 34%, 39%, 43%) ¶ |
| Combined – provided | 3,740,782 (100%) | 386,451 (10%) | N/A | 2,121,882 (57%) | N/A | |
| Combined – missed | 0 (0%) | 3,250,432 (90%) | N/A | 1,612,032 (43%) | N/A | |
-
*
Percentages derived from a comparison of screens for 2020 vs, 2018, for women aged 50–74 y (AIHW Table 1.2) (Australian Institute of Health and Welfare, 2020b).
-
†
No screening provided during the reported period.
-
‡
Percentages derived from a comparison of the number of kits returned for adults aged 50–74 y in 2020 vs. 2019 (AIHW Table 3.2) (Australian Institute of Health and Welfare, 2020b).
-
§
includes women attending for surveillance or other tests, not only routine primary screening tests. For this reason, the percentages do not correspond to the 25–95% reductions assumed among women attending for a routine cervical screening test.
-
¶
Percentages derived from a comparison of the number of HPV tests conducted through the NCSP for women aged 25–74 y, 2020 vs. 2019 (AIHW Table 2.2) (Australian Institute of Health and Welfare, 2020b).
Table 3
Selected estimated outcomes (2020–2021) for the evaluation of disruptions to breast, bowel, and cervical cancer screening.
Proportional changes compared to status quo are shown in brackets.
| Outcome | Disruption scenario by period | ||||
|---|---|---|---|---|---|
| Breast screening* | Status quo | 12 mo | 9 mo | 6 mo | 3 mo |
| Invasive breast cancers per 100,000 women† | 298 | 270 (–9%) | NA | 272 (–9%) | 286 (–4%) |
| Screen-detected invasive breast cancers per 100,000 women† | 127 | 97 (–24%) | NA | 99 (–22%) | 117 (–8%) |
| Interval cancers (12 mo) ‡ | 15 | 8 (–47%) | NA | 11 (–27%) | 13 (–13%) |
| Interval cancers (27 mo) ‡ | 38 | 33 (–13%) | NA | 33 (–13%) | 35 (–8%) |
| Programme sensitivity § | 76.8% | 74.8% (–3%) | NA | 75.2% (–2%) | 77.0% (0%) |
| Tumour size (% ≤15 mm diameter) | 59.7% | 56.5% (–5%) | NA | 58.3% (–2%) | 59.6% (0%) |
| Nodal involvement (% involving nodes) | 24.9% | 26.4% (6%) | NA | 25.1% (1%) | 25.0% (0%) |
| Grade (% grade 3 versus grade 1/2) | 46.6% | 48.4% (2%) | NA | 47.2% (1%) | 46.7% (0%) |
| Recall rate (N) ¶ | 5.2% | 5.6% (8%) | NA | 5.3% (2%) | 5.3% (2%) |
| False-positive recall rate (N)** | 4.6% | 4.8% (4%) | NA | 4.6% (0%) | 4.7% (2%) |
| Bowel screening | |||||
| Colorectal cancer diagnoses | 21,068 | 18,518 | NA | 19,844 | 20,484 |
| Change (%) in 2020–2021 | - | –2549 (–12.1%) | NA | –1223 (–5.8%) | –583 (–2.8%) |
| Undetected cancers which would advance in stage in 2020–2021 | - | 891 | NA | 529 | 261 |
| % of cancers detected at stages 3–4, 2020/2021 | 33.9% | 40.7% (7%) | NA | 35.9% (2%) | 34.6% (1%) |
| Colonoscopies in 2020–2021 | 194,954 | 118,829 | NA | 156,619 | 175,804 |
| Change (%) in 2020–2021 | - | –76,125 (–39.0%) | NA | –38,335 (–19.7%) | –19,151 (–9.8%) |
| Cervix screening††, ‡ ‡ | |||||
| Cervical cancer diagnoses | 1878 | 1947 | 1912 | 1899 | NA |
| Increase (%) | 69 (3.6%) | 34 (1.8%) | 21 (1.1%) | NA | |
| Upstaged cancers | |||||
| Localised → regional | 18 | 8 | 6 | NA | |
| Regional → distant | 9 | 4 | 3 | NA | |
| % cancers upstaged § § | 1.4% | 0.6% | 0.5% | NA | |
| Colposcopies | 245,620 | 211,445 | 230,383 | 233,463 | NA |
-
*
Breast screening: for all scenarios, screening is assumed to resume gradually after the pause to services, reaching status quo rates by the seventh month after resumption for the 3 and 6 mo scenarios.
-
†
Breast screening: rates are per 100,000 women in the Australian population, including women who do not usually participate in screening.
-
‡
Breast screening: invasive breast cancers arising within 12 or 27 mo of a negative screening episode. Figures reflect interval cancers diagnosed in 2020, or 2020–2021, respectively.
-
§
Breast screening: screen-detected cancers as a proportion of screen-detected + interval cancers (27 mo).
-
¶
Breast screening: the proportion of screening episodes recalled for further investigation.
-
**
Breast screening: the proportion of screening episodes recalled for further investigation, with a benign final outcome after that investigation.
-
††
Cervical screening: the 12-, 9-, and 6 mo scenarios assume a decrease in attendance of 95, 75, and 50%, respectively, compared to what would otherwise have been expected in 2020.
-
‡ ‡
Cervical screening: All values are rounded to whole numbers.
-
§ §
Number of upstaged cancers (localised to regional or regional to distant) as a percentage of the number of cancer cases predicted under the status quo scenario.
Additional files
-
Supplementary file 1
Suggest 'Additional model specifications and estimates'.
(A) Ranking of women aged 50–74 in the queue for available screens during the recovery period. (B) Proportion of eligible women with any Cervical Screening Test recorded – modelled assumption prior to disruption compared to observed data (1 December 2017–14 January 2020), by age. (C) Routine and follow-up attendance assumptions for counterfactual (no-disruption) and disruption scenarios to the NCSP. (D) Selected estimated outcomes by 2-y calendar period (2020–2021), 2021–2022, and 2022–2023 assuming a 12-mo disruption, for women aged 50–74. (E) Estimated screening delays and participant profiles for each BreastScreen programme disruption scenarios modelled, reported for various calendar periods. (F) Diagnostic assessments and short-term adenoma outcomes. (G) Impact of disruption on cancer outcomes among women aged 25–74 y, 2020–2022. (H) Impact of disruption on number of women expected to attend for an HPV test (any purpose). (I) Impact of disruption on expected colposcopy utilisation, 2020–2022.
- https://cdn.elifesciences.org/articles/82818/elife-82818-supp1-v1.docx
-
MDAR checklist
- https://cdn.elifesciences.org/articles/82818/elife-82818-mdarchecklist1-v1.pdf
Download links
A two-part list of links to download the article, or parts of the article, in various formats.
Downloads (link to download the article as PDF)
Open citations (links to open the citations from this article in various online reference manager services)
Cite this article (links to download the citations from this article in formats compatible with various reference manager tools)
A modelled evaluation of the impact of COVID-19 on breast, bowel, and cervical cancer screening programmes in Australia
eLife 12:e82818.
https://doi.org/10.7554/eLife.82818


