Single amino acid residue mediates reciprocal specificity in two mosquito odorant receptors
- Department of Molecular and Cellular Biology, University of California, Davis, United States
- Department of Physiology and Membrane Biology, University of California, Davis, United States
- Department of Anesthesiology and Pain Medicine, University of California, Davis, United States
Figures
Figure 1 with 1 supplement
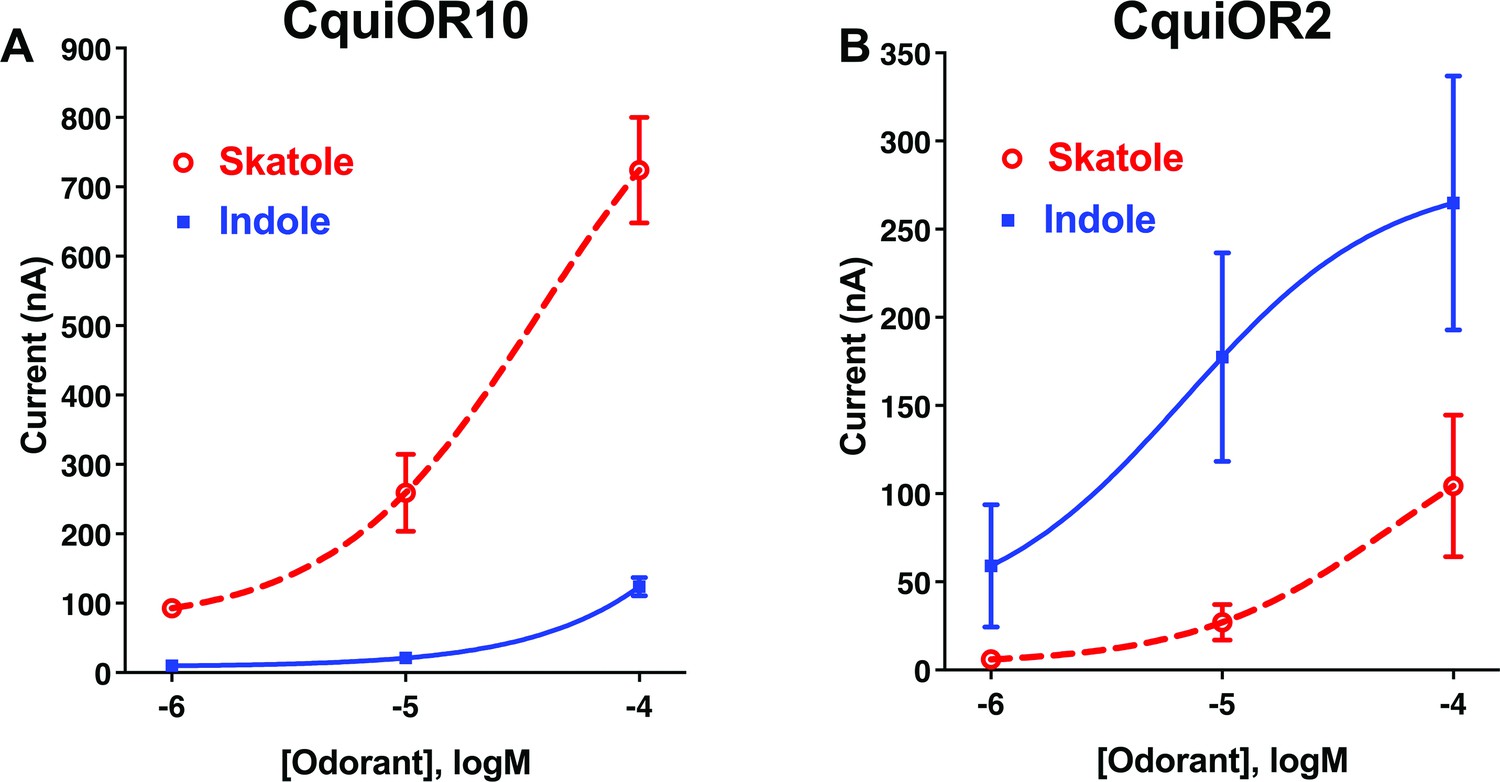
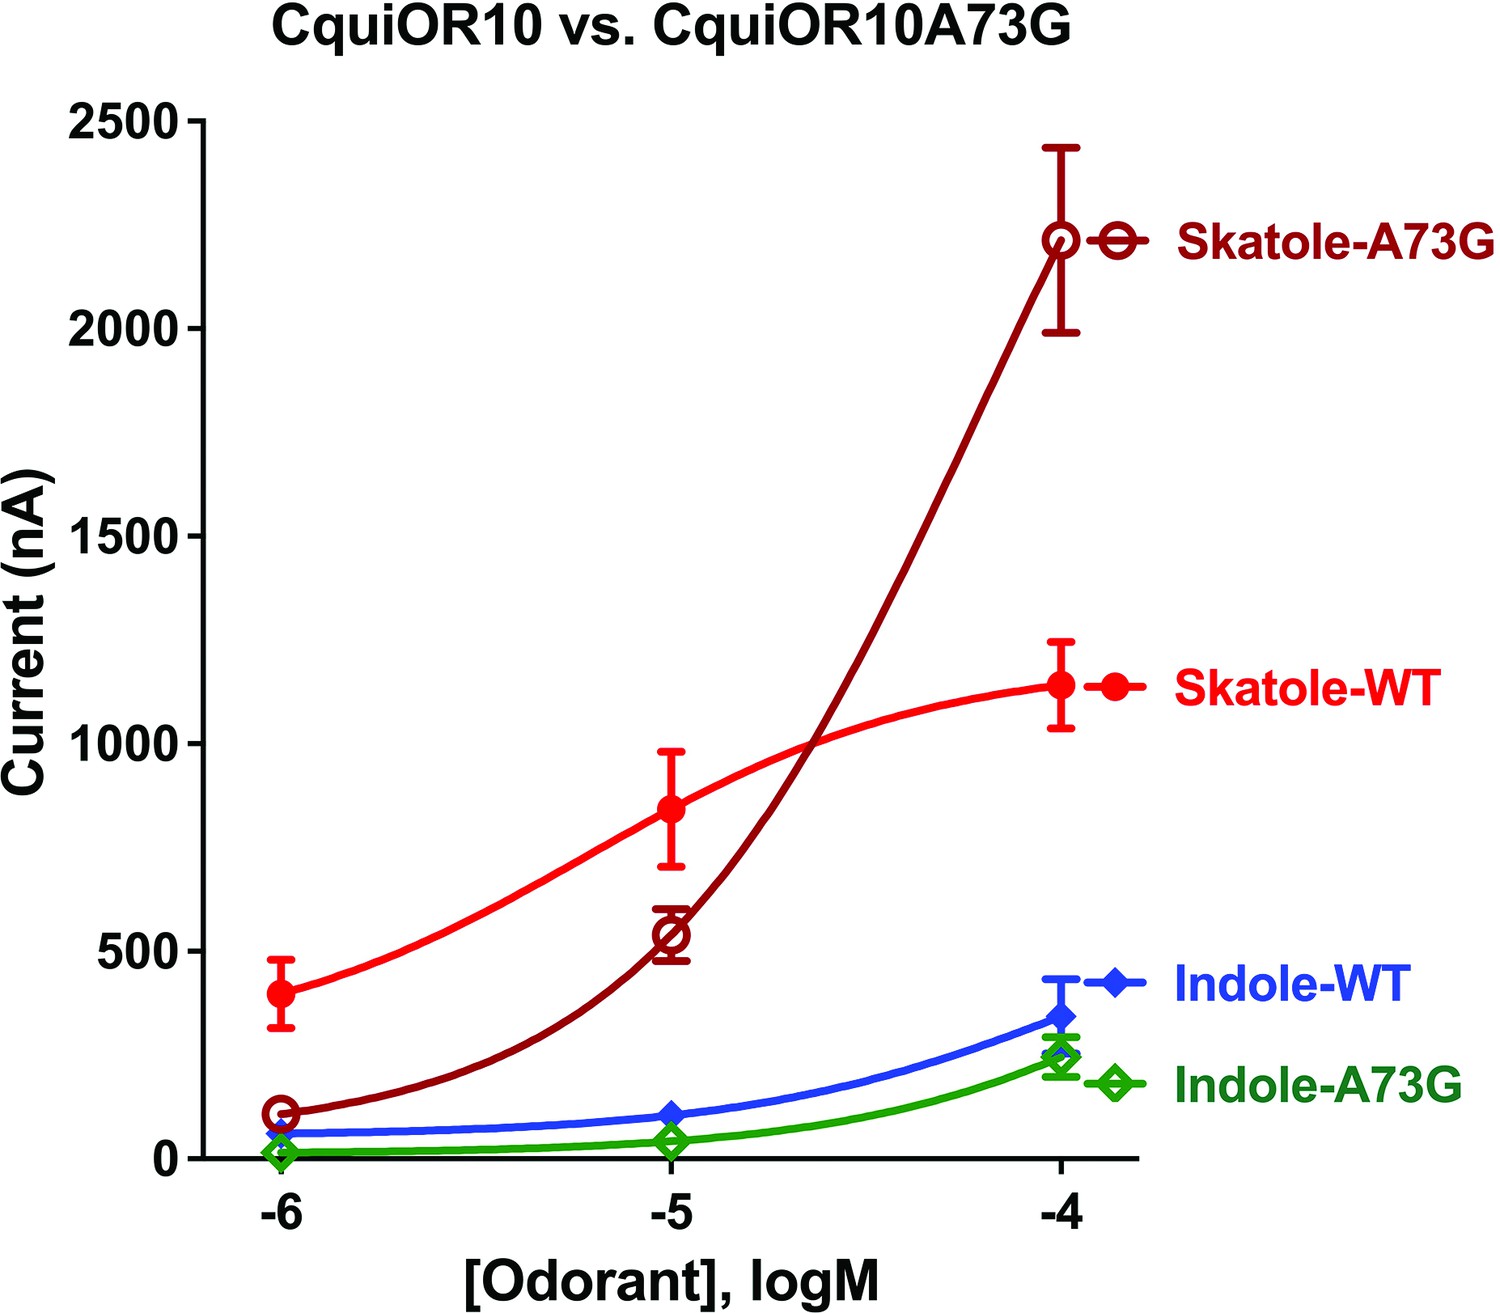
Concentration–response analysis for activation of wildtype odorant receptors (ORs) by skatole and indole.
(A) CquiOR10 and (B) CquiOR2. Lines were obtained with nonlinear fit. Bars represent SEM. n = 4–5.
-
Figure 1—source data 1
Concentration–response analysis for activation of wildtype odorant receptors (ORs) by skatole and indole.
- https://cdn.elifesciences.org/articles/82922/elife-82922-fig1-data1-v2.xlsx
Figure 1—figure supplement 1

Concentration–response analysis for wildtype and chimeric odorant receptors (ORs).
(A) CquiOR10M3; (B) CquiOR10M4; (C) CquiOR10M5; (D) CquiOR10M6; (E) CquiOR10M7; (F) CquiOR10M3,4,5,6,7; (G) CquiOR10M3,4,5,6; (H) CquiOR10M4,5,6; (I) CquiOR10M3,5,6; (J) CquiOR10M3,4,6; (K) CquiOR10M3,4,5; (L) CquiOR10M3,4; (M) CquiOR10M3,5; (N) CquiOR10M3,6; (O) CquiOR10M3,7; (P) CquiOR10M4,5; (Q) CquiOR10M4,6; (R) CquiOR10M4,7; (S) CquiOR10M5,6; (T) CquiOR10M5,7; and (U) CquiOR10M6,7. Lines were obtained with nonlinear fit. Barsrepresent SEM. n = 3.
Figure 2
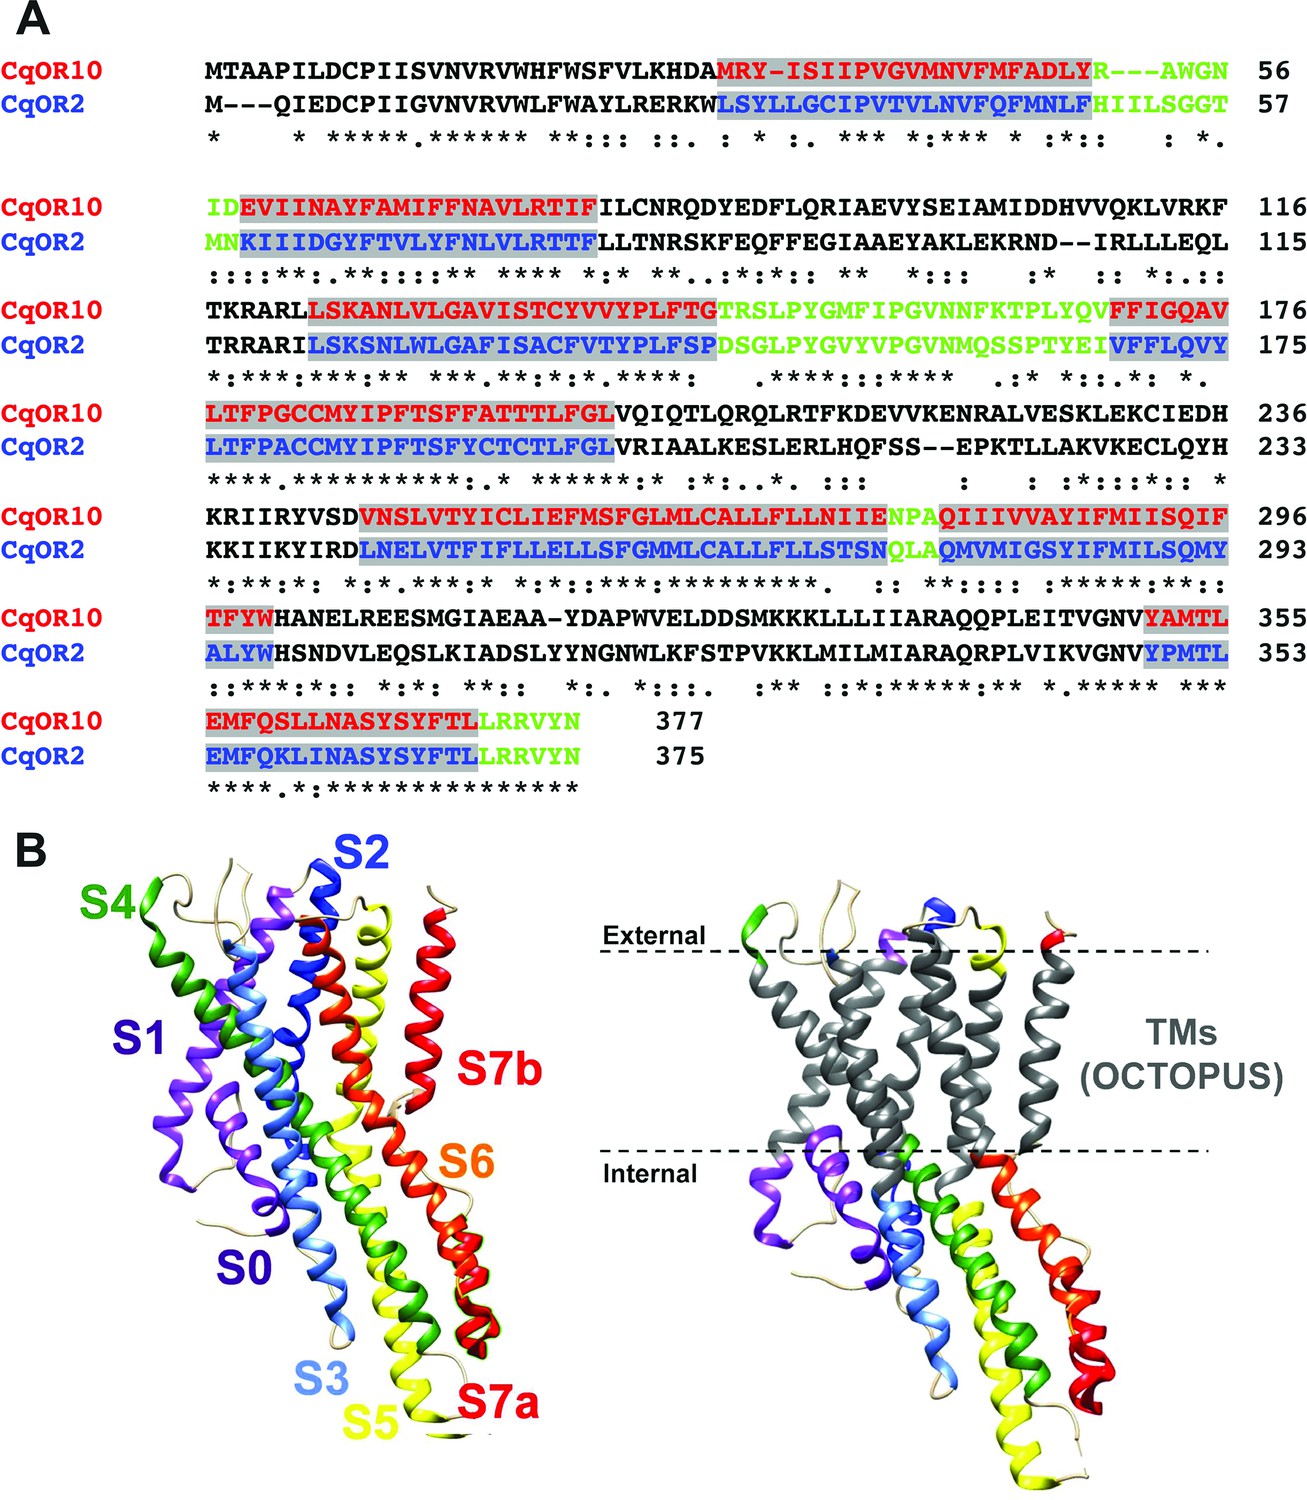
Alignment of the amino acid sequences of CquiOR10 and CquiOR2 highlighting the predicted transmembrane (TM) domains and a comparison of predicted and experimentally determined TM domains of the odorant receptor coreceptor, AbakOrco.
(A) CqOR10 and CqOR2 are abbreviations for CquiOR10 and CquiOR2, respectively. The TM domains, predicted by OCTOPUS, are displayed in red and blue for CquiOR10 and CquiOR2, respectively. The sequences of the N-terminus and the intracellular loops are displayed in black, and the C-terminus and extracellular loops in green. (B) Left: the cryo-EM structure of AbakOrco (PDB, 6C70) displayed in rainbow color using UCSF Chimera (Pettersen et al., 2004). Right: the predicted TM domains (right) are displayed in gray. The dashed lines represent the membrane boundaries.
Figure 3 with 1 supplement
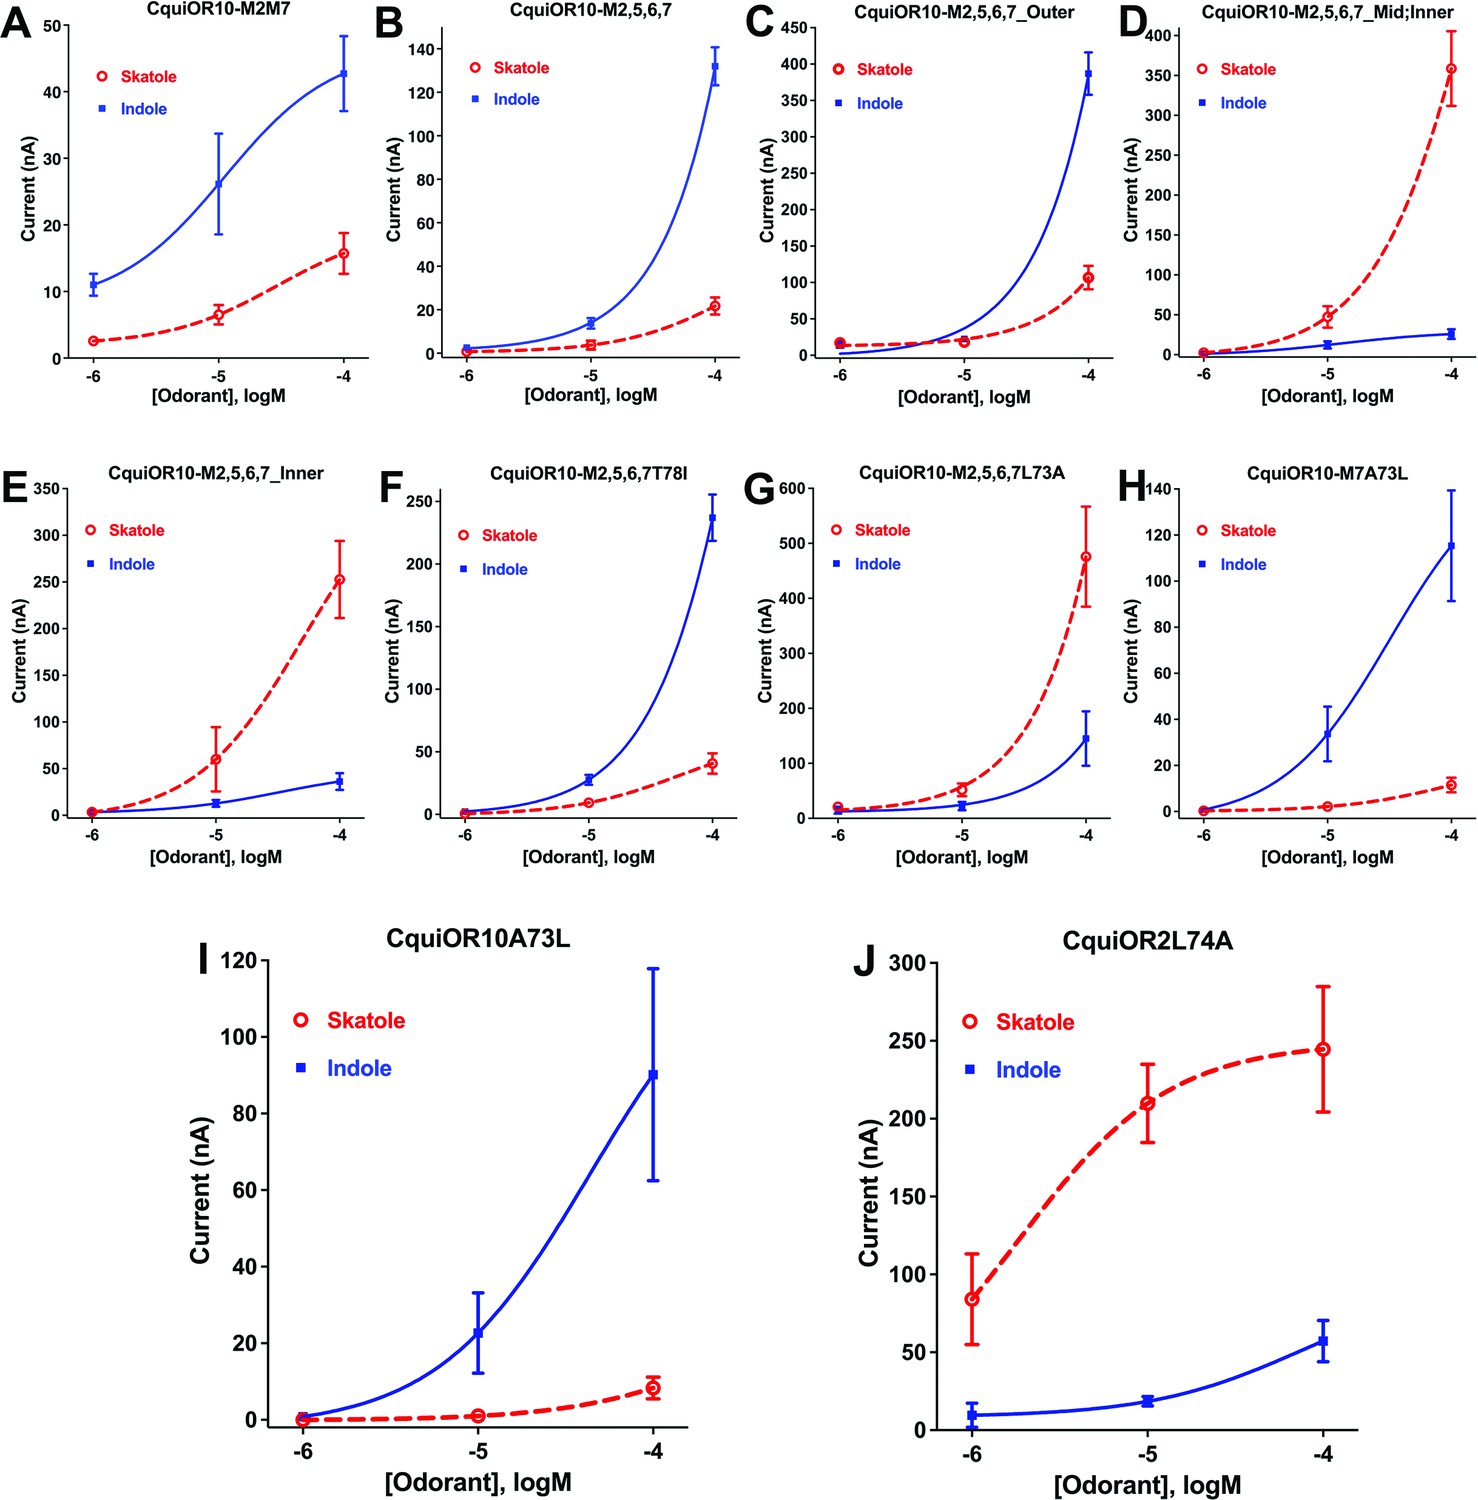
Concentration–response curves obtained with chimeric odorant receptors (ORs) stimulated with skatole and indole.
(A) CquiOR10M2,7; (B) CquiOR10M2,5,6,7; (C) CquiOR10M2,5,6,7_Outer; (D) CquiOR10M2,5,6,7_Mid;Inner; (E) CquiOR10M2,5,6,7_Inner; (F) CquiOR10M2,5,6,7T78I; (G) CquiOR10M2,5,6,7L73A; (H) CquiOR10M7A73L; (I) CquiOR10A73L; (J) CquiOR2L74A. Lines were obtained with nonlinear fit. Bars represent SEM. The number of replicates (n) were 7, 4, 5, 5, 4, 3, 9, 7, 6, and 5, respectively.
-
Figure 3—source data 1
Concentration–response curves obtained with chimeric odorant receptors (ORs) stimulated with skatole and indole.
- https://cdn.elifesciences.org/articles/82922/elife-82922-fig3-data1-v2.xlsx
Figure 3—figure supplement 1
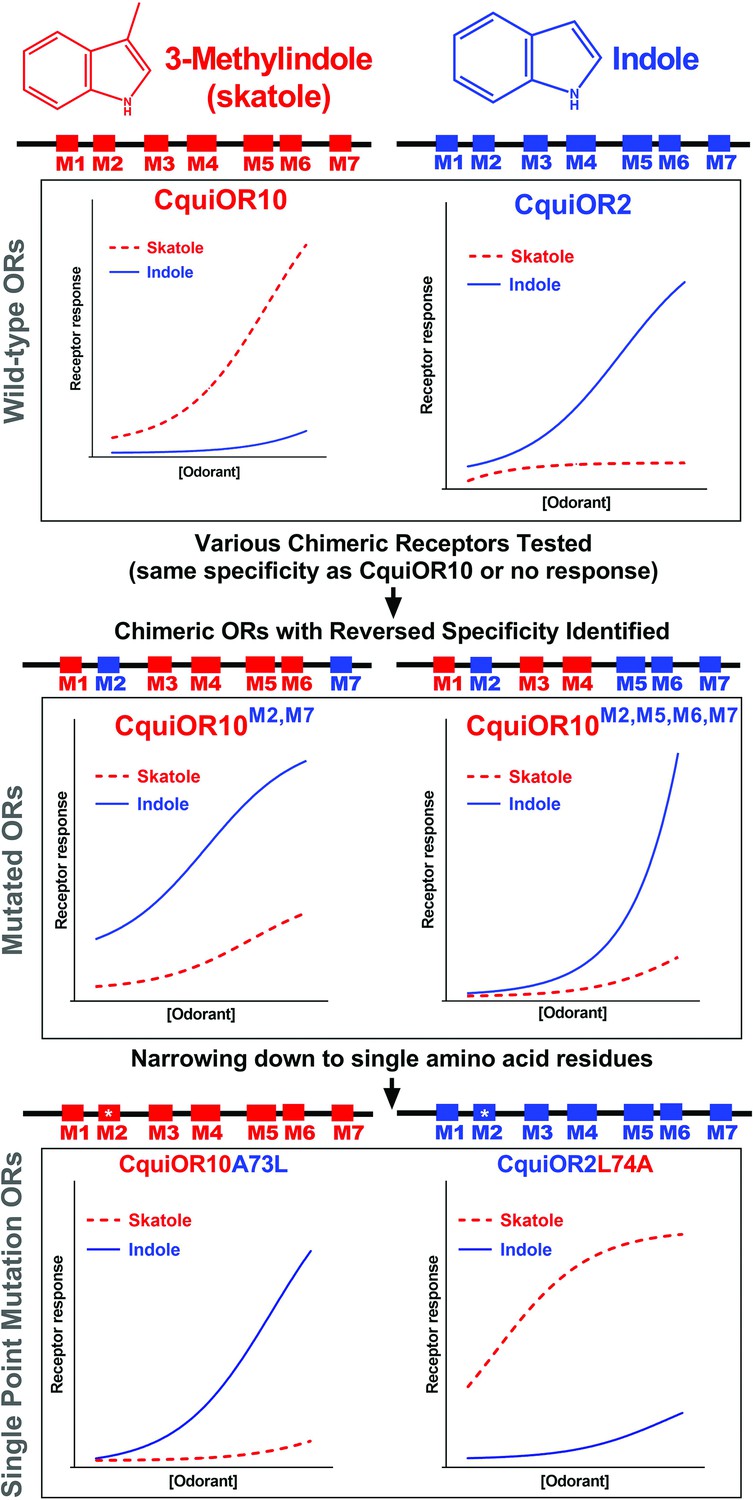
Schematic view of the workflow.
Figure 4

Partial sequences of CquiOR10 and chimeric odorant receptors (ORs) highlighting transmembrane domain-2 (TM2).
The two last residues of the extracellular loop-1 (Ile-57 and Asp-58) appear in the N-terminus. The TM2 was divided into the arbitrary segments outer, middle (mid), and inner to identify specificity determinants.
Figure 5
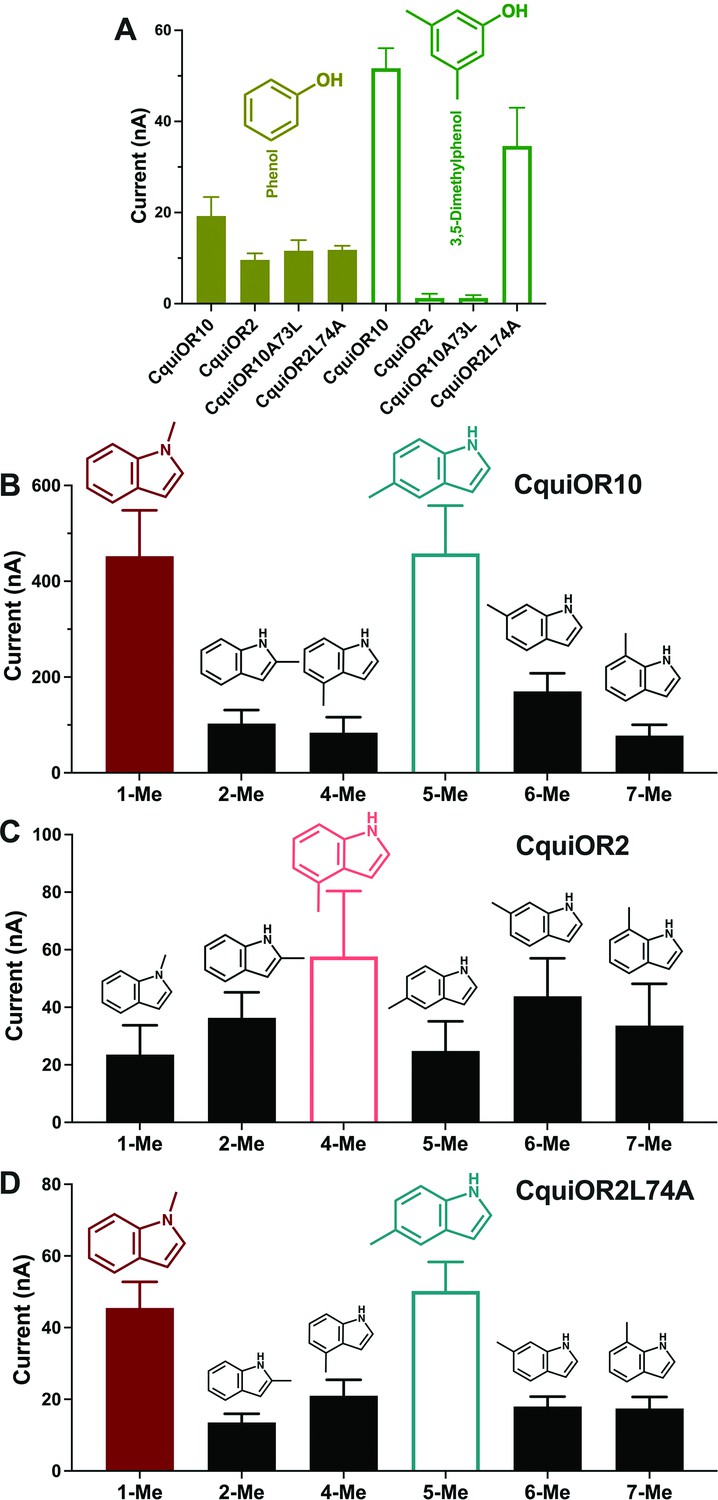
Quantification of wildtype and chimeric receptors to phenol and 2,3-dimethylphenol, and methylindoles.
(A) Each receptor was co-expressed with CquiOrco in Xenopus oocytes and stimulated with the phenolic compounds at 1 mM. n = 3–5. (B) CquiOR10/CquiOrco-, (C) CquiOR2/CquiOrco-, and (D)-CquiOR2L74A-expressing oocytes were stimulated with 100 µM of the specified methylindoles. n = 9–11. Bars represent SEM.
-
Figure 5—source data 1
Quantification of wildtype and chimeric receptors to phenol and 2,3-dimethylphenol, and methylindoles.
- https://cdn.elifesciences.org/articles/82922/elife-82922-fig5-data1-v2.xlsx
Figure 6 with 4 supplements
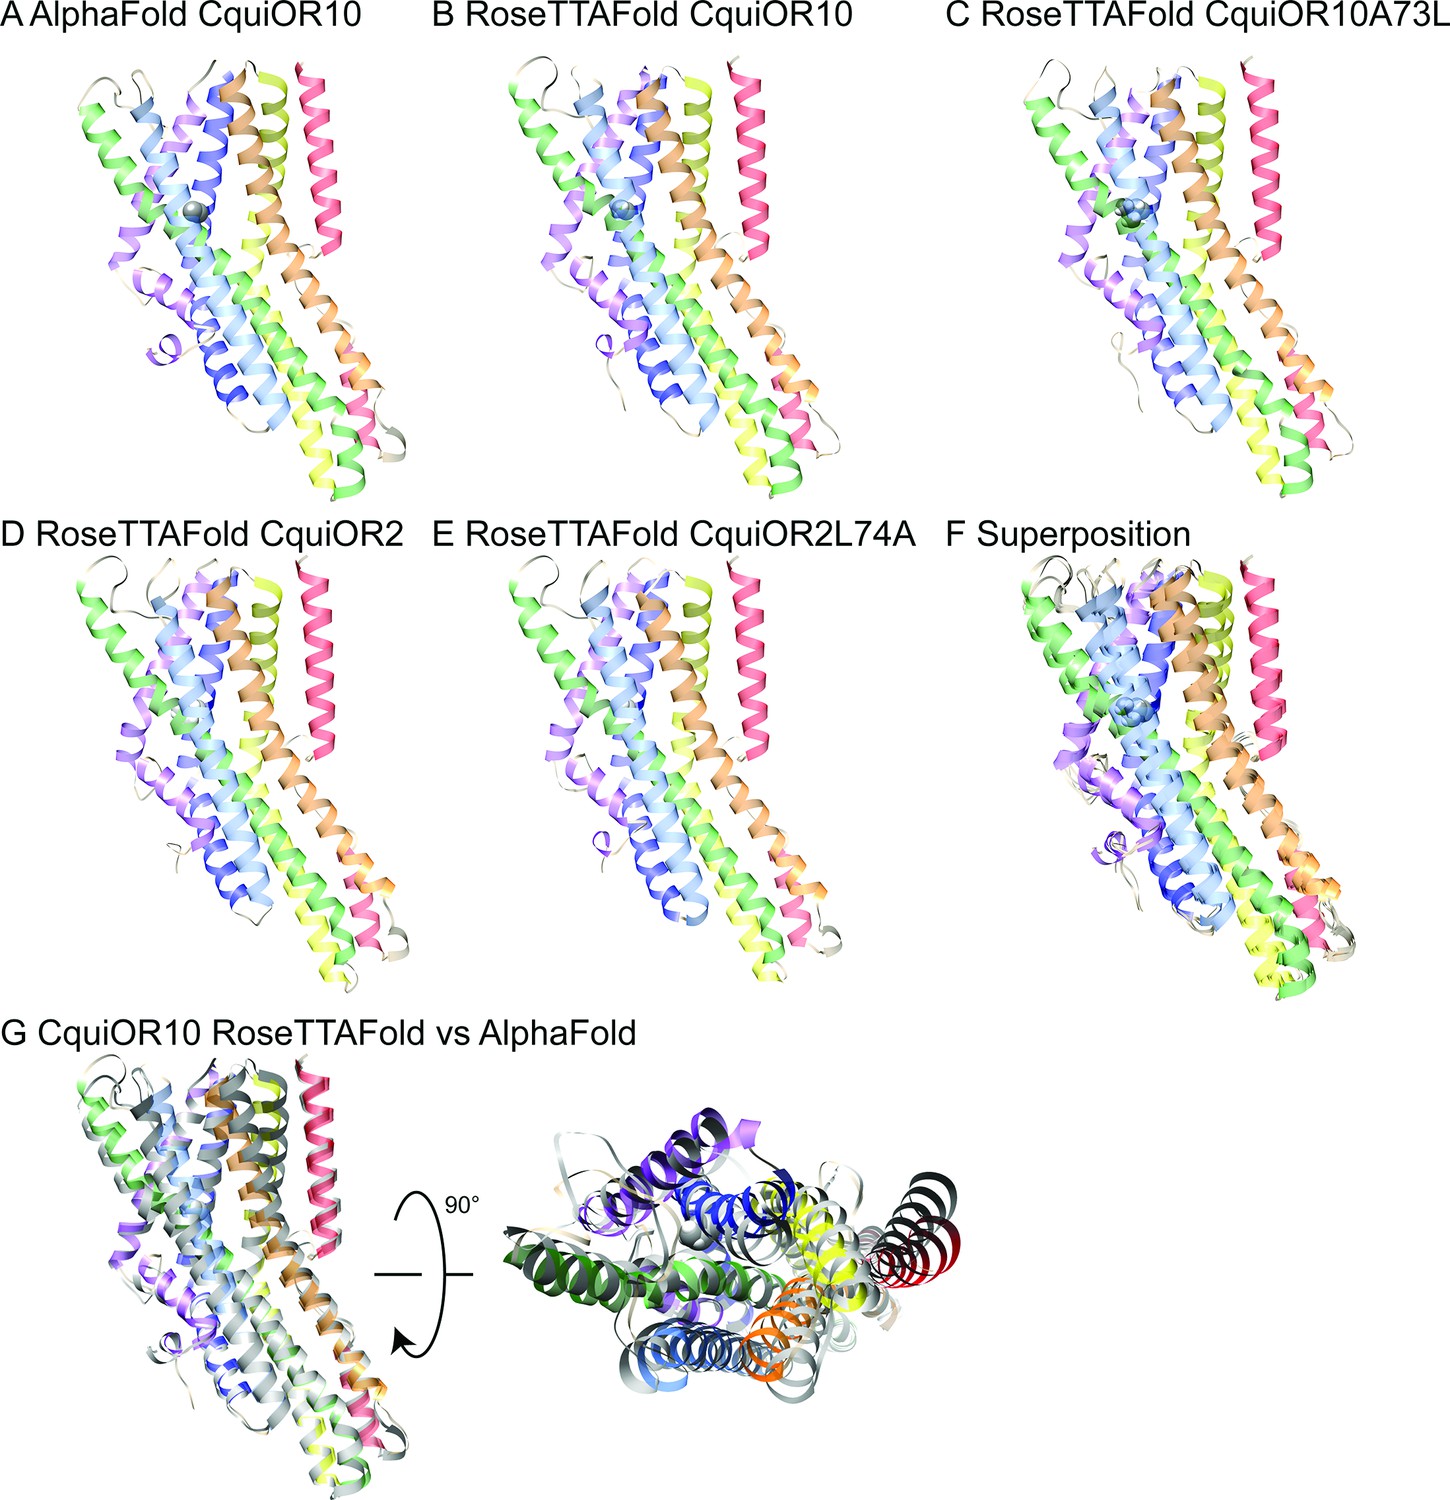
AlphaFold and RoseTTAFold models.
Structural models of CquiOR10 (A, B), CquiOR10A73L (C), CquiOR2 (D), and CquiOR2L74A (E) with AlphaFold (A) and RoseTTAFold (B–E) structure prediction methods. Superposition of all RoseTTAFold models (F) resulted in transmembrane helix root mean square deviation (RMSD) of 0.8 Å when aligned with RoseTTAFold CquiOR10. (G) The transmembrane helix RMSD of CquiOR10 RoseTTAFold (rainbow) vs. AlphaFold (gray) was 1.7 Å. Loops were not included in RMSD calculation due to inherent flexibility during structure prediction.
Figure 6—figure supplement 1
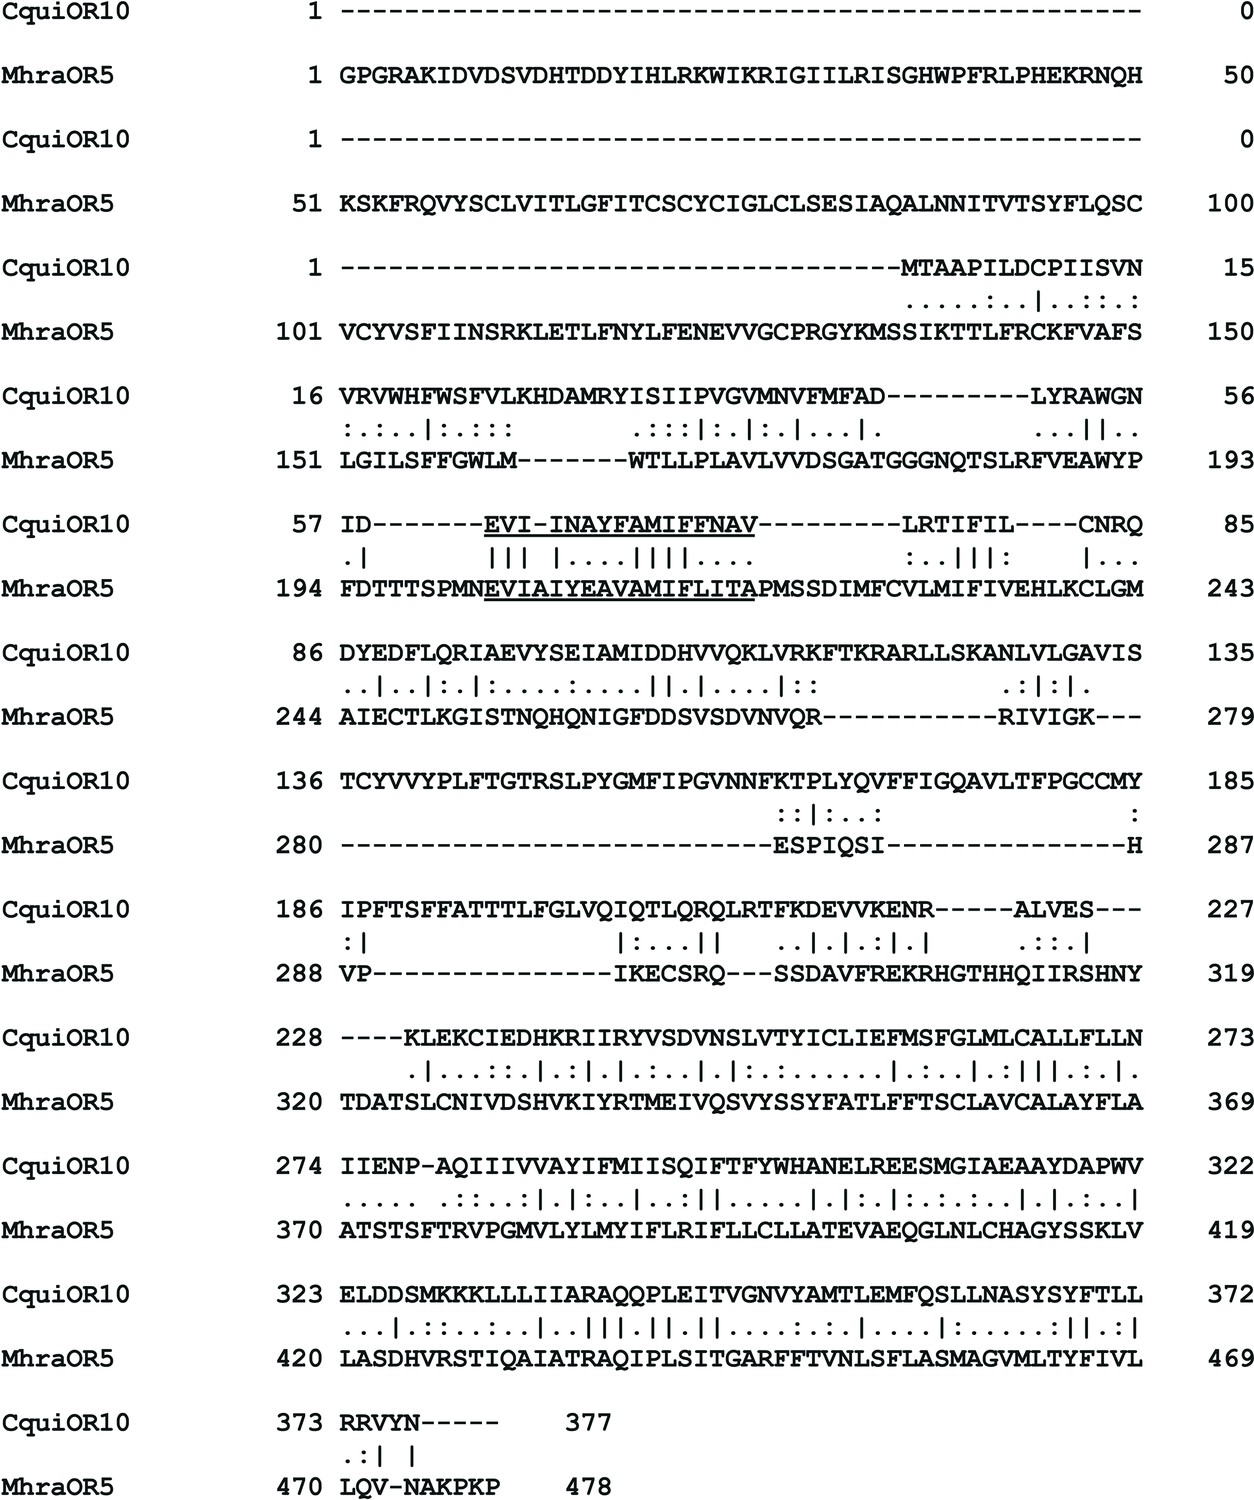
Pairwise alignment of CquiOR10 and MhraOR5.
Figure 6—figure supplement 2
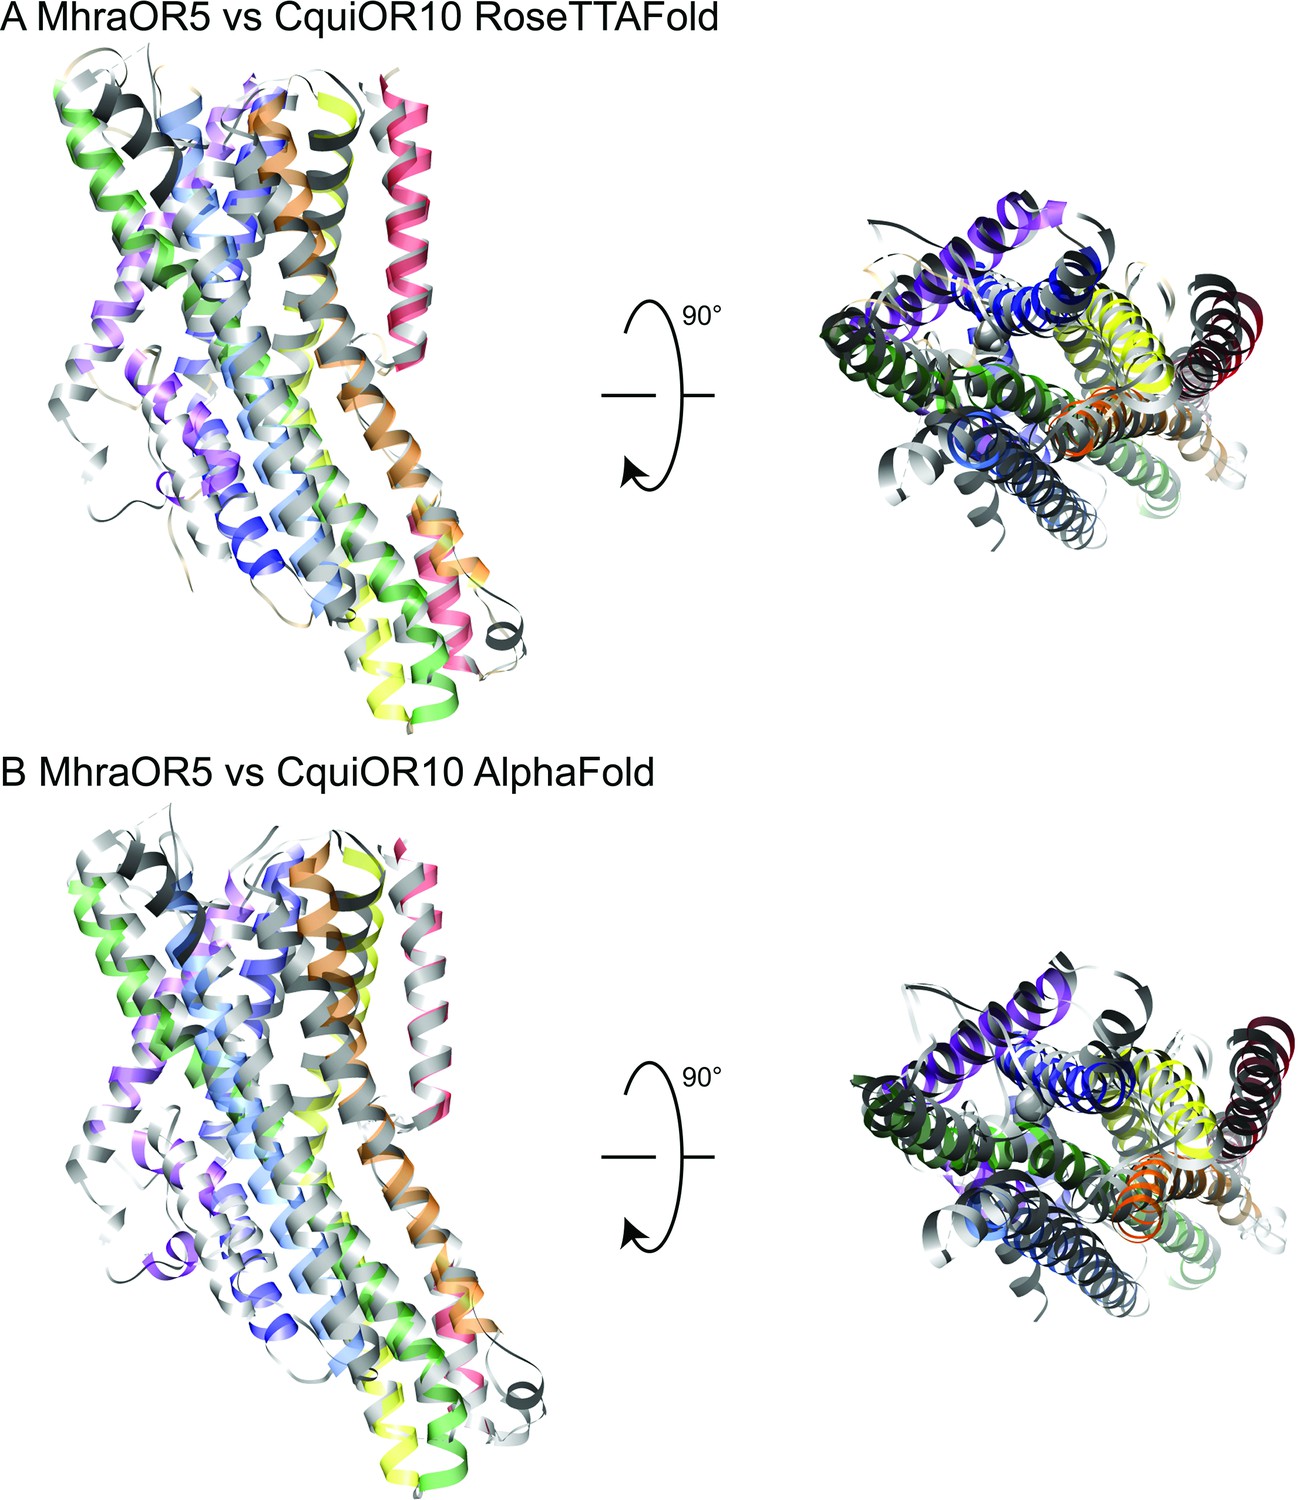
Overlay of MhraOR5 structure and CquiOR10 models.
(A) RoseTTAFold and (B) AlphaFold models for CquiOR10.
Figure 6—figure supplement 3
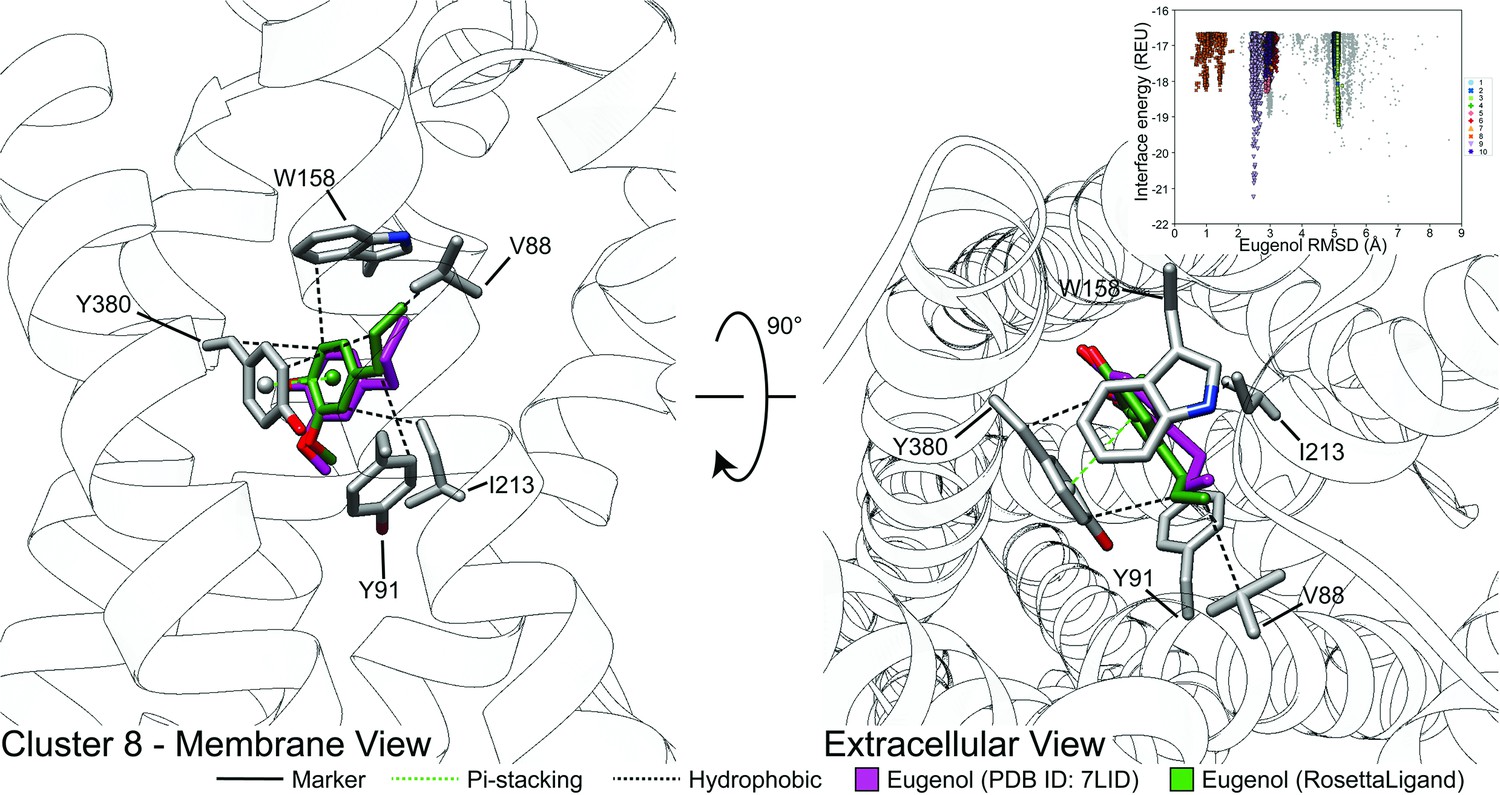
Representative model of docked eugenol with MhraOR5.
Figure 6—figure supplement 4

Additional clusters of eugenol docked to MhraOR5.
Figure 7 with 8 supplements
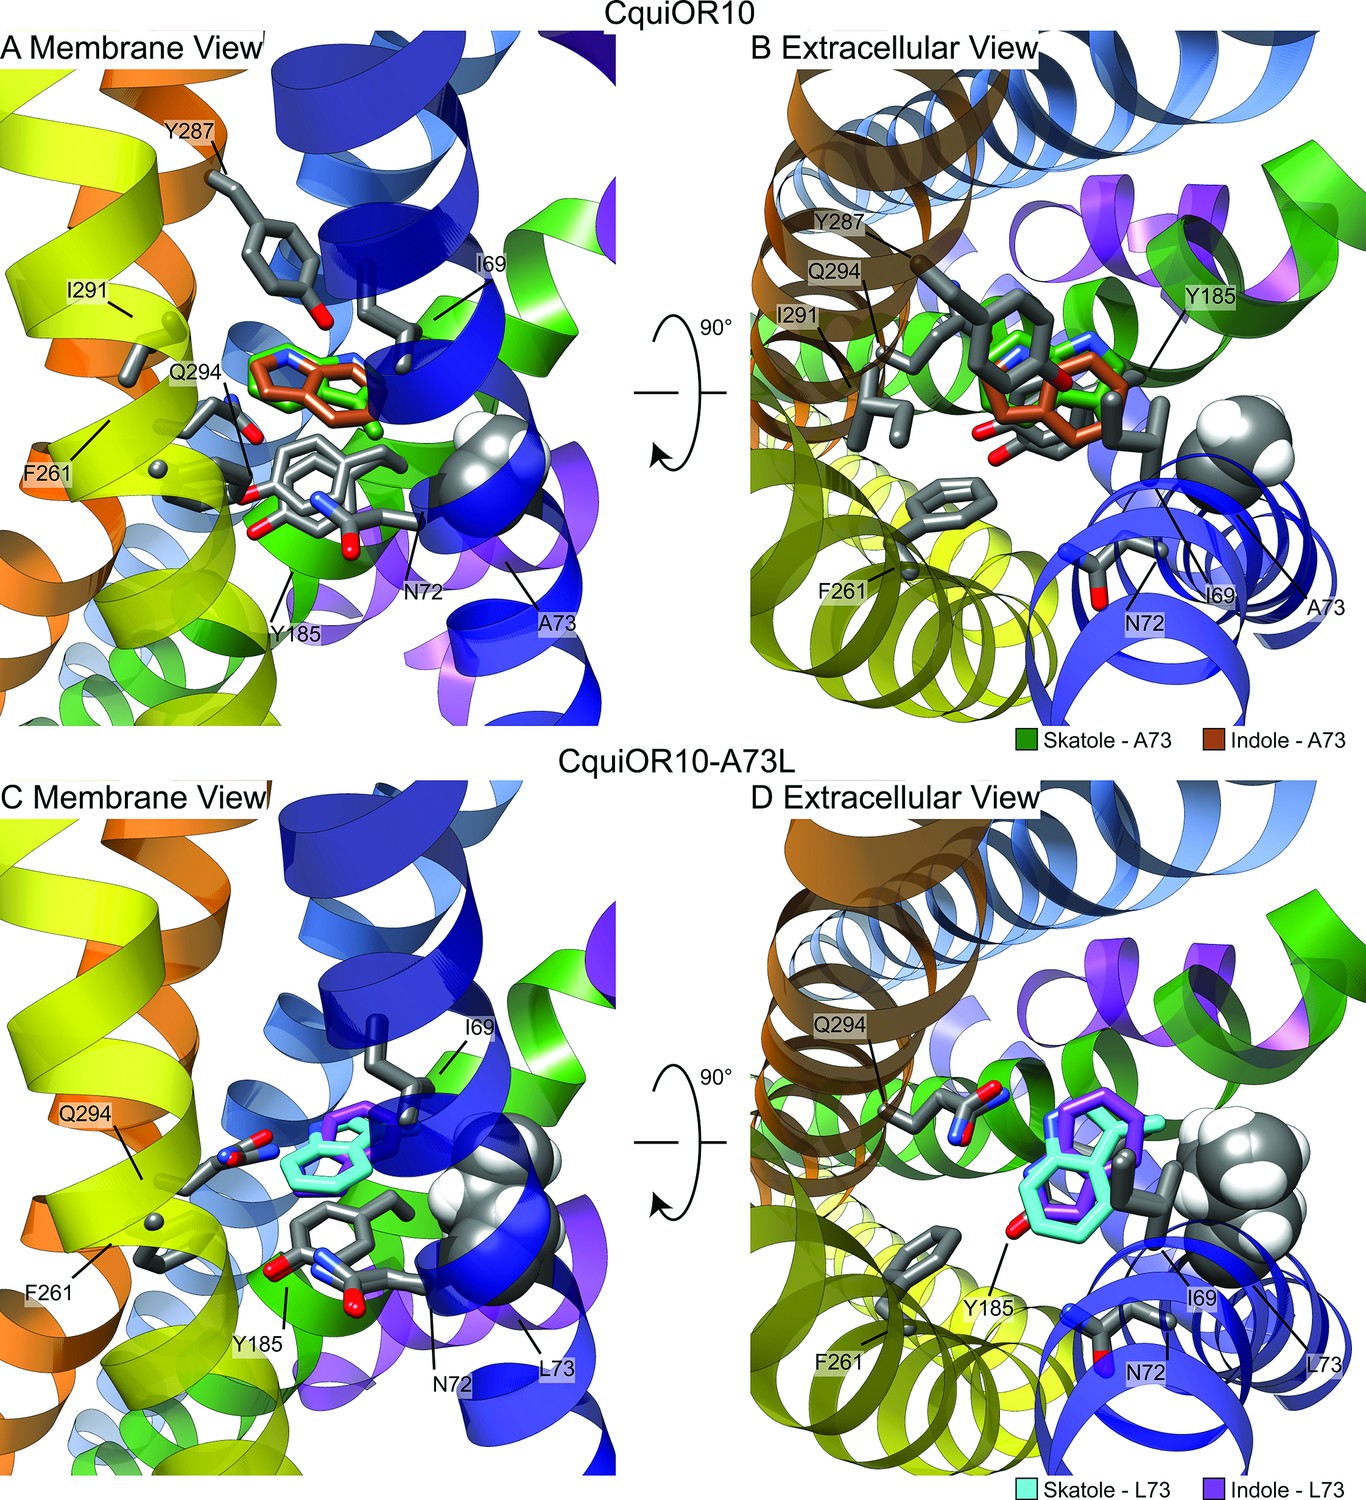
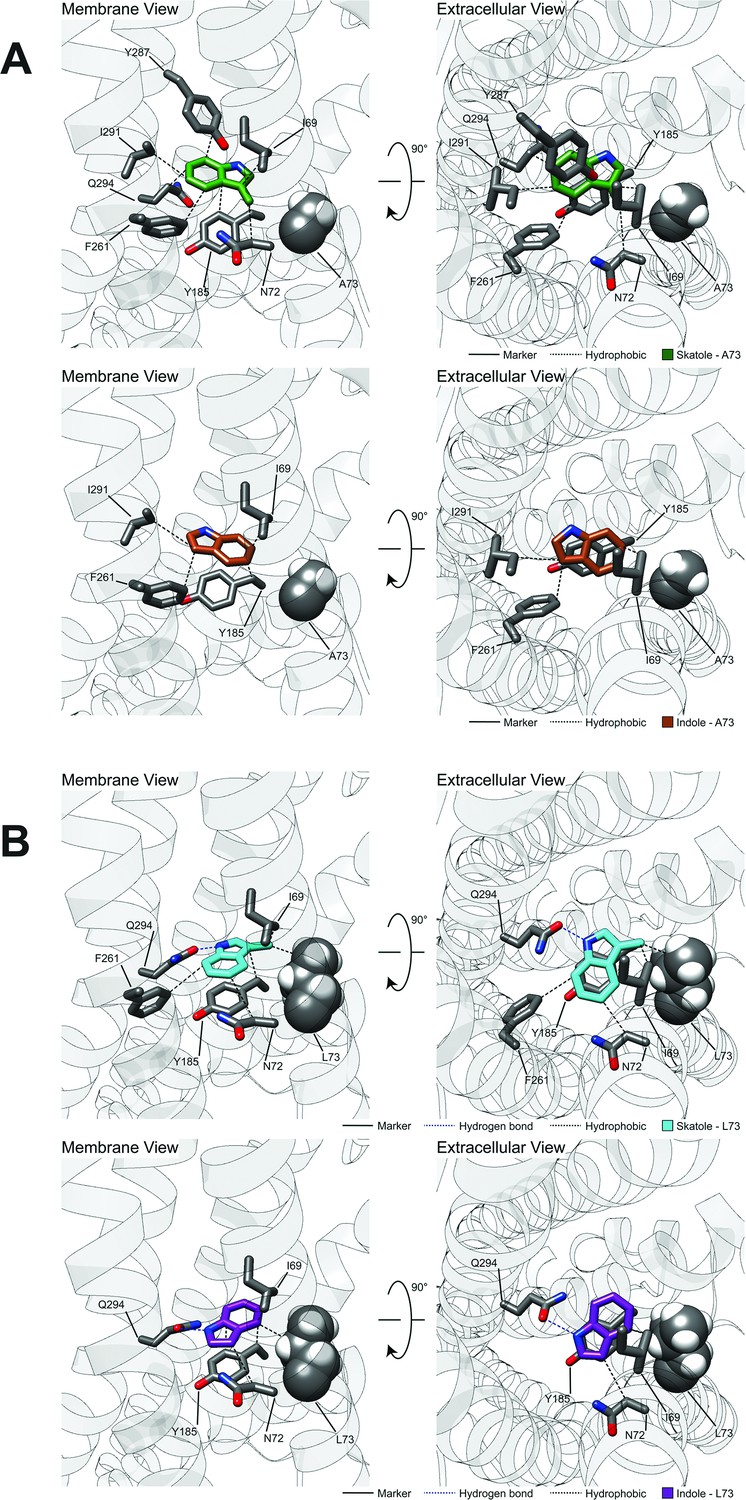
Representative models of docked skatole and indole in complex with CquiOR10 and CquiOR10A73L using RosettaLigand.
Each model shown is the lowest interface-energy model from the 10 largest clusters of each docking study. CquiOR10 – skatole (forest green), CquiOR10 – indole (brown), CquiOR10A73L – skatole (light blue), and CquiOR10A73L – indole (purple). Atoms that are not indole/skatole carbon atoms are color-coded by atom type: carbon (gray), nitrogen (dark blue), and oxygen (red). Ala-73 and Leu-73 indicated with space-filling representation. (A, B) and (C, D) Mebrane and extracellular views for CquiOR10 and CquiOR10A73L, respectively.
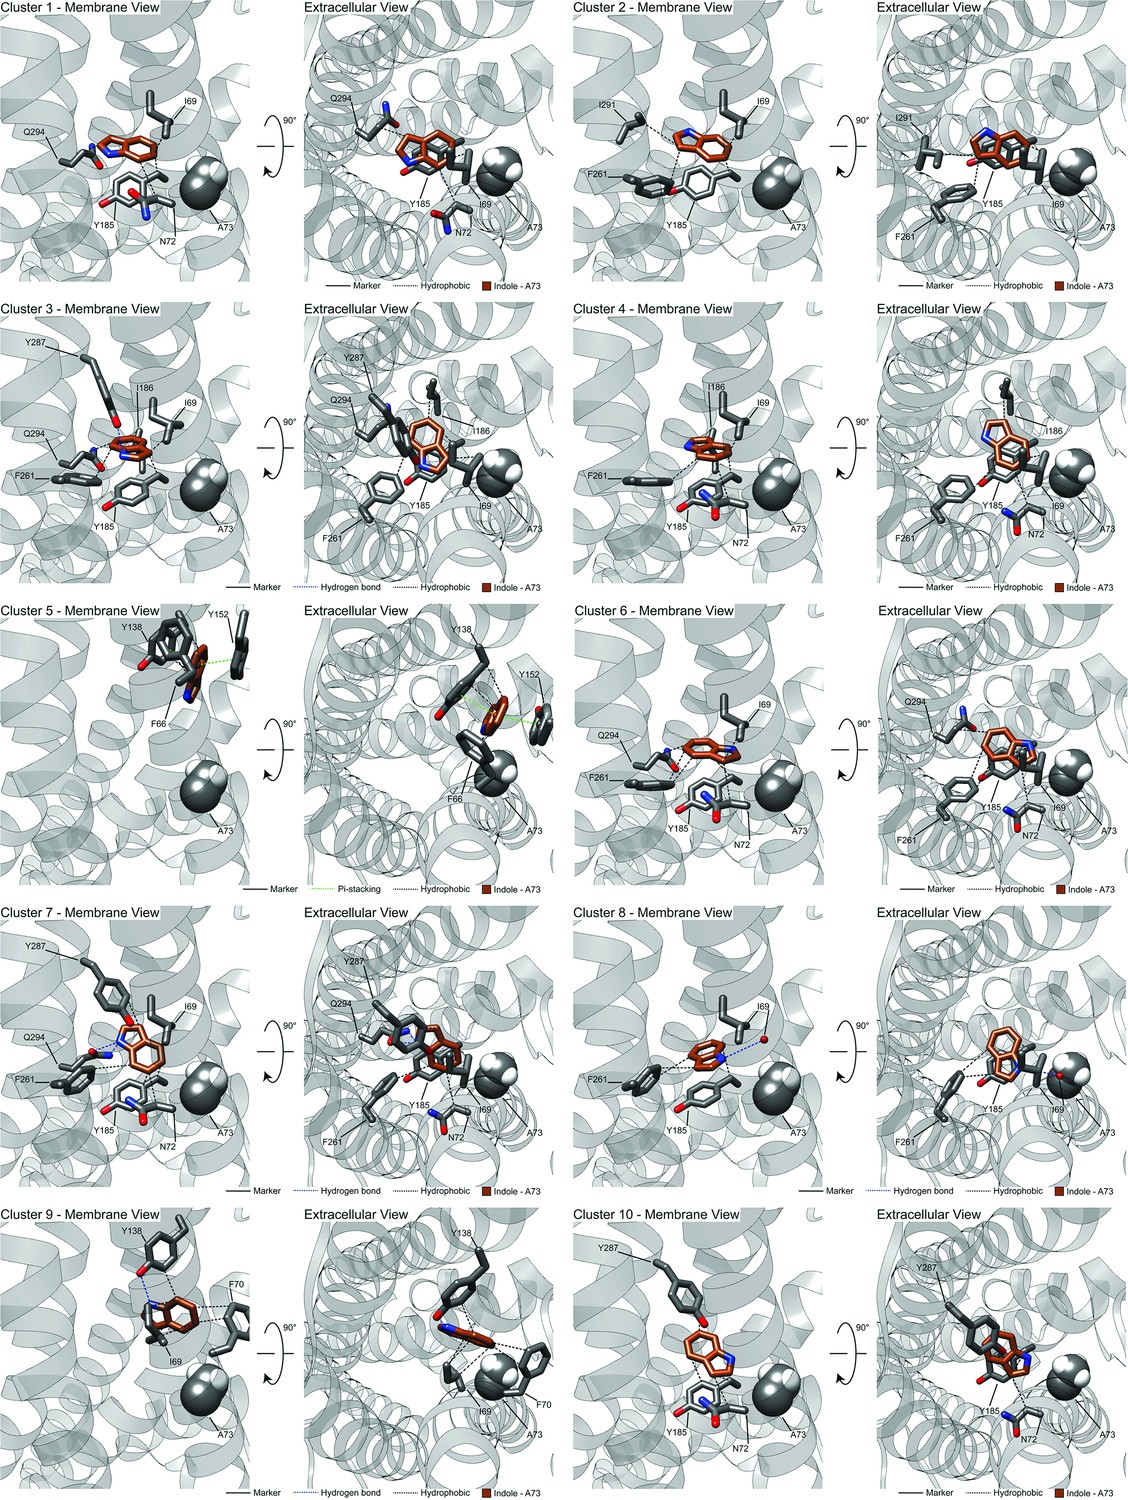
Figure 7—figure supplement 1
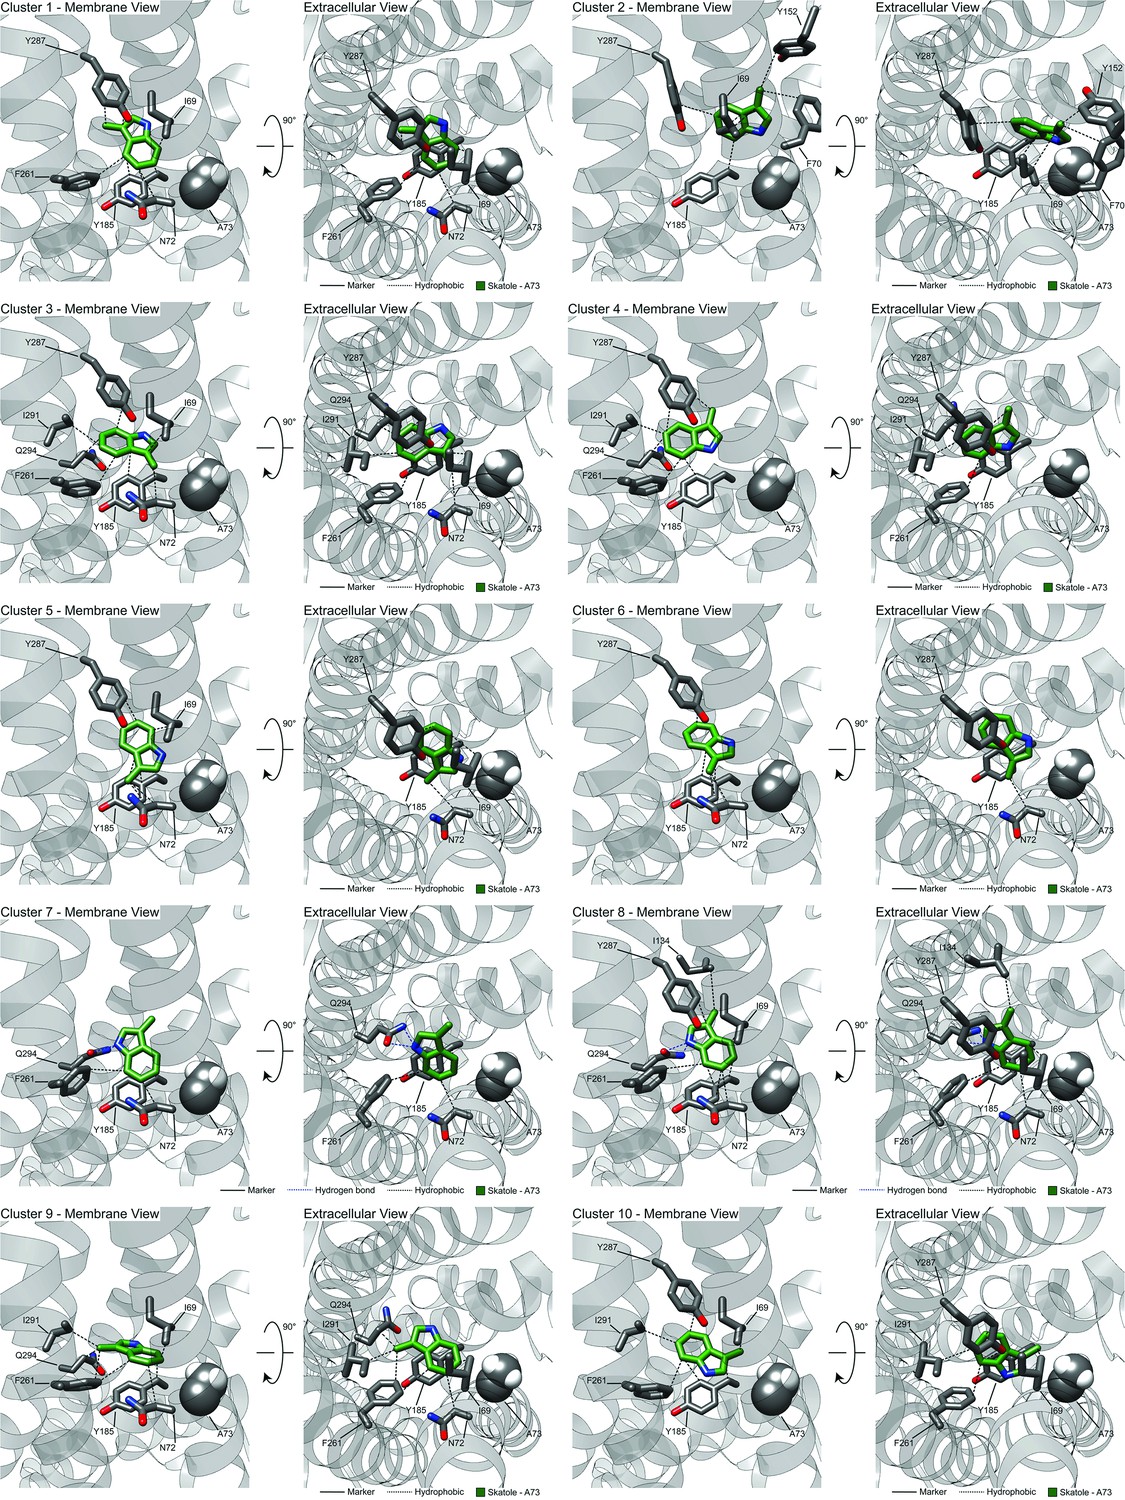
Clusters from RosettaLigand docking of skatole or indole to CquiOR10 or CquiOR10A73L.
Figure 7—figure supplement 2
Zoom-out view of CquiOR10 or CquiOR10A73L complexed to skatole or indole.
Figure 7—figure supplement 3

Representative models of docked skatole or indole to CquiOR10 or CquiOR10A73L with PLIC analysis.
Figure 7—figure supplement 4
Superimposition of all OR-skatole and OR-indole clusters.
OR: odorant receptor.
Figure 7—figure supplement 5

Example of sampling from ligand docking.
(A) CquiOR10 and (B) CquiOR10A73L.
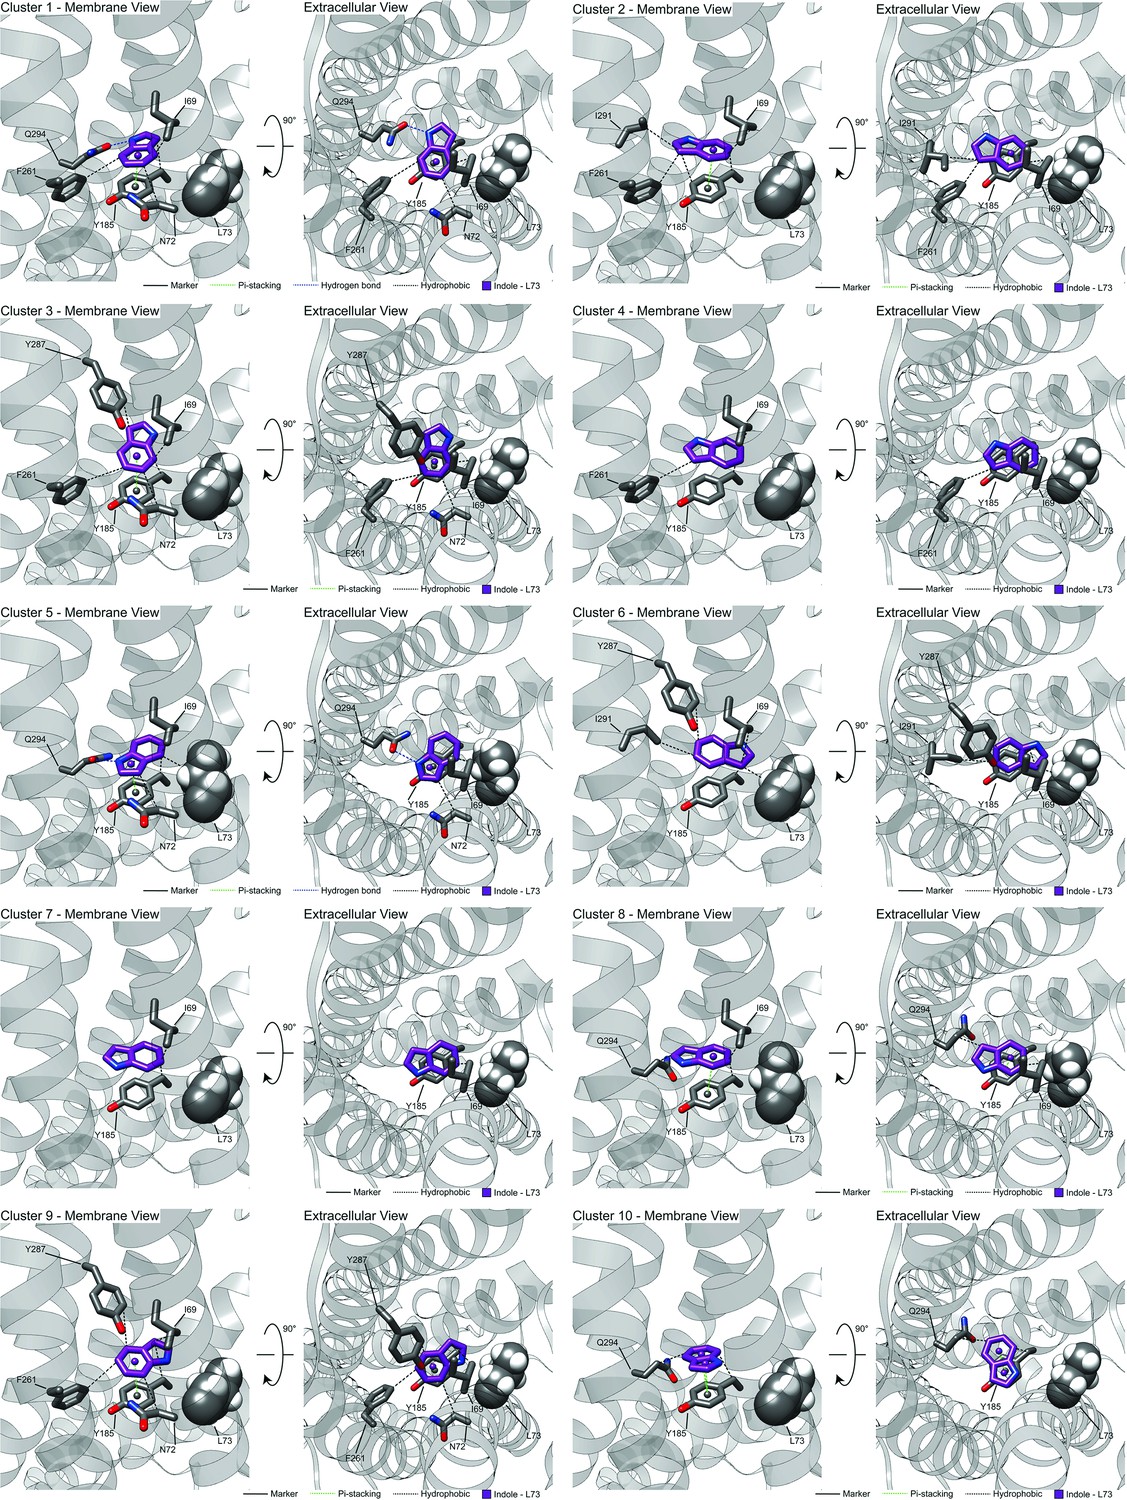
Figure 7—figure supplement 6
Representative RosettaLigand docking of skatole and indole to (A) CquiOR10 and (B) CquiOR10A73L with PLIP analysis.
The representative is the lowest interface-scoring energy model from the 10 most frequent clusters of each test case. Hydrogen bond andpi-stacking interactions were filtered by previously reported bond distances (Bissantz et al., 2010).
Figure 7—figure supplement 7
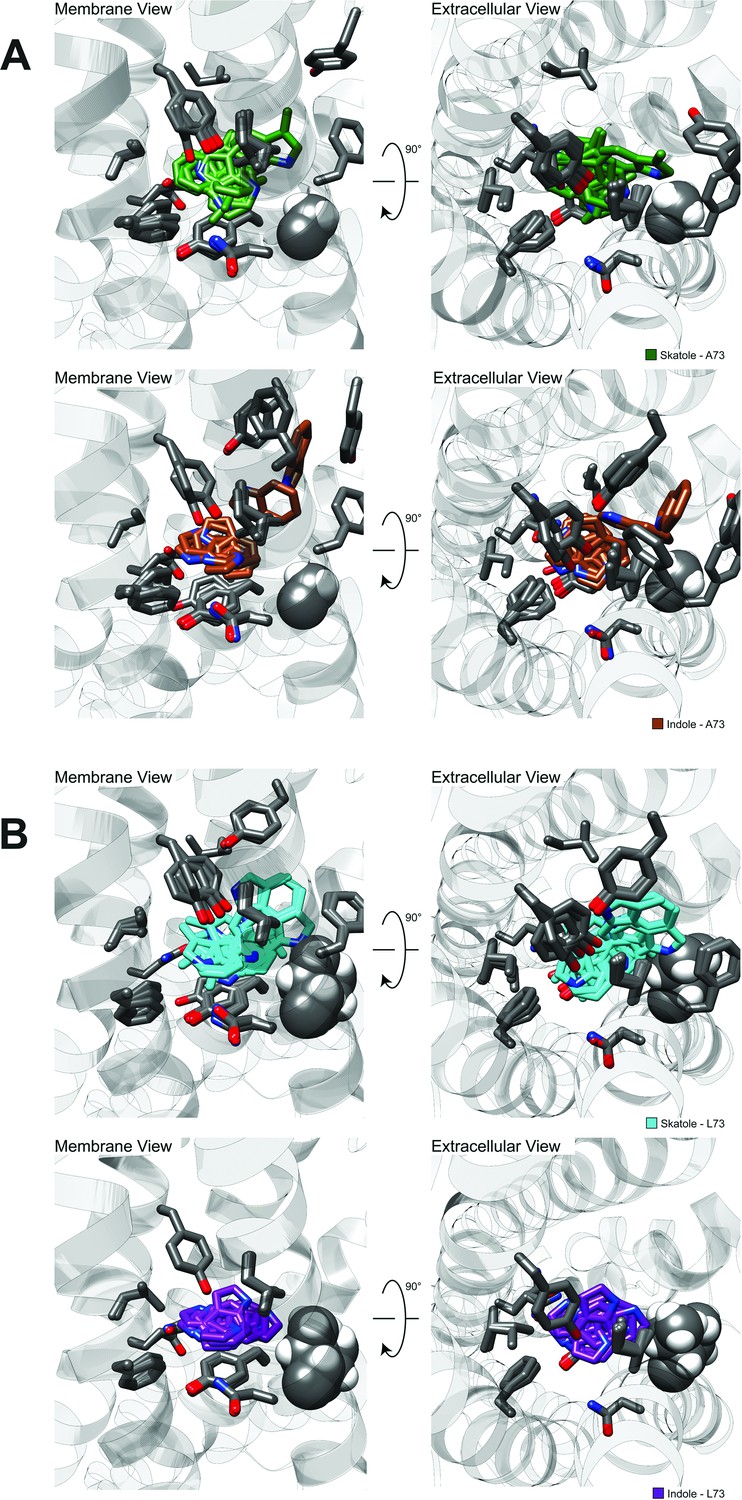
Superposition of all clusters of skatole and indole docked to (A) CquiOR10 and (B) CquiOR10-A73L.
Figure 7—figure supplement 8
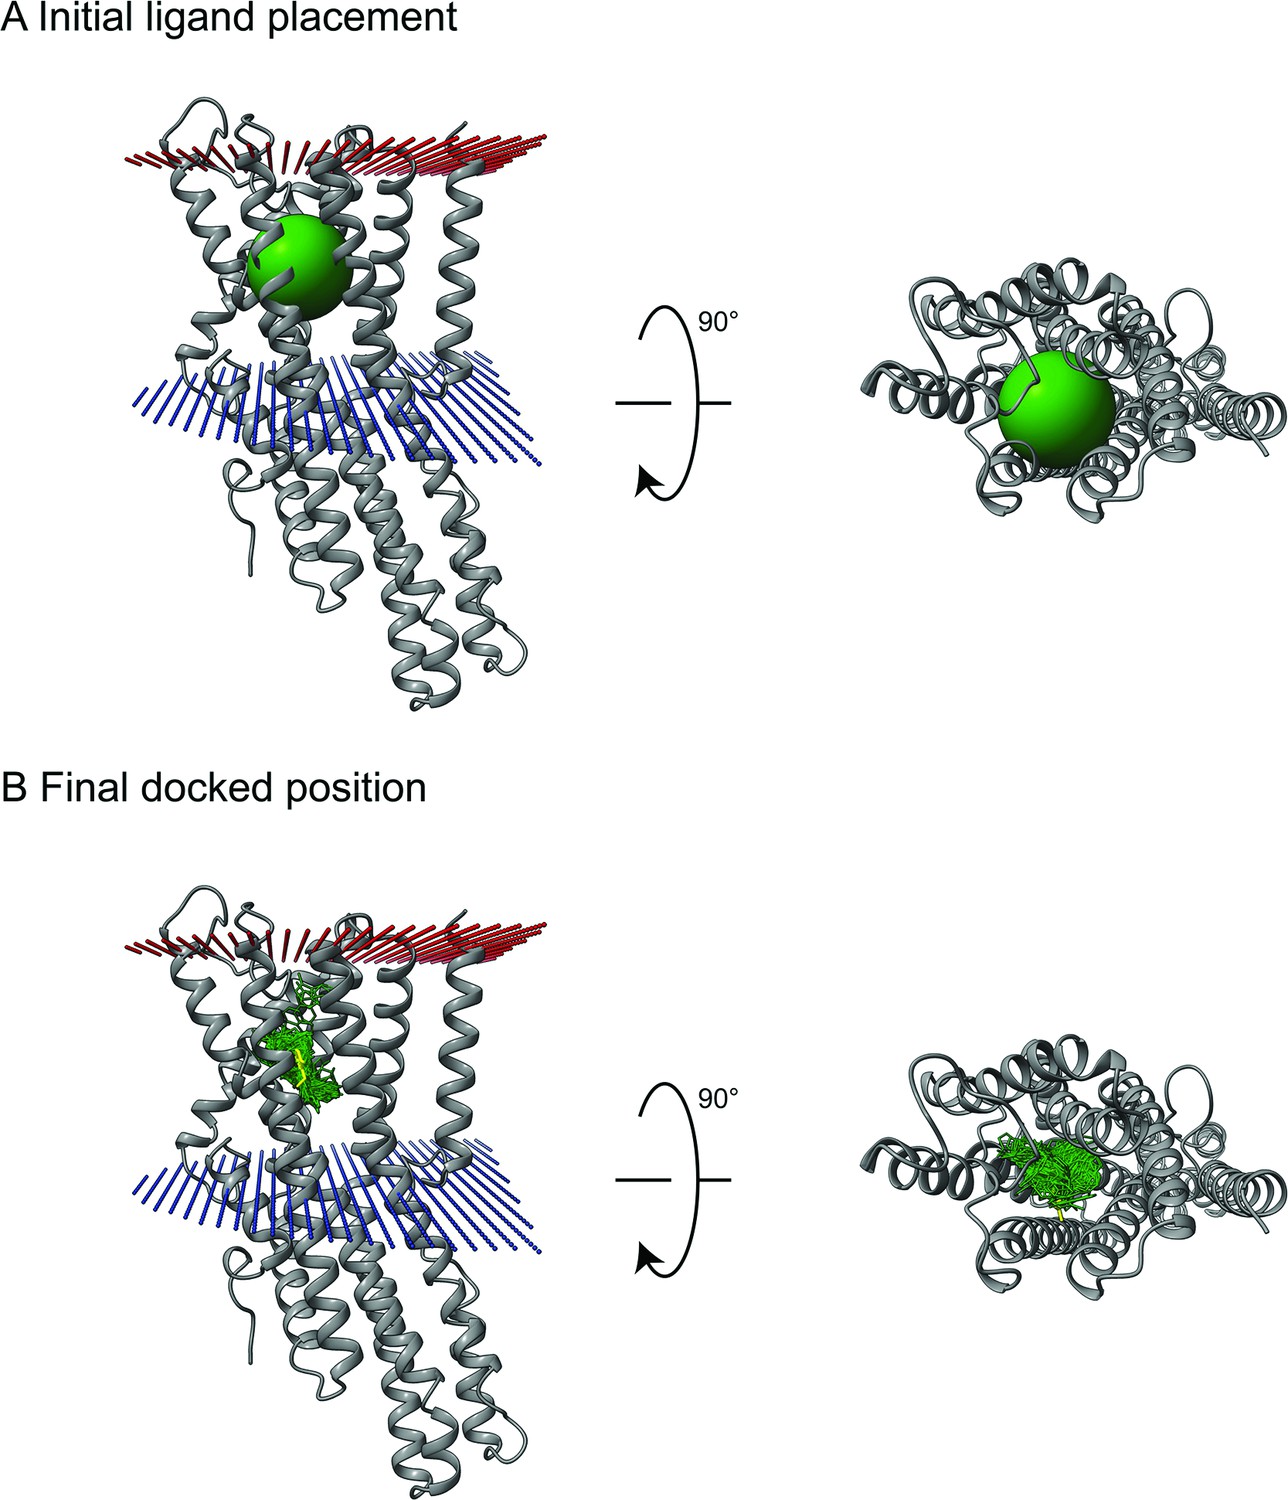
Example of sampling from ligand docking.
(A) Odorants docked to CquiOR (grey) were positioned relative to eugenol from MhraOR5 (PDB 7LID) and then randomlyrotated/translated within 7 Å as a starting position for docking. The green sphere represents the 7 Å sampling boundary. (B) An example demonstrating thesampling of skatole (green) docked to CquiOR10 after docking with eugenol (yellow) as a positional reference. Red: extracellular membrane boundary. Blue: cytosplasmic membrane boundary.
Figure 8 with 2 supplements
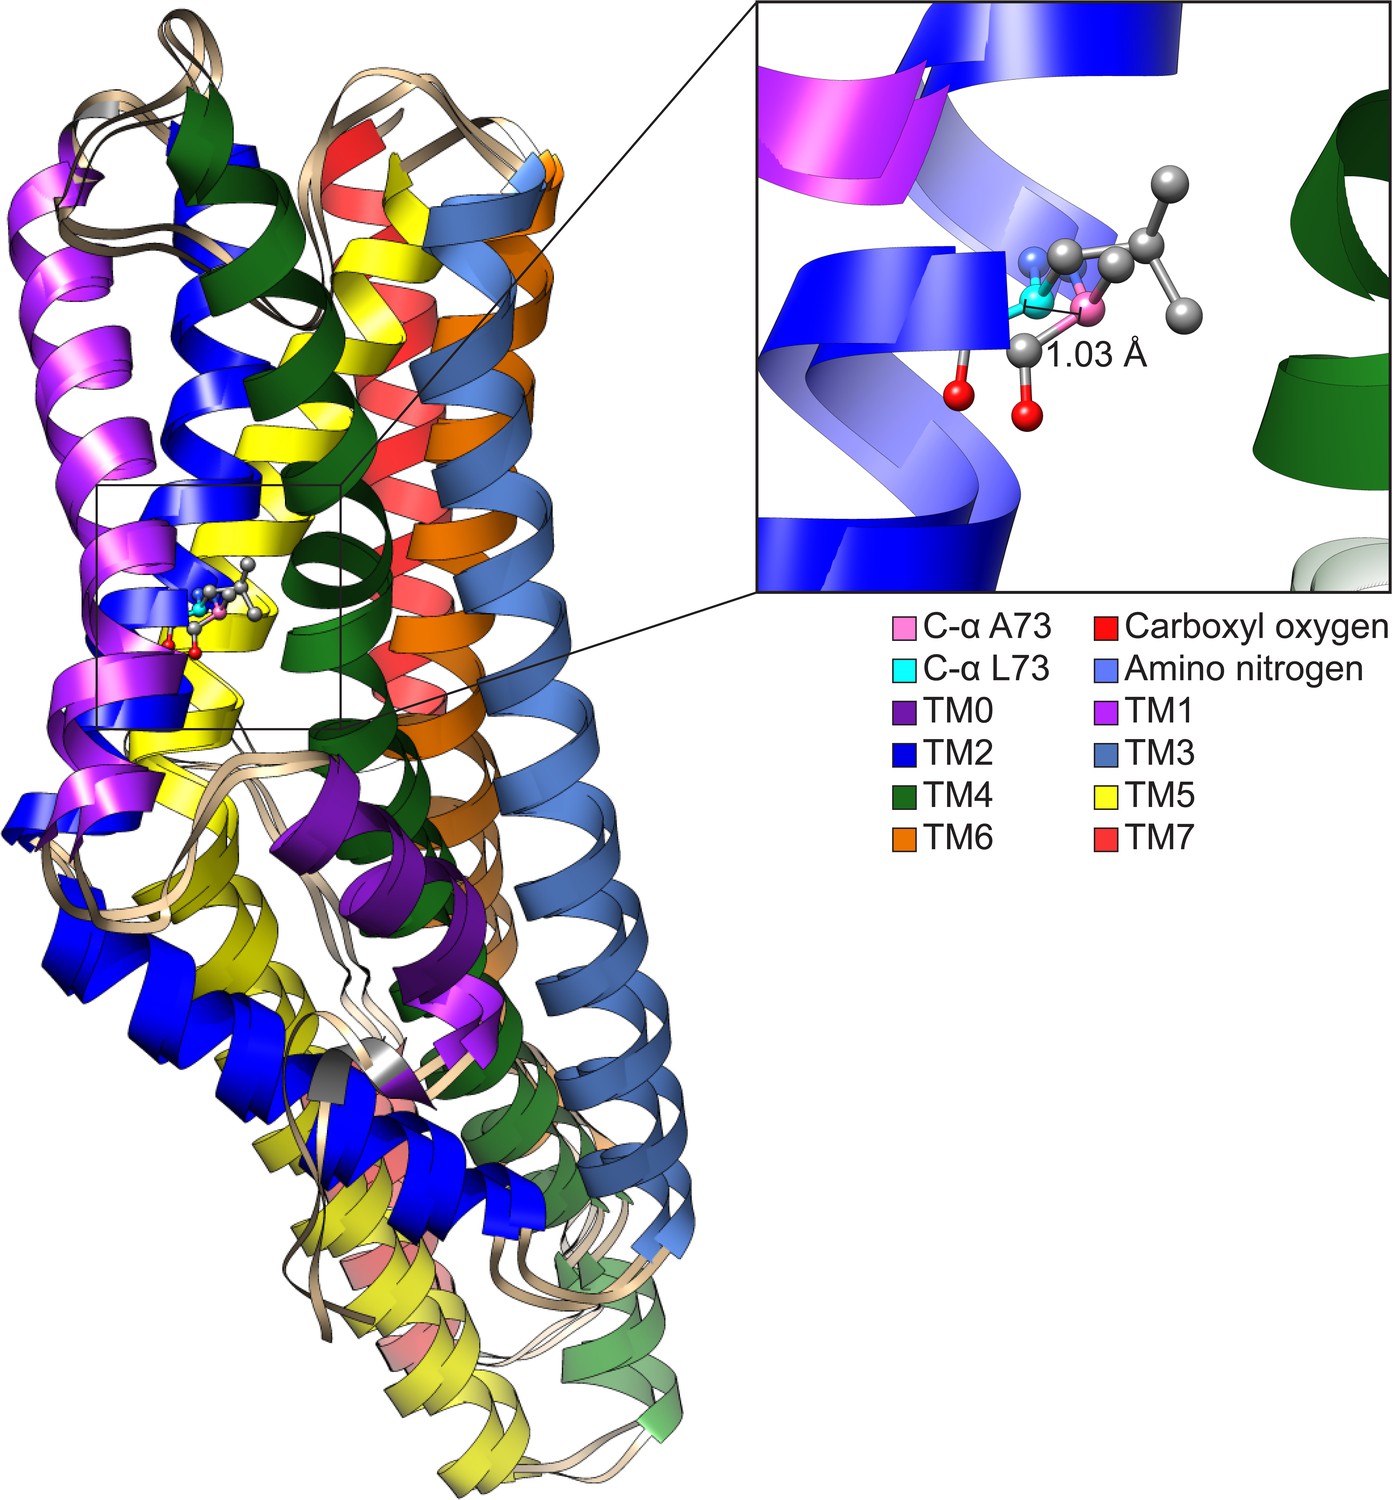
Comparison of CquiOR10 and CquiOR10A73L models.
An approximate 1 Å α-carbon outward shift of Leu-73 (forest green) in CquiOR10 model relative to Ala-73 (light blue) in CquiOR10A73L model. Models were superimposed using the TM7b region. Residue 73 amino nitrogen is colored in dark blue, and carboxyl oxygen is colored in red in each model.
Figure 8—figure supplement 1

Effect of single-point mutations around A73.
(A-C) CquiOR10 mutants. (D-F) CquiOR2 mutants.
Figure 8—figure supplement 2
Quantification of single-point mutations around A73.
Figure 9 with 1 supplement
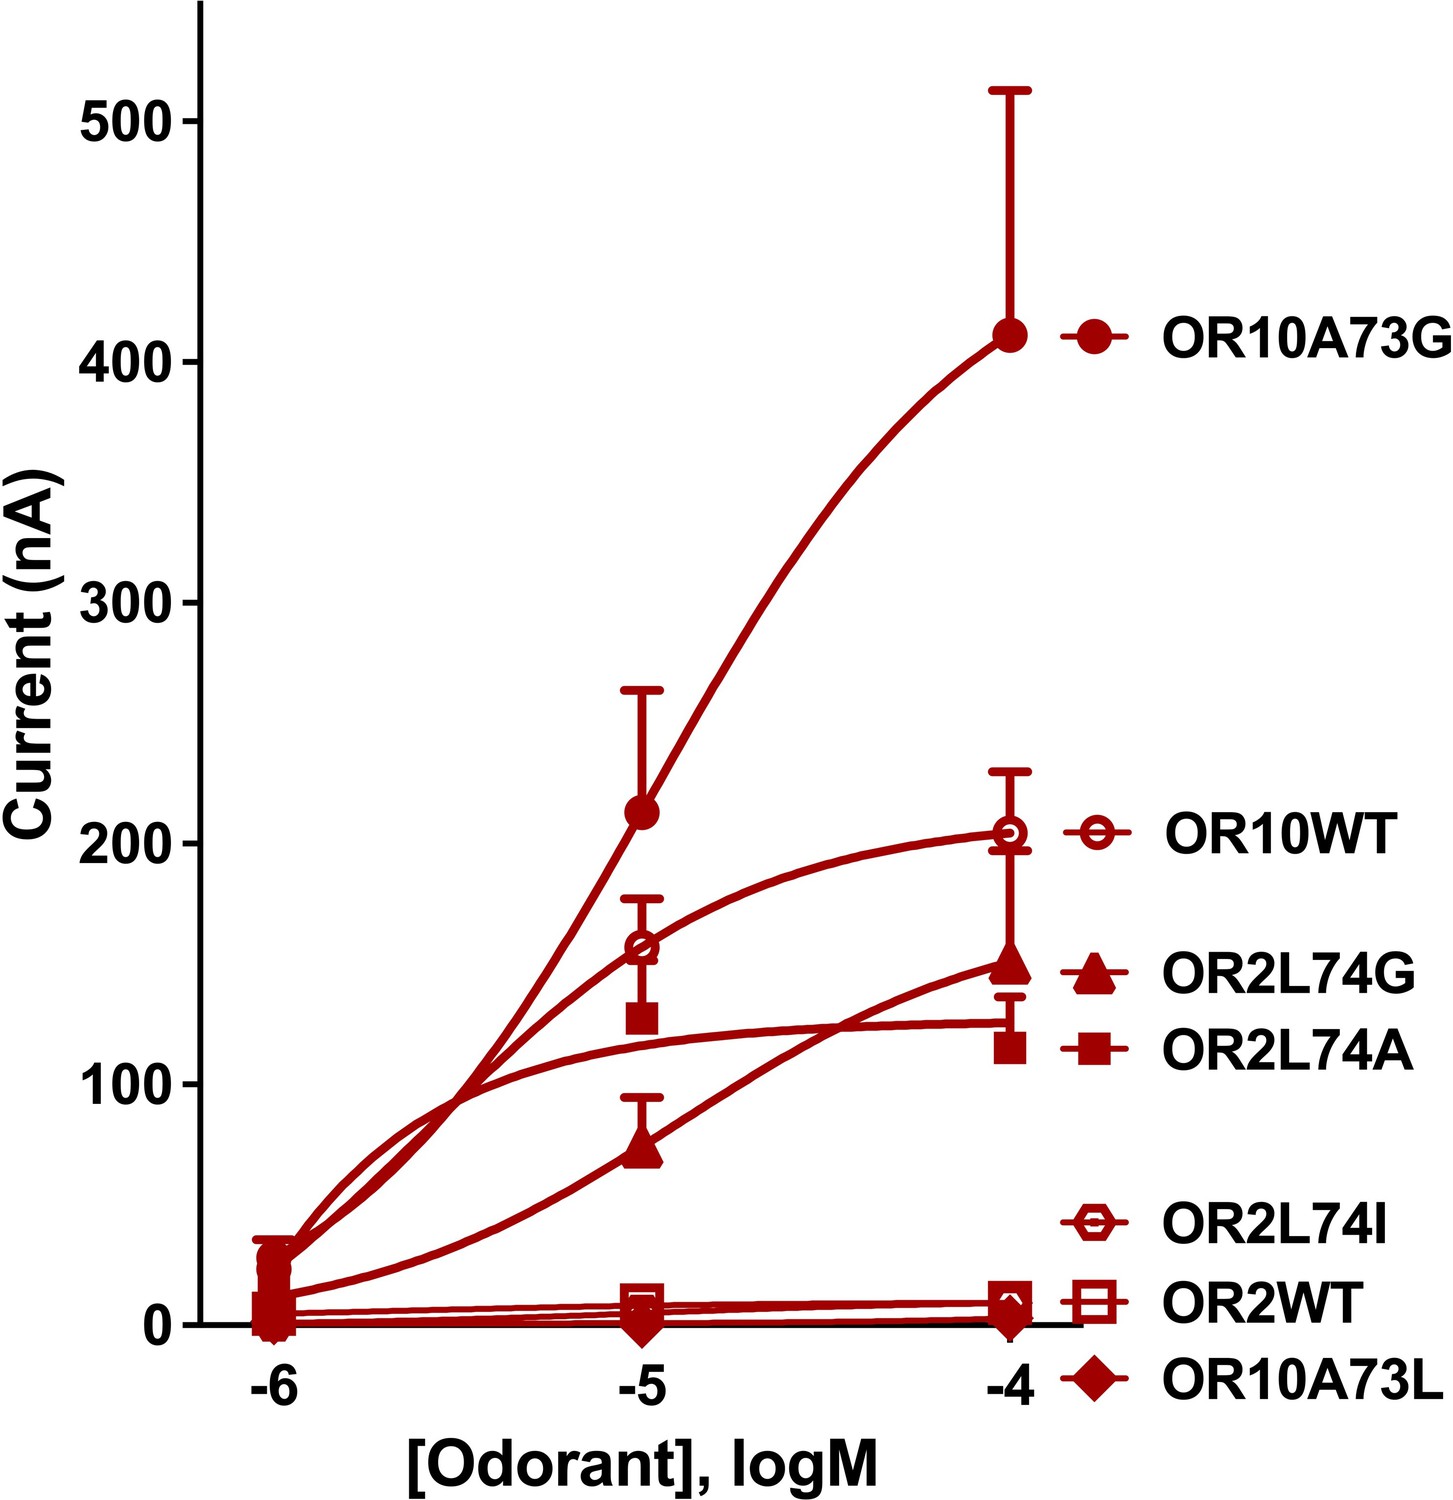
Concentration-dependent responses elicited by 3-ethylindole in oocytes co-expressing CquiOrco with CquiOR10, CquiOR2, or single-point mutants.
Bars represent SEM (n = 4–10).
-
Figure 9—source data 1
Concentration-dependent responses elicited by 3-ethylindole in oocytes co-expressing CquiOrco with CquiOR10, CquiOR2, or single-point mutants.
- https://cdn.elifesciences.org/articles/82922/elife-82922-fig9-data1-v2.xlsx
Figure 9—figure supplement 1
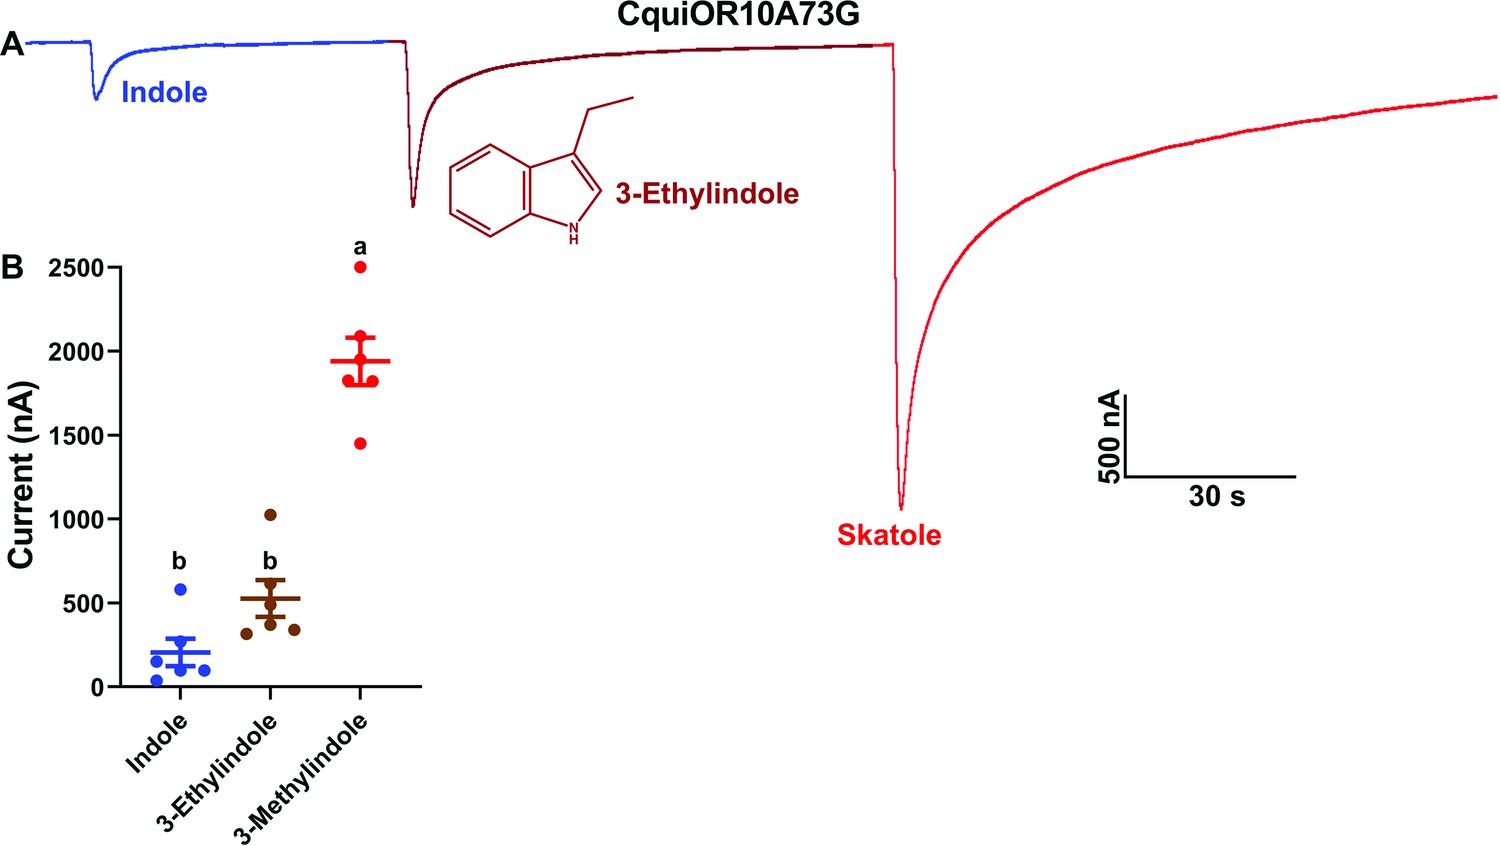
Representative trace of the responses of CquiOR10A73G/CquiOrco-expressing oocyte to indole, skatole, and 3-ethylindole (brown).
(A) Representative trace recorded after challenging an oocyte with the three odorants at the same dose (100 µM). (B) Quantification of responses from six different oocytes. Columns with the same letter are not significantly different (Repeated measures, one-way ANOVA).
Tables
Key resources table
| Reagent type (species) or resource | Designation | Source or reference | Identifiers | Additional information |
|---|---|---|---|---|
| Recombinant DNA reagent | Stellar competent cell | Takara Bio, USA (San Jose, CA) | Cat# 636766 | https://bit.ly/3Dowpe2 |
| Recombinant DNA reagent | pGEMHE (plasmid) | Liman et al., 1992 | https://doi.org/10.1016/0896-6273(92)90,239a | |
| Recombinant DNA reagent | Xenopus oocytes | EcoCyte Bioscience (Austin, TX) | https://bit.ly/3Ud8OTo | |
| Recombinant DNA reagent | XmaI | New England Biolabs (Ipswich, MA) | Cat# R0180S | https://www.neb.com/products/r0180-xmai |
| Recombinant DNA reagent | XbaI | New England Biolabs (Ipswich, MA) | Cat# R0145S | https://www.neb.com/products/r0145-xbai |
| Recombinant DNA reagent | Gentamycin sulfate | Abcam (Cambridge, UK) | Cat# ab146573 | https://www.abcam.com/ab146573.html |
| Chemical compound, drug | NaCl | Fisher Scientific (Waltham, MA) | Cat# S271-3 | |
| Chemical compound, drug | KCl | Fisher Scientific (Waltham, MA) | Cat# P217-500 | |
| Chemical compound, drug | NaHCO3 | Sigma-Aldrich (Milwaukee, WI) | Cat# S6014-500G | |
| Chemical compound, drug | MgSO4 | Sigma-Aldrich (Milwaukee, WI) | Cat# M-7634 | |
| Chemical compound | Ca(NO3)2 | Sigma-Aldrich (Milwaukee, WI) | Cat# 237124-500G | |
| Chemical compound, drug | CaCl2 | Fisher Scientific (Waltham, MA) | Cat# S71924 | |
| Chemical compound, drug | HEPES | Sigma-Aldrich (Milwaukee, WI) | Cat# H4034-500G | |
| Chemical compound, drug | OLC12 | Vanderbilt Institute of Chemical Biology | Chemical Synthesis Core, VUAA 3 | https://medschool.vanderbilt.edu/syncore/ |
| Chemical compound, drug | Skatole | Sigma-Aldrich (Milwaukee, WI) | CAS# 83-34-1, Cat# W301912 | 98% |
| Chemical compound, drug | Indole | ACROS Organics (Geel, Belgium) | CAS# 120-72-9, Cat# 122150100 | 98% |
| Chemical compound, drug | 3-Ethylindole | AmBeed (Arlington hts, IL) | CAS# 1484-19-1, Cat# AMBH96F1079C | 97% |
| Chemical compound, drug | Phenol | Sigma-Aldrich (Milwaukee, WI) | CAS# 108-95-2 | 99.5% |
| Chemical compound, drug | 3,5-Dimethylphenol | Sigma-Aldrich (Milwaukee, WI) | CAS# 108-68-9 | 99% |
| Chemical compound, drug | 1-Methylindole | Sigma-Aldrich (Milwaukee, WI) | CAS# 603-76-92 | 97% |
| Chemical compound, drug | 2-Methylindole | Sigma-Aldrich (Milwaukee, WI) | CAS# 95-20-5 | 98% |
| Chemical compound, drug | 4-Methylindole | ACROS Organics (Geel, Belgium) | CAS# 16096-32-5 | 99% |
| Chemical compound, drug | 5-Methylindole | Sigma-Aldrich (Milwaukee, WI) | CAS# 614-96-0 | 99% |
| Chemical compound, drug | 6-Methylindole | Sigma-Aldrich (Milwaukee, WI) | CAS# 3420-02-8 | 97% |
| Chemical compound, drug | 7-Methylindole | Sigma-Aldrich (Milwaukee, WI) | CAS# 933-67-5 | 97% |
| Software, algorithm | UCSF Chimera | Pettersen et al., 2004 | https://doi.org/10.1002/jcc.20084; UCSF | https://bit.ly/3S7OdOF; ver. 1.15 |
| Software, algorithm | Rosetta | Leman et al., 2020 | https://doi.org/10.1038/s41592-020-0848-2 | https://www.rosettacommons.org/software/license-and-download; ver 2021.07.61567 |
| Software, algorithm | Avogadro | Hanwell et al., 2012 | https://doi.org/10.1186/1758-2946-4-17 | https://avogadro.cc/; ver 1.2.0 (Git revision: c1fcc5b) |
| Software, algorithm | AmberTools | Case et al., 2021 | https://ambermd.org/index.php | https://ambermd.org/doc12/Amber21.pdf |
| Software, algorithm | OpeneEye Omega | Hawkins et al., 2010 | https://doi.org/10/1021/ci100031x | https://www.eyesopen.com/omega |
| Software, algorithm | HDBSCAN | McInnes et al., 2017 | https://doi.org/10.21105/joss.00205 | https://github.com/scikit-learn-contrib/hdbscan; McInnes and Healy, 2017 |
| Software, algorithm | BioMol2Clust | https://biokinet.belozersky.msu.ru/Biomol2Clust | Timonina et al., 2021 | ver 1.3 |
| Software, algorithm | Protein Ligand Interaction Profiler | Salentin et al., 2015 | https://doi.org/10.1093/nar/gkv315 | https://plip-tool.biotec.tu-dresden.de/plip-web/plip/index; software repository: https://github.com/pharmai/plip; ver 2.2.1, Salentin et al., 2015 |
| Software, algorithm | EMBOSS Needle | Madeira et al., 2022 | https://doi.org/10.1093/nar/gkac240 | https://www.ebi.ac.uk/Tools/psa/emboss_needle/ |
Additional files
-
MDAR checklist
- https://cdn.elifesciences.org/articles/82922/elife-82922-mdarchecklist1-v2.pdf
-
Supplementary file 1
Needleman-Wunsch percent identity and similarity of CquiOR10 to CquiOR2 transmembrane segments as defined by OCTOPUS.
- https://cdn.elifesciences.org/articles/82922/elife-82922-supp1-v2.docx
-
Supplementary file 2
Protocol Capture.
- https://cdn.elifesciences.org/articles/82922/elife-82922-supp2-v2.docx
Download links
A two-part list of links to download the article, or parts of the article, in various formats.
Downloads (link to download the article as PDF)
Open citations (links to open the citations from this article in various online reference manager services)
Cite this article (links to download the citations from this article in formats compatible with various reference manager tools)
Single amino acid residue mediates reciprocal specificity in two mosquito odorant receptors
eLife 11:e82922.
https://doi.org/10.7554/eLife.82922


