Scleraxis-lineage cells are required for tendon homeostasis and their depletion induces an accelerated extracellular matrix aging phenotype
- Center for Musculoskeletal Research, Department of Orthopaedics & Rehabilitation, University of Rochester Medical Center, United States
- Department of Biomedical Engineering, University of Rochester, United States
Figures
Figure 1
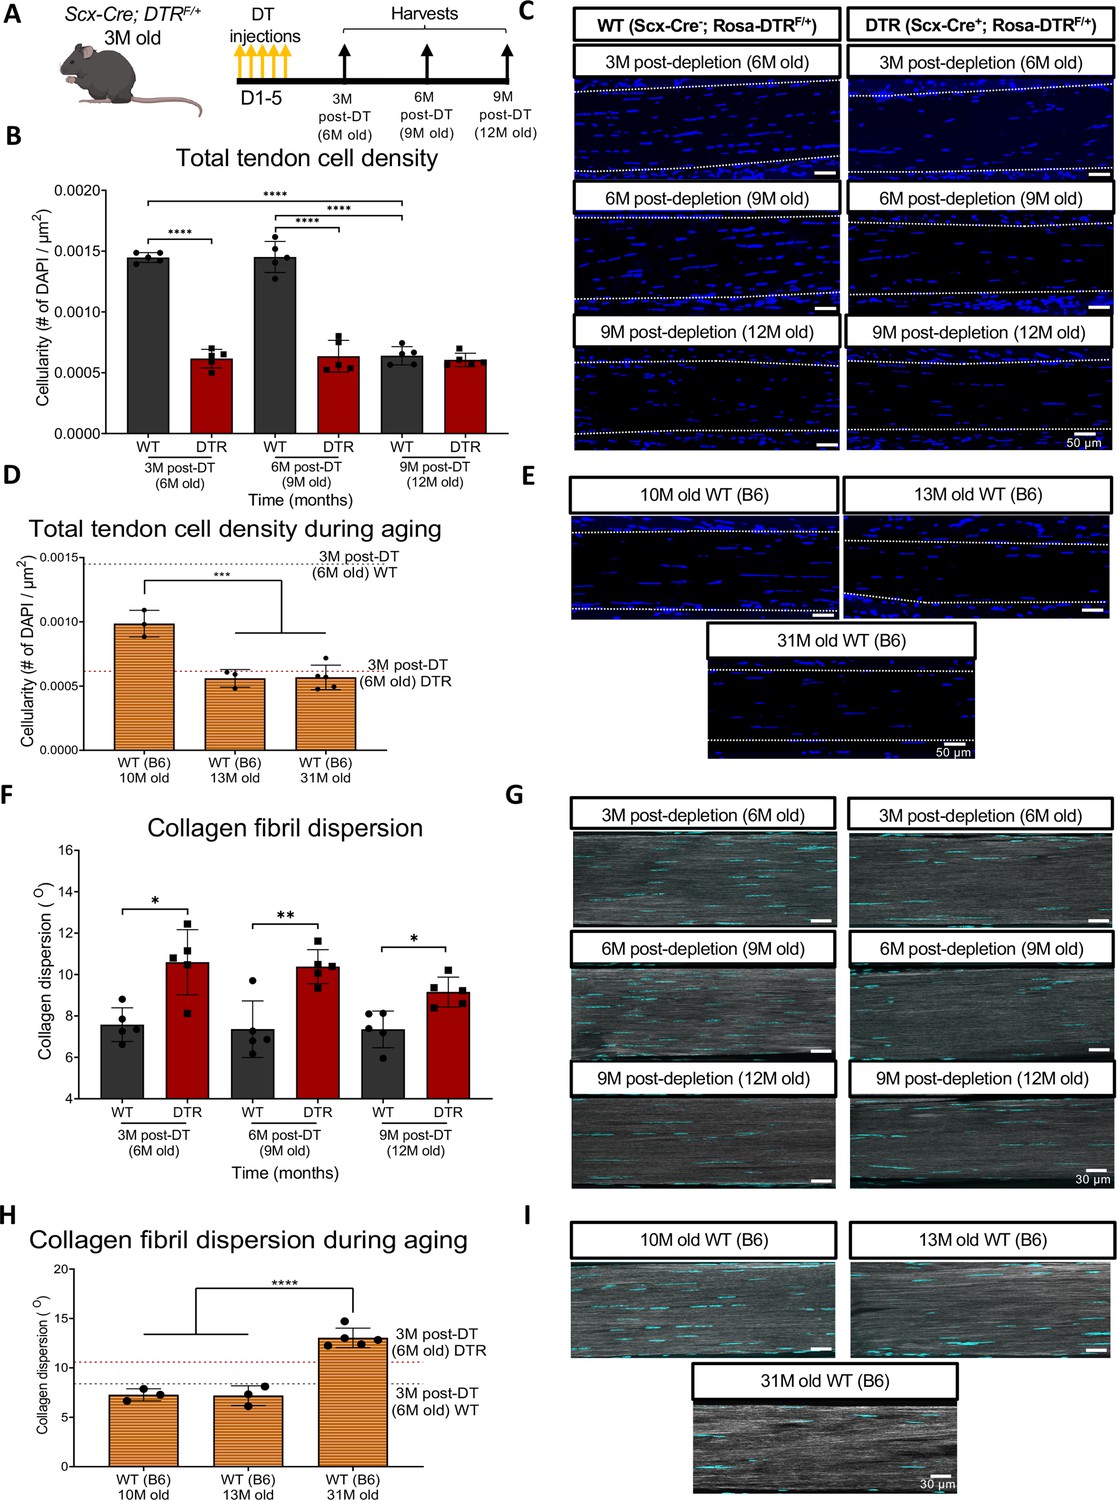
Depletion of Scleraxis-lineage cell during long-term homeostasis significantly disrupts tendon structure and mechanical properties.
(A) 3 M old Scx-Cre+; Rosa- DTRF/+ (DTR) and Scx-Cre-; Rosa-DTRF/+ (WT) mice received five hind paw injections of DT and were harvested at 3, 6, and 9 M post-depletion. (B) Quantification of total tendon cell (DAPI) density from injected WT and DTR hind paws at 3-, 6-, and 9 months post-depletion (6, 9, and 12 months old of age, respectively) within the tendon. (C) Representative sections from (B). (D) Quantification of total tendon cell (DAPI) density from C57BL/6 J hind paws at 10, 13, and 31 months old within the tendon. (E) Representative sections from (D). (F) Quantification of collagen fibril dispersion in WT and DTR samples at 3-, 6-, and 9 months post-depletion (6, 9, and 12 months old, respectively) and (G) representative collagen fibril morphology captured via SHG. (H) Quantification of collagen fibril dispersion from C57BL/6 J hind paws at 10, 13, and 31 months old and (I) representative collagen fibril morphology via SHG. N=3–5 per genotype. Error bars indicate mean ± standard deviation.
Figure 2 with 4 supplements
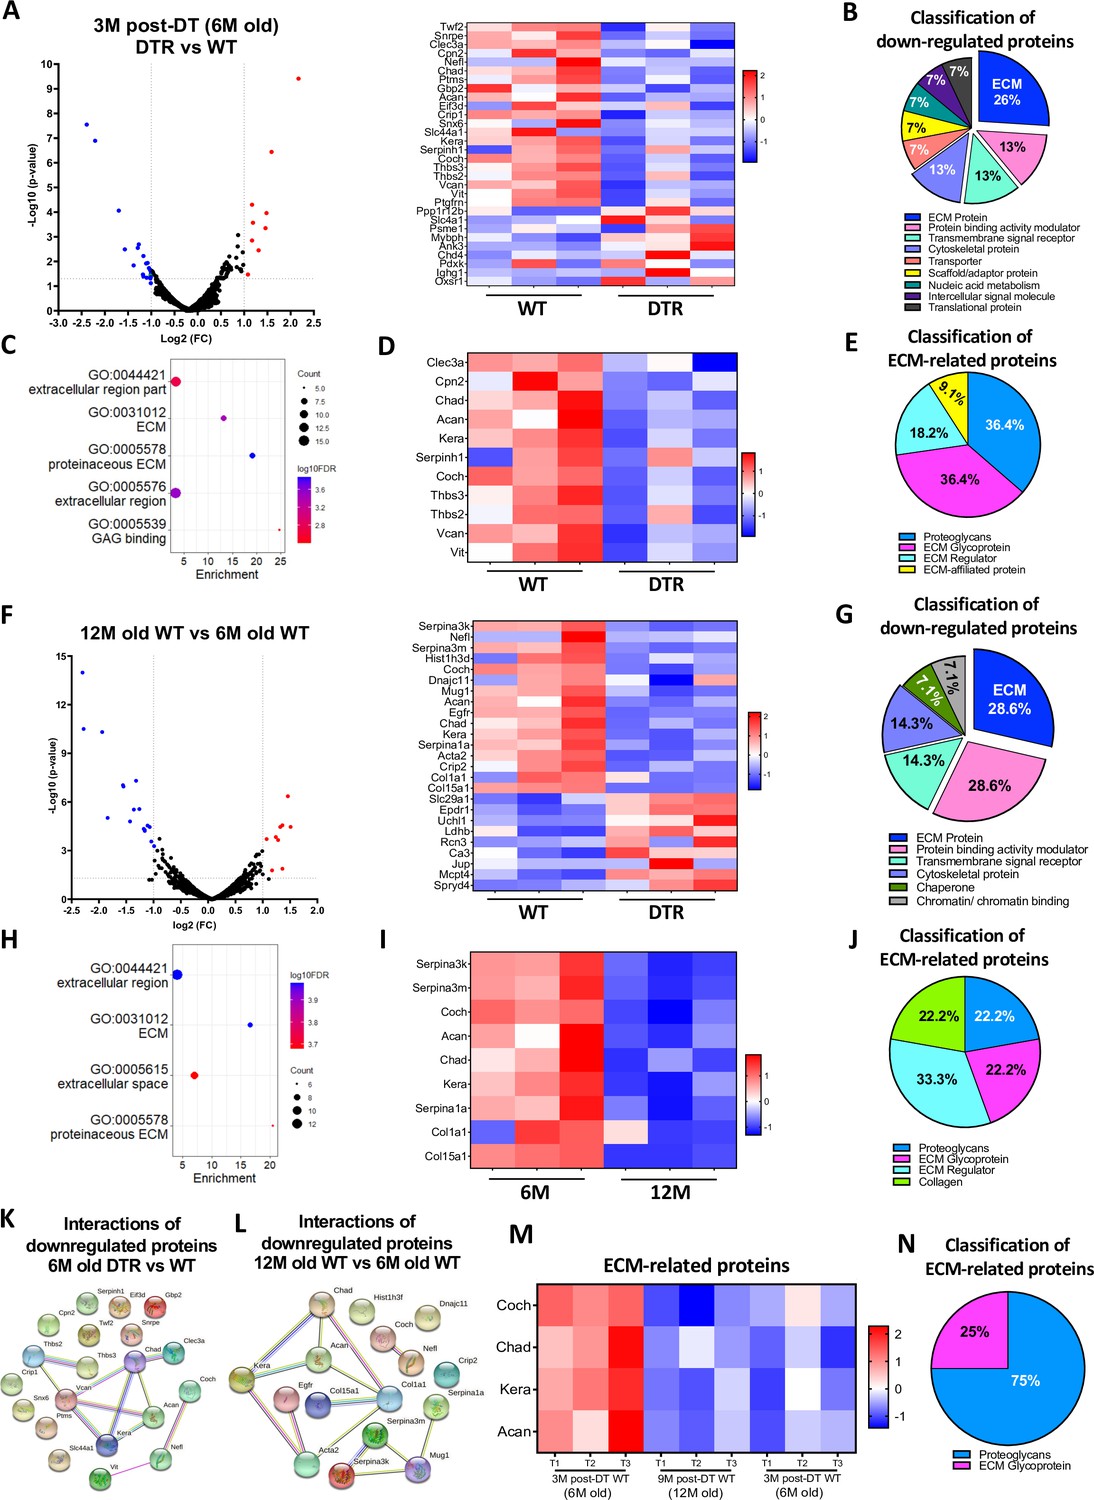
Scleraxis-lineage cells maintain FDL tendon homeostasis by regulating the synthesis of high turnover rate ECM proteins.
(A) Volcano plot and heatmap visualizing the significantly different protein abundances between DTR and WT groups at 3 M post-depletion. (B) Classification of all downregulated proteins between the DTR and WT FDL tendons at 3 M post-depletion. (C) Functional enrichment analysis of cellular components and molecular functions of all downregulated proteins between the DTR and WT FDL tendons at 3 M post-depletion. (D) Heatmap of all differentially abundant ECM-related proteins between the DTR and WT FDL tendons at 3 M post-depletion. (E) Classification of all ECM-related downregulated proteins between the DTR and WT FDL tendons at 3 M post-depletion. (F) Volcano plot and heatmap visualizing the significantly different protein abundances between 12 M and 6 M WT FDL tendons. (G) Classification of all downregulated proteins between 12 M and 6 M WT FDL tendons. (H) Functional enrichment analysis of all downregulated proteins between 12 M and 6 M WT FDL tendons. (I) Heatmap of all differentially abundant ECM-related proteins between 12 M and 6 M WT FDL tendons. (J) Classification of all ECM-related downregulated proteins between 12 M and 6 M WT FDL tendons. (K) Protein-protein interaction of all the downregulated proteins between DTR and WT groups at 3 M post-depletion. (L) Protein-protein interaction of all the downregulated proteins between 12 M and 6 M WT FDL tendons. (M) Heatmap with 4 ECM-related proteins that were decreased in similar rates with both natural aging and Scleraxis-lineage cell depletion. (N) Classification of the ECM-related proteins from (M).
Figure 2—figure supplement 1
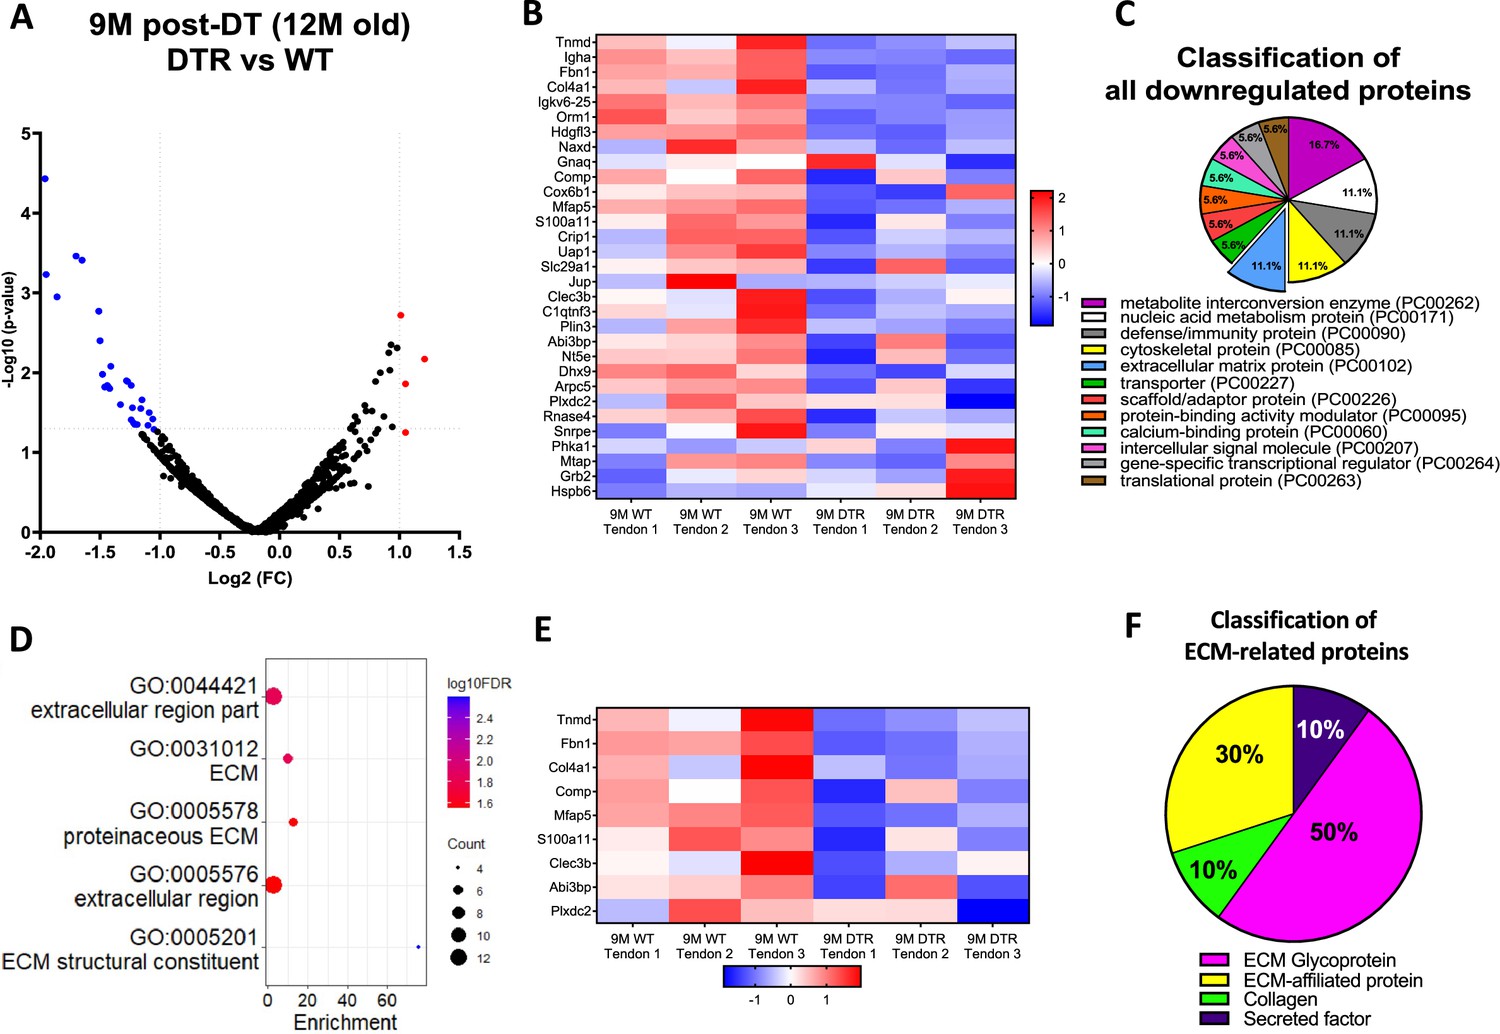
Scleraxis-lineage cells maintain long-term tendon homeostasis via synthesis of high turnover rate glycoproteins and proteoglycans.
(A) Volcano plot and (B) heatmap visualizing the significantly different protein abundances between DTR and WT groups at 9 M post-depletion. Blue indicates proteins that are decreased in DTR tendons vs. WT. (C) Classification of all downregulated proteins between the DTR and WT FDL tendons at 9 M post-depletion. (D) Functional enrichment analysis of cellular components and molecular functions of all downregulated proteins between the DTR and WT FDL tendons at 9 M post-depletion. (E) Heatmap of all differentially abundant ECM-related proteins between the DTR and WT FDL tendons. (F) Classification of all ECM-related downregulated proteins between the DTR and WT FDL tendons.
Figure 2—figure supplement 2
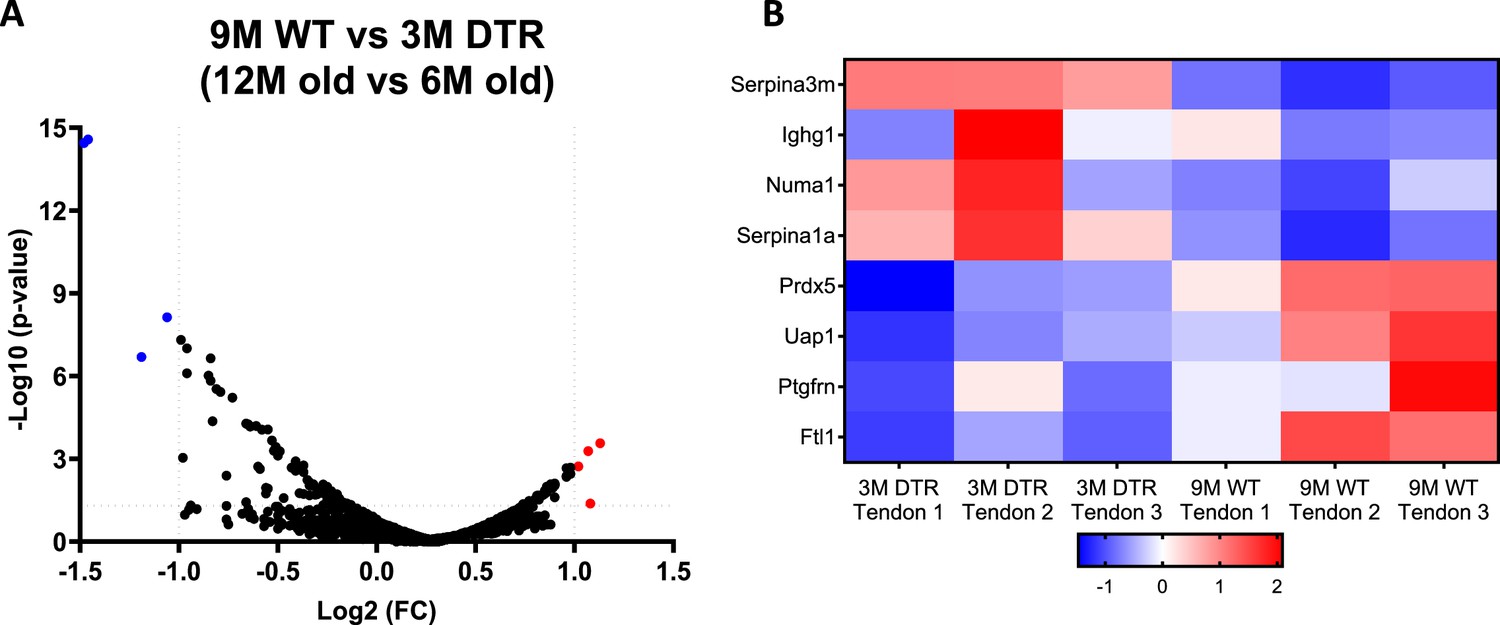
The proteome between 12 M old WT and young (6 M old) DTR tendons is almost identical with no differences in high turnover rate glycoproteins and proteoglycans.
(A) Volcano plot and (B) heatmap visualizing the significantly different protein abundances between 12 M old WT and 6 M old DTR groups. Blue indicates proteins that are decreased in 12 M old WT vs. 6 M old DTR, while red indicates proteins that are increased in 12 M old WT vs. 6 M old DTR.
Figure 2—figure supplement 3
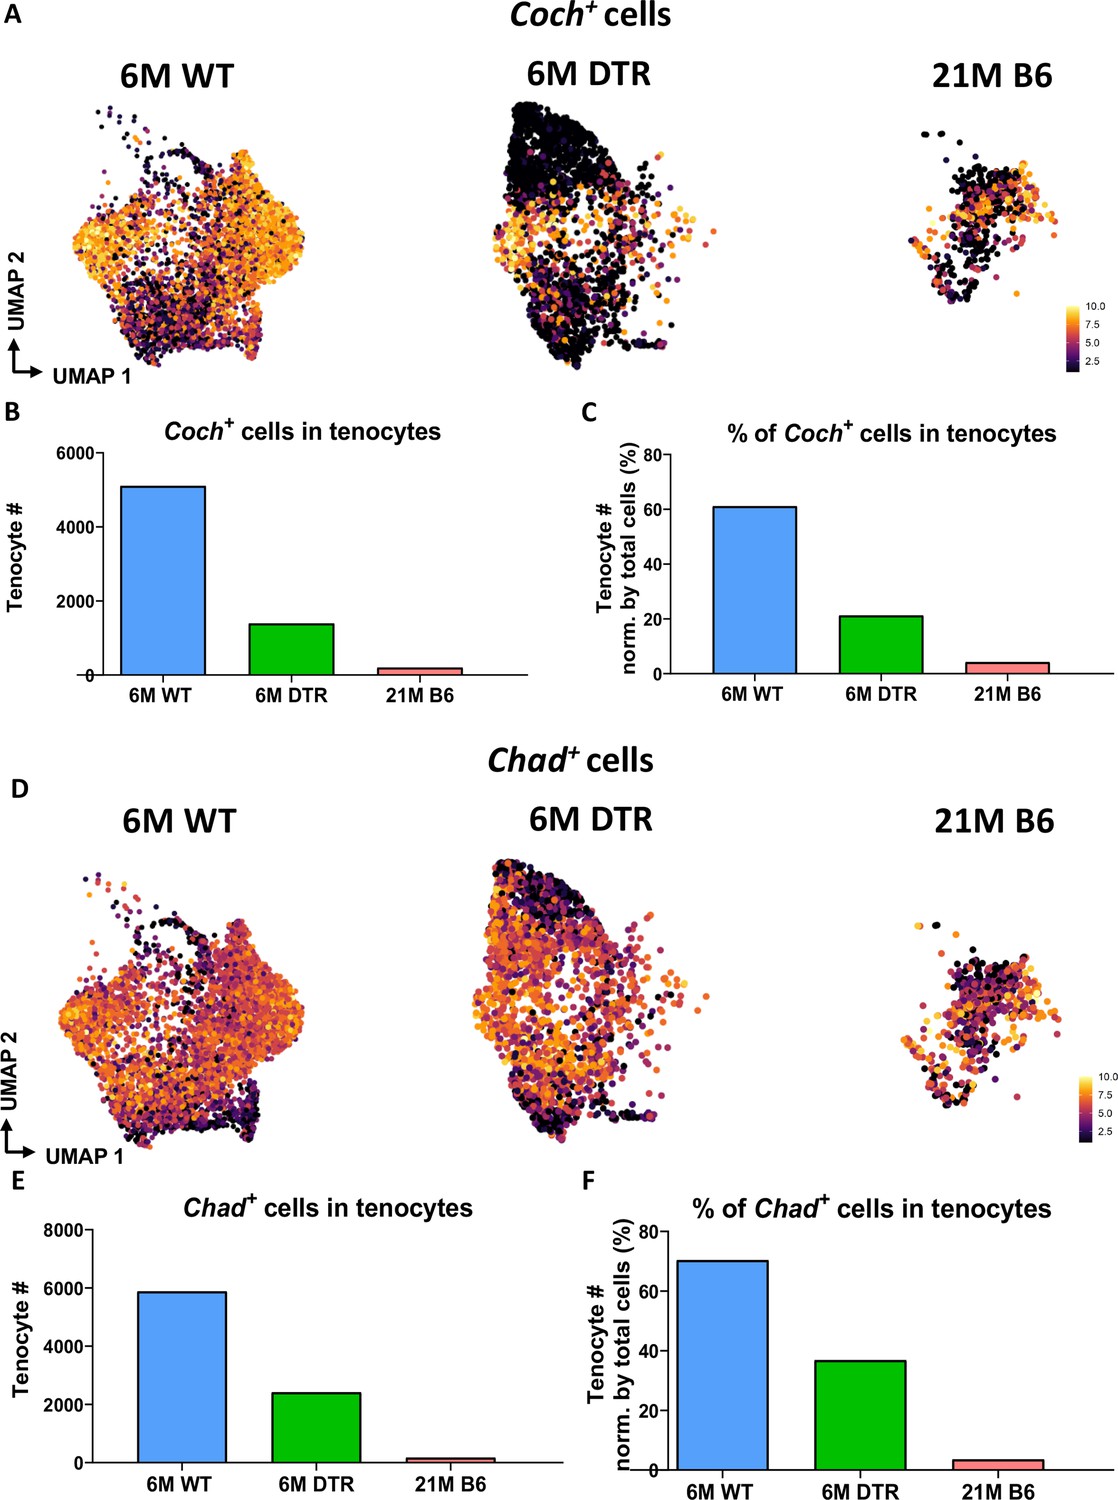
Significant decrease of Coch +and Chad + cells with Scleraxis-lineage cell depletion and natural aging.
(A) UMAP plots of Coch +tenocytes in the 6 M WT, DTR, and 21 M B6 groups. (B) Total tenocyte number of Coch + cells in each condition. (C) % of Coch +normalized by total tenocytes for each condition. (D) UMAP plots of Coch +tenocytes in the 6 M WT, DTR, and 21 M B6 groups. (E) Total tenocyte number of Chad + cells in each condition. (F) % of Chad +normalized by total tenocytes for each condition.
Figure 2—figure supplement 4
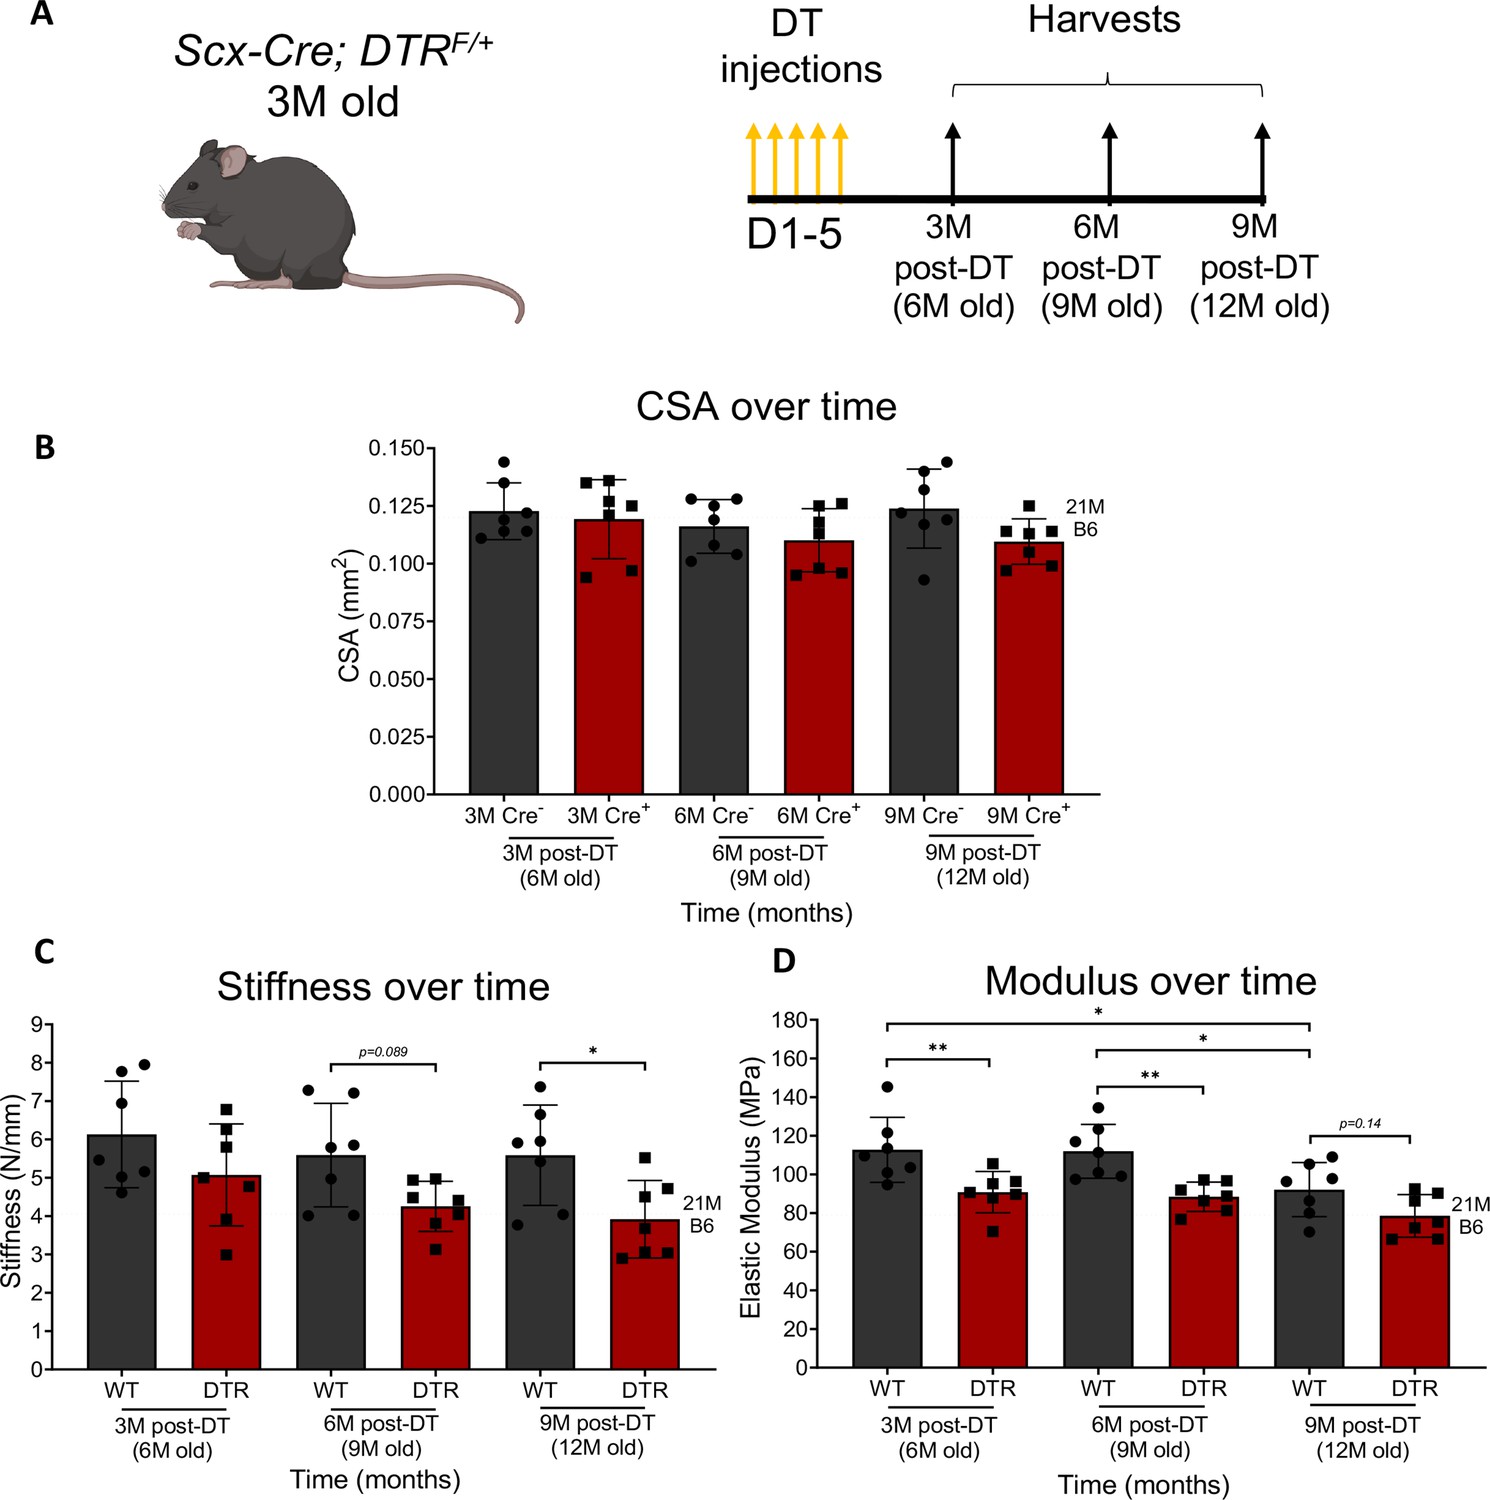
Depletion of Scleraxis-lineage cells significantly impairs tendon structural and material properties.
Timeline of DT injections and tissue harvesting (A). Quantification of CSA (B), stiffness (C), and elastic modulus (D) of WT and DTR tendons at 3, 6, and 9 months post-depletion. CSA, stiffness, and elastic modulus between genotype (WT or DTR) and timepoint (3 M, 6 M, or 9 M). N=3–5 per genotype. Error bars indicate mean ± standard deviation. Two-way ANOVA with Sidak’s multiple comparisons test used to assess statistical significance of CSA, stiffness, and elastic modulus, * indicates p<0.05; ** indicates p<0.01; *** indicates p<0.001; **** indicates p<0.0001.
Figure 3 with 2 supplements
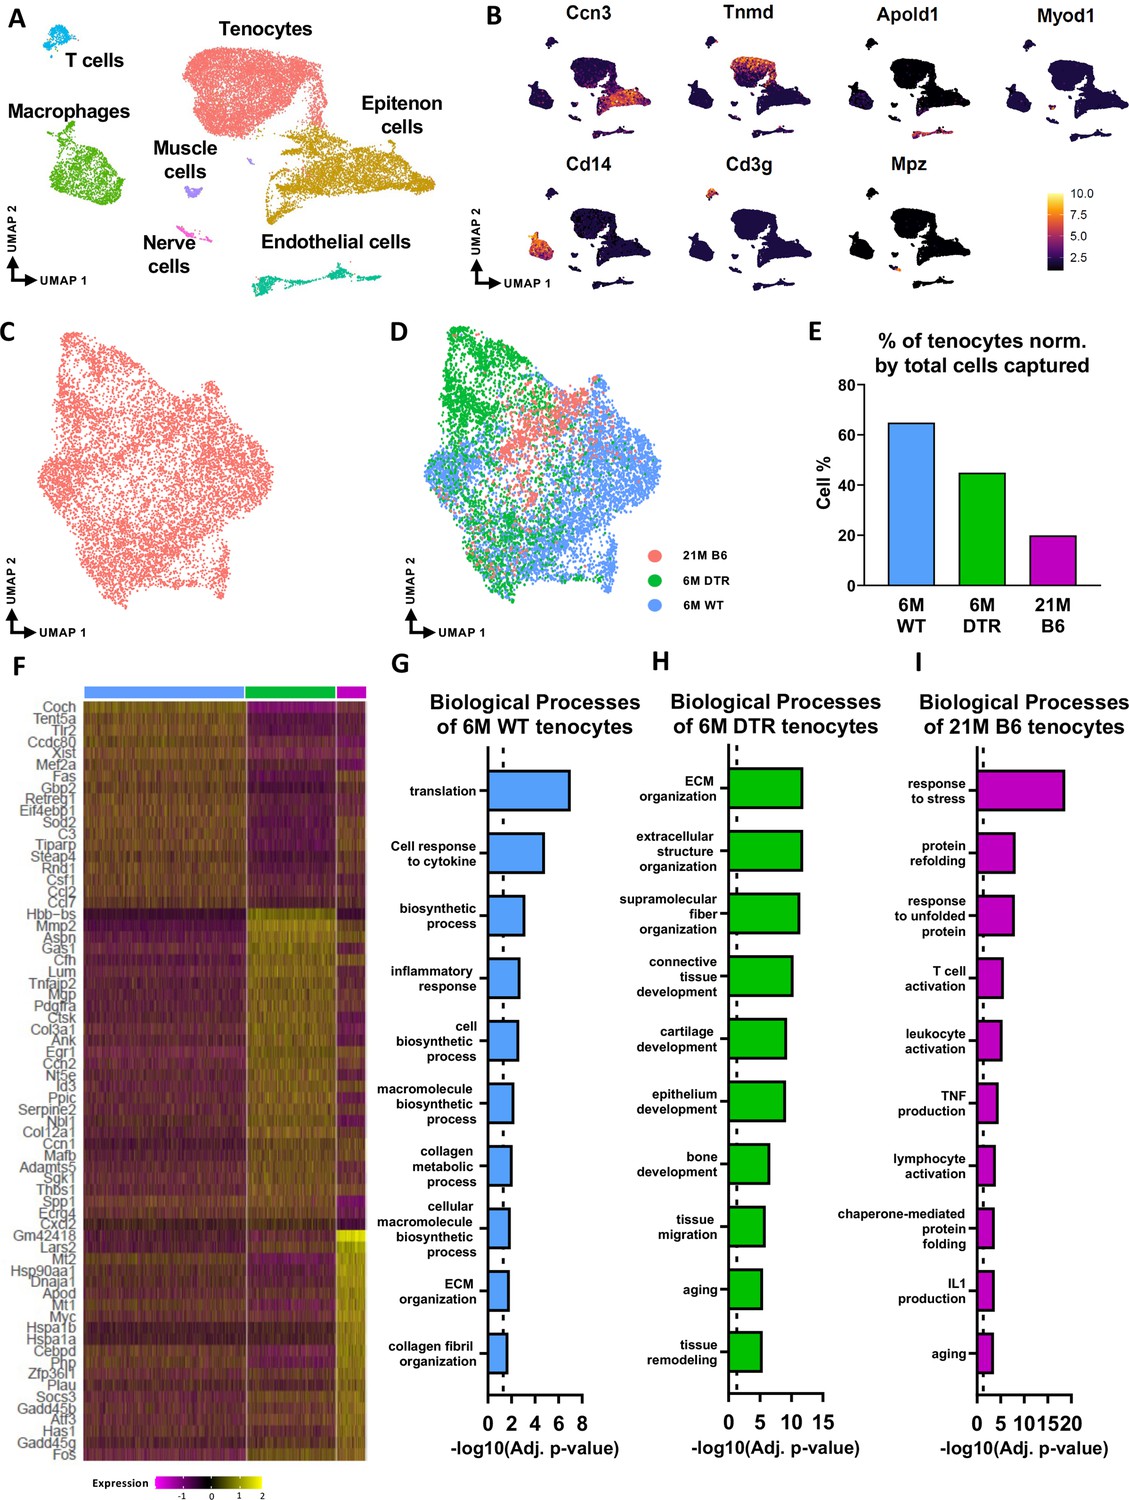
scRNAseq demonstrates broad cellular heterogeneity and intrinsic programmatic skewing of tenocytes with depletion and natural aging.
(A) UMAP dimensionality reduction revealed seven broad and distinct cell populations on clustering based on unbiased differential gene expression of the integrated dataset. (B) Annotation marker for each of the seven cell populations identified in the FDL tendons. (C) Re-clustering of the tenocytes cell population from (A). (D) UMAP plot of tenocytes in the integrated data colored based on respective group (pink: 21 M old B6, green: DTR 6 M old, blue: WT 6 M old). (E) Quantification of the percentage of tenocytes normalized by the total cells captured per condition. (F) Heatmap with the top 40 significantly expressed genes in tenocytes per condition. (G) Significantly upregulated biological processes of tenocytes in the 6 M WT (G), 6 M DTR (H), and 21 M B6 (I). Dotted lines in G, H, and I indicate statistical significance of adjusted p-value <0.05 (-log10(adj. p-value = 1.3)).
Figure 3—figure supplement 1
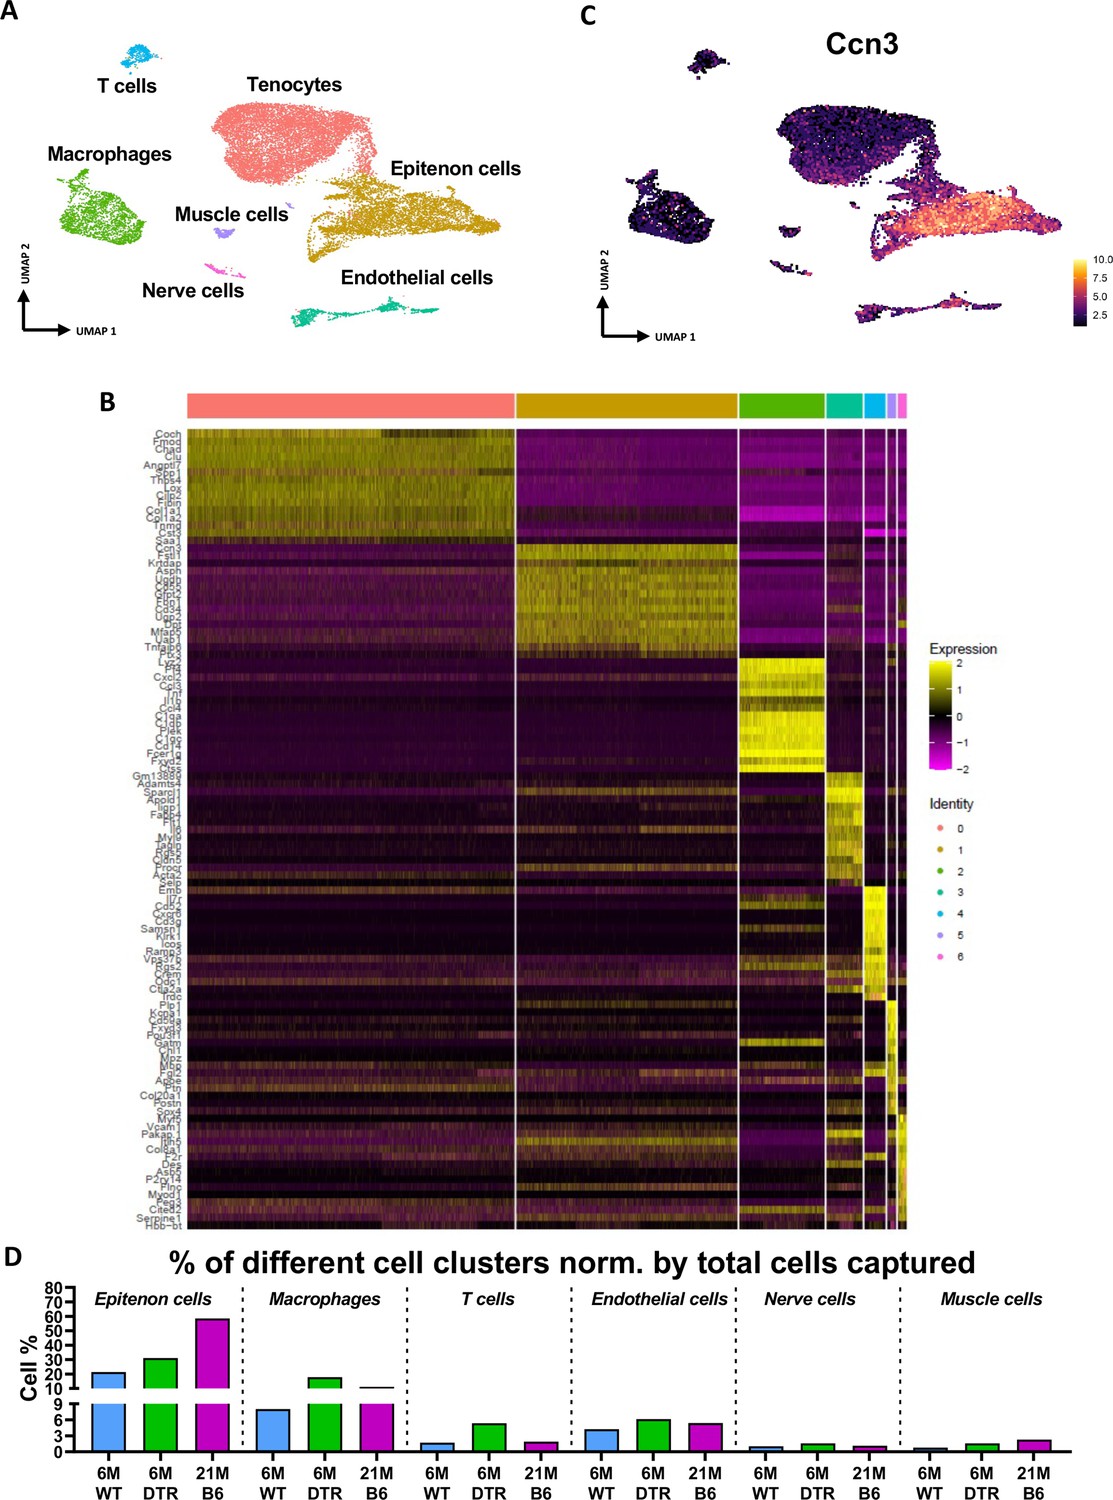
Annotation of scRNAseq-based identified cell clusters in the integrated data.
(A) UMAP with all different clusters annotated based on (B). (B) Heatmap of top 15 DEGs for each cluster. (C) Feature plot of the epitenon marker Ccn3 being expressed by the epitenon sub-cluster. (D) The percentage of each cell population in the context of 6 M old WT, 6 M old DTR, and 21 M C57Bl6/J (B6) tendons.
Figure 3—figure supplement 2
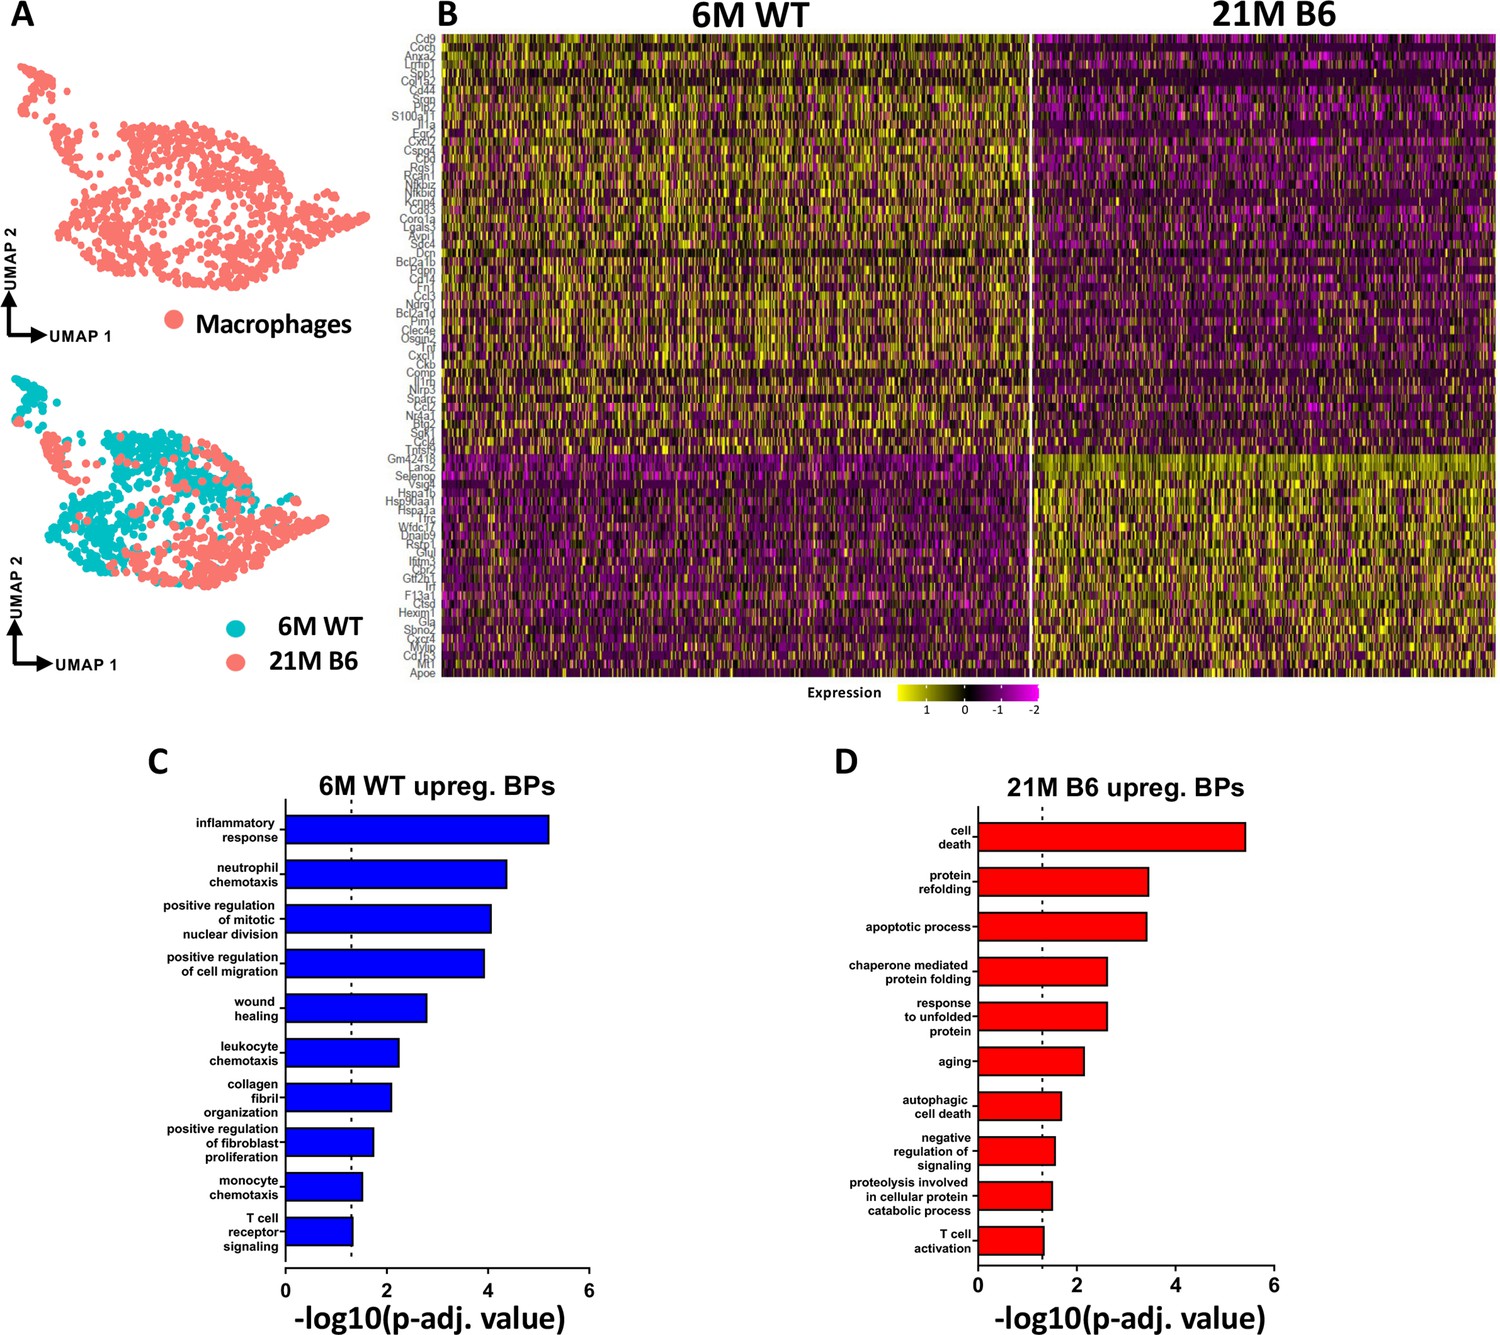
Tendon resident macrophages exhibit significant age-related intrinsic programmatic shifts.
(A) UMAP plot of the overall tendon resident macrophages as well as separated based on age (6 M WT and 21 M old B6). (B) Heatmap with the top 50 DEG of tendon resident macrophages between the young vs old WT groups. (C) BPs enriched in the young WT resident tendon macrophages based on the DEGs. (D) BPs enriched in the aged WT resident tendon macrophages based on the DEGs.
Figure 4
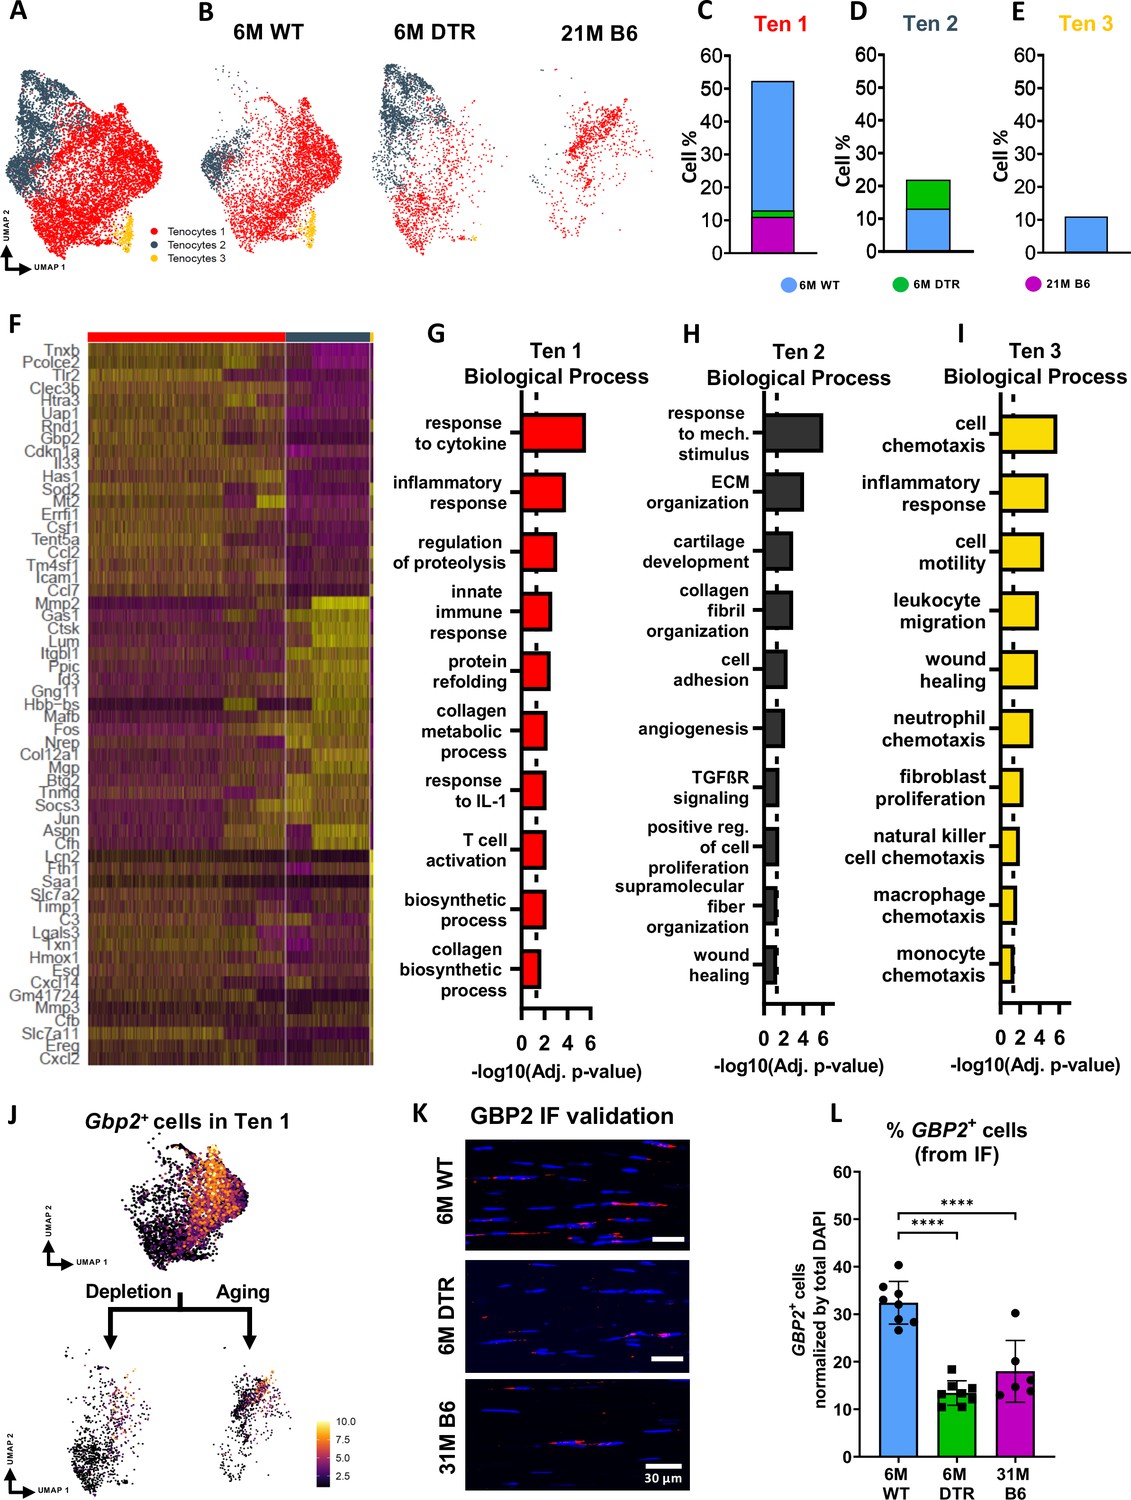
DTR and aged tendons lose tenocytes associated with ECM biosynthesis and immune surveillance, while DTR tendons retain tenocytes associated with ECM organization and remodeling.
(A) UMAP plot of all three tenocytes subpopulations. (B) UMAP plot showing the shifts of tenocytes 1–3 with depletion and natural aging. (C–E) Quantification of % in tenocytes 1 (C), tenocytes 2 (D), and tenocytes 3 (E), in the 6 M WT, DTR, and 21 M B6 groups (F) Heatmap with the top 40 significantly expressed genes per tenocyte subcluster. (G–I) Significantly upregulated biological processes of tenocytes 1 (G), tenocytes 2 (H), and tenocytes 3 (I), respectively. (J) UMAP feature plot of Gbp2+ + and their shift with depletion and natural aging, respectively. (K) Representative IF of protein validation on the decrease in GBP2 +tenocytes 1 cells with Scleraxis-lineage cell depletion and natural aging. (L) Quantification of IF for GBP2 + cell density in 6 M WT, 6 M DTR, and 31 M B6 groups. Data are presented as mean ± standard deviation.
Figure 5
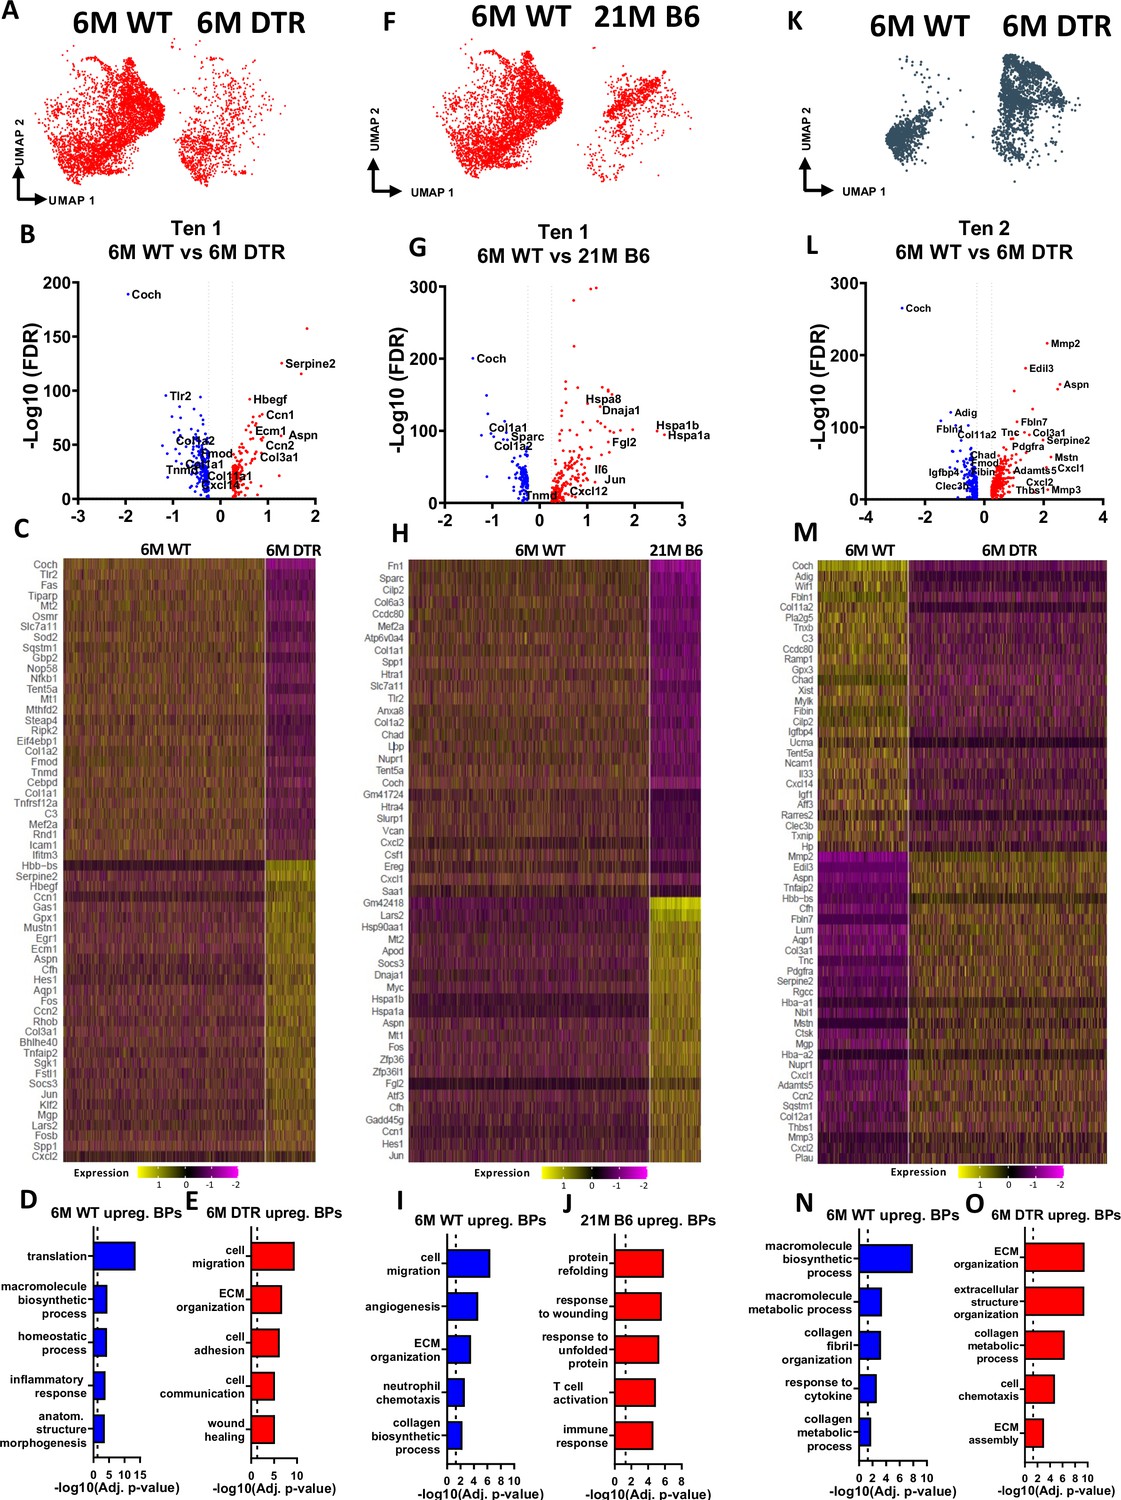
Tenocytes 1 and 2 become more ECM organizational in DTR tendons while tenocytes 1 exhibit indications of aging hallmarks such as loss of proteostasis and inflammaging.
(A) UMAP plot of tenocytes 1 in 6 M WT and DTR groups. (B) Volcano plot visualizing all the significantly different genes in tenocytes 1 between 6 M WT vs. 6 M DTR. Blue dots indicate genes that are down-regulated in DTR vs WT, while red indicates genes up-regulated in DTR vs. WT. (C) Heatmap of the top 50 differentially expressed genes of tenocytes 1 between 6 M WT and DTR groups. (D) Biological processes up regulated in 6 M WT tenocytes 1. (E) Biological processes upregulated in 6 M DTR tenocytes 1. (F) UMAP plot of tenocytes 1 in 6 M WT and 21 M B6 groups. (G) Volcano plot visualizing all the significantly different genes of tenocytes 1 between 6 M WT and 21 M B6. Blue dots indicate genes that are down-regulated in 21 M B6 vs. 6 M WT, while red indicates genes up-regulated in 21 M B6 vs. 6 M WT. (H) Heatmap of the top 50 differentially expressed genes of tenocytes 1 between 6 M and 21 M B6 groups. (I) Biological processes of tenocytes 1 in 6 M WT group. (J) Biological processes of tenocytes 1 in 21 M B6 group. (K) UMAP plot of tenocytes 2 in 6 M WT and 6 M DTR groups. (L) Volcano plot visualizing all the significantly different genes of tenocytes 2 between 6 M WT vs. 6 M DTR. Blue dots indicate genes that are down-regulated in DTR vs WT, while red indicates genes up-regulated in DTR vs. WT. (M) Heatmap of the top 50 differentially expressed genes of tenocytes 2 between 6 M WT and 6 M DTR groups. (N) Biological processes upregulated in 6 M WT Tenocytes 2. (O) Biological processes upregulated in 6 M DTR Tenocytes 2.
Figure 6 with 1 supplement
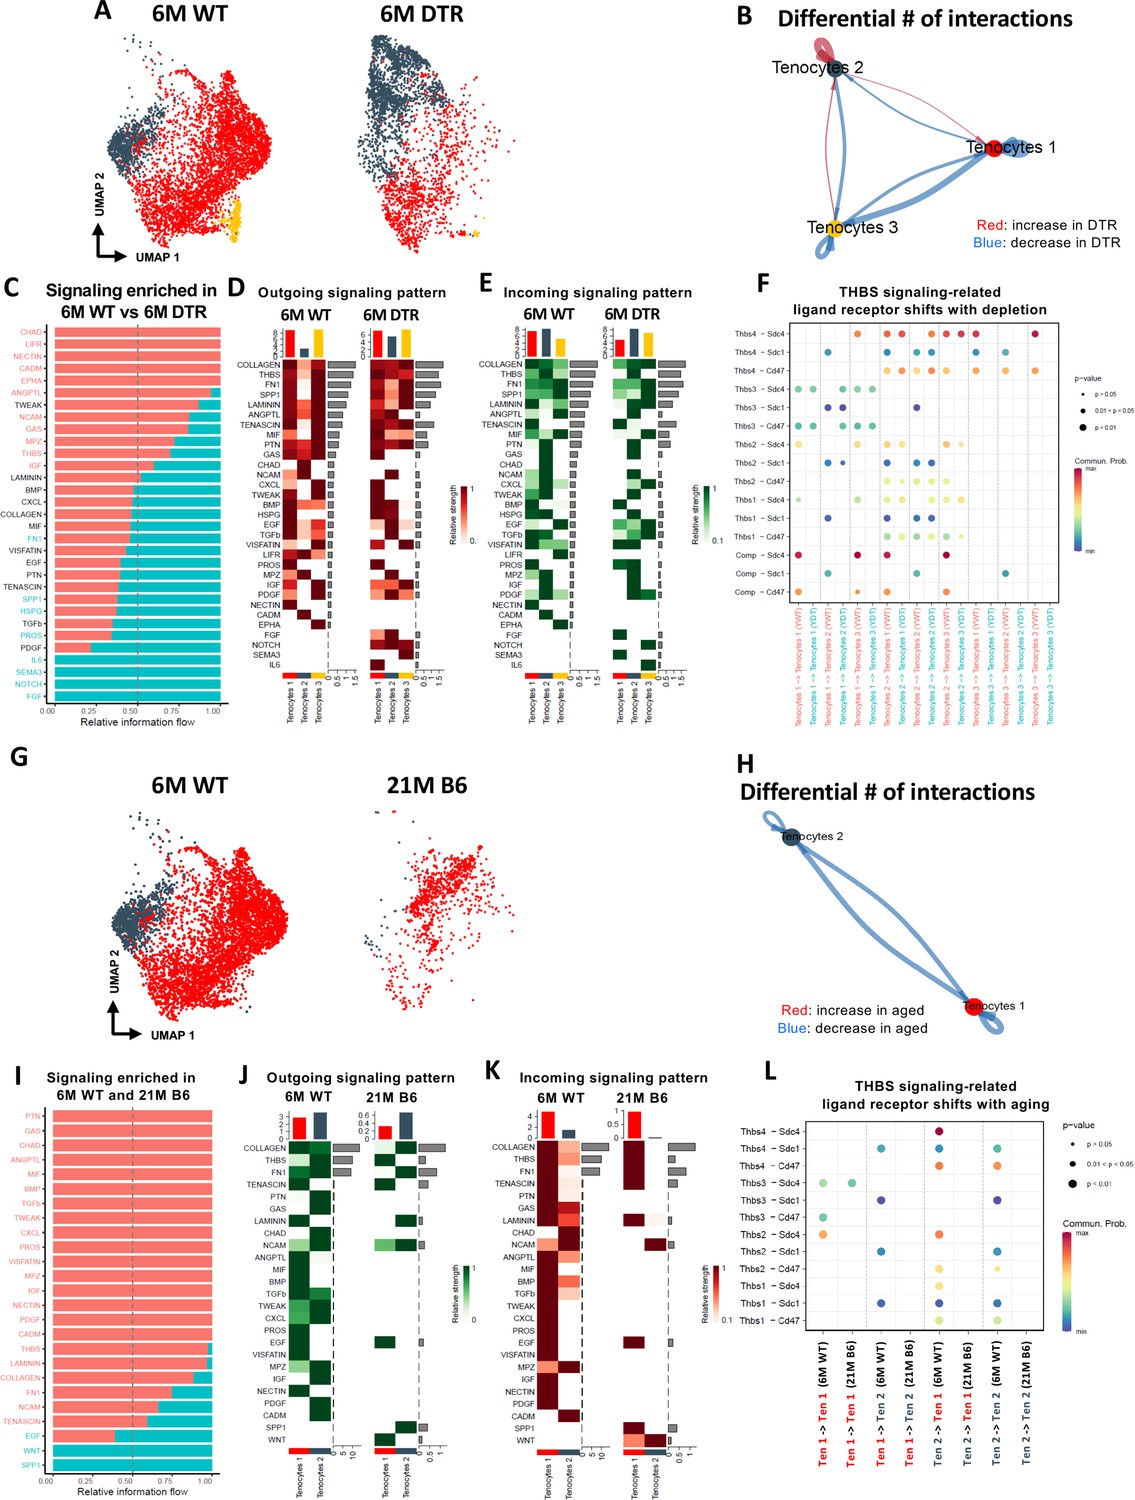
Tenocyte-tenocyte communication is impaired with both Scleraxis-lineage cell depletion and natural aging.
(A) UMAP plot of tenocytes subpopulations in the 6 M WT and DTR groups. (B) Differential number of cell-cell interactions of tenocytes 1–3 in the 6 M WT and DTR groups (red color indicates an increase and blue color indicates a decrease in cell communication with Scleraxis-lineage cell depletion relative to WT, respectively; arrow indicates the communication between two different cells and the direction of the arrow indicates the cell that expresses the ligand vs the cell that expresses the receptor, where the pointed cell by the arrow is the receiver). (C) All the signaling pathways that were identified in the 6 M WT and DTR groups (pathways highlighted with orange color indicate those that were expressed only or higher in the 6 M WT relative to 6 M DTR group; pathways highlighted with green color indicate those that were expressed only or higher in the 6 M DTR relative to 6 M WT group). (D) Heatmap with all the outgoing signaling patterns for tenocytes 1–3 for the 6 M WT and DTR groups. (E) Heatmap with all incoming signaling patterns for tenocytes 1–3 for the 6 M WT and DTR groups. (F) THBS signaling-related ligand-receptor interactions that take place in the 6 M WT and DTR groups. (G) UMAP plot of tenocytes subpopulations in the 6 M WT and 21 M B6 groups. (H) Differential number of cell-cell interactions of tenocytes 1 and 2 in the 6 M WT and 21 M B6 groups (blue color indicates a decrease in cell communication with natural aging relative to WT); arrow indicates the communication between two different cells and the direction of the arrow indicates the cell that expresses the ligand vs the cell that expresses the receptor, where the pointed cell by the arrow is the cell that expresses the receptor or in other words the receiver (I) All the signaling pathways that were identified in the 6 M WT and 21 M B6 groups (pathways highlighted with orange color indicate those that were expressed only or higher in the 6 M WT relative to the 21 M B6 group; pathways highlighted with green color indicate those that were expressed only or higher in the 21 M B6 groups relative to 6 M WT group). (J) Heatmap with all the outgoing signaling patterns for tenocytes 1 and 2 for the 6 M WT and 21 M B6 groups. (K) Heatmap with all incoming signaling patterns for tenocytes 1 and 2 for the 6 M WT and 21 M B6 groups. (L) THBS signaling-related ligand-receptor interactions that take place in the 6 M WT and 21 M B6 groups.
Figure 6—figure supplement 1
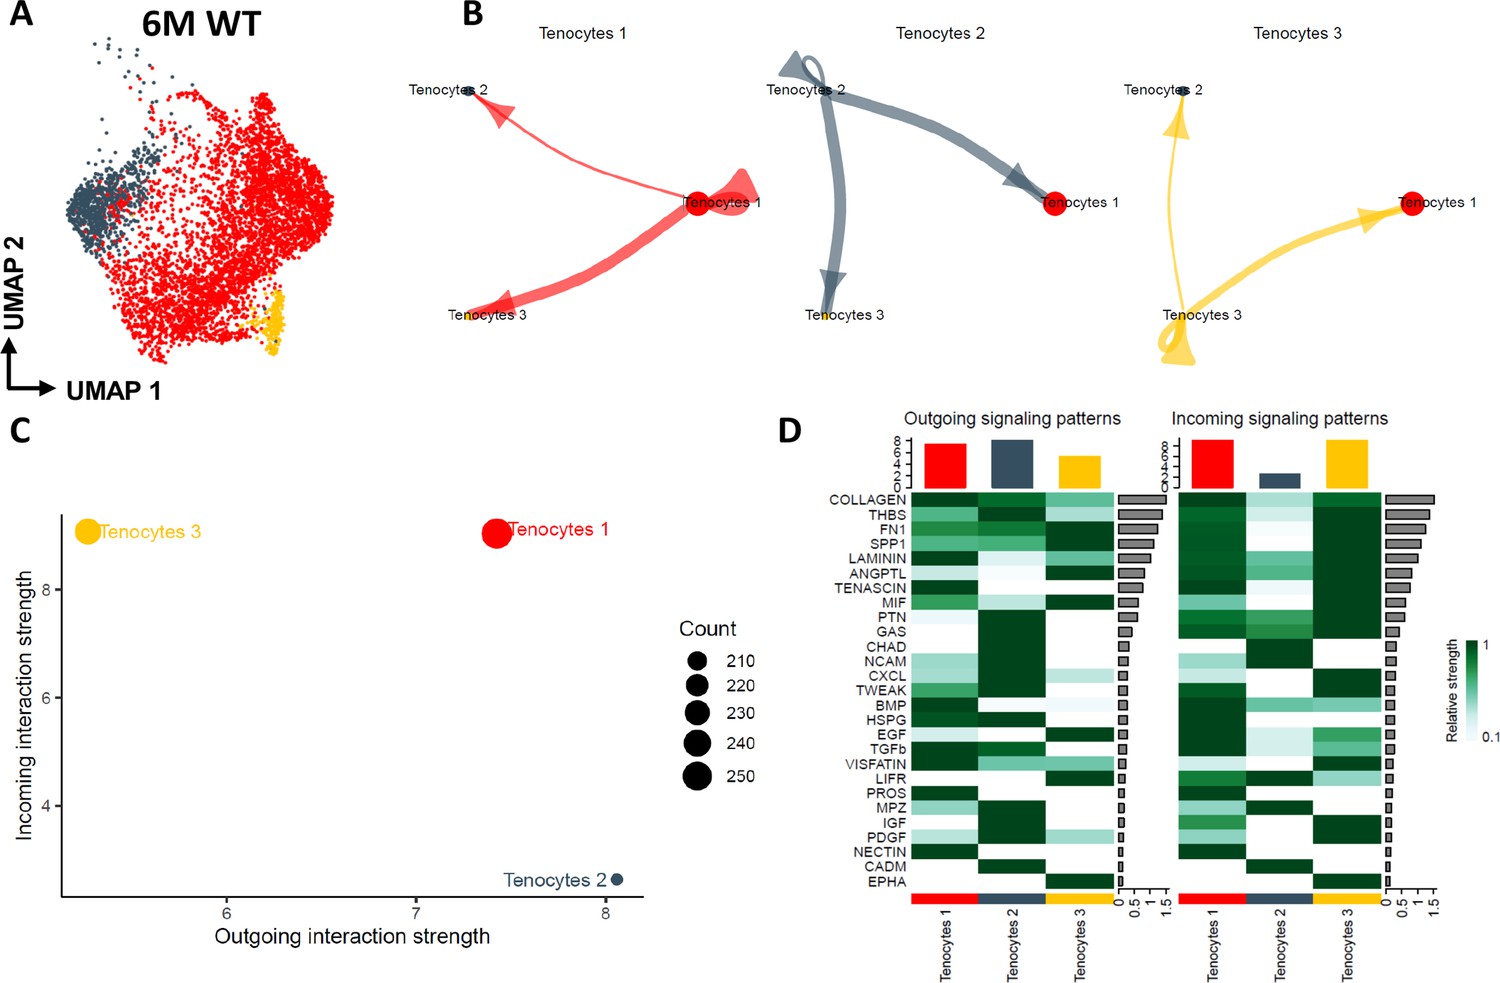
Tenocyte-tenocyte communication in the young adult FDL tendons.
(A) UMAP plot visualizing the three tenocyte subpopulations that exist in the 6 M WT FDL tendons. (B) Circle plot visualizing the autocrine and paracrine communication strength of each tenocyte subpopulation. (C) CellChat-based plot visualizing the incoming and outgoing communication strengths for each tenocyte subpopulation. (D) Heatmap of all the signaling pathways that are present during tenocyte-tenocyte communication, highlighting the outgoing vs incoming patterns for each tenocyte subpopulation.
Figure 7
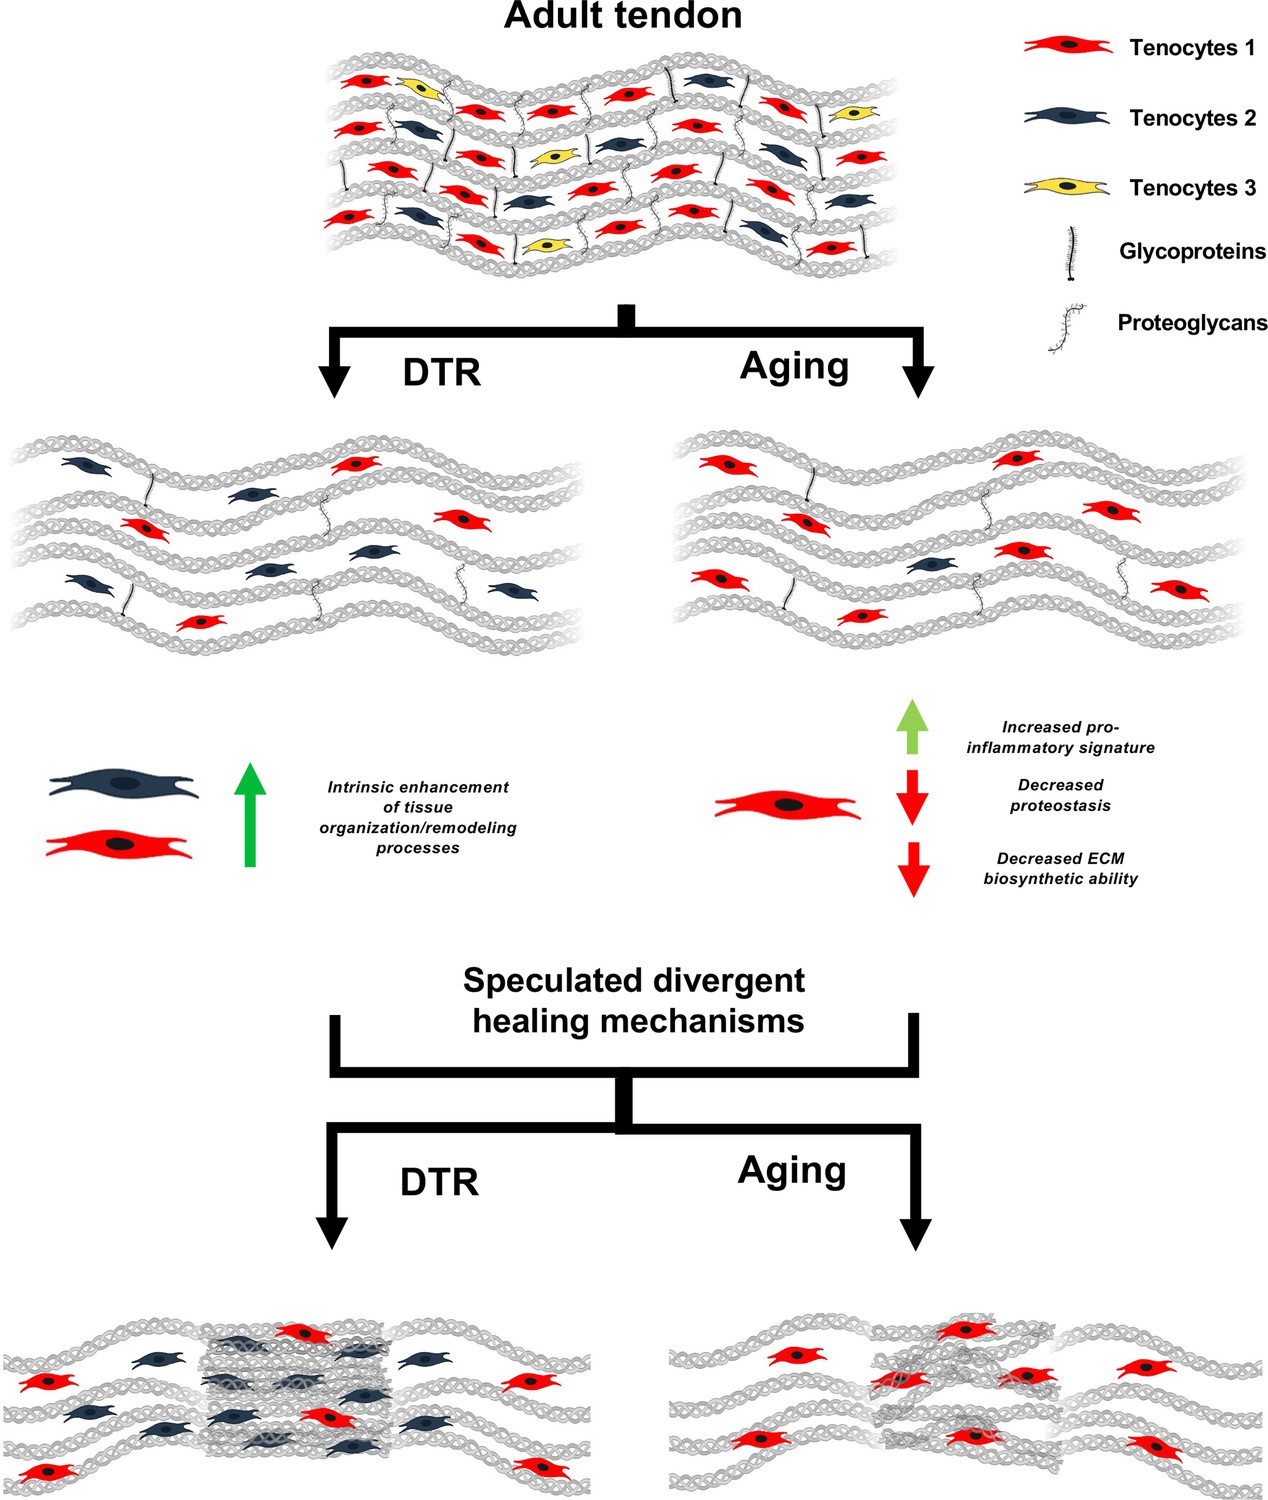
Schematic highlighting key findings and proposed models for divergent healing responses in young depleted vs aged tendons.
Both young DTR and aged WT tendons have similar decreases in tissue structure, organization, material quality, and total cell density. They also follow the same mechanism of ECM degeneration via a substantial decrease in the number of proteoglycans and glycoproteins with high turnover rate. However, in terms of cell composition shifts with depletion and natural aging, young DTR tendons are comprised mainly of tenocytes specialized in tissue organization and remodeling. What is more, young DTR have little to no inflammatory/reactive tenocytes. In contrast, old WT tendons are comprised predominantly of inflammatory and age-related functionally impaired tenocytes and exhibit little to no presence of tissue remodeling tenocytes. We speculate that these significantly different cellular compositions are some of the main causes resulting in divergent healing responses, with young DTR tendons showing improved healing while old WT tendons exhibiting impaired healing response.
Author response image 1
Tables
Key resources table
| Reagent type (species) or resource | Designation | Source or reference | Identifiers | Additional information |
|---|---|---|---|---|
| Genetic reagent (Mus. musculus) | Scx-Cre | Dr. Ronen Schweitzer | ||
| Genetic reagent (Mus. musculus) | C57BL/6-Gt(ROSA)26S ortm1(HBEGF)Awai/J (Rosa-DTRLSL) | Jackson Laboratory | Stock #: 007900 | Referred to as DTR in manuscript RRID:IMSR_JAX:007900 |
| Genetic reagent (Mus. musculus) | C57Bl/6 J | Jackson Laboratory | Stock #: 000664 | Referred to as B6 in manuscript RRID:MGI:2159769 |
| Antibody | Anti-rabbit Rhodamine- Red-X (donkey polyclonal) | Jackson ImmunoResearch | Catalog #: 711-296-152 | 1:200 RRID:AB_2340614 |
| Antibody | Anti-GBP2 (rabbit polyclonal) | Proteintech | Catolog #: 11854–1-AP | 1:500 RRID: AB_2109336 |
| Chemical Compound, Drug | Diphtheria Toxin (DT) | Millipore Sigma | Catalog #: D0564-1MG | 20 ng DT / injection |
| Software, algorithm | GraphPad Prism software | GraphPad Prism | https://graphpad.com | Version 9.5 |
| Software, algorithm | OlyVIA software | Olympus | https://www.olympus-lifescience.com/en/support/downloads/ | Version 2.9 |
| Software, algorithm | ImageJ software | ImageJ | http://imagej.nih.gov/ij/ | |
| Software, algorithm | R studio | R Studio | https://www.rstudio.com | |
| Software, algorithm | DAVID Gene Functional Classification Tool | Huang et al., 2009 | https://david.ncifcrf.gov/ | Version 6.8 |
| Software, algorithm | CellChat | Jin et al., 2021 | http://www.cellchat.org | Version 1.1.3 |
| Software, algorithm | Seurat R package | Stuart et al., 2019 | https://www.rdocumentation.org/packages/Seurat/versions/4.1.0 | Version 4.0 |
| Software, algorithm | Discoverer software platform | Thermo Fisher | Version 2.4 | |
| Software, algorithm | PANTHER classification system | Mi et al., 2021 | http://pantherdb.org/ | |
| Software, algorithm | Search Tool for Retrieval of Interacting Genes/ Proteins (STRING) | Szklarczyk et al., 2019 | v11.0 | |
| Software, algorithm | MatrisomeDB | Hynes and Naba, 2012. | https://web.mit.edu/hyneslab/matrisome/ | |
| Software, algorithm | CellMarker software | Zhang et al., 2019 | http://bio-bigdata.hrbmu.edu.cn/CellMarker/search.jsp | |
| Other | Gene Expression Omnibus (GEO) | Accession # GSE214929 | Single-cell RNA sequencing data | |
| Other | ProteomeXchange Consortium | Dataset Identifier: PXD037230 | Proteomics data |
Additional files
Download links
A two-part list of links to download the article, or parts of the article, in various formats.
Downloads (link to download the article as PDF)
Open citations (links to open the citations from this article in various online reference manager services)
Cite this article (links to download the citations from this article in formats compatible with various reference manager tools)
Scleraxis-lineage cells are required for tendon homeostasis and their depletion induces an accelerated extracellular matrix aging phenotype
eLife 12:e84194.
https://doi.org/10.7554/eLife.84194


