Autofluorescence imaging permits label-free cell type assignment and reveals the dynamic formation of airway secretory cell associated antigen passages (SAPs)
- Department of Internal Medicine, Division of Pulmonary and Critical Care Medicine, Massachusetts General Hospital, United States
- Center for Regenerative Medicine, Massachusetts General Hospital, United States
- Advanced Microscopy Program, Center for Systems Biology and Wellman Center for Photomedicine, Massachusetts General Hospital, Harvard Medical School, United States
- Harvard Stem Cell Institute, United States
- Klarman Cell Observatory, Broad Institute, United States
Figures
Figure 1 with 1 supplement
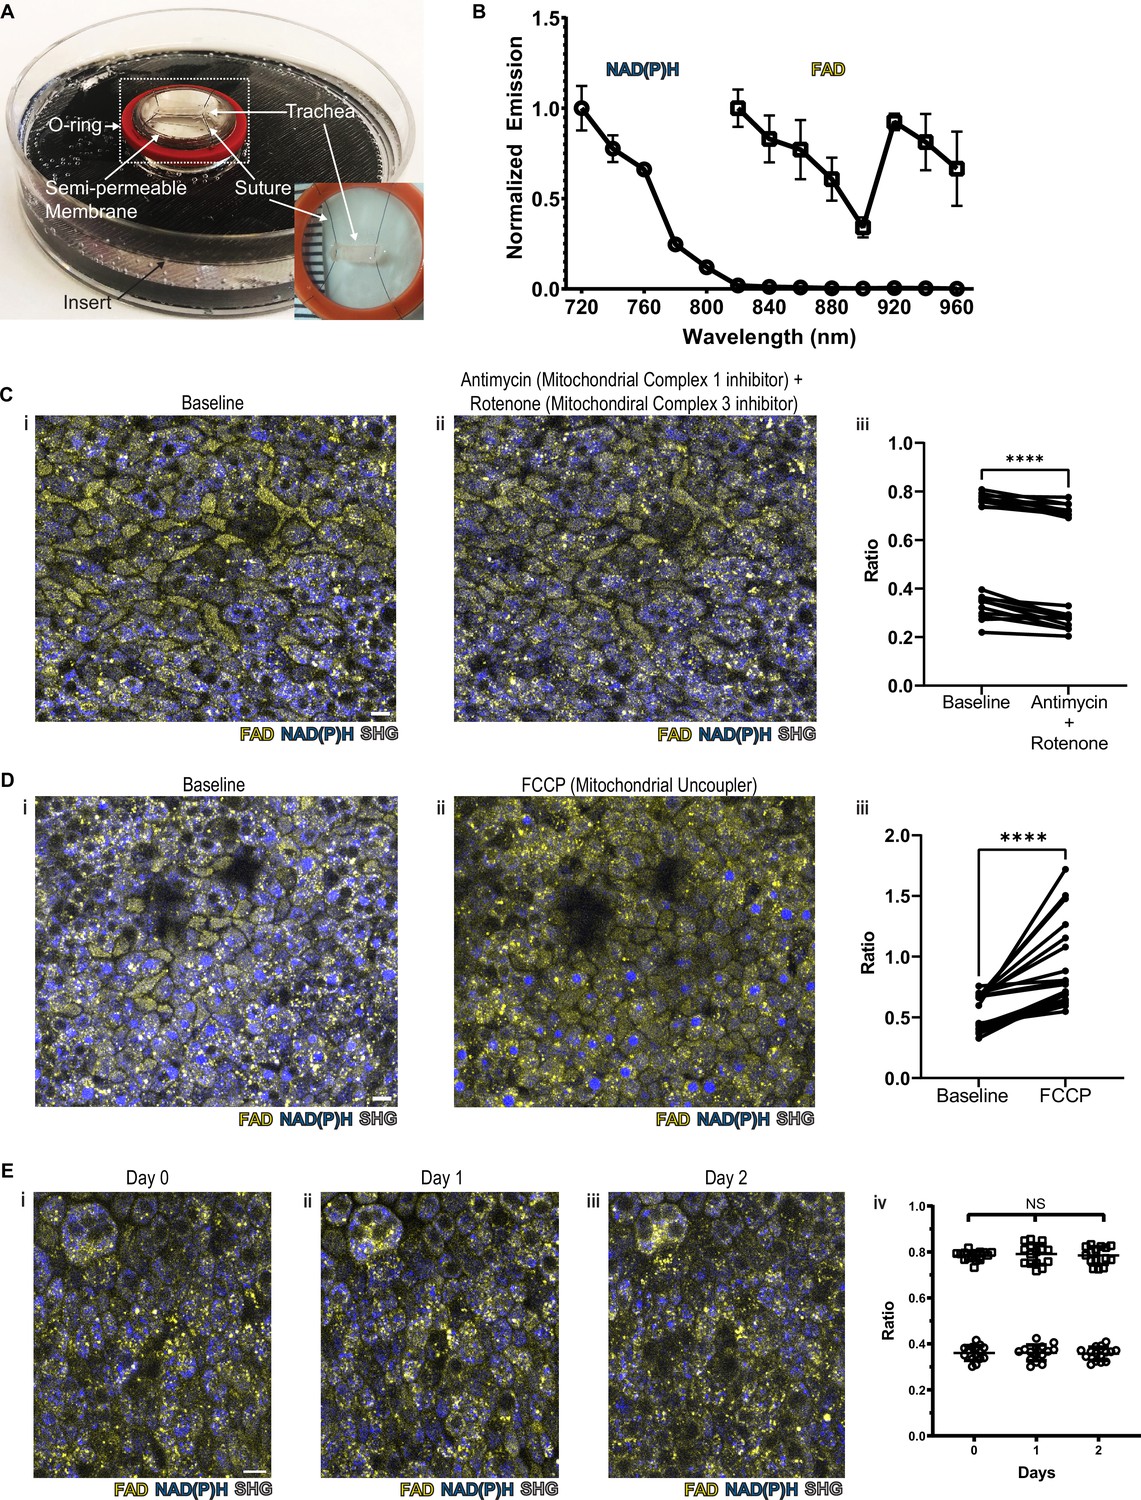
NAD(P)H and FAD autofluorescence can be measured from murine tracheal epithelial cells and is stable across days.
(A) Mounting of tracheal explant for upright two-photon imaging. Semipermeable membranes (12 mm Transwell, 0.4 µm Pore Polyester Membrane Insert) were inverted and fixed to custom 3D printed inserts in 60 mm dishes using silicone adhesive. Trachea were dissected and sutured onto O-rings for additional stability (A inset and Figure 1—figure supplement 1A). Trachea and O-ring were then placed onto the semipermeable membrane for upright imaging and explant culture. Inset showing a trachea sutured to O-ring in a zoomed view. (B) Autofluorescence emission normalized to maximal emission at different excitation wavelengths for both NAD(P)H and FAD. (C) NAD(P)H (blue), FAD (yellow), and second harmonic generation (SHG, gray) autofluorescence images of murine tracheal explant at (i) baseline, (ii) with the addition of antimycin (10 µM – mitochondrial complex I inhibitor) and rotenone (1 µM – mitochondrial complex III inhibitor) showing increased NAD(P)H fluorescence, and (iii) quantification of autofluorescence ratio (FAD/FAD +NAD[P]H) demonstrating a decrease. Each point is a single cell. N=20. (D) NAD(P)H (blue), FAD (yellow), and SHG (gray) autofluorescence images of murine tracheal explant at (i) baseline, (ii) with the addition of carbonyl cyanide p-trifluoro-methoxyphenyl hydrazone (FCCP – mitochondrial uncoupler) showing decrease in NAD(P)H fluorescence and an increase in the metabolic ratio (iii). Each point is a single cell. N=20. (E) Time course images of NAD(P)H (blue), FAD (yellow), and SHG (gray) of the same region of a tracheal explant at day 0 (i), day 1 (ii), and day 2 (iii) showing similar fluorescence. (iv) Quantification of ratio (FAD/FAD +NAD[P]H) of individual cells showing stability across 0, 1, and 2 days. N=15. ****p<0.0001 by paired t-test. Scale bars = 10 µm.
Figure 1—figure supplement 1
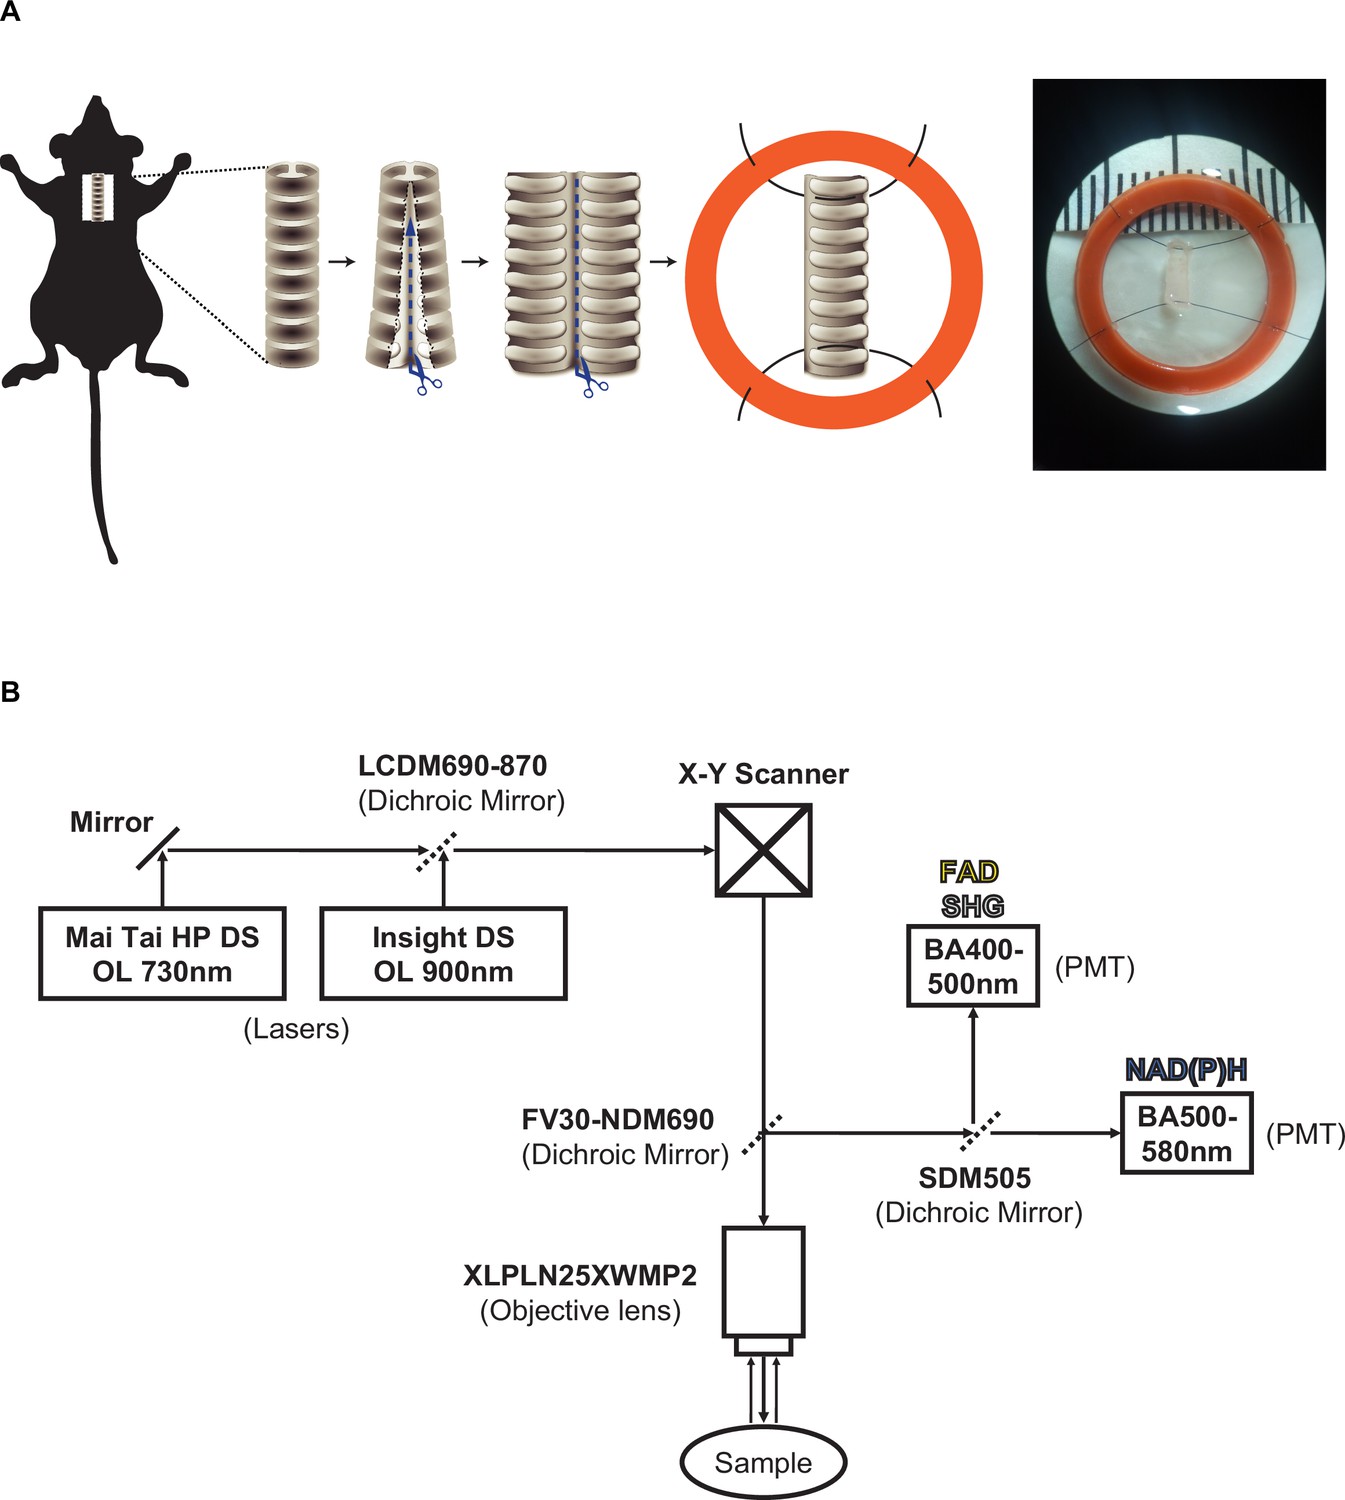
Mouse tracheal explant and microscopy set up.
(A) Dissection and subsequent suturing of trachea to O-ring. Immediately after euthanasia, trachea were excised after which further dissection along the posterior membrane was performed to separate the trachea into two halves. One piece was fixed to an O-ring using suture to prevent movement and to secure the trachea to the membrane insert. (B) Microscope filter and laser setup showing Insight laser set at 900 nm and Mai-Tai laser at 730 nm with a sharp cut dichroic mirror (SDM505) reflecting light less than 505 nm facilitated detection of FAD and second harmonic generation (SHG) while transmitting light greater that 505 nm for NAD(P)H detection at photomultiplier tubes (PMTs).
Figure 2 with 1 supplement
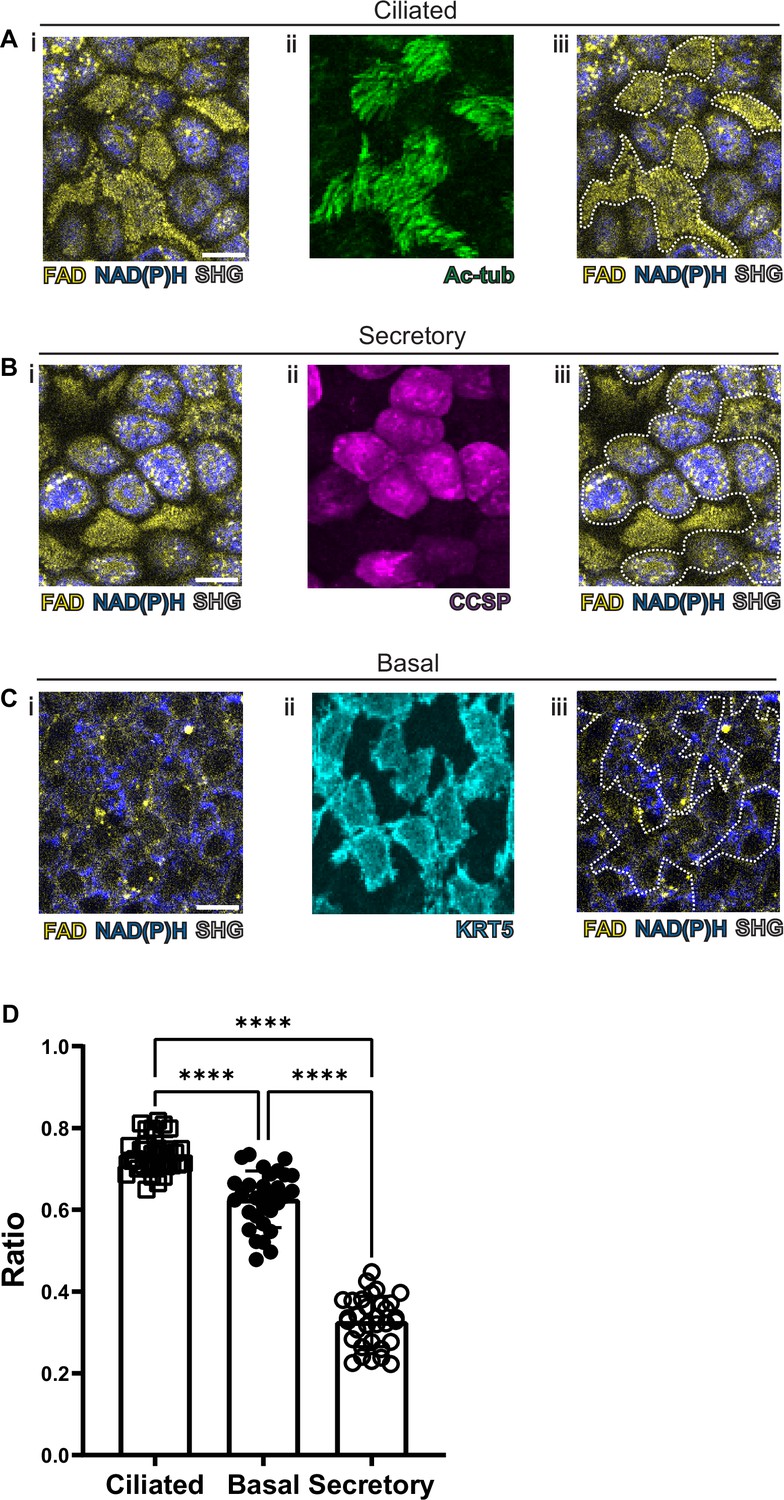
Autofluorescence imaging of common cell types.
(A–C) NAD(P)H (blue), FAD (yellow), and second harmonic generation (SHG, gray) autofluorescence (i) coupled with cell type-specific staining (ii) with acetylated tubulin (A) (green) for ciliated cells (B) CCSP (magenta) for secretory cells and (C) KRT5 (cyan) for basal cells. (iii) Cell borders determined from post-fixation staining are demarcated on autofluorescence images. (D) Quantification of FAD/FAD +NAD(P)H for ciliated cells (N=32), secretory cells (N=32), and basal cells (N=30), demonstrating distinct autofluorescence ratio. ANOVA test for multiple comparisons. **** p<0.0001. Scale bars = 10 µm.
Figure 2—figure supplement 1
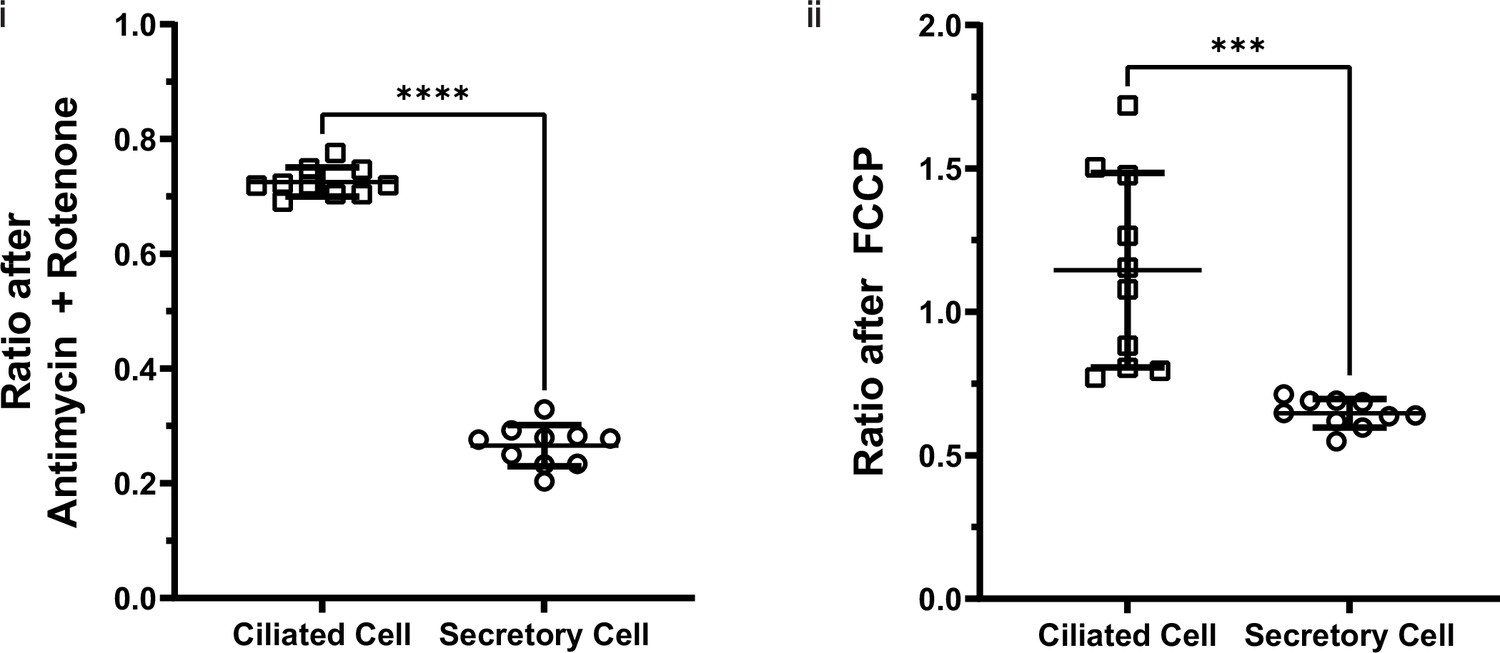
Autofluorescence ratios of ciliated cells and secretory cells after antimycin A + rotenone or FCCP application.
Ciliated cells and secretory cells have statistically different autofluorescence ratios following the application of (i) antimycin A + rotenone and (ii) FCCP. N=10. Unpaired t-test. ***p=0.002 and ****p<0.0001.
Figure 3 with 4 supplements
Rare cell detection using a combination of autofluorescence and unbiased clustering.
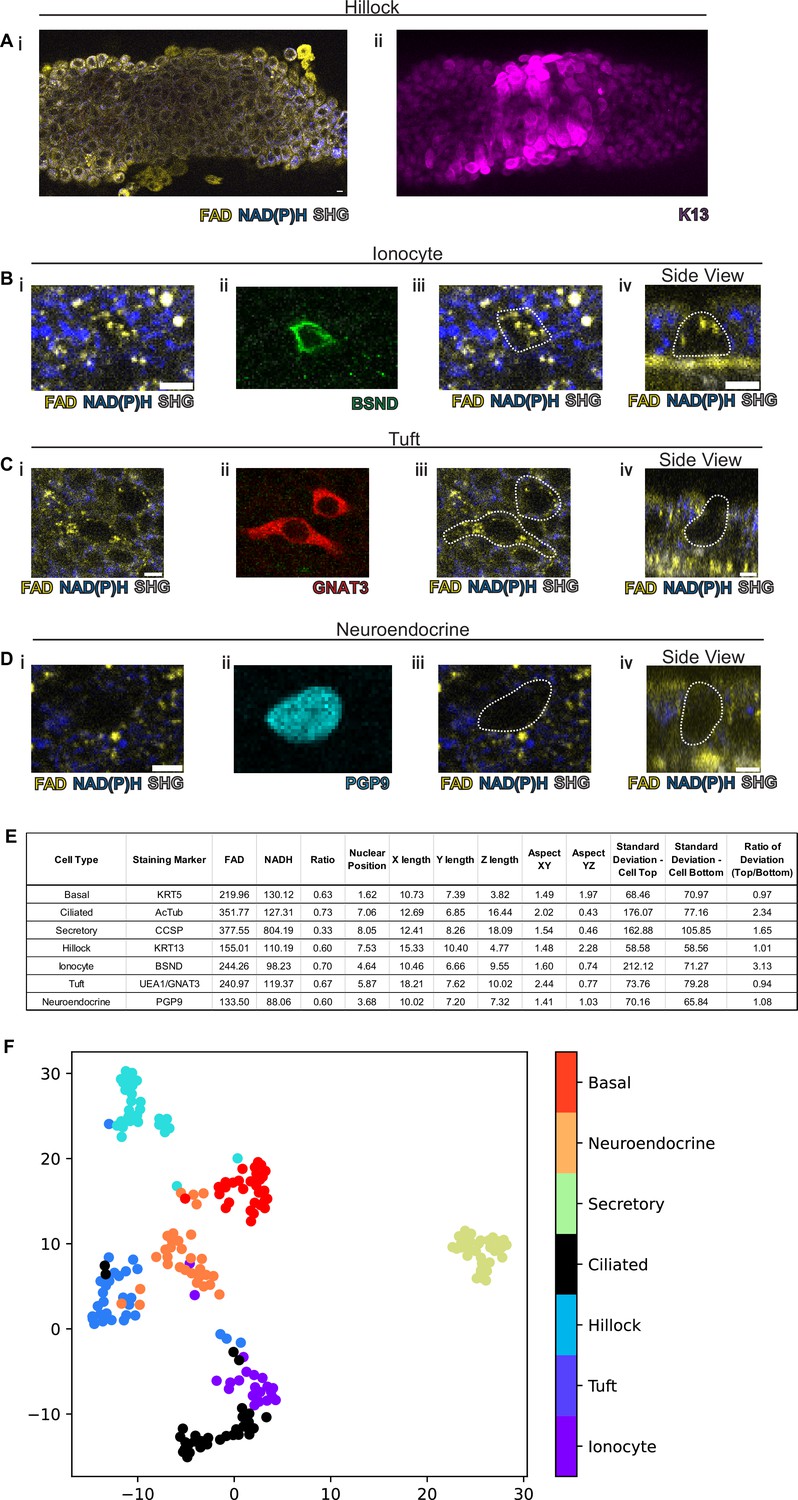
NAD(P)H (blue), FAD (yellow), and second harmonic generation (SHG, gray) autofluorescence in (i) of (A) hillocks, (B) ionocytes, (C) tuft cells, and (D) neuroendocrine cells. Staining in (ii) of hillocks (K13 – magenta), ionocytes (BSND – green), tuft cells (GNAT3 – red), and neuroendocrine cells (PGP9 – cyan). Scale bars = 10 µm in (A) and 5 µm in (B–D). (iii) Overlay of cell outline from (ii) onto (i). Cross sectional imaging across the Z plane (iv) showing differential fluorescence specifically in ionocytes but absent in tuft and neuroendocrine (NE) cells. (E) Table with cell type-specific values of both autofluorescence (FAD, NADH, and ratio) and specific morphologic parameters. ‘X-length’=largest length in the XY plane. ‘Y-length’=smallest length in the XY plane. ‘Z-length’=largest length in Z dimension. ‘Aspect XY’=ratio of X-length/Y-length. ‘Aspect YZ’=Y-length/Z-length. ‘SD cell top’=SD of autofluorescence ratio from above mid height. ‘SD cell bottom’=SD of autofluorescence ratio from below mid height. ‘Ratio of SD’ is SD cell top/SD cell bottom. (F) Unbiased clustering by UMAP from (E) demonstrating separate clusters for each cell type. The numbers of each cell type measured were as follows: ionocytes (21), tuft (30), hillock (30), ciliated (32), secretory (32), neuroendocrine (31), and basal (30).
-
Figure 3—source data 1
Mean autofluorescence measurements (FAD, NADH, and ratio) and morphologic characteristics for various cell types as described in Figure 3E.
- https://cdn.elifesciences.org/articles/84375/elife-84375-fig3-data1-v2.xlsx
Figure 3—figure supplement 1
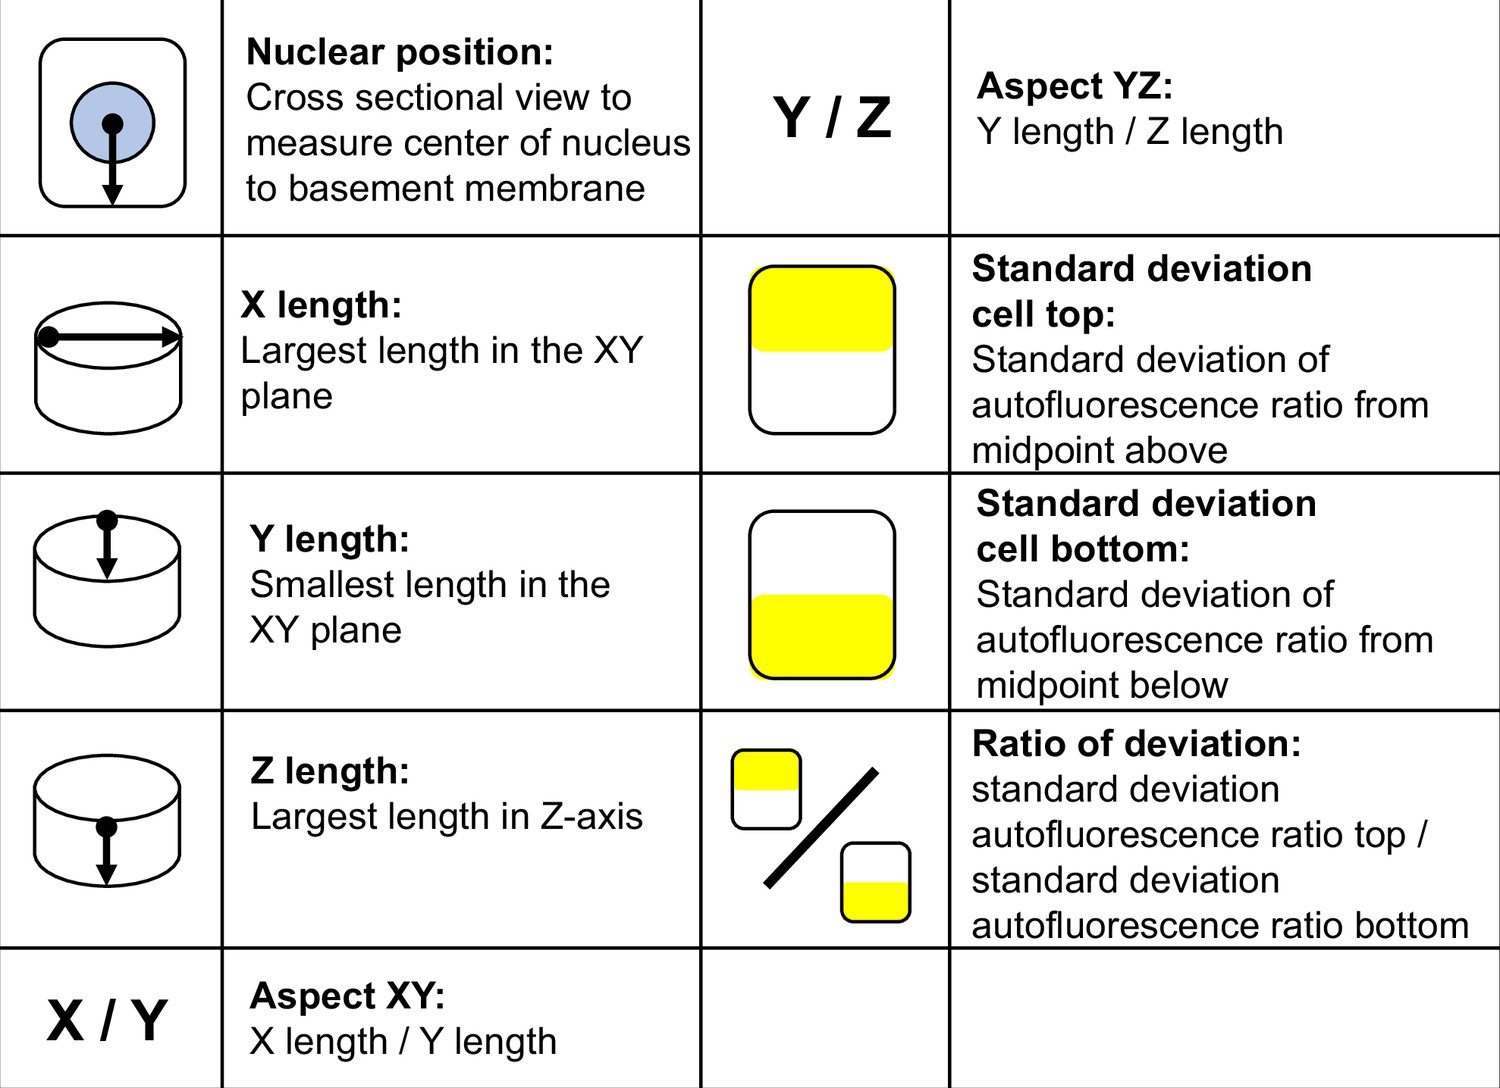
Morphometric parameters used in the analysis of airway epithelial cell types.
Figure 3—figure supplement 2
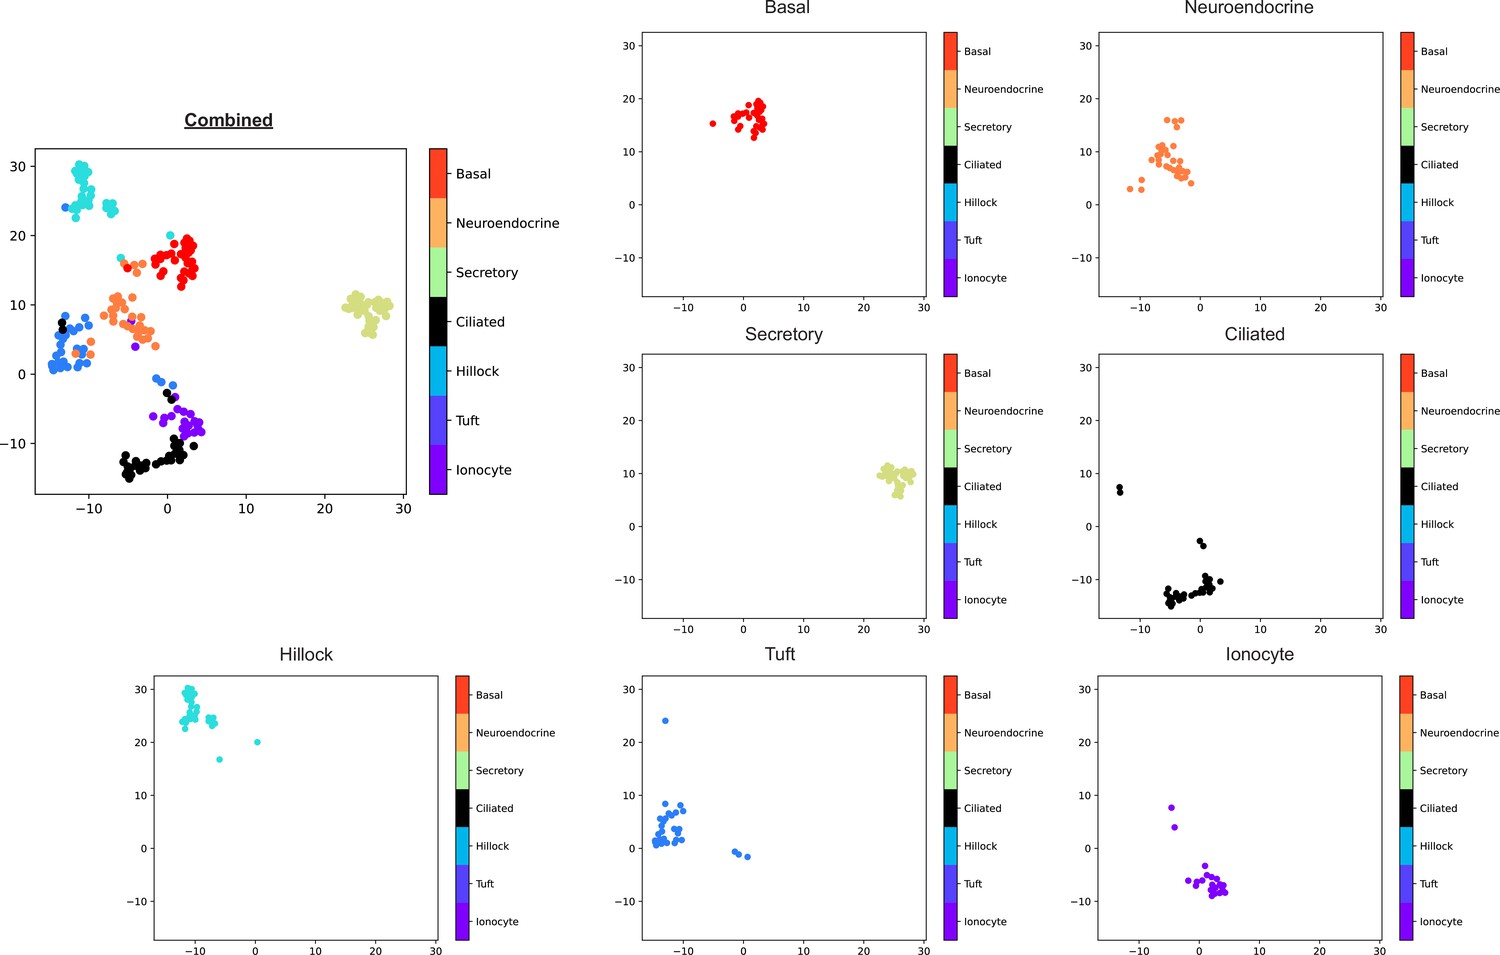
Unsupervised clusters analysis of all airway epithelial cell types shown individually.
Basal cells (red), neuroendocrine cells (orange), secretory cells (green), ciliated cells (black), hillock cells (cyan), tuft cells (blue), and ionocytes (magenta).
Figure 3—figure supplement 3
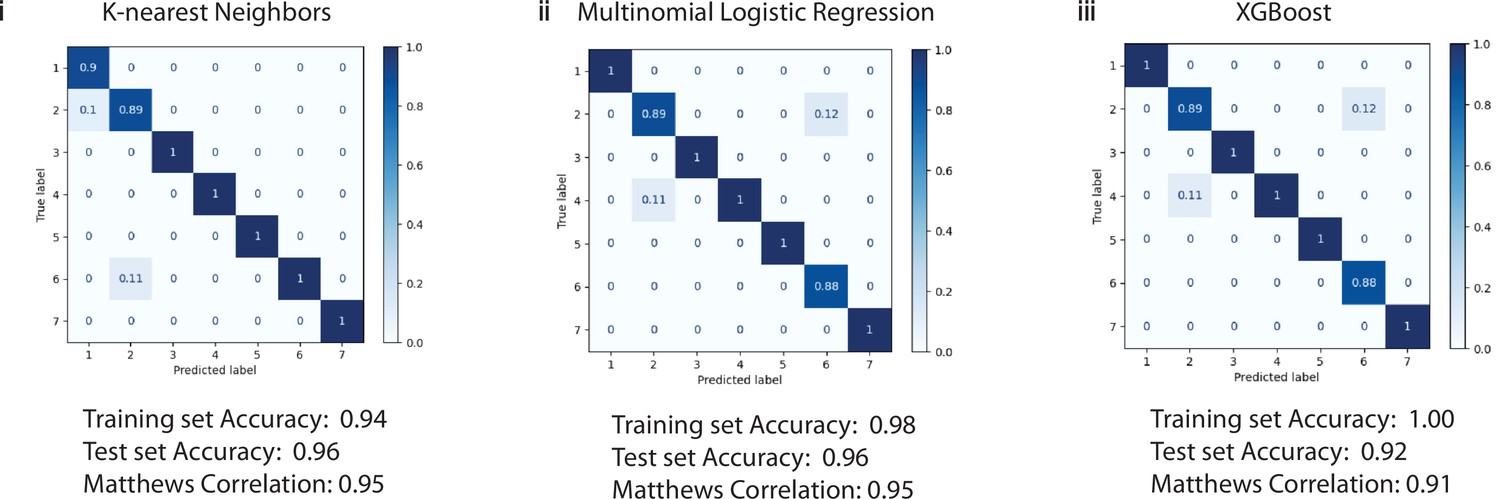
Confusion matrix demonstrating the performance of three algorithms for classifying cell identity.
152 cells were used for training, and 52 cells were used to test each algorithm (i) k-nearest neighbors, (ii) multinomial logistic regression, and (iii) XGBoost. The accuracy for the training set of 152 cells was 0.94, 0.98, and 1.00, respectively. The accuracy for the test set of 52 cells was 0.96, 0.96, and 0.92, respectively. Matthews Correlation Coefficients are 0.95, 0.95, and 0.91, respectively. 1=ionocytes, 2=tuft cells, 3=hillock cells, 4=ciliated cells, 5=secretory cells, 6=neuroendocrine cells, and 7=basal cells.
Figure 3—figure supplement 4
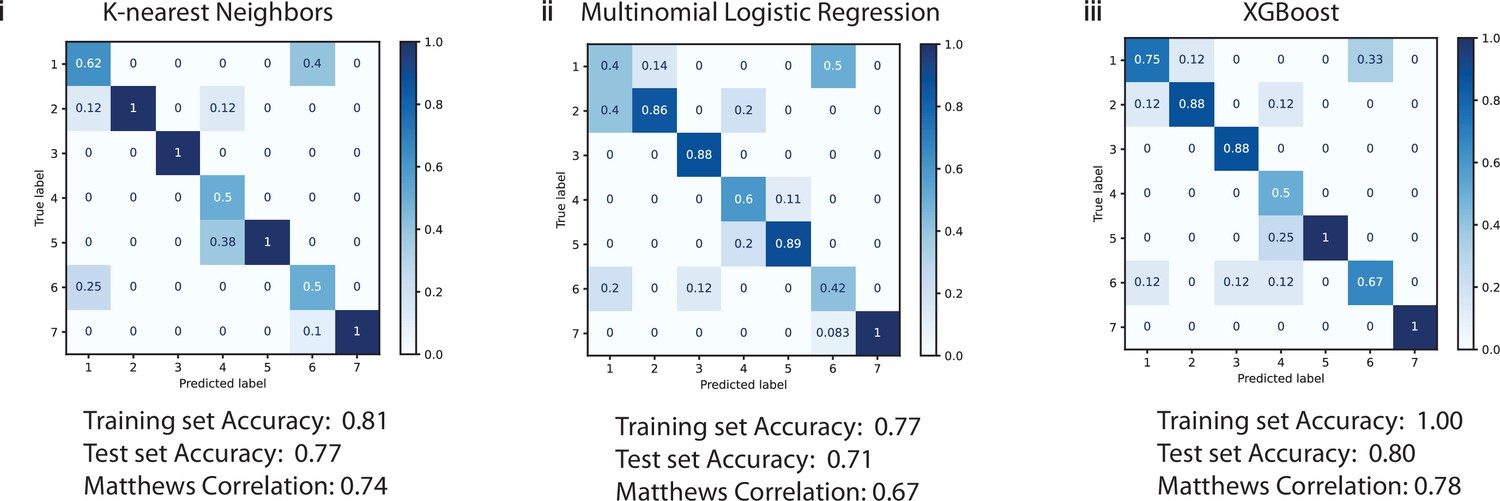
Confusion matrix demonstrating the performance of three algorithms, (i) k-nearest neighbors, (ii) multinomial logistic regression, and (iii) XGBoost, for classifying cell identity in the absence of NADH, FAD, and ratio autofluorescence data.
The overall accuracy was diminished as was the Matthews Correlation Coefficient, demonstrating that autofluorescence characteristics are important for cell type identification. 1=ionocytes, 2=tuft cells, 3=hillock cells, 4=ciliated cells, 5=secretory cells, 6=neuroendocrine cells, and 7=basal cells.
Figure 4
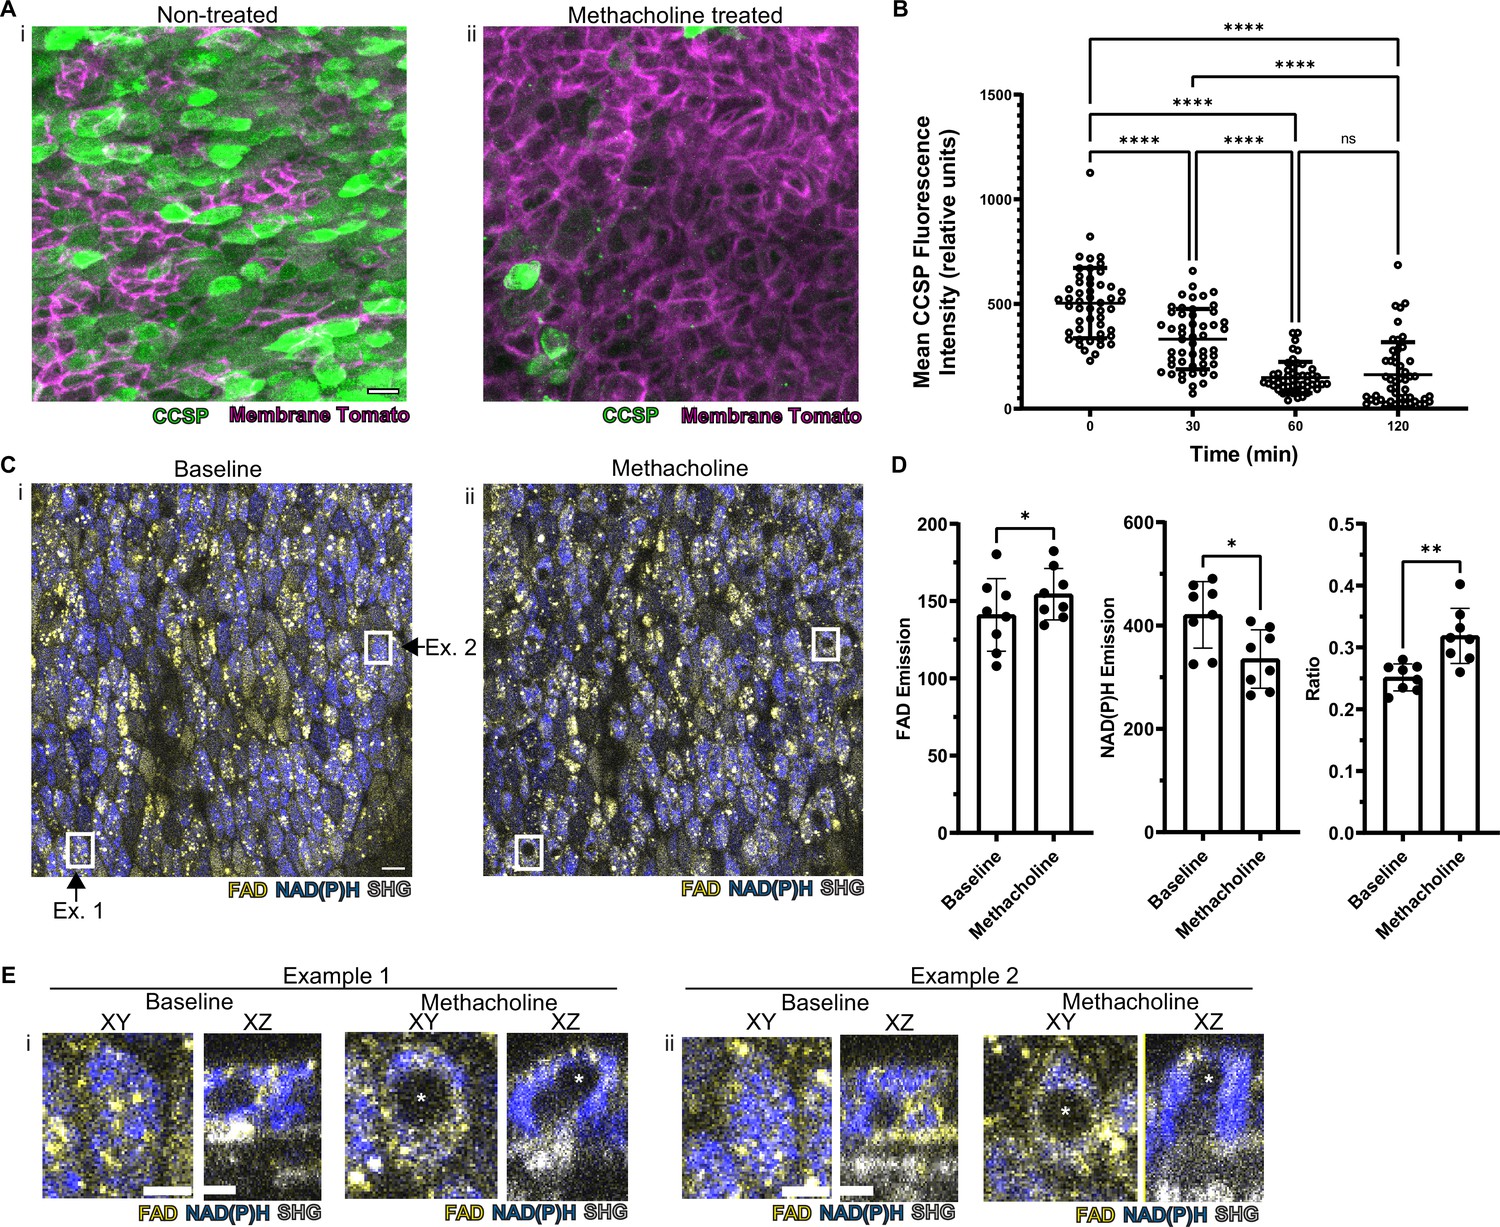
Autofluorescence imaging reliably identifies secretory cells despite the loss of characteristic secretory cell CCSP staining following methacholine stimulation.
(A) Murine airway epithelial cells expressing membrane tomato under ROSA promoter. CCSP staining (green) using identical imaging parameters performed on two adjacent halves of same trachea treated with (i) vehicle vs (ii) 10 µM methacholine. CCSP staining (green) is lost following methacholine stimulation. Cell membrane denoted by membrane tomato (magenta). (B) Fluorescence intensity of CCSP staining over time with methacholine stimulation imaged with same parameters. Each cell is represented by a dot. N=50. ****p<0.0001 by ANOVA. (C) Autofluorescence imaging (NADH blue, FAD yellow, and second harmonic generation [SHG] gray) of trachea at baseline (i) and after methacholine stimulation (ii). Magnified image of the region indicated by the white box is shown in (E). (D) Quantification of NADH, FAD, and fluorescence ratio (FAD/FAD +NAD[P]H) at baseline and after methacholine stimulation at single-cell resolution (each dot represents a cell, N=8). (E) White boxed regions from (C) showing the formation of non-fluorescent voids after methacholine stimulation in both an XY view and a cross-sectional XZ view. Non-fluorescent regions in baseline XZ are nucleus. Asterix denotes new non-fluorescent ‘void’ after methacholine stimulation. Scale bars = 10 µm in A and C and 5 µm in E.
-
Figure 4—source data 1
Secretory cells with “voids” are present at baseline and their numbers increase following 30 minutes of methacholine treatment.
- https://cdn.elifesciences.org/articles/84375/elife-84375-fig4-data1-v2.docx
Figure 5 with 5 supplements
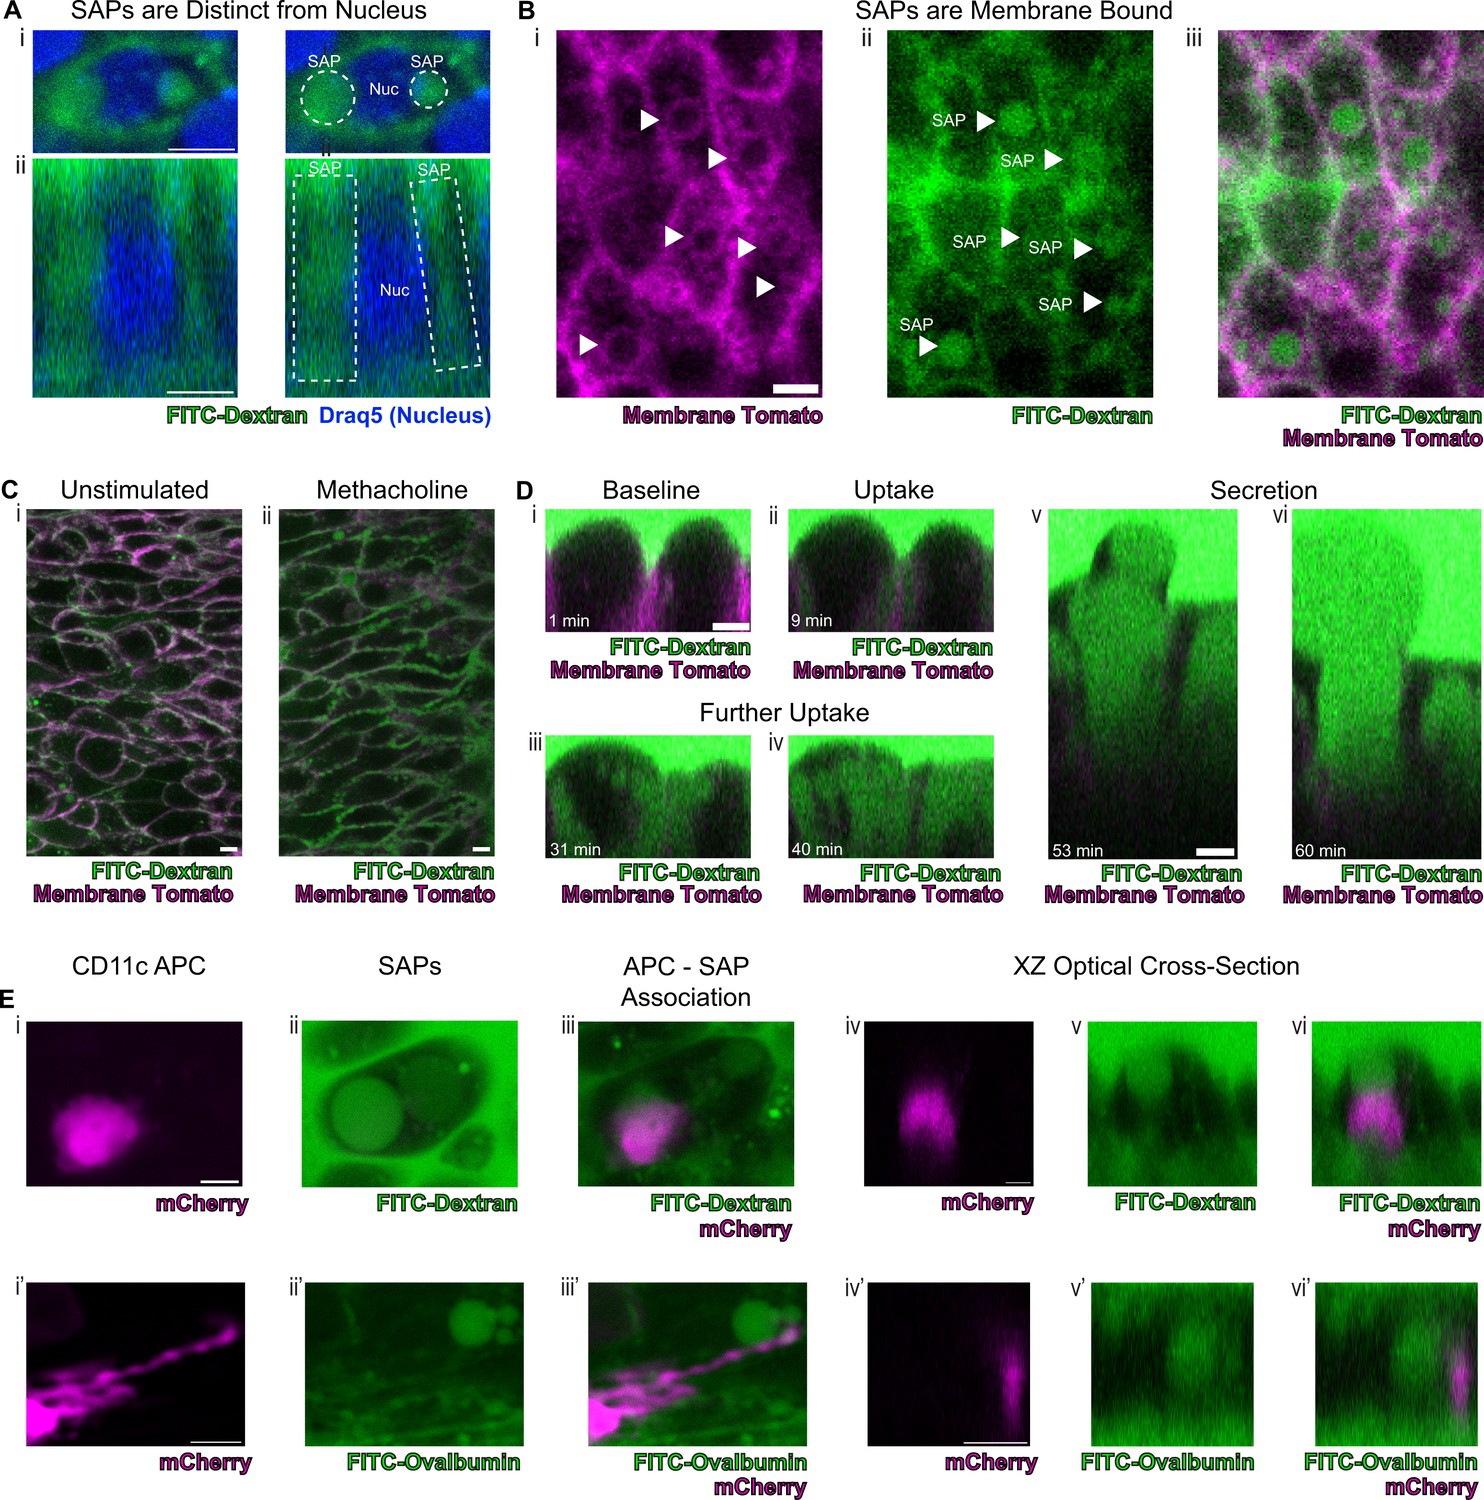
Secretory cells take up luminal contents and form secretory cell associated antigen passages (SAPs).
(A) Secretory cell demonstrating uptake of FITC-dextran (10Kd, green) that is distinct from the nucleus stained by Draq5 (magenta). (i) Top panels are xy views and (ii) bottom panels are cross-sectional xz view. Dotted lines outline SAPs. Scale bars = 5 µm. (B) Tracheal imaging of (i) membrane tomato (magenta) and (ii) FITC-dextran (iii) overlay of both channels demonstrates methacholine-stimulated uptake of extracellular dextran into membrane bound SAPs (arrowheads). Scale bars = 5 µm. (C) FITC-dextran uptake in unstimulated and methacholine stimulated tracheal explants. Trachea from a mouse expressing membrane tomato (magenta) was bisected, and one half of the trachea was placed in media containing FITC-dextran (green) in the absence of methacholine, while the other half was placed in the same FITC-dextran media containing 10 µM methacholine. After 30 min of incubation, dextran uptake occurs in (i) unstimulated samples and (ii) dramatically increases following methacholine stimulation. (D) Selected images from Figure 5—video 1 demonstrating uptake of luminal FITC-dextran and subsequent secretion of cell contents. (i) Baseline image prior to methacholine stimulation. (ii) Uptake of FITC-dextran and formation of SAPs (9 min after methacholine stimulation). (iii and iv) Further accumulation of FITC-dextran (31 min and 40 min after methacholine stimulation). (v and vi) Secretion of cellular contents (53 min and 60 min after methacholine stimulation). (E) CD11c+antigen-presenting cells (APCs) interact with SAPs. (i and i') CD11c+APCs labeled by mCherry (magenta) (ii and ii’) methacholine stimulated SAP formation with FITC-dextran uptake (ii) and FITC-ovalbumin uptake (ii’). (iii and iii’) CD11c+APCs associate with SAPs (iv–vi and iv’–vi’) optical XZ cross sections of CD11c+APCs juxtaposed to SAPs. Scale bars = 5 µm.
Figure 5—figure supplement 1
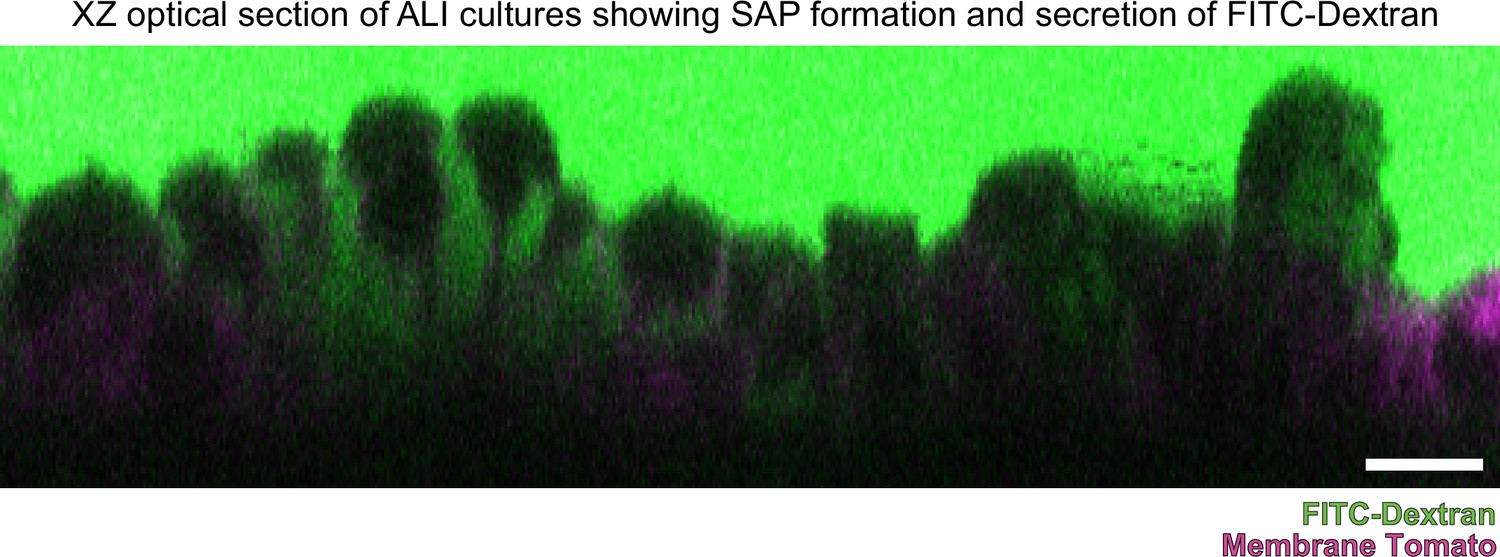
XZ optical cross-sectional view of a murine airway liquid interface culture (ALI) of airway epithelial cells expressing membrane tomato (magenta) cultured in media containing FITC-dextran (green) demonstrating numerous examples of dextran uptake and secretion.
ALIs were treated with 10 µM methacholine, and images were obtained approximately 1 hr after stimulus. Scale bar = 10 µm.
Figure 5—figure supplement 2
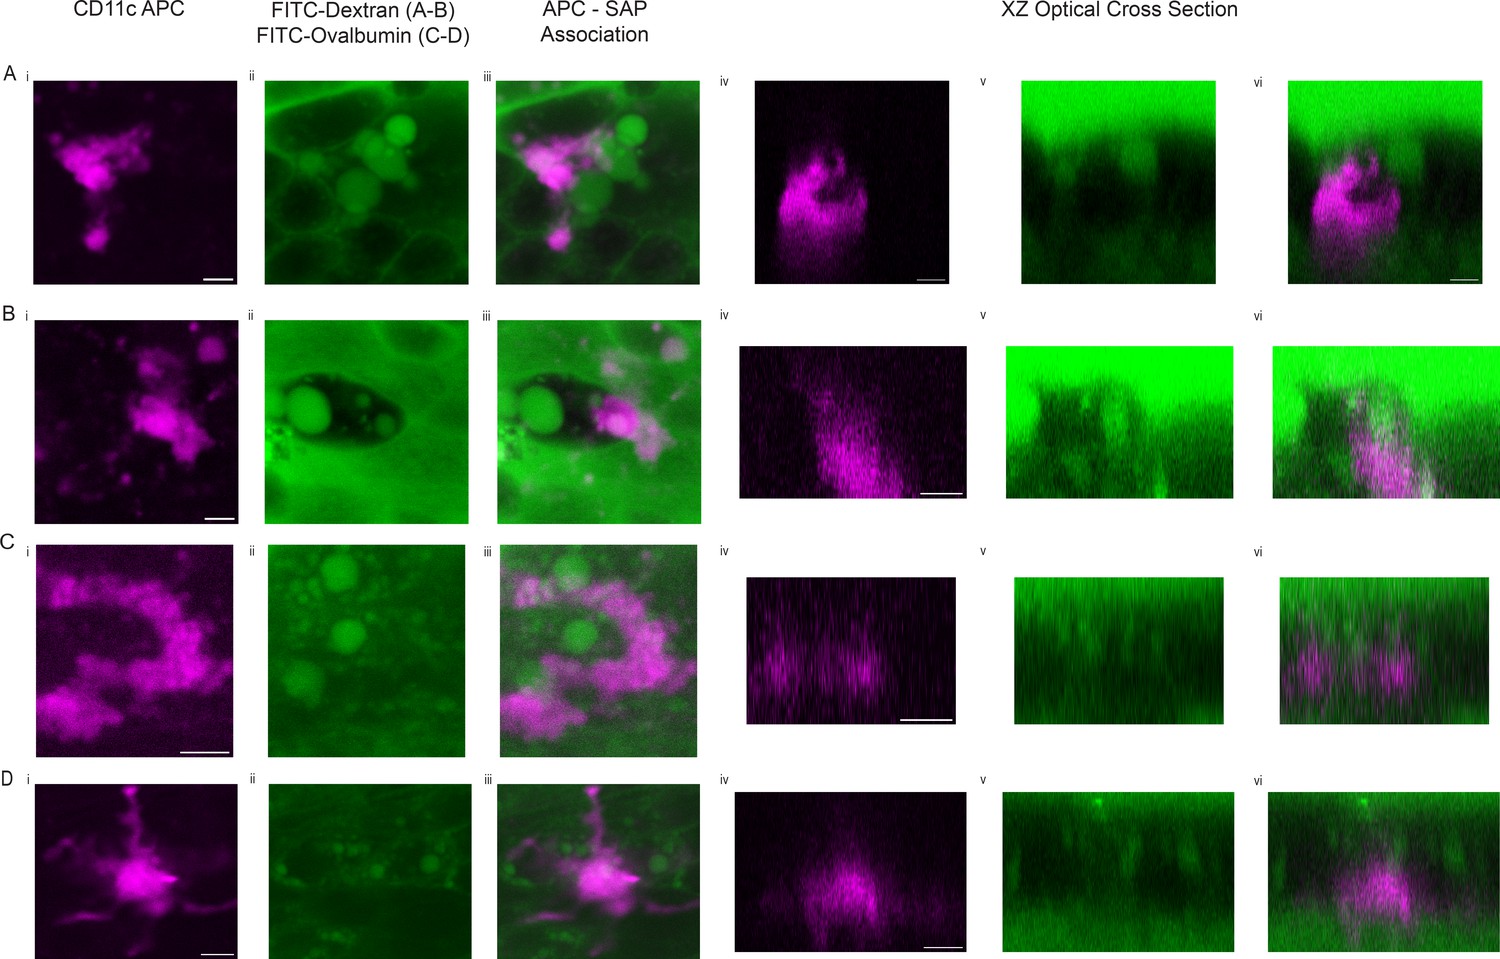
CD11c+antigen-presenting cells (APC) associate with secretory cell associated antigen passages (SAPs).
Trachea from mice in which CD11c+APCs are labeled by mCherry (magenta) were incubated with FITC-dextran (A–B) or FITC-ovalbumin (C–D) and 10 µM methacholine. CD11c+APCs expressing mCherry (i), SAPs containing FITC-dextran/ovalbumin (ii), merge (iii), and XZ optical cross-sectional view of SAP/APC association (iv–vi). Scale bar = 5 µm.
Figure 5—video 1
Movies of murine airway liquid interface (ALI) cultures using airway epithelial cells labeled with membrane tomato (magenta) demonstrating dextran (green) uptake and secretion.
Movies of secretory cell associated antigen passage (SAP) formation demonstrate uptake of FITC-dextran (green) into epithelial cells and subsequent secretion from the same cells. 4 frames per second. Imaging in the XZ plane. Scale bar = 5 µm.
Figure 5—video 2
Movies of murine airway liquid interface (ALI) cultures using airway epithelial cells labeled with membrane tomato (magenta) demonstrating dextran (green) uptake and secretion.
Figure 5—video 3
Movies of murine airway liquid interface (ALI) cultures using airway epithelial cells labeled with membrane tomato (magenta) demonstrating dextran (green) uptake and secretion.
Tables
Table 1
Contribution of each autofluorescence or morphometric characteristic to cell type-specific identification using XGBoost machine learning algorithm.
| FAD | NADH | Ratio | Nuclear position | X length | Y length | Z length | Aspect XY | Aspect YZ | SD - cell top | SD - cell bottom | Ratio of deviation (top/bottom) | Total |
|---|---|---|---|---|---|---|---|---|---|---|---|---|
| 0.10 | 0.12 | 0.06 | 0.18 | 0.09 | 0.01 | 0.08 | 0.02 | 0.13 | 0.07 | 0.02 | 0.11 | 1.00 |
Key resources table
| Reagent type (species) or resource | Designation | Source or reference | Identifiers | Additional information |
|---|---|---|---|---|
| Antibody | Mouse monoclonal anti-tubulin, acetylated | Sigma | T-6793 | 1:500 |
| Antibody | Rabbit monoclonal anti-BSND | Abcam | ab196017 | 1:150 |
| Antibody | Goat polyclonal anti-GNAT3 | Novus | NBP1-20926 | 1:100 |
| Antibody | Rabbit monoclonal anti-KRT13 | Abcam | ab92551 | 1:100 |
| Antibody | Goat polyclonal anti-CC10 | Santa Cruz | SC-9772 | 1:1000 |
| Antibody | Rabbit polyclonal anti-UCHL1 | Proteintech | 14730–1-AP | 1:250 |
| Antibody | Chicken polyclonal anti-KRT5 | Biolegend | 905901 | 1:200 |
| Chemical compound and drug | Acetyl-β-methylcholine chloride | Sigma | A2251 | |
| Chemical compound and drug | 10Kd FITC-dextran | Sigma | FD10S | |
| Chemical compound and drug | FITC-ovalbumin | Thermo | O23020 | |
| Chemical compound and drug | ROCK inhibitor Y-27632 | Selleckbio | S1049 | |
| Chemical compound and drug | Antimycin A from Streptomyces sp | Sigma | A8674 | |
| Chemical compound and drug | Rotenone | Sigma | 557368 | |
| Chemical compound and drug | Carbonyl cyanide 4-(trifluoromethoxy) phenylhydrazone | Sigma | C2920 | |
| Strain and strain background (Mus musculus) | C57BL/6J | Jax | stock no. 000664 | |
| Strain and strain background (Mus musculus) | MT-MG | Jax | stock no. 007676 | |
| Strain and strain background (Mus musculus) | Cd11c-mCherry | Khanna et al., 2010 | ||
| Software and algorithm | MATLAB | Mathworks | https://www.mathworks.com/products/matlab.html | |
| Software and algorithm | Jupyter Notebook | Jupyter | https://jupyter.org/ | |
| Software and algorithm | FIJI | Schindelin et al., 2012 | https://fiji.sc/ | |
| Software and algorithm | GraphPad Prism | GraphPad | https://www.graphpad.com | |
| Other | 12 mm Transwell | Corning | 3460 | Semipermeable membrane support |
| Other | Sylgard 184 silicone elastomer | Electron Microscopy Sciences | EMS Catalog #24236–10 | Silicone adhesive used for fixation of transwell insert |
| Other | Silicone O-ring | McMaster-Carr | 1182N015 | O-ring used to secure trachea |
| Other | 3D printed insert | This manuscript | https://github.com/vss11/Label-free-autofluorescence | 3D printed insert used to secure semipermeable membrane |
| Other | 7–0 Silk Suture | Ethicon | 786 G | Suture used to secure trachea to O-ring |
| Other | UEA1-dylight 649 | Vector Laboratories | DL-1068–1 | 1:100, lectin stain |
| Other | Draq5 | Abcam | ab108410 | 1:5000, nuclear stain |
Additional files
Download links
A two-part list of links to download the article, or parts of the article, in various formats.
Downloads (link to download the article as PDF)
Open citations (links to open the citations from this article in various online reference manager services)
Cite this article (links to download the citations from this article in formats compatible with various reference manager tools)
Autofluorescence imaging permits label-free cell type assignment and reveals the dynamic formation of airway secretory cell associated antigen passages (SAPs)
eLife 12:e84375.
https://doi.org/10.7554/eLife.84375


