NSC-derived exosomes enhance therapeutic effects of NSC transplantation on cerebral ischemia in mice
- College of Biomedicine and Health, College of Life Science and Technology, Huazhong Agricultural University, China
- Center for Neurological Disease Research, Taihe Hospital, Hubei University of Medicine, China
- iRegene Therapeutics Co., Ltd, China
- Department of Neurosurgery, Zhongnan Hospital of Wuhan University, China
- Department of Radiology, Hubei Cancer Hospital, Tongji Medical College, Huazhong University of Science and Technology, China
Figures
Figure 1 with 2 supplements
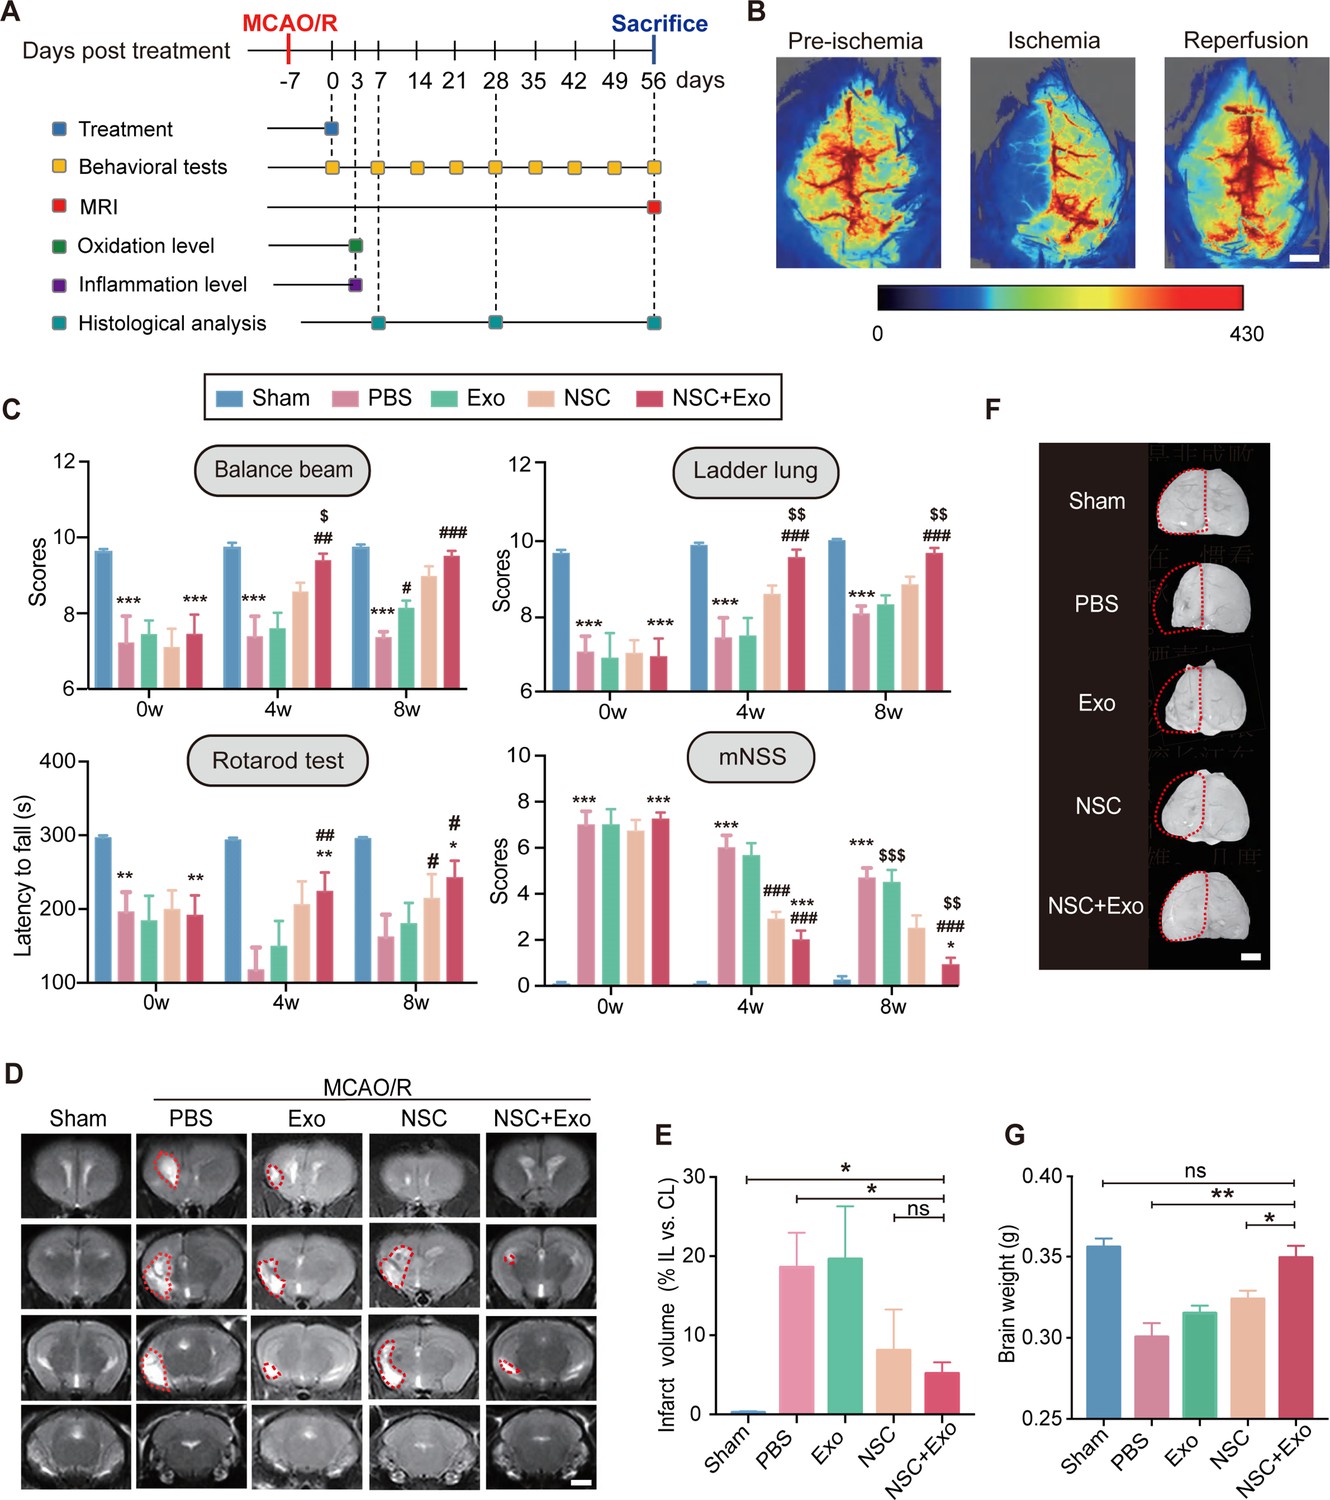
Neural stem cell (NSC)-derived exosomes enhanced the therapeutic effects of NSCs on motor impairment and brain infarction after stroke.
(A) Summary of the experimental timeframes. (B) Images of cerebral blood flow before, during, and 24 hr of the middle cerebral artery occlusion/reperfusion (MCAO/R) procedure. Scale bar: 2 mm. (C) Behavioral test results (the balance beam, ladder rung, rotarod tests) and modified neurological severity score (mNSS) at 0, 4, and 8 weeks after treatment, n = 10 mice per group. *p < 0.05, **p < 0.01, ***p < 0.001, versus Sham group. #p < 0.05, ##p < 0.01, ###p < 0.001, versus PBS group. $p < 0.05, $$p < 0.01, $$$p < 0.001, versus NSC group. (D) MRI images show brain cerebral infarct at 8 weeks after treatment. The infarct area is marked by dotted lines. Scale bar: 2 mm. (E) Quantification of (D), n = 3 per group. (F) Representative images show brain atrophy at 8 weeks after treatment. The ischemic hemispheres are marked by dotted lines. Scale bar: 2 mm. (G) Quantification of the brain weights at 8 weeks after treatment, n = 6 per group. *p < 0.05, **p < 0.01, ns indicates non-significant difference.
-
Figure 1—source data 1
Neural stem cell (NSC)-derived exosomes enhanced the therapeutic effects of NSCs on motor impairment and brain infarction after stroke.
- https://cdn.elifesciences.org/articles/84493/elife-84493-fig1-data1-v1.zip
Figure 1—figure supplement 1
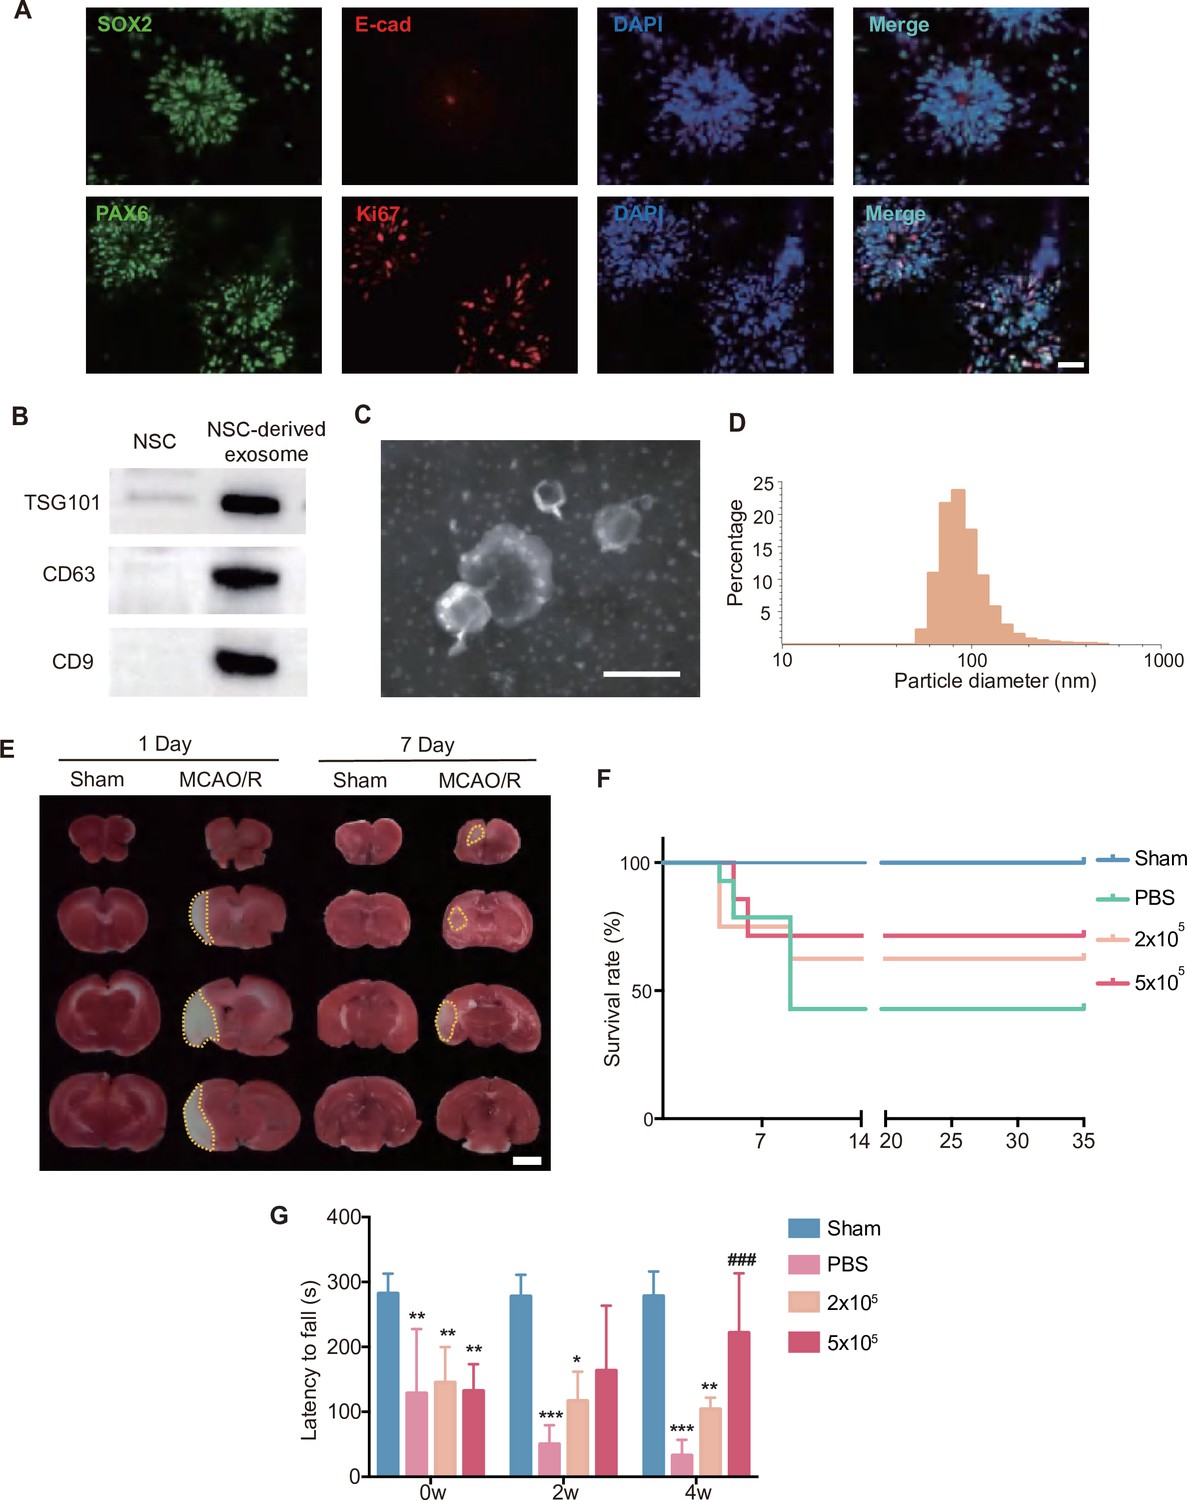
Characterization of neural stem cells (NSCs) and NSC-derived exosomes, and effects of different doses of transplanted NSCs.
(A) Representative images of immunostaining against SOX2, E-cad, PAX6, Ki67, and DAPI on NSCs. Scale bar: 25 μm. (B) Western blot results showed the expression of exosome markers TSG101, CD63, and CD9. (C) Representative transmission electron microscopy (TEM) image of NSC-derived exosomes. Scale bar: 200 nm. (D) The distribution of particle diameters of exosomes mixture examined by Malvern Nano ZS90. (E) Representative images of 2,3,5-triphenyl tetrazolium chloride (TTC) staining on day 1 and 7 post-stroke. The infract area was marked by dotted lines. Scale bar: 2 mm. (F) The survival curve of different dosed NSC treatment (2 × 10⁵ and 5 × 10⁵). (G) The rotarod test at 0, 2, and 4 weeks after treatment, n = 5 mice/group. *p < 0.05, **p < 0.01, ***p < 0.001 versus Sham group. ###p < 0.001 versus PBS group.
-
Figure 1—figure supplement 1—source data 1
Characterization of neural stem cells (NSCs) and NSC-derived exosomes, and effects of different doses of transplanted NSCs.
- https://cdn.elifesciences.org/articles/84493/elife-84493-fig1-figsupp1-data1-v1.zip
-
Figure 1—figure supplement 1—source data 2
Characterization of neural stem cells (NSCs) and NSC-derived exosomes, and effects of different doses of transplanted NSCs.
- https://cdn.elifesciences.org/articles/84493/elife-84493-fig1-figsupp1-data2-v1.zip
Figure 1—figure supplement 2
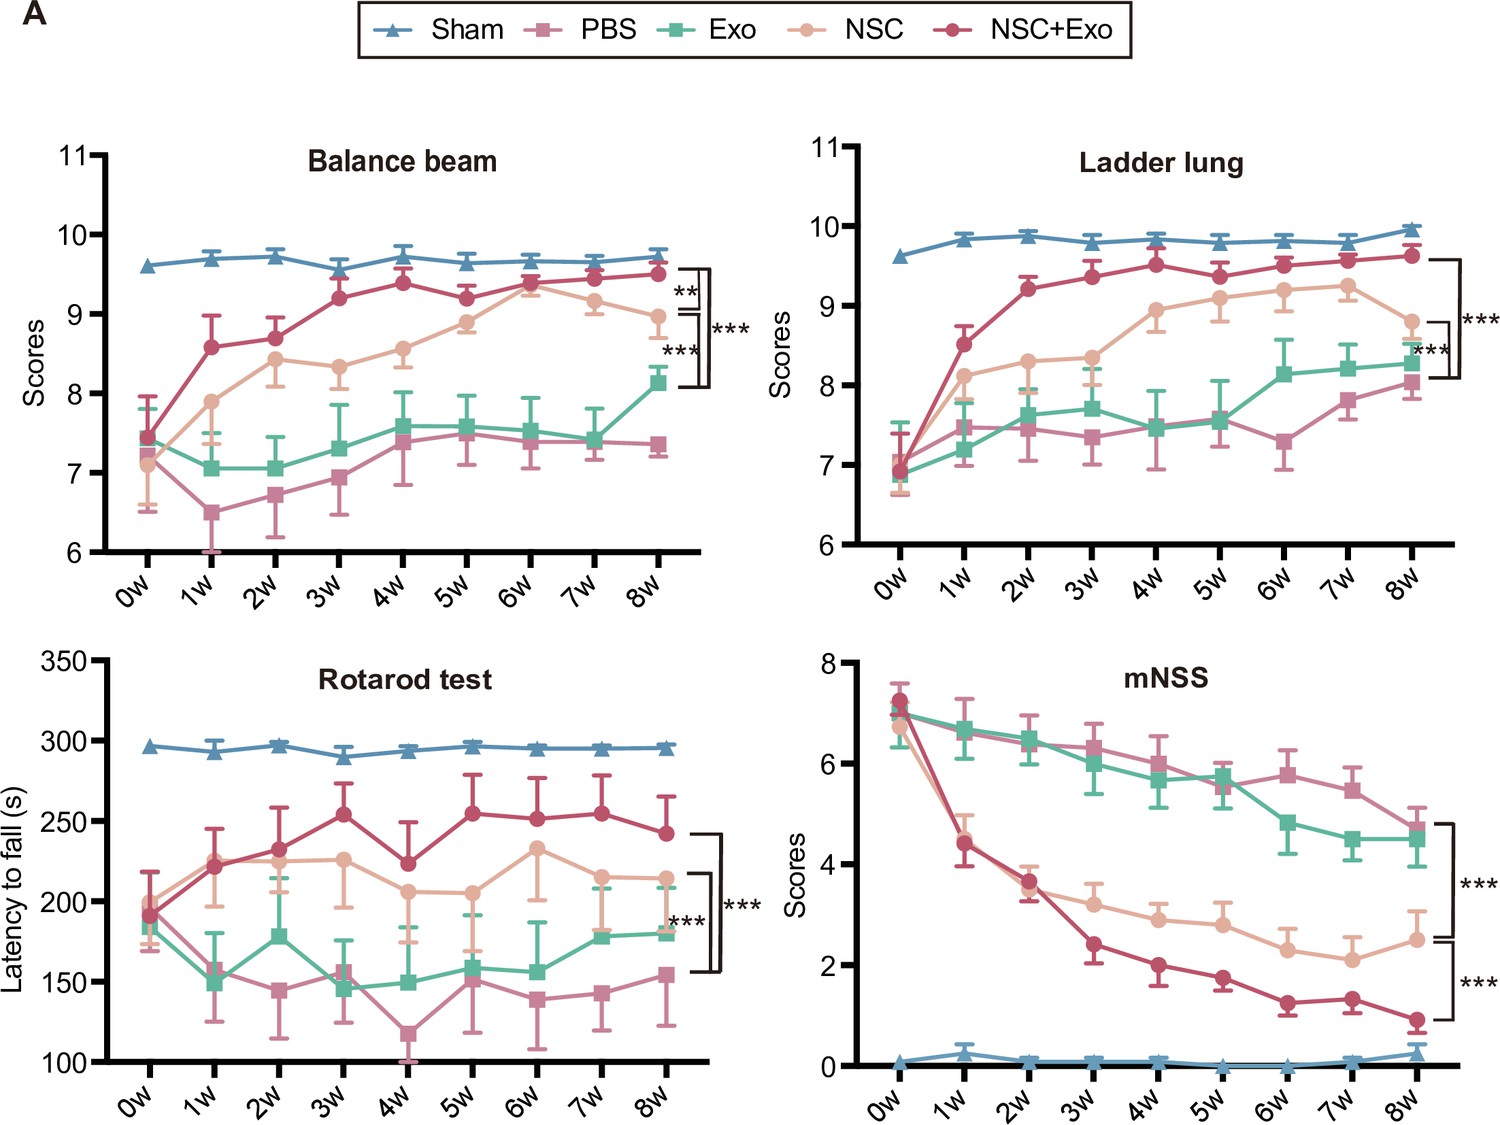
Effects of different treatment strategies of neural stem cells (NSCs) and exosomes on ischemic stroke in middle cerebral artery occlusion/reperfusion (MCAO/R) mice.
(A) Behavioral test results (the balance beam, ladder rung, rotarod tests) and modified neurological severity score (mNSS) up to 8 weeks after treatment, n = 10 mice per group. **p < 0.01, ***p < 0.001.
-
Figure 1—figure supplement 2—source data 1
Effects of different treatment strategies of neural stem cells (NSCs) and exosomes on ischemic stroke in middle cerebral artery occlusion/reperfusion (MCAO/R) mice.
- https://cdn.elifesciences.org/articles/84493/elife-84493-fig1-figsupp2-data1-v1.zip
Figure 2 with 1 supplement
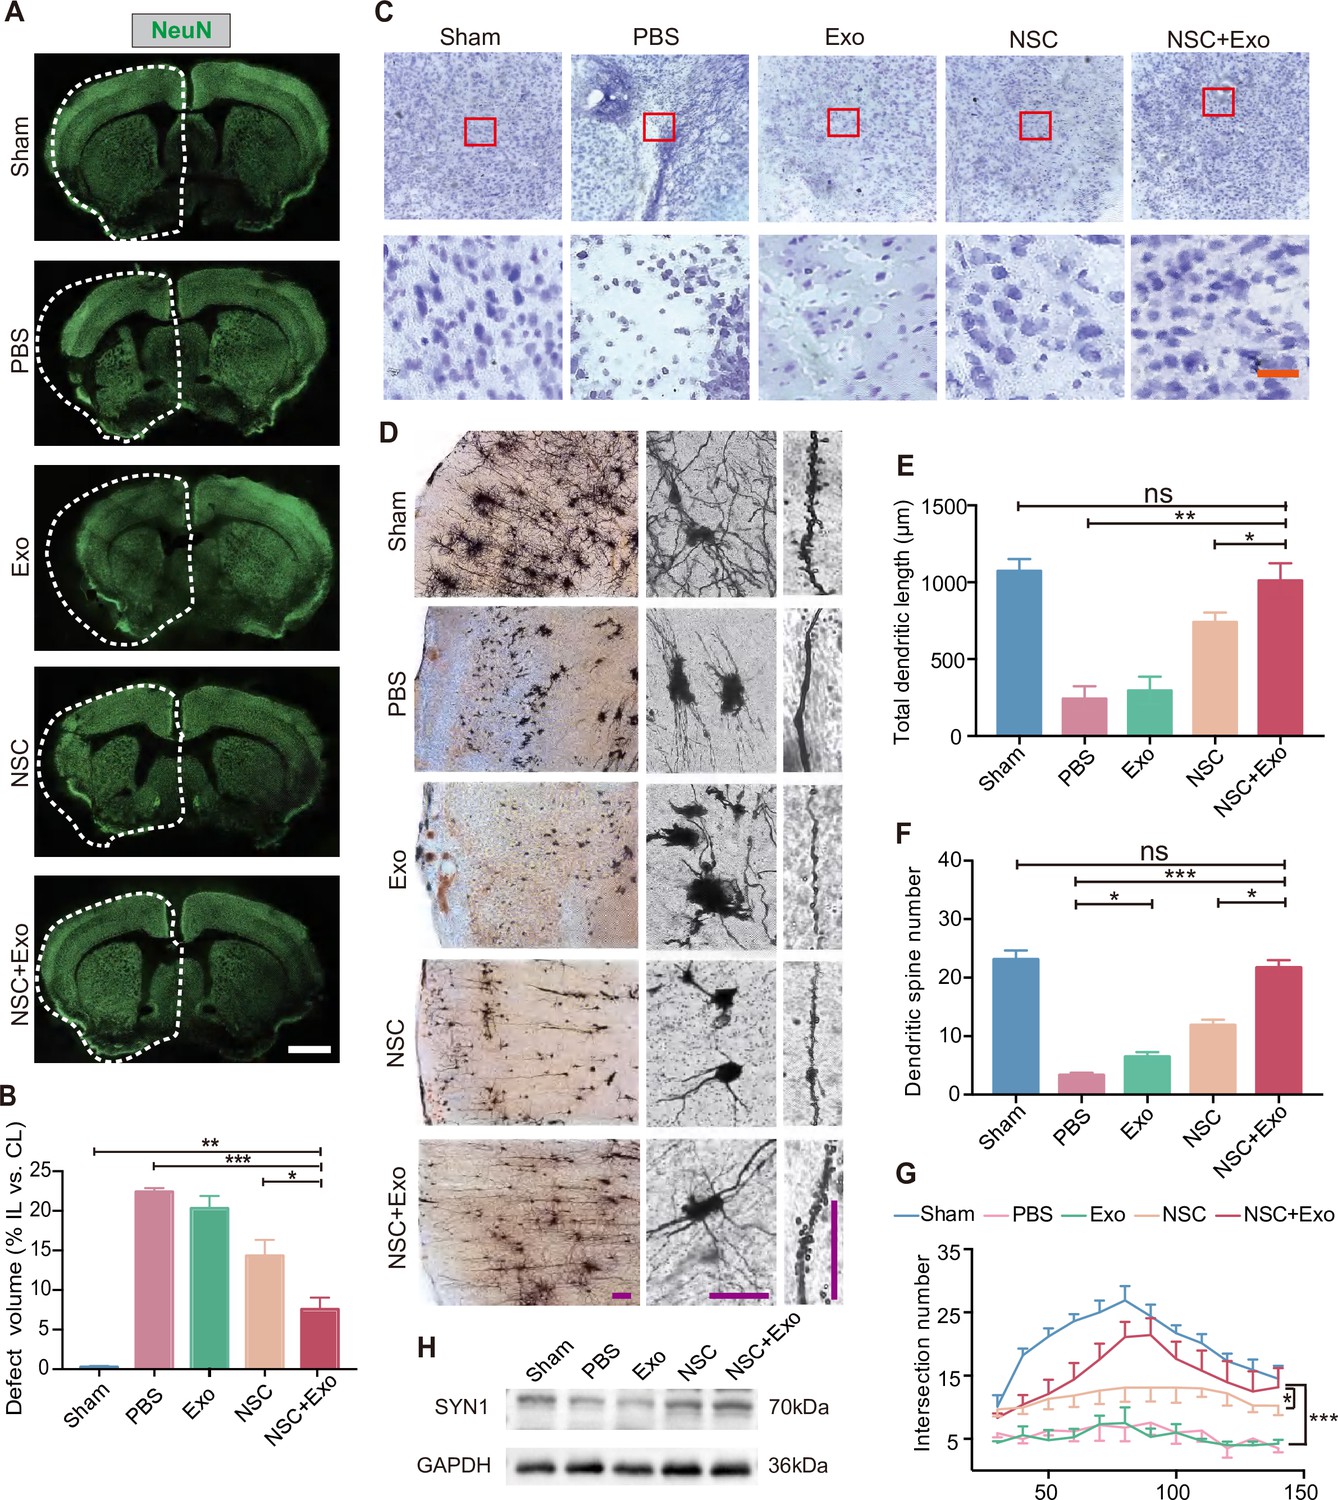
Effects of combined treatment with neural stem cells (NSCs) and exosomes on neuronal damage in middle cerebral artery occlusion/reperfusion (MCAO/R) mice.
(A) Immunofluorescent staining of NeuN in different groups at 8 weeks after treatment. The ipsilateral hemispheres are marked by the dotted lines. Scale bar: 2 mm. (B) Quantification of defect volume of NeuN staining, n = 4 mice per group. (C) Nissl staining of infarct area in the brain at 8 weeks after treatment. Scale bar: 25 μm. (D) Representative images of Golgi-Cox staining in the infarct area at 8 weeks after treatment. Quantitative analysis of total dendritic length (E), dendritic spine number (F), and neuronal complexity (G). Scale bar: 100 μm. Fifteen neurons from three mice were analyzed for each group. (H) Western blot results show the expression of SYN1 in the ipsilateral cerebral cortexs from different groups at 8 weeks after treatment, n = 3 per group. *p < 0.05, **p < 0.01, ***p < 0.001. ns indicates non-significant difference.
-
Figure 2—source data 1
Effects of combined treatment with neural stem cells (NSCs) and exosomes on neuronal damage in middle cerebral artery occlusion/reperfusion (MCAO/R) mice.
- https://cdn.elifesciences.org/articles/84493/elife-84493-fig2-data1-v1.zip
Figure 2—figure supplement 1
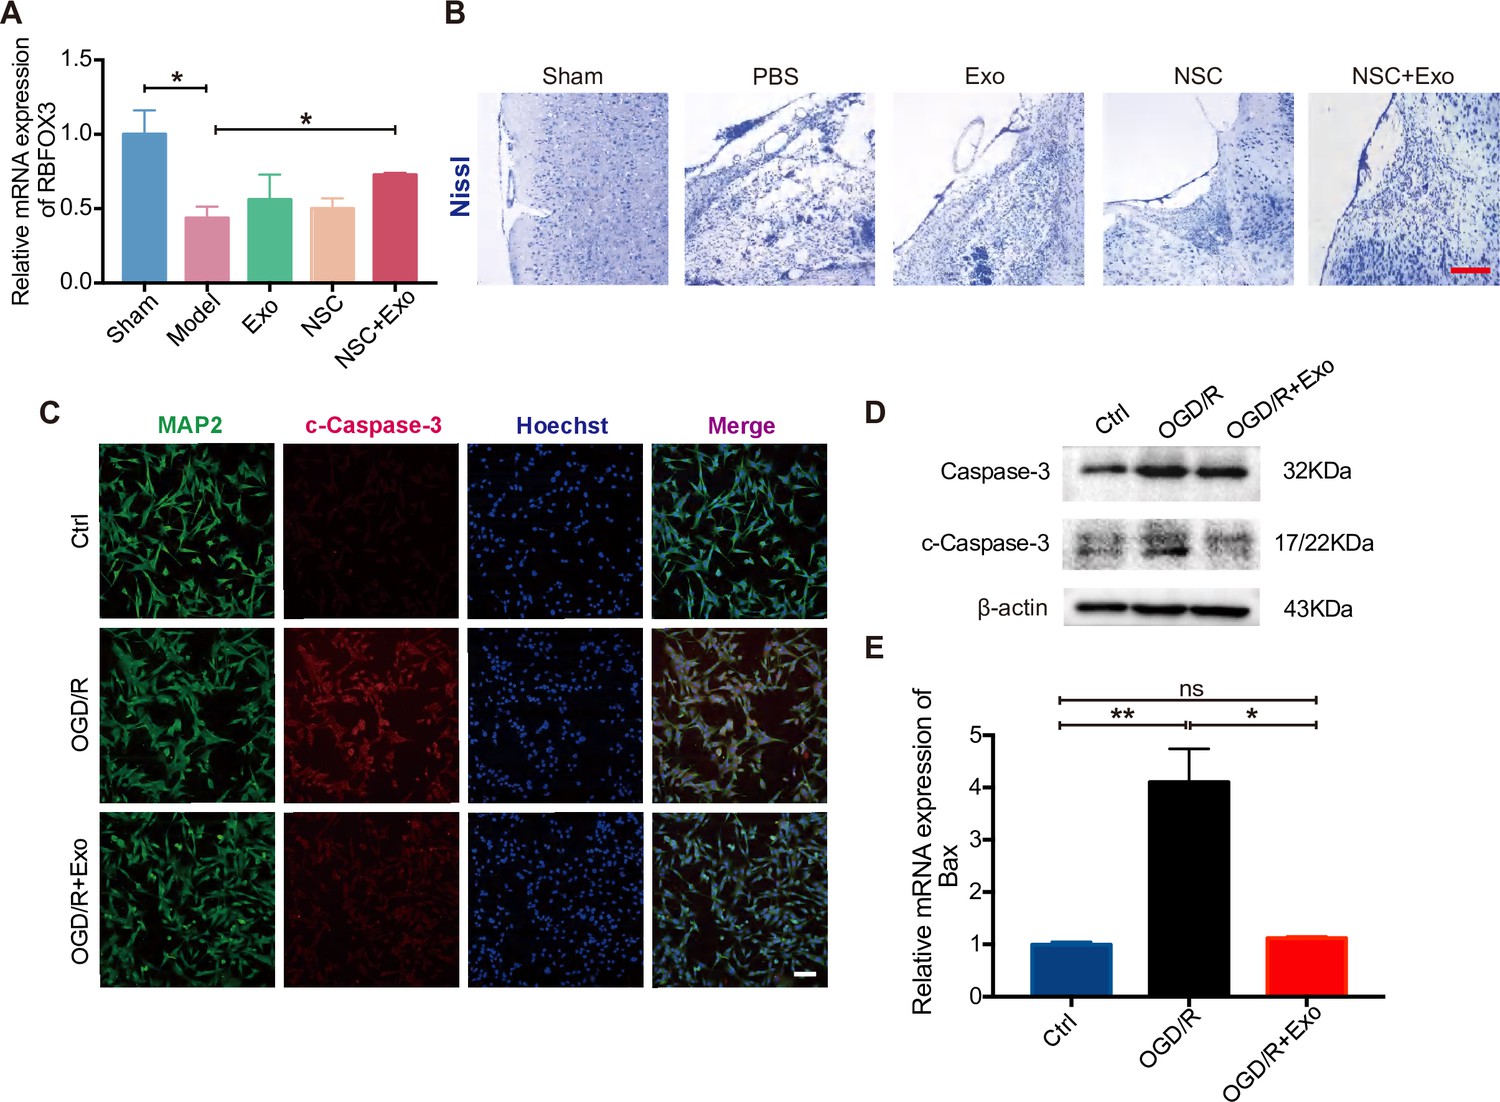
Neural stem cells (NSCs) and exosomes combination treatment reduced the neuronal loss in the ipsilesional hemisphere.
(A) Relative expression of RBFOX3 in the cerebral cortex of infarcted side at 8 weeks after treatment by qRT-PCR, n = 3 per group. (B) Nissl staining of infarct area in the brain at 4 weeks after treatment. Scale bar: 25 μm. (C) Immunofluorescent staining of cleaved Caspase-3 (c-Caspase-3) and MAP2 showing the effects of oxygen and glucose deprivation/reoxygenation (OGD/R) and exosomes on the apoptosis of HT22 cells. Nuclei are counterstained with Hoechst. Scale bar: 50 μm. (D) Western blot results show the expression of Caspase-3 and c-Caspase-3 in different groups. (E) The relative mRNA expression of apoptosis genes Bax. *p < 0.05, **p < 0.01.
-
Figure 2—figure supplement 1—source data 1
Neural stem cell (NSC)-derived exosomes enhance the therapeutic effects of NSCs on neuronal damage.
- https://cdn.elifesciences.org/articles/84493/elife-84493-fig2-figsupp1-data1-v1.zip
Figure 3 with 1 supplement
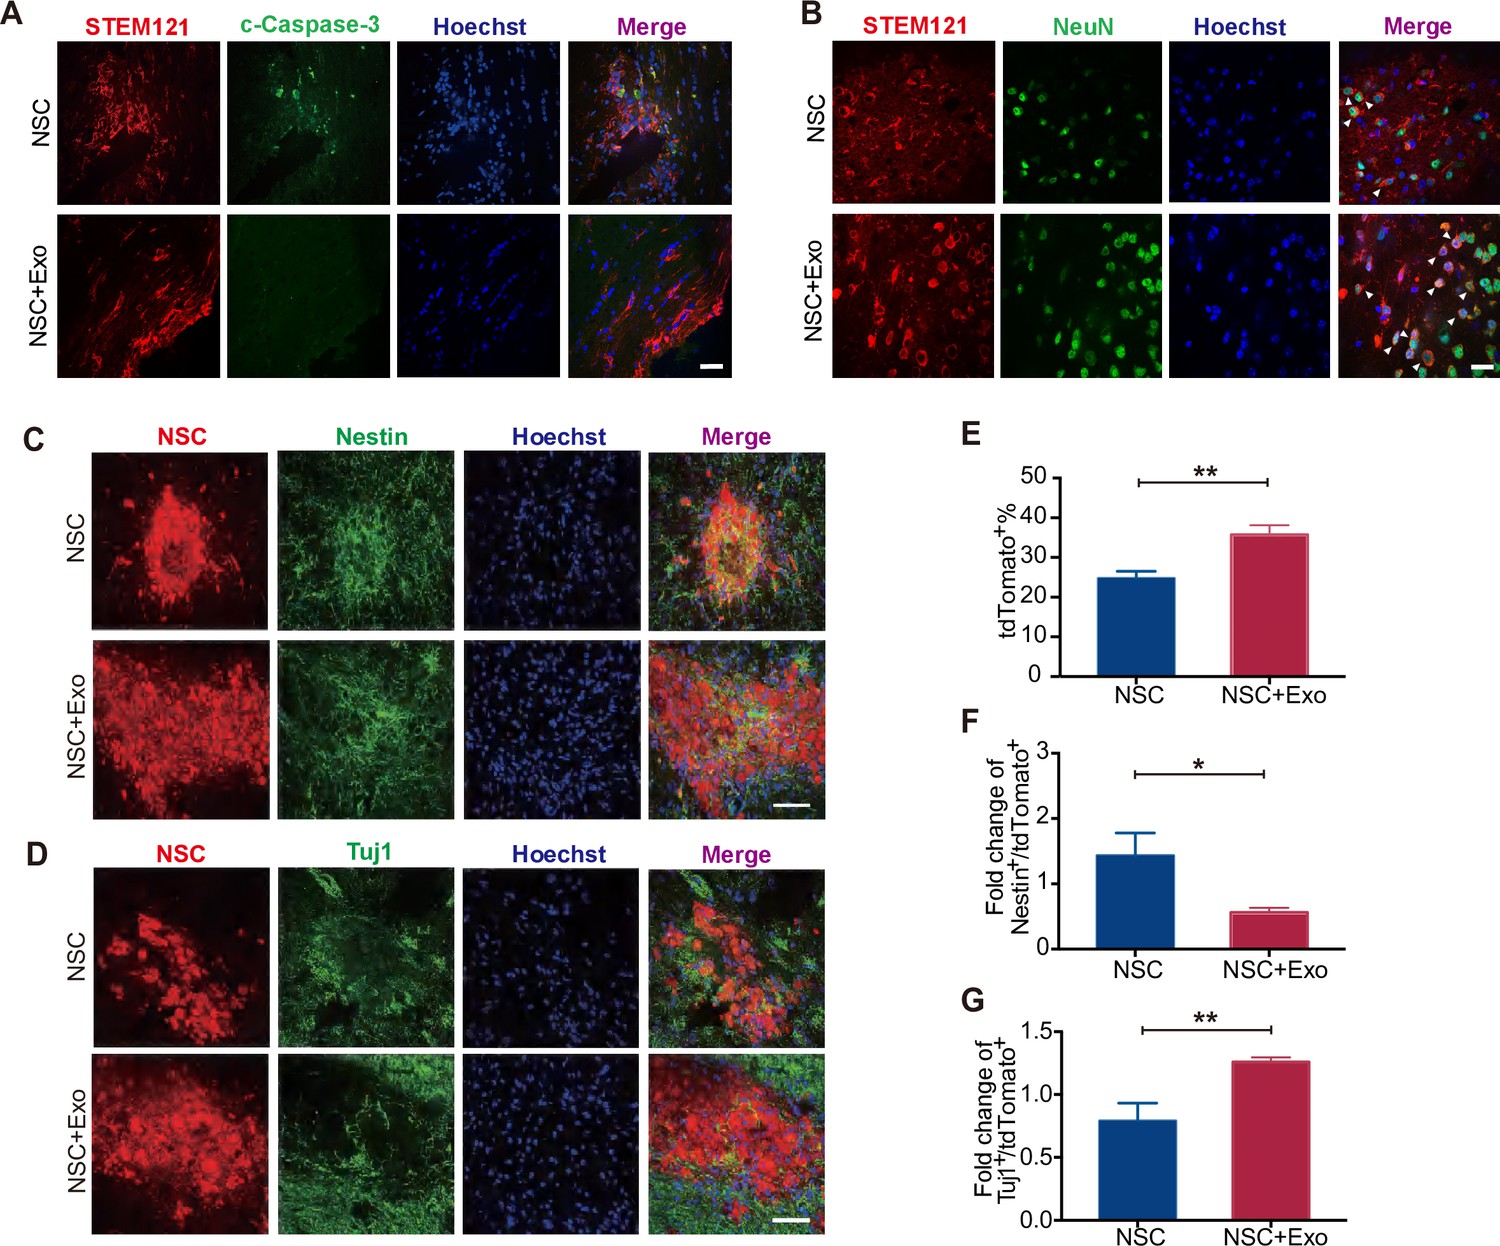
Effects of neural stem cell (NSC)-derived exosomes on the differentiation of transplanted NSCs.
(A) Immunofluorescent staining of STEM121 and cleaved Caspase-3 (c-Caspase-3) at 7 days after transplantation. Scale bar: 20 μm. (B) Immunofluorescent staining of STEM121 and NeuN staining at 4 weeks after transplantation. Scale bar: 10 μm. White arrowhead: STEM121+/NeuN+ cells. (C) Representative images of Nestin staining at 8 weeks after transplantation. (D) Tuj1 staining at 8 weeks after transplantation. Quantification of tdTomato+ cells (E), Nestin+/tdTomato+ cells (F), and Tuj1+/ tdTomato+ cells (G). Scale bar: 50 μm. *p < 0.05, **p < 0.01.
-
Figure 3—source data 1
Neural stem cell (NSC)-derived exosomes promoted the differentiation of transplanted NSCs.
- https://cdn.elifesciences.org/articles/84493/elife-84493-fig3-data1-v1.zip
Figure 3—figure supplement 1

Exosome transplantation reduced the excessive apoptosis cells after middle cerebral artery occlusion/reperfusion (MCAO/R).
(A) Schematic illustration of neural stem cells (NSCs) and exosomes transplantation and the migration of transplanted NSCs. LV: lateral ventricle. (B) TUNEL (green) and NeuN (purple) staining at 7 days after treatment. Scale bar: 50 μm. (C) Immunofluorescent staining of STEM121 at 7 days after transplantation. Scale bar: 20 μm. Nuclei are counterstained with Hoechst. (D) Immunofluorescent staining of STEM121 (red) and postsynaptic density protein-95 (PSD95; green) at 4 weeks after transplantation. Scale bar: 10 μm.
Figure 4 with 1 supplement
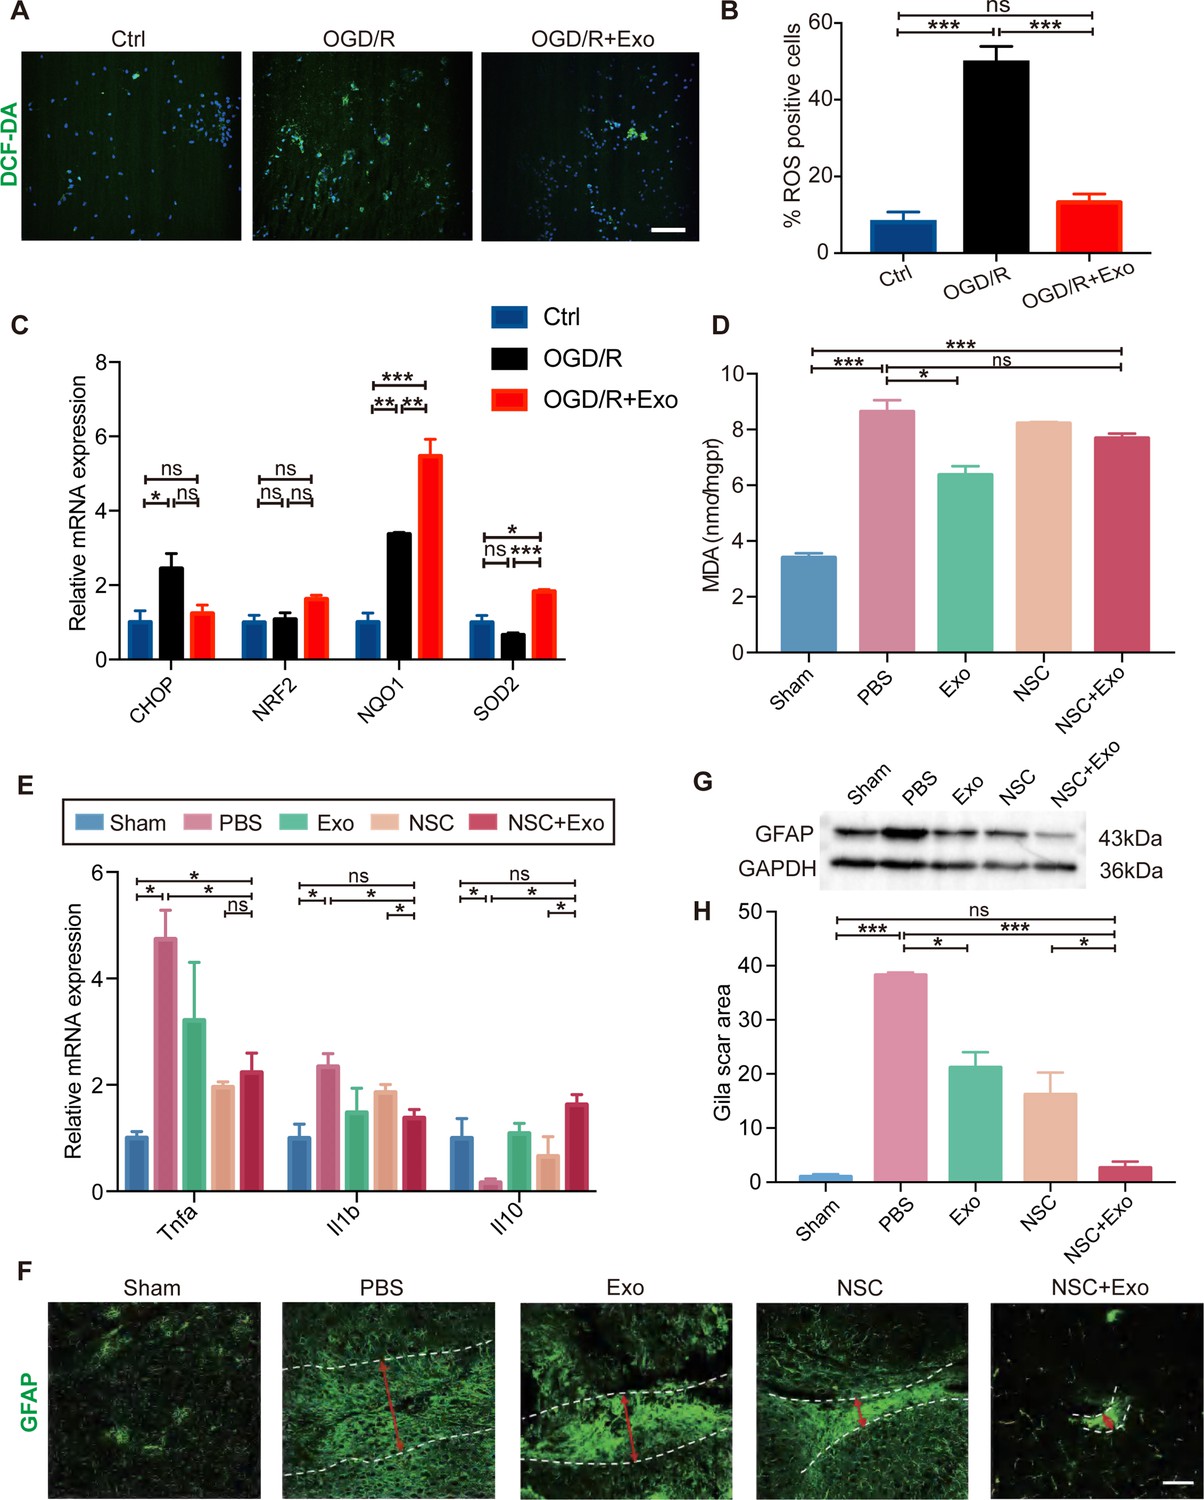
Effects of exosomes on the microenvironment remodeling.
(A) Reactive oxygen species (ROS) generation was evaluated by DCF-DA fluorescent probe labeling (green) in oxygen and glucose deprivation/reoxygenation (OGD/R)-treated neural stem cells (NSCs). Nuclei were counterstained with Hoechst (blue). Scale bar: 50 μm. (B) Percentage of ROS-positive cells. (C) The relative mRNA expression of oxidative stress-related genes CHOP, NRF2, NQO1, and SOD2 were measured by qRT-PCR. (D) The MDA level at 3 days after treatment, n = 3 mice/group. (E) The mRNA expression of Tnfa, Il1b, and Il10 of the ipsilesional brain was measured by qRT-PCR at 3 days after treatment, n = 3 mice/group. (F) Representative images and quantification (H) of scar-forming astrocytes detected by GFAP staining. Scale bar: 50 μm. (G) Western blot results show the expression of GFAP in different groups. *p < 0.05, **p < 0.01, ***p < 0.001. ns indicates non-significant difference.
-
Figure 4—source data 1
Effects of exosomes on the microenvironment remodeling.
- https://cdn.elifesciences.org/articles/84493/elife-84493-fig4-data1-v1.zip
Figure 4—figure supplement 1
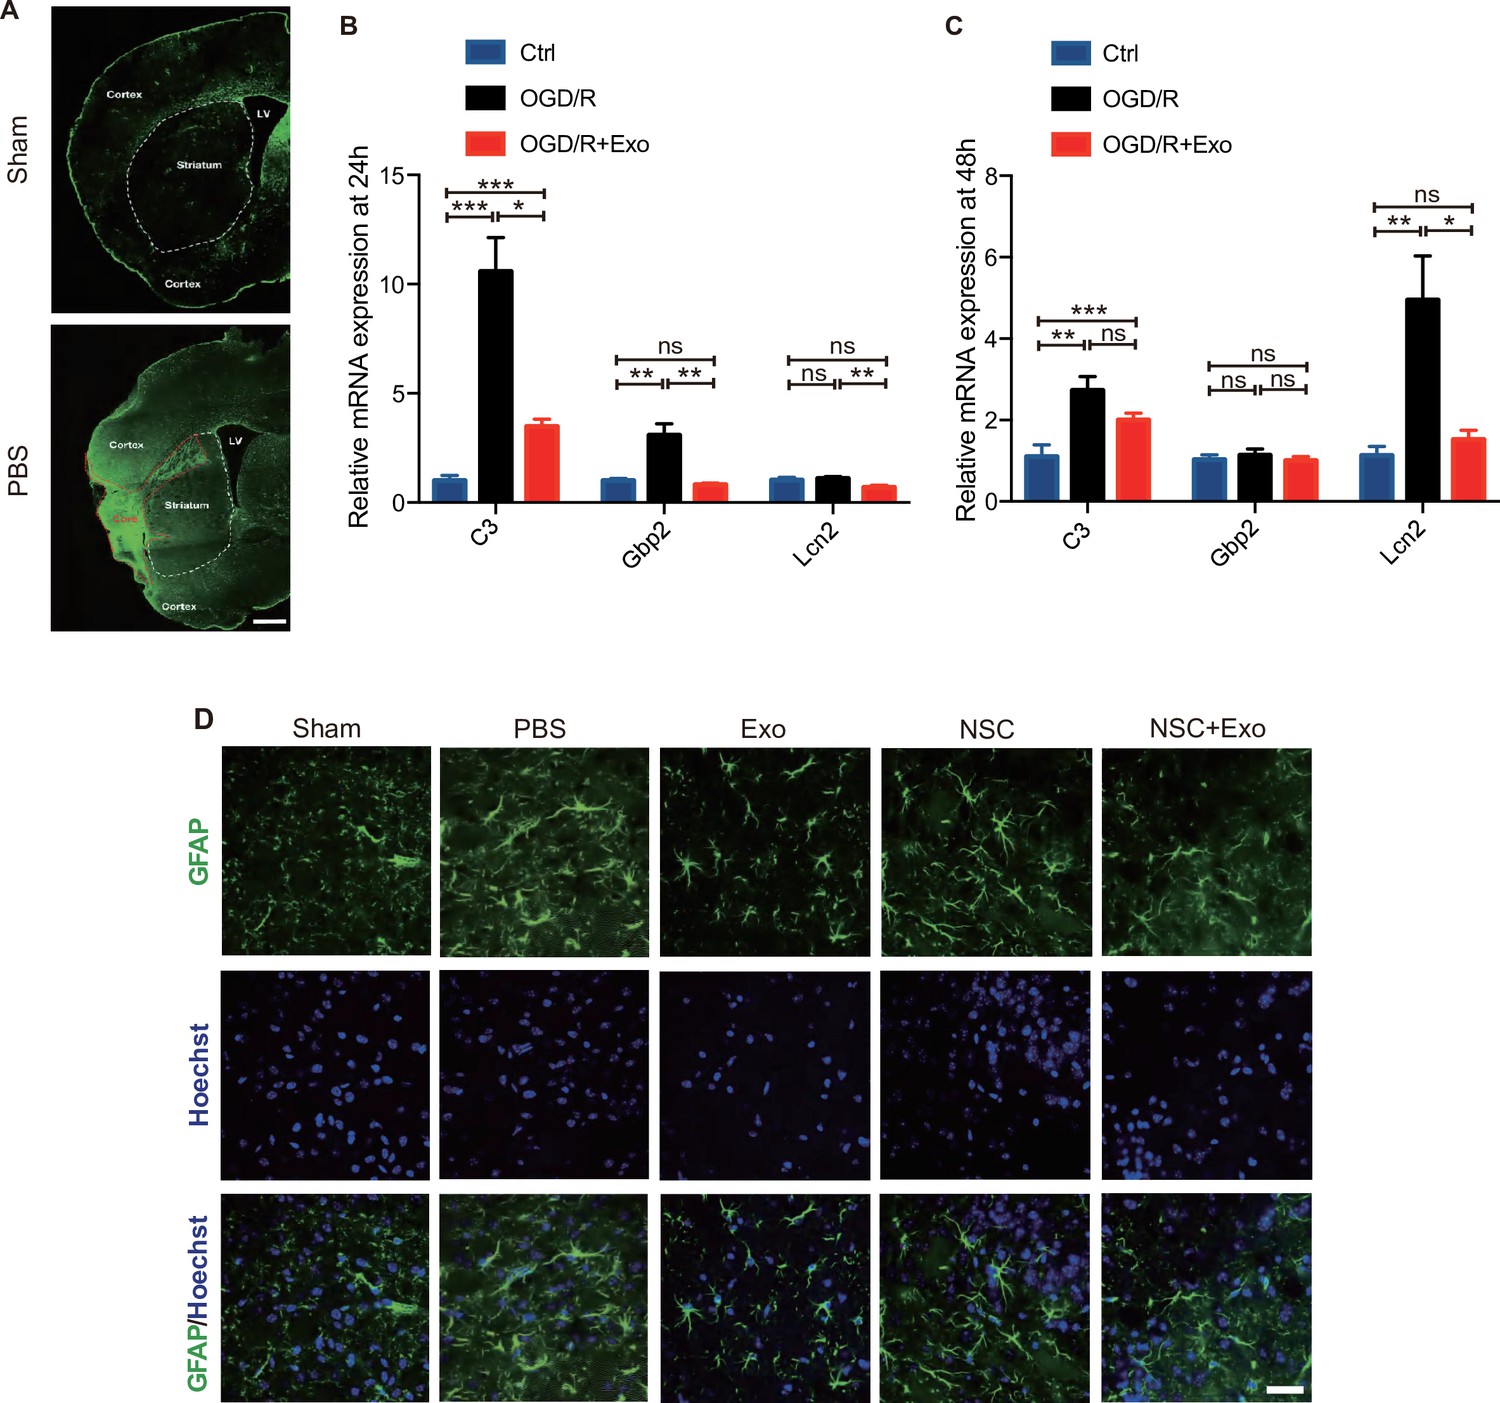
Combined treatment of neural stem cells (NSCs) and exosomes reduced the formation of glial scars in middle cerebral artery occlusion/reperfusion (MCAO/R) mice.
(A) Immunofluorescent staining of GFAP at 8 weeks after treatment. Scale bar: 1 mm. LV represents lateral ventricle, and Core represents infarct area. The mRNA expression of C3, Gbp2, and Lcn2 was measured by qRT-PCR at 24 hr (B) and 48 hr (C) after oxygen and glucose deprivation/reoxygenation (OGD/R) and exosome treatment on primary astrocytes. *p < 0.05, **p < 0.01, ***p < 0.001. (D) Immunofluorescent staining of GFAP at 7 days after treatment. Scale bar: 50 μm.
-
Figure 4—figure supplement 1—source data 1
Combined treatment of neural stem cells (NSCs) and exosomes reduced the formation of glial scars in middle cerebral artery occlusion/reperfusion (MCAO/R) mice.
- https://cdn.elifesciences.org/articles/84493/elife-84493-fig4-figsupp1-data1-v1.zip
Figure 5 with 1 supplement
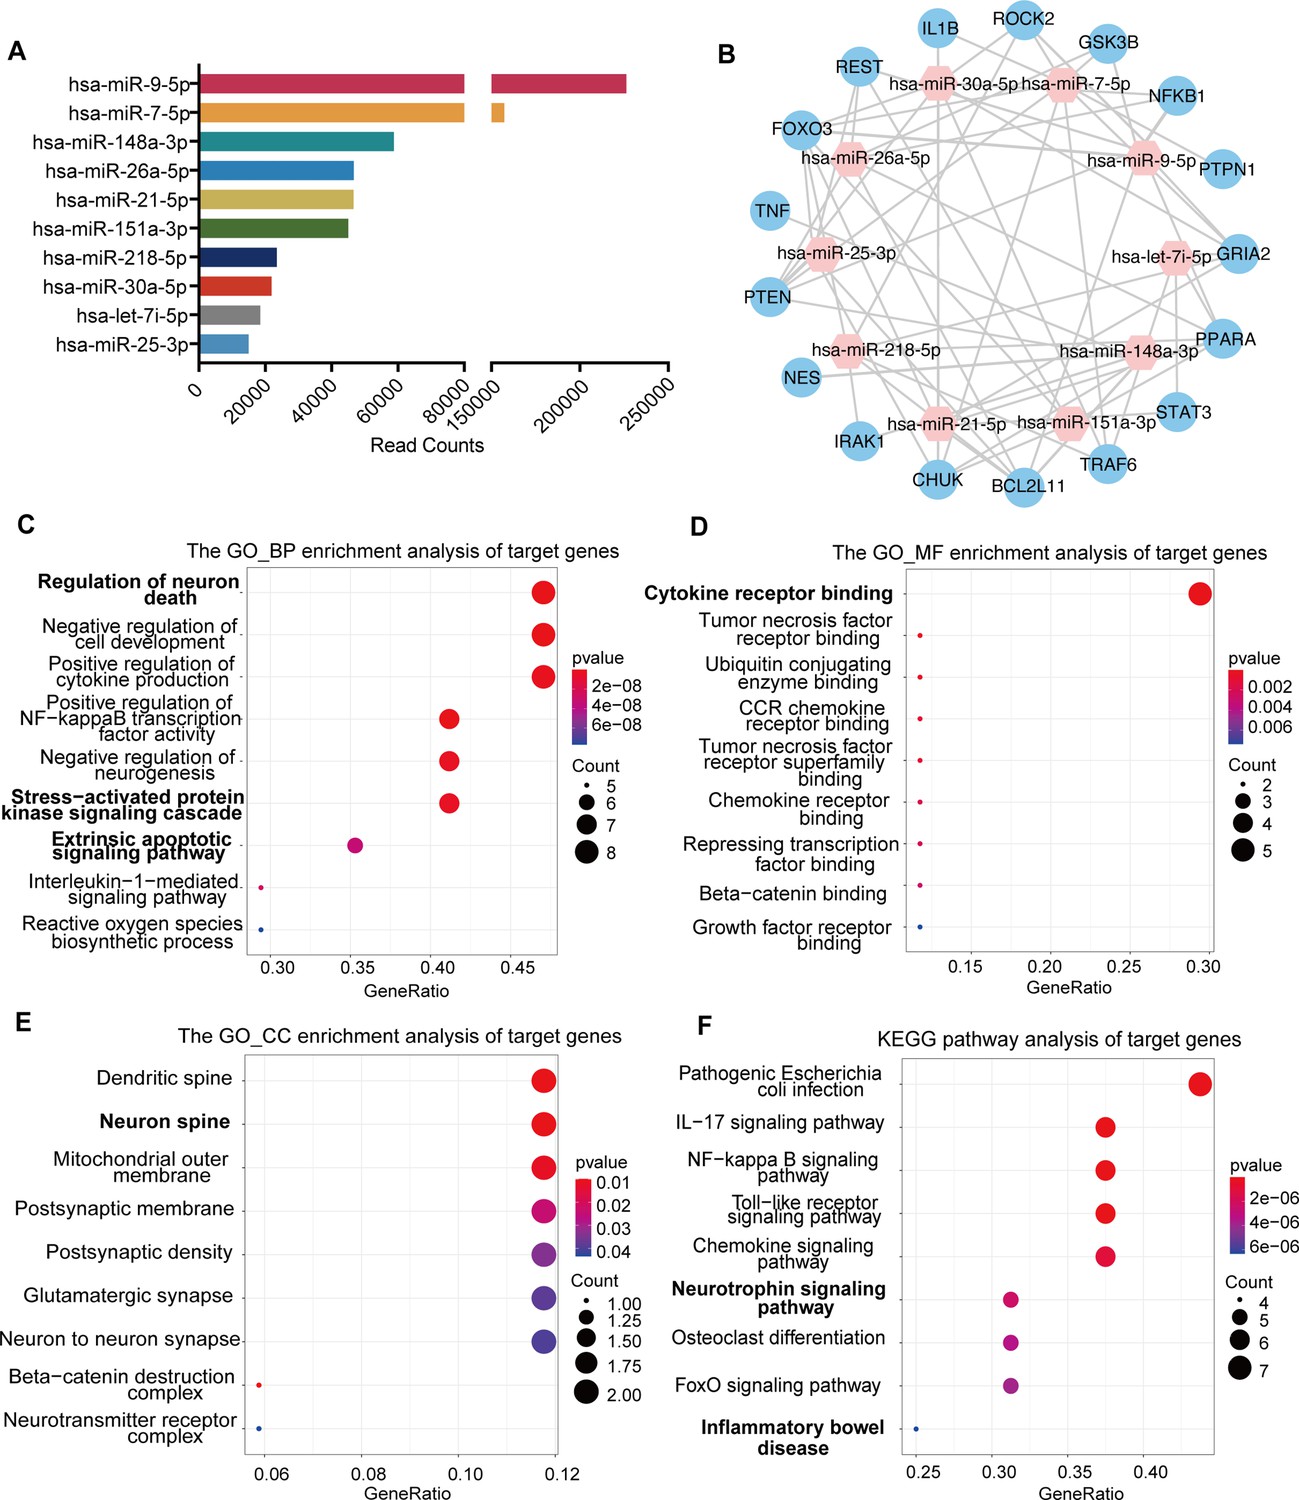
miRNA profiling of neural stem cell (NSC)-derived exosomes and enrichment analysis of predicted target genes.
(A) The read counts of the top 10 abundant miRNAs in NSC-derived exosomes. (B) miRNA–mRNA regulatory networks. miRNA and mRNA are represented by the pink and blue circles, respectively. Gene ontology analysis of predicted target genes in terms of biological process (C), molecular function (D), and cellular component (E). (F) The KEGG pathway analysis of predicted target genes.
-
Figure 5—source code 1
Analysis of miRNA profiling of neural stem cell (NSC)-derived exosomes.
- https://cdn.elifesciences.org/articles/84493/elife-84493-fig5-code1-v1.zip
-
Figure 5—source code 2
Gene ontology (GO) analysis of predicted target genes.
- https://cdn.elifesciences.org/articles/84493/elife-84493-fig5-code2-v1.zip
Figure 5—figure supplement 1
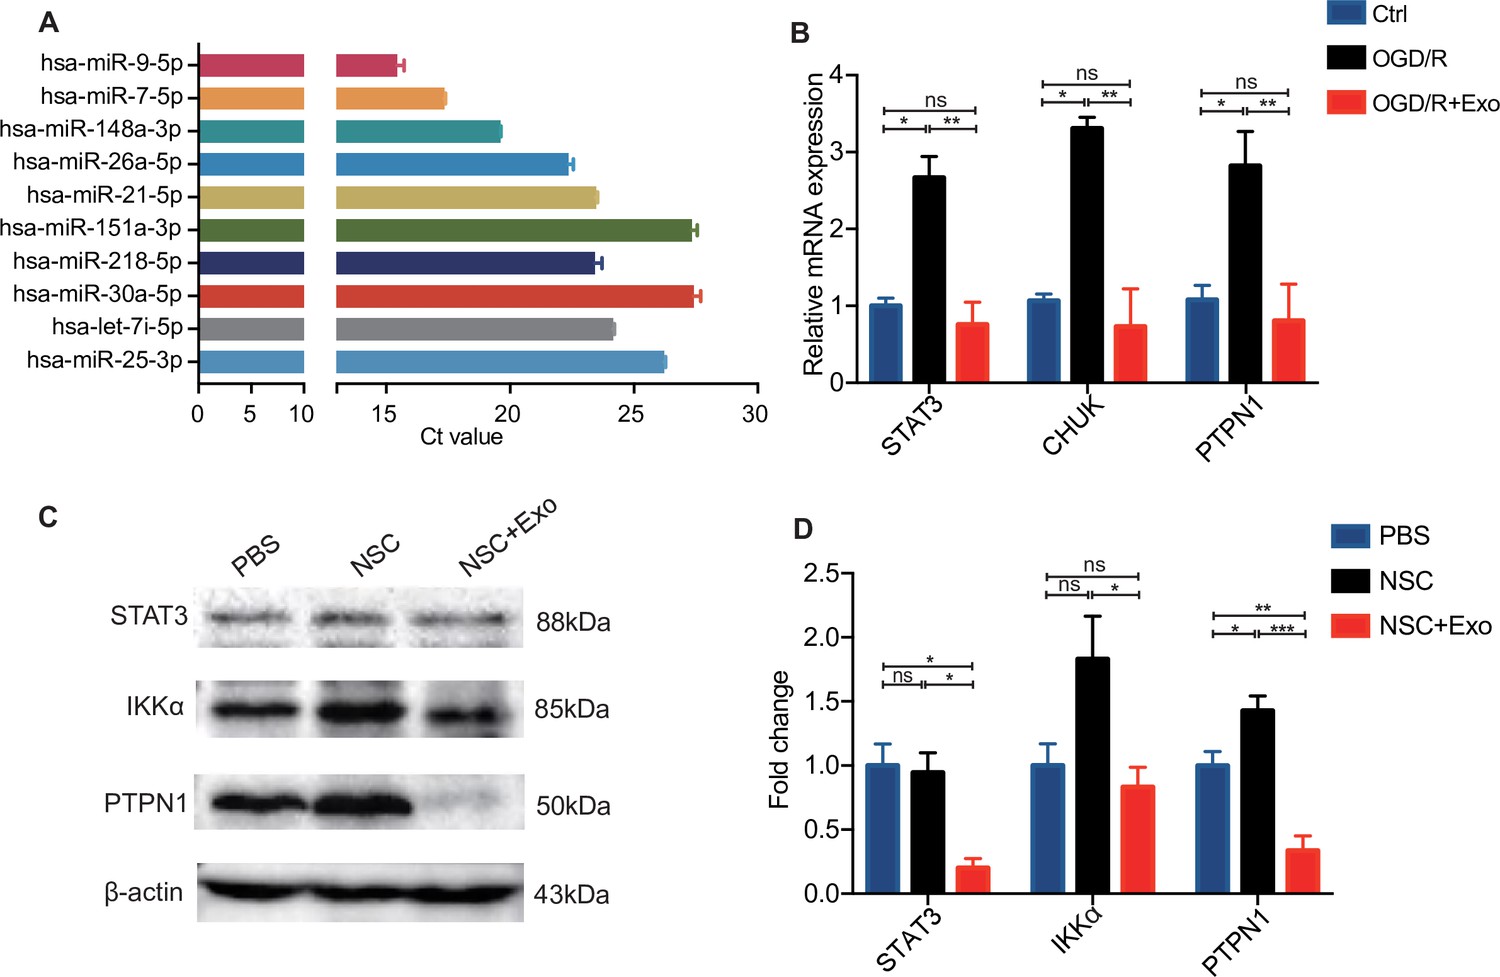
Verification of top 10 abundant miRNAs and the expression of the selected target genes after oxygen and glucose deprivation/reoxygenation (OGD/R).
(A) Cycle threshold (Ct) value of each top 10 abundant miRNAs detected by qPCR. (B) The relative mRNA expression level of STAT3, CHUK, and PTPN1 after OGD/R treatment in neural stem cells (NSCs). (C) Western blot results and (D) quantification of the expression of STAT3, IKKα, and PTPN1 in cerebral cortex tissues at 3 days after treatment. *p < 0.05, **p < 0.01, ***p < 0.001. ns indicates non-significant difference.
-
Figure 5—figure supplement 1—source data 1
Verification of top 10 abundant miRNAs and the expression of the selected target genes after oxygen and glucose deprivation/reoxygenation (OGD/R).
- https://cdn.elifesciences.org/articles/84493/elife-84493-fig5-figsupp1-data1-v1.zip
Figure 6
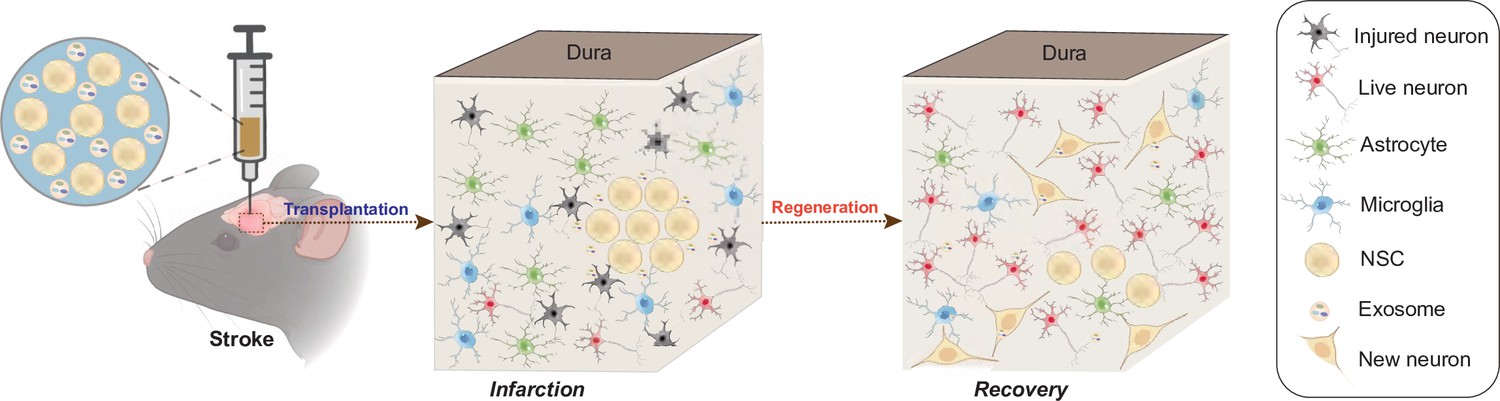
Schematic illustration of the mechanisms for combination treatment of neural stem cells (NSCs) and exosomes in neuroprotection against ischemic stroke.
NSCs and exosomes achieve therapeutic goals by repairing damaged neurons, alleviating the inflammatory environment and reducing glial cell activation.
Tables
Key resources table
| Reagent type (species) or resource | Designation | Source or reference | Identifiers | Additional information |
|---|---|---|---|---|
| Cell line (Homo sapiens) | iPSCs | Cai et al., 2021 | N/A | iPSCs |
| Commercial assay or kit | BCA assay | Biosharp | BL521A | |
| Chemical compound, drug | BSA | Sigma | N/A | |
| Chemical compound, drug | TTC | Solarbio | T8170 | |
| Antibody | Anti-Sox2 (Rabbit Polyclonal) | GeneTex | Cat. No. 43019 | 1:500 |
| Antibody | Anti-E-Cadherin (Mouse Monoclonal) | Proteintech | Cat. No. 60335 | 1:200 |
| Antibody | Anti-Pax6 (Rabbit Polyclonal) | Proteintech | Cat. No. 12323 | 1:200 |
| Antibody | Anti-Ki67 (Mouse Monoclonal) | Cell Signaling Technology | Cat. No. 9449 | 1:1000 |
| Antibody | Anti-NeuN (Rabbit Polyclonal) | Abcam | Cat. No. ab177487 | 1:300 |
| Antibody | Anti-MAP2 (Mouse Monoclonal) | Proteintech | Cat. No. 67015 | 1:500 |
| Antibody | STEM121 (Mouse Monoclonal) | Takara | Cat. No. Y40410 | 1:500 |
| Chemical compound, drug | Goat anti-Mouse IgG 568 | Invitrogen | A-10037 | 1:500 |
| Chemical compound, drug | Goat anti- Rabbit IgG 568 | Invitrogen | A-11036 | 1:500 |
| Chemical compound, drug | Goat anti-Mouse IgG 488 | Invitrogen | A-11029 | 1:500 |
| Chemical compound, drug | Goat anti-Rabbit IgG 488 | Invitrogen | A-11034 | 1:500 |
| Chemical compound, drug | Hoechst | Sigma | 94403 | 1:1000 |
| Antibody | Anti-GFAP (Mouse Monoclonal) | Cell Signaling Technology | Cat. No. 3670S | 1:1000 |
| Antibody | Anti-β-III-tubulin (Rabbit Monoclonal) | Cell Signaling Technology | Cat. No. 5568S | 1:300 |
| Antibody | Anti-Nestin (Mouse Monoclonal) | Santa Cruz Biotechnology | Cat. No. Sc-23927 | 1:250 |
| Antibody | Anti-TSG101 (Rabbit Polyclonal) | ABclonal | Cat. No. A1692 | 1:1000 |
| Antibody | Anti-CD9 (Rabbit Monoclonal) | ABclonal | Cat. No. A19027 | 1:2000 |
| Antibody | Anti-CD63 (Rabbit Monoclonal) | ABclonal | Cat. No. A19023 | 1:1000 |
| Antibody | SYN1 (Rabbit Polyclonal) | Proteintech | Cat. No. 20258-1-AP | 1:1000 |
| Antibody | GAPDH (Mouse Monoclonal) | Proteintech | Cat. No. 60004-1-Ig | 1:1000 |
| Antibody | Caspase-3 (Mouse Monoclonal) | Proteintech | Cat. No. 66470-2-Ig | 1:1000 |
| Antibody | c-Caspase-3 (Rabbit Monoclonal) | Abcam | Cat. No. ab214430 | 1:500 |
| Antibody | STAT3 (Rabbit Monoclonal) | Abcam | Cat. No. ab68153 | 1:2000 |
| Antibody | PTPN1 (Rabbit Polyclonal) | Abclonal | Cat. No. A1590 | 1:1000 |
| Antibody | IKKα (Rabbit Monoclonal) | Abclonal | Cat. No. A19694 | 1:1000 |
| Antibody | β-Actin (Mouse Monoclonal) | Abclonal | Cat. No. AC004 | 1:2000 |
| Antibody | PSD95 (Rabbit Polyclonal) | Proteintech | Cat. No. 20665-1-AP | 1:200 |
| Chemical compound, drug | Goat anti-Mouse | Proteintech | Cat No. PR30012 | 1:5000 |
| Chemical compound, drug | Goat anti-Rabbit | Proteintech | Cat No. PR30011 | 1:5000 |
| Commercial assay or kit | ECL Enhanced Kit | Abclonal | RM00021 | |
| Chemical compound, drug | Isoflurane | RWD | R510-22-10 | |
| Chemical compound, drug | RIPA lysis buffer | Biosharp | BL504A | |
| Software, algorithm | Fiji | https://imagej.net/Fiji | N/A | |
| Commercial assay or kit | FD rapid Golgi Stain kit | FD Neuro Technologies | PK401A | |
| Commercial assay or kit | Nissl Stain Solution | Solarbio | G1434 | |
| Chemical compound, drug | DCF-DA | Invitrogen | D399 | 10 μM |
| Chemical compound, drug | 4% paraformaldehyde | Biosharp | BL539A | |
| Chemical compound, drug | Triton X-100 | Biofroxx | Cat. No. 1139 ML100 | |
| Chemical compound, drug | 10% formalin | Coolaber | SL1560 | |
| Chemical compound, drug | OCT compound | SAKURA | Japan | |
| Software, algorithm | Targetscan | http://www.targetscan.org/ | N/A | |
| Commercial assay or kit | Cell death detection kit | Roche | Cat. No. 11684795910 | |
| Commercial assay or kit | TBA method | Nanjing Jiancheng Bioengineering Institute | A003-1 | |
| Software, algorithm | miRcode | http://www.mircode.org/ | N/A | |
| Software, algorithm | miRDB | http://mirdb.org/ | N/A | |
| Software, algorithm | Cytoscape software | Cytoscape software | N/A | |
| Software, algorithm | RStudio | RStudio | N/A | |
| Software, algorithm | GraphPad PRISM | GraphPad Software | Version 9.2.0 |
Table 1
Modified neurological severity score.
| Motor tests | Score |
|---|---|
| Raise mouse by the tail | 3 |
| Flexion of forelimb | 1 |
| Flexion of hindlimb | 1 |
| Head moved more than 10° to vertical axis | 1 |
| Place mouse on the floor (minimum = 0; maximum = 3) | 0–3 |
| Normal walk | 0 |
| Incapacity to walk straight | 1 |
| Circle toward the hemiplegia side | 2 |
| Fall down to the hemiplegia side | 3 |
| Reflexes deficient and aberrant movements | 1 |
| Seizures, myoclonus, or myodystony | 1 |
| Beam balance tests (minimum = 0; maximum = 4) | 4 |
| Maintain in stable posture | 0 |
| Hugs the beam and limb falls down from the beam | 1 |
| Hugs the beam or spins on beam (>40 s) | 2 |
| Attempts to balance on the beam but falls off (>20 s) | 3 |
| Fall off the beam (<20 s) | 4 |
| Maximum points | 10 |
Table 2
Quantitative PCR primer sequence for gene.
| Gene | Forward | Reverse |
|---|---|---|
| mBax | AGACAGGGGCCTTTTTGCTAC | AATTCGCCGGAGACACTCG |
| mGapdh | AGGTCGGTGTGAACGGATTTG | GGGGTCGTTGATGGCAACA |
| mTnfa | CAGGCGGTGCCTATGTCTC | CGATCACCCCGAAGTTCAGTAG |
| mIl1b | GCCCATCCTCTGTGACTCAT | AGCTCATATGGGTCCGACAG |
| mIl10 | CTTACTGACTGGCATGAGGATCA | GCAGCTCTAGGAGCATGTGG |
| mC3 | GAGCGAAGAGACCATCGTACT | TCTTTAGGAAGTCTTGCACAGTG |
| mGbp2 | CTGCACTATGTGACGGAGCTA | CGGAATCGTCTACCCCACTC |
| mLcn2 | GCAGGTGGTACGTTGTGGG | CTCTTGTAGCTCATAGATGGTGC |
| mStat3 | CACCTTGGATTGAGAGTCAAGAC | AGGAATCGGCTATATTGCTGGT |
| mPtpn1 | GTCGGATTAAATTGCACCAGGA | TGATGCGGTTGAGCATGACC |
| mChuk | GGTTTCGGGAACGTCAGTCTG | GCACCATCGCTCTCTGTTTTT |
| hNQO1 | GAAGAGCACTGATCGTACTGGC | GGATACTGAAAGTTCGCAGGG |
| hNRF2 | CCTGTAAGTCCTGGTCATCG | TTTCTACAGGGAATGGGATA |
| hCHOP | GGAAACAGAGTGGTCATTCCC | CTGCTTGAGCCGTTCATTCTC |
| hSOD2 | GCTCCGGTTTTGGGGTATCTG | GCGTTGATGTGAGGTTCCAG |
| hSTAT3 | CAGCAGCTTGACACACGGTA | AAACACCAAAGTGGCATGTGA |
| hPTPN1 | GCAGATCGACAAGTCCGGG | GCCACTCTACATGGGAAGTCAC |
| hCHUK | GGCTTCGGGAACGTCTGTC | TTTGGTACTTAGCTCTAGGCGA |
| hGAPDH | GGAGCGAGATCCCTCCAAAAT | GGCTGTTGTCATACTTCTCATGG |
Table 3
Quantitative PCR primer sequence for miRNA.
| Gene | Forward |
|---|---|
| hsa-miR-9-5p | UCUUUGGUUAUCUAGCUGUAUGA |
| hsa-miR-7-5p | UGGAAGACUAGUGAUUUUGUUGUU |
| hsa-miR-148a-3p | UCAGUGCACUACAGAACUUUGU |
| hsa-miR-26a-5p | UUCAAGUAAUCCAGGAUAGGCU |
| hsa-miR-21-5p | UAGCUUAUCAGACUGAUGUUGA |
| hsa-miR-151a-3p | CUAGACUGAAGCUCCUUGAGG |
| hsa-miR-218-5p | UUGUGCUUGAUCUAACCAUGU |
| hsa-miR-30a-5p | UGUAAACAUCCUCGACUGGAAG |
| hsa-let-7i-5p | UGAGGUAGUAGUUUGUGCUGUU |
| hsa-miR-25-3p | CAUUGCACUUGUCUCGGUCUGA |
Additional files
Download links
A two-part list of links to download the article, or parts of the article, in various formats.
Downloads (link to download the article as PDF)
Open citations (links to open the citations from this article in various online reference manager services)
Cite this article (links to download the citations from this article in formats compatible with various reference manager tools)
NSC-derived exosomes enhance therapeutic effects of NSC transplantation on cerebral ischemia in mice
eLife 12:e84493.
https://doi.org/10.7554/eLife.84493


