Two human brain systems micro-structurally associated with obesity
- Department of Psychiatry, University of Cambridge, United Kingdom
- Institute of Psychiatry, Psychology and Neuroscience, King’s College London, United Kingdom
- Department of Medical Physiology and Biophysics, Instituto deBiomedicina de Sevilla (IBiS) HUVR/CSIC Universidad de Sevilla/CIBERSAM, ISCIII, Spain
- Department of Psychology, University of Cambridge, United States
- Lifespan Brain Institute, The Children’s Hospital of Philadelphia and Penn Medicine, United States
- Department of Child and Adolescent Psychiatry and Behavioral Science,The Children’s Hospital of Philadelphia, United States
- Department of Psychiatry, University of Pennsylvania, United States
- Brain Research Imaging Centre, Cardiff University, United Kingdom
Figures
Figure 1
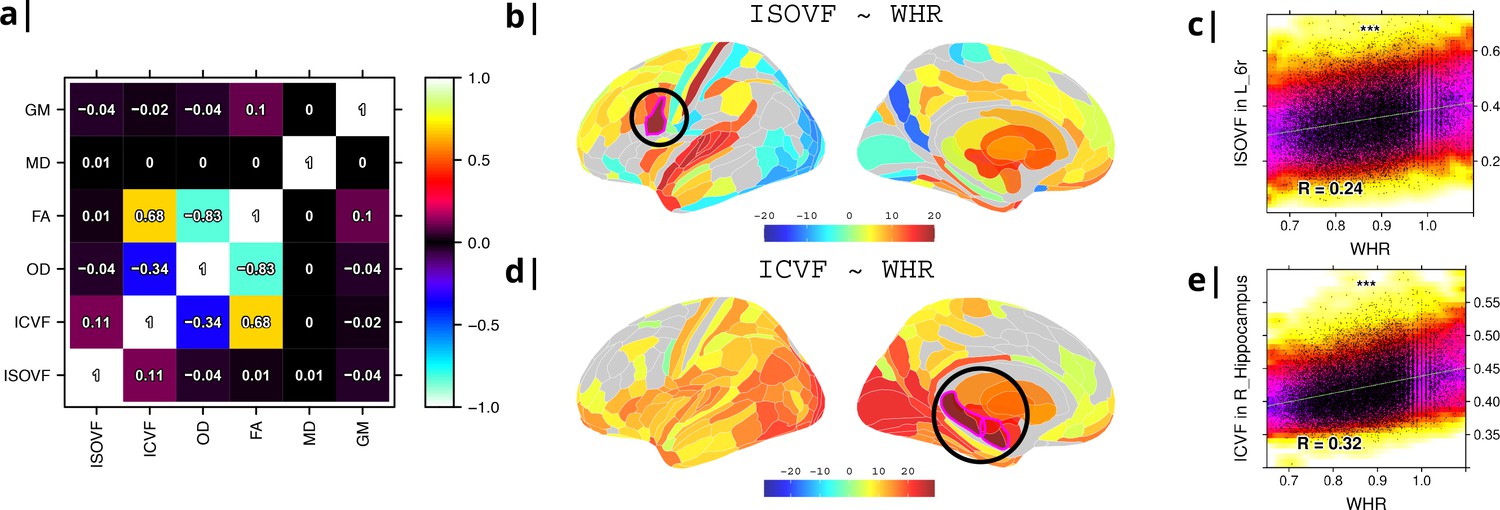
Micro-structural MRI metrics are associated with waist-to-hip ratio (WHR).
(a) Correlation matrix for six macro- and micro/structural MRI metrics demonstrating that ISOVF (free-water) is essentially orthogonal to ICVF (neurite density) and OD, which instead form a cluster with FA. (b) Cortical and subcortical t-score map (left lateral and medial hemispheres) of ISOVF~WHR, representing the association of regional ISOVF with WHR, thresholded for significance at FDR = 5%. Circles indicate regions for which scatterplots are shown on the right. (c) Scatterplot of ISOVF in left inferior premotor region 6 r (y-axis) versus WHR (x-axis). (d) Cortical and subcortical t-score map of ICVF~WHR, thresholded at FDR = 5%. (e) Scatterplot of ICVF in the right hippocampus versus WHR. The maps of ISOVF~WHR and ICVF~WHR were negatively correlated (, ). Colors in (b and d) refer to t-scores, colors in (c and e) denote normalised density. GM = Grey Matter; MD = Mean Diffusivity; FA = Fractional Anisotropy; OD = Orientation Dispersion Index; ISOVF = isotropic volume fraction; ICVF = intra-cellular volume fraction.
Figure 2
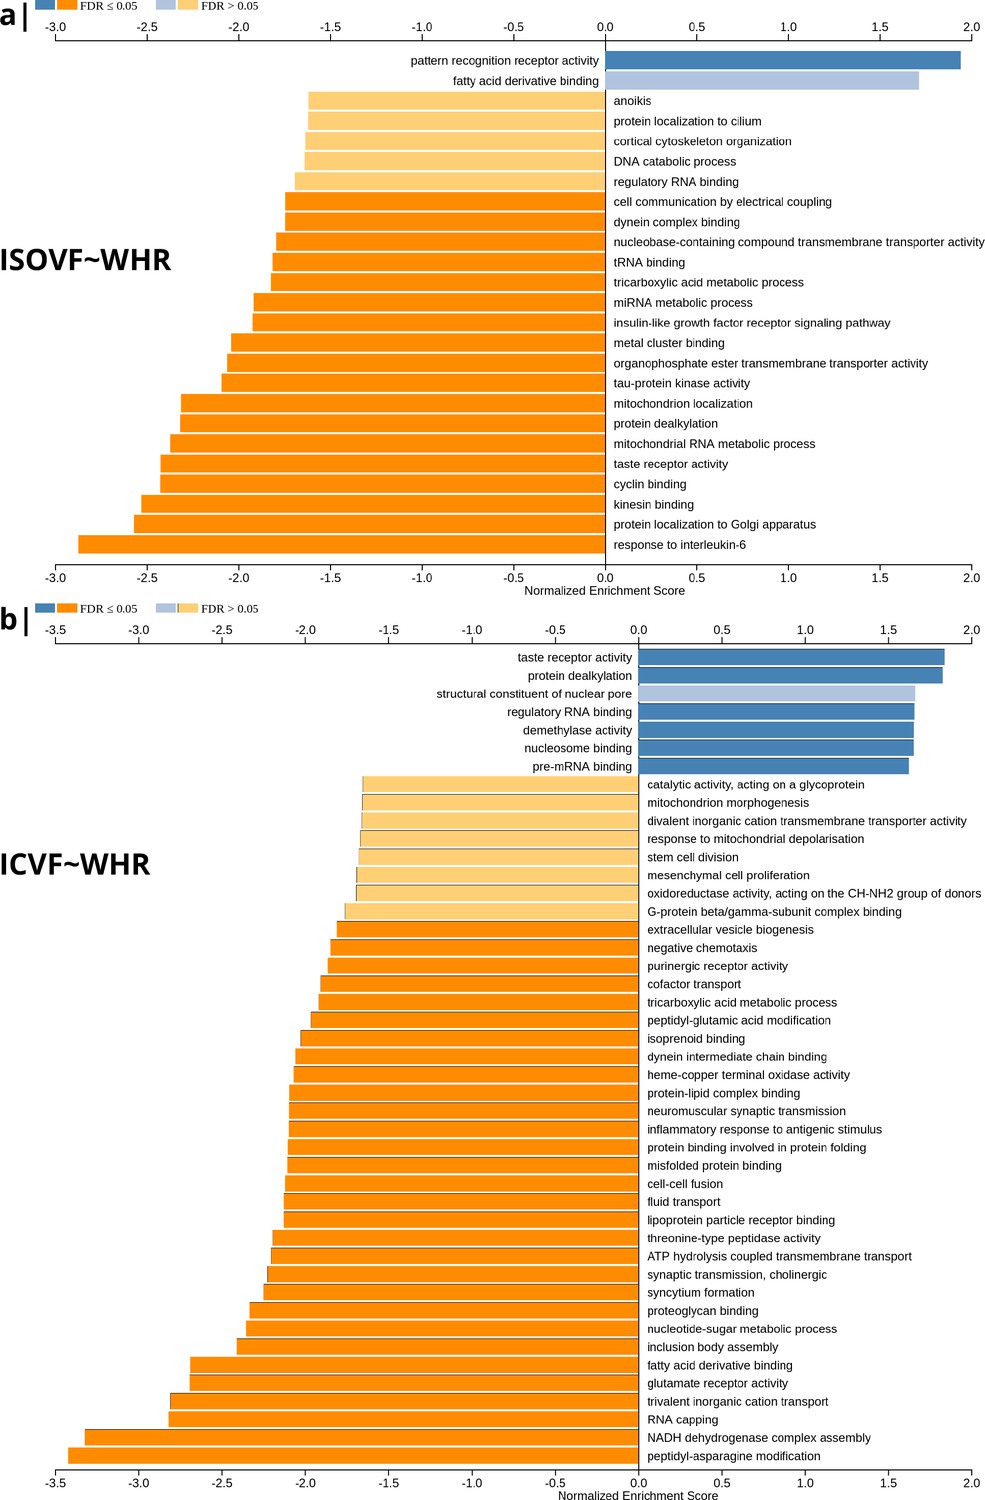
Significantly enriched gene ontology categories according to Webgestalt based on the spatial co-location of the MRI~WHR maps and whole brain expression maps for each of ∼13,500 genes.
(a) Results using the ISOVF~WHR maps (free water vs adiposity). Bar graph of significant gene ontologies showing normalized enrichment score on the x-axis. (b) Results using the ICVF~WHR maps (neurite density vs adiposity). In both cases, p-values for enrichment were tested by permutation taking into account the smoothness of cortical maps (using spin permutation correction; see Appendix 2—figure 6).
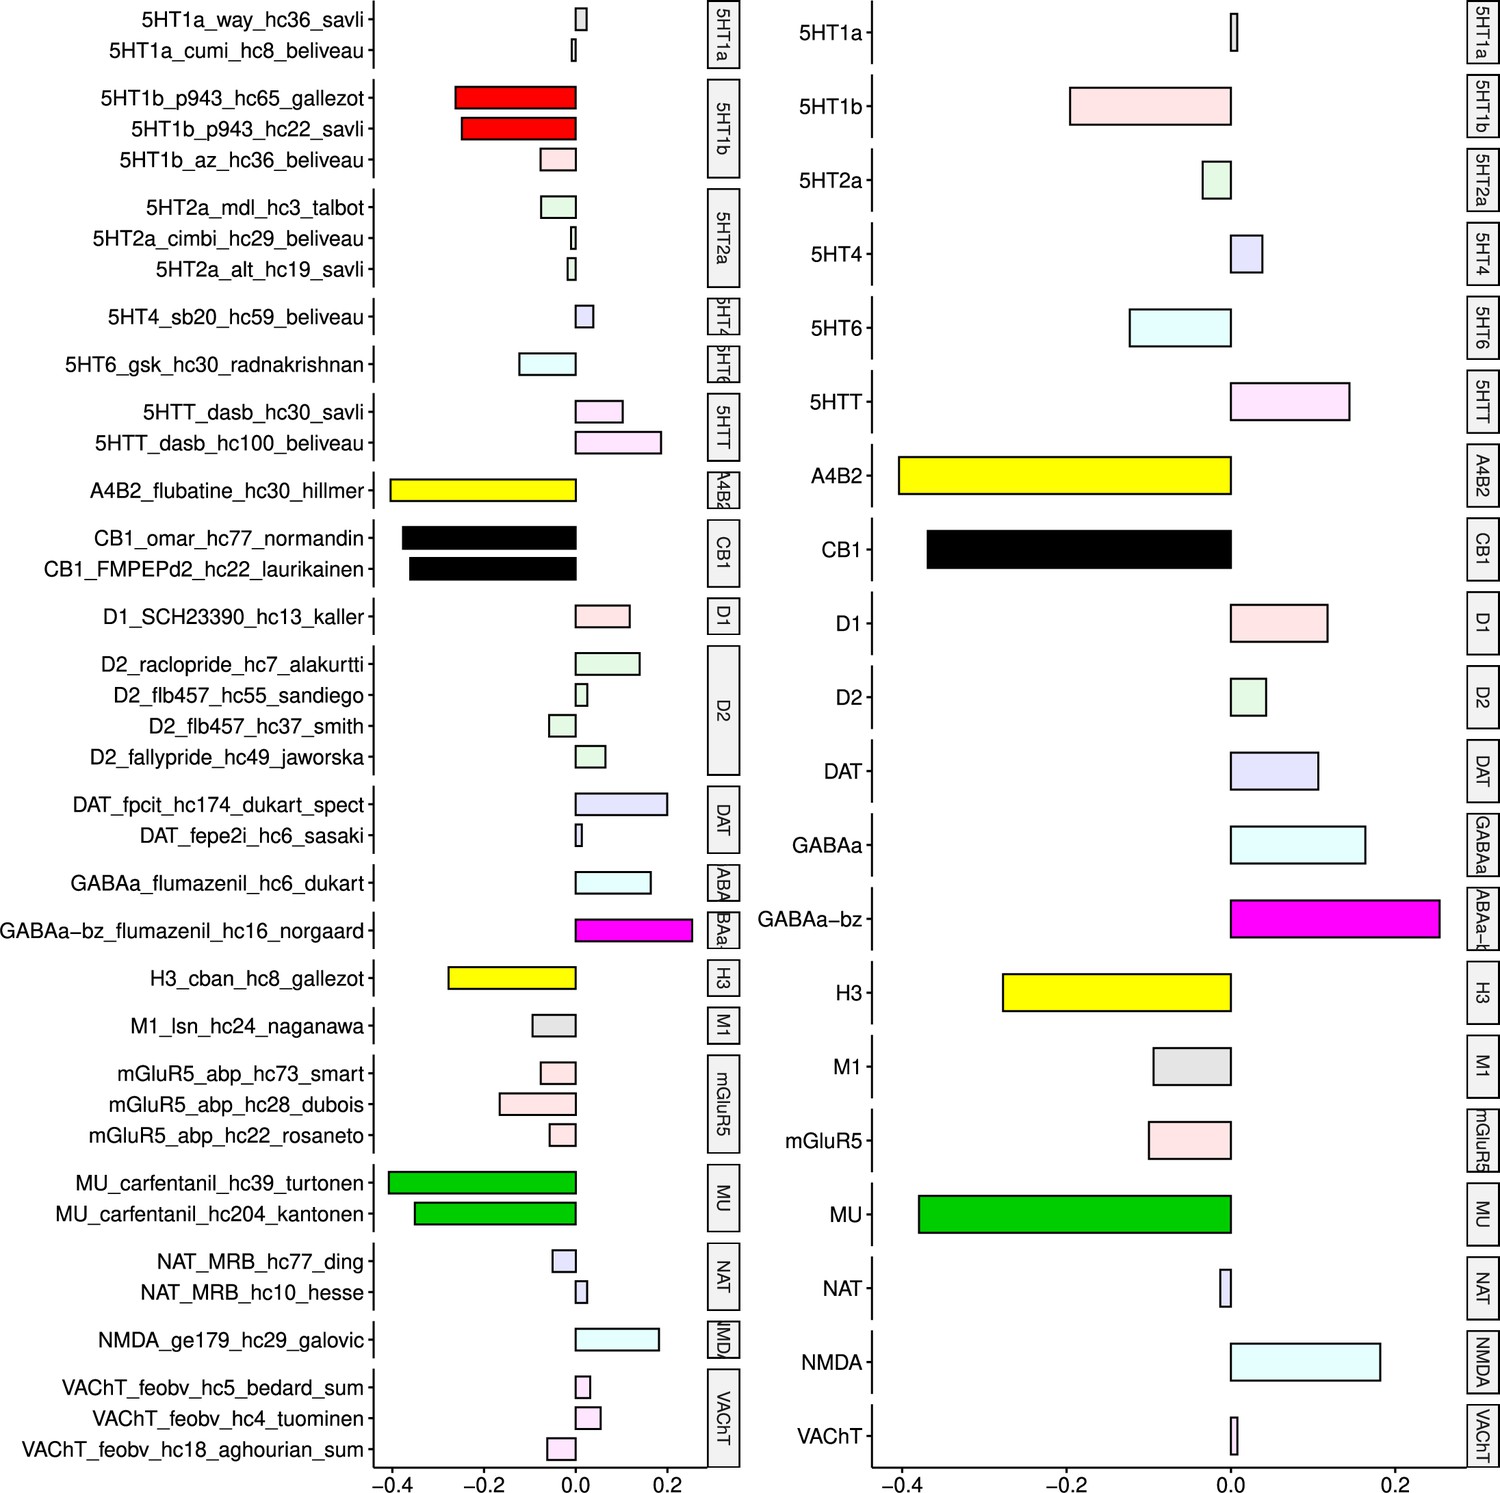
Figure 3
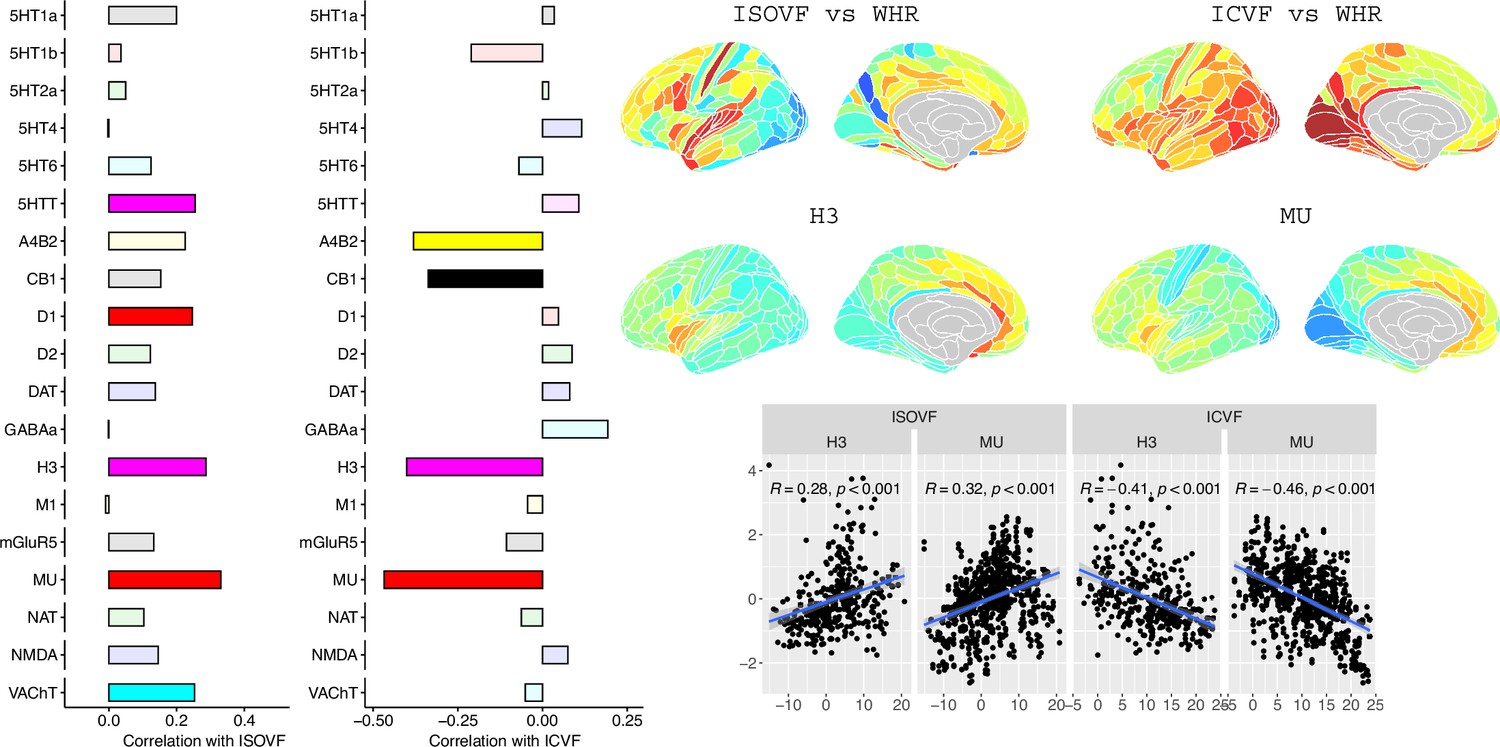
Co-location of neurotransmitter receptor or transporter distributions with obesity-associated micro-structural MRI systems.
Left: Correlations of cortical neurotransmitter maps with the ISOVF~WHR and ICVF~WHR maps shown above (same color scale as in Figure 1). Significance is indicated by shading (based on spin permutation and Bonferroni correction). The Mu and H3 receptors show the maximum (absolute) correlation with the ISOVF and ICVF maps of microstructural effect of obesity (top right). Bottom right: scatter plots of raw data.
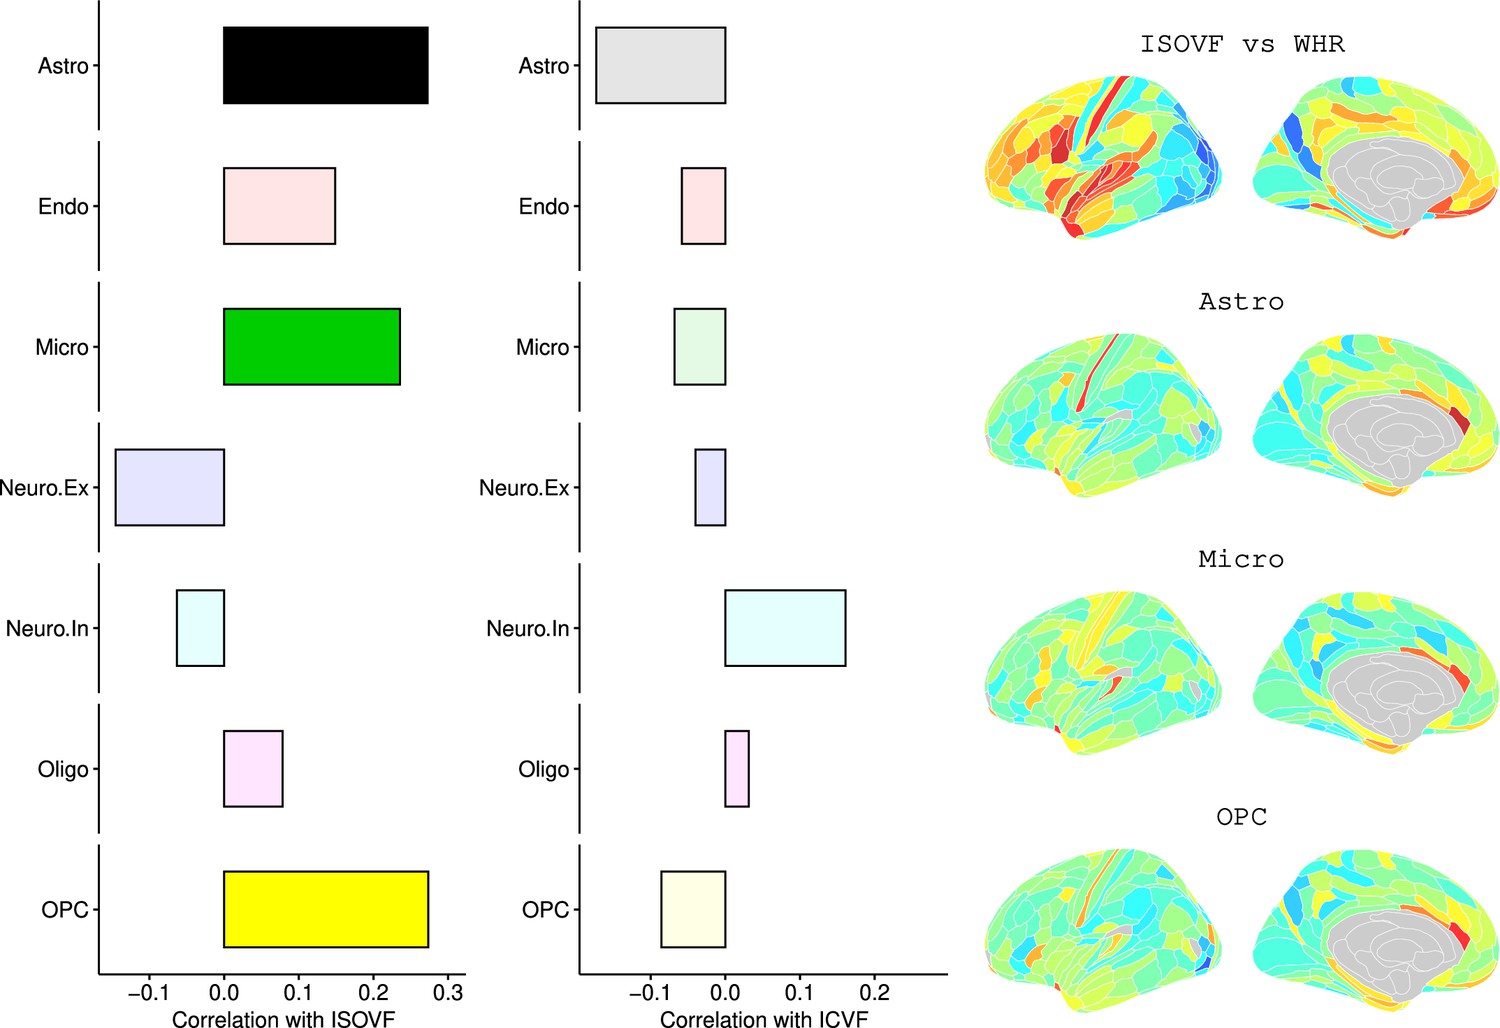
Figure 4
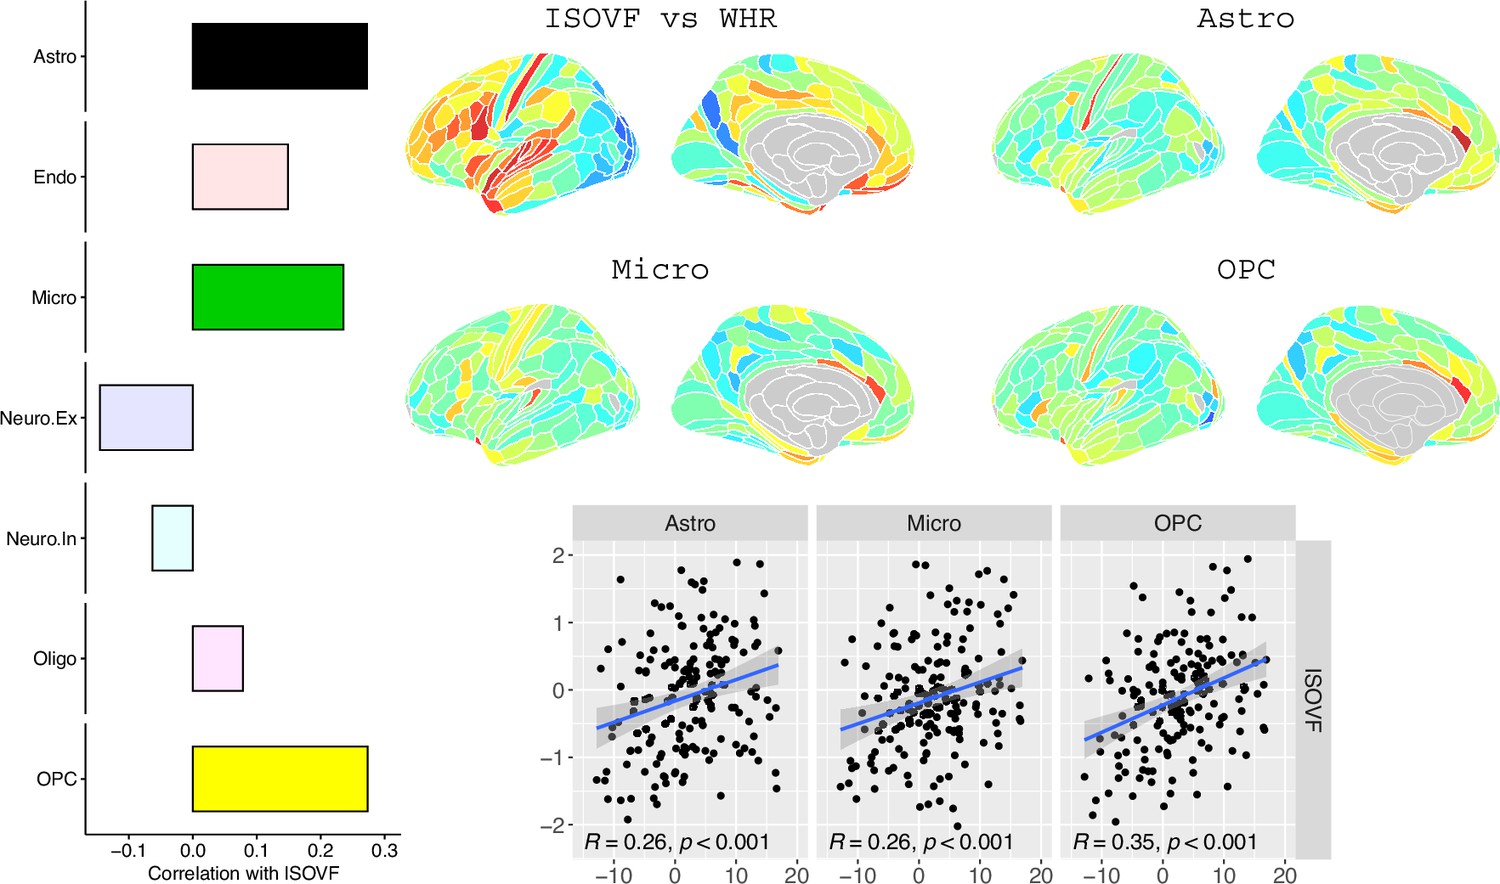
Co-location of brain cell distributions with obesity-associated micro-structural MRI systems.
Left: Correlations of brain cell type maps for seven cell type categories from Lake et al., 2018 with the ISOVF~WHR map shown above (same color scale as in Figure 1). Significance is indicated by shading (based on spin permutation and Bonferroni correction). The astrocytes, microglia, and OPC cell type maps show the maximum (absolute) correlation with the ISOVF~WHR maps (central panel). Right: scatter plots of raw data. (Results for ICVF were not significant for any category and are only shown in the Supplemental Information.).
Appendix 2—figure 1
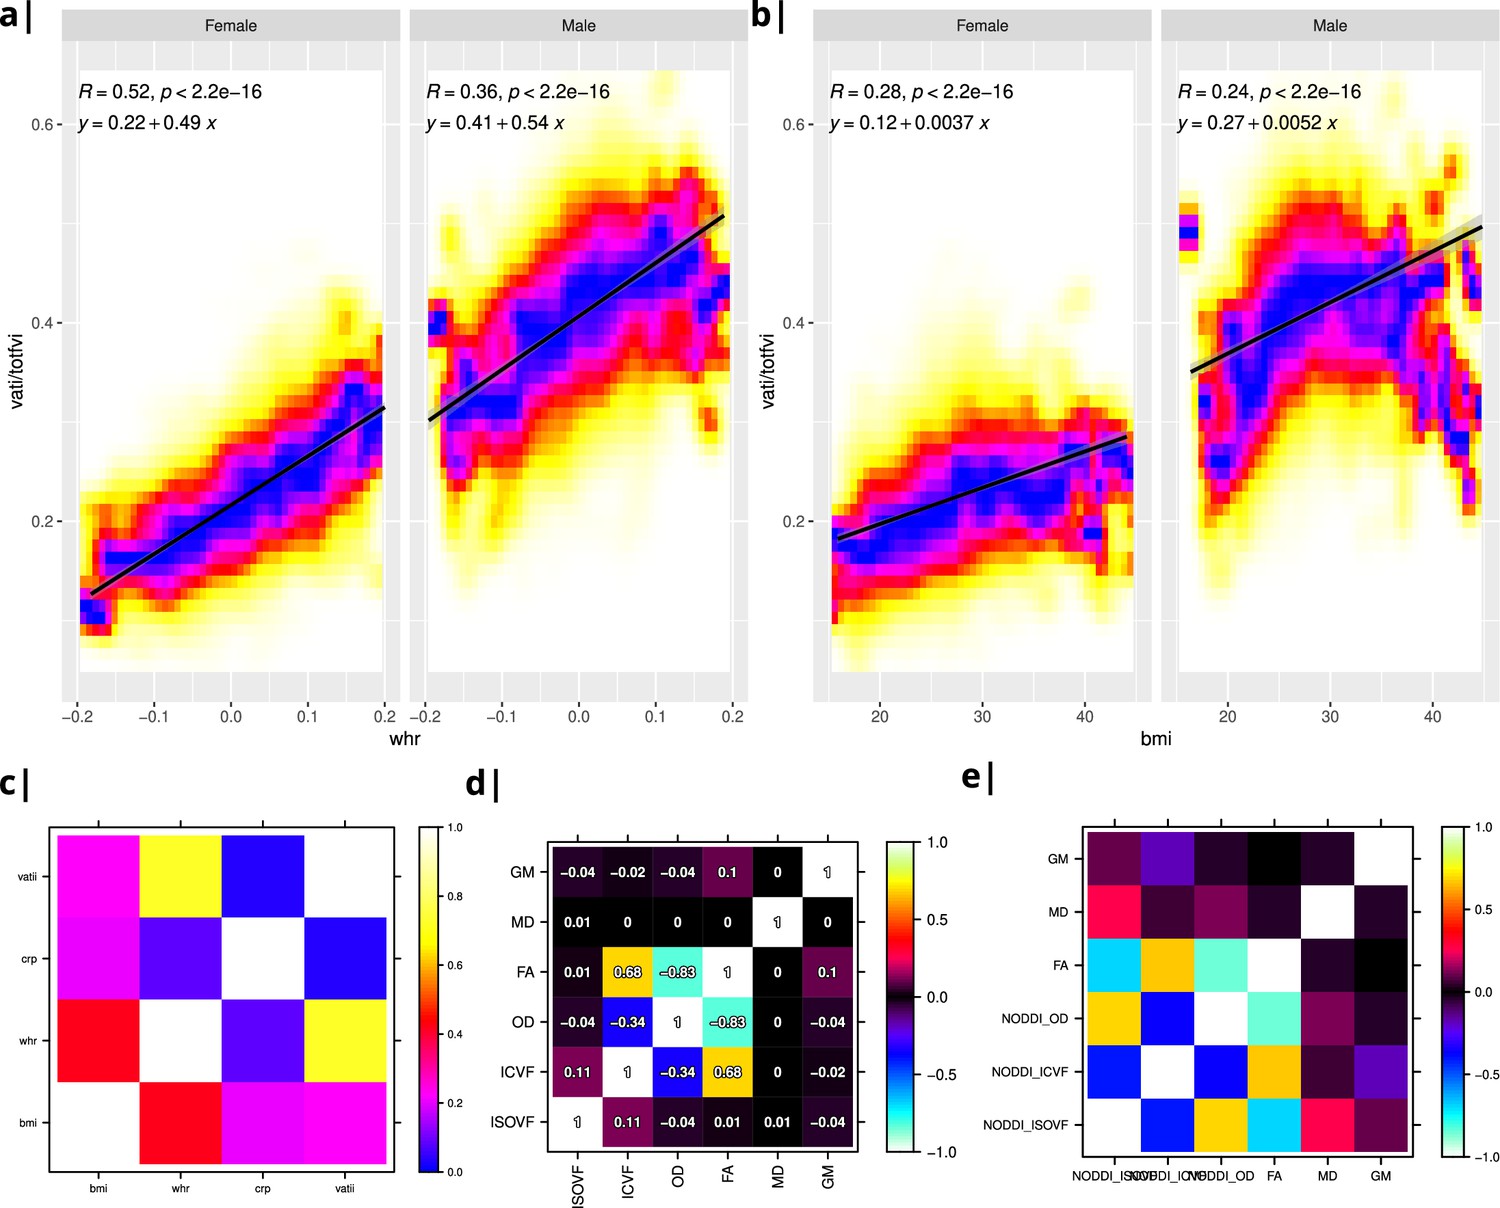
Internal structure of input data.
Waist-to-hip ratio (WHR) in (a) has a much tighter linear relationship with relative visceral adipose tissue from MRI scans than BMI in (b). Bottom row: internal correlation in adiposity data (c), imaging data (d), and imaging-WHR maps (e). GM = Grey Matter; MD = Mean Diffusivity; FA = Fractional Anisotropy; OD = Orientation Dispersion Index; ISOVF = isotropic volume fraction; ICVF = intra-cellular volume fraction; BMI = body mass index; WHR = waist-to-hip ratio; CRP = C-reactive protein; VATI = visceral adipose tissue index; TOTFVI = total fat volume index.
Appendix 2—figure 2
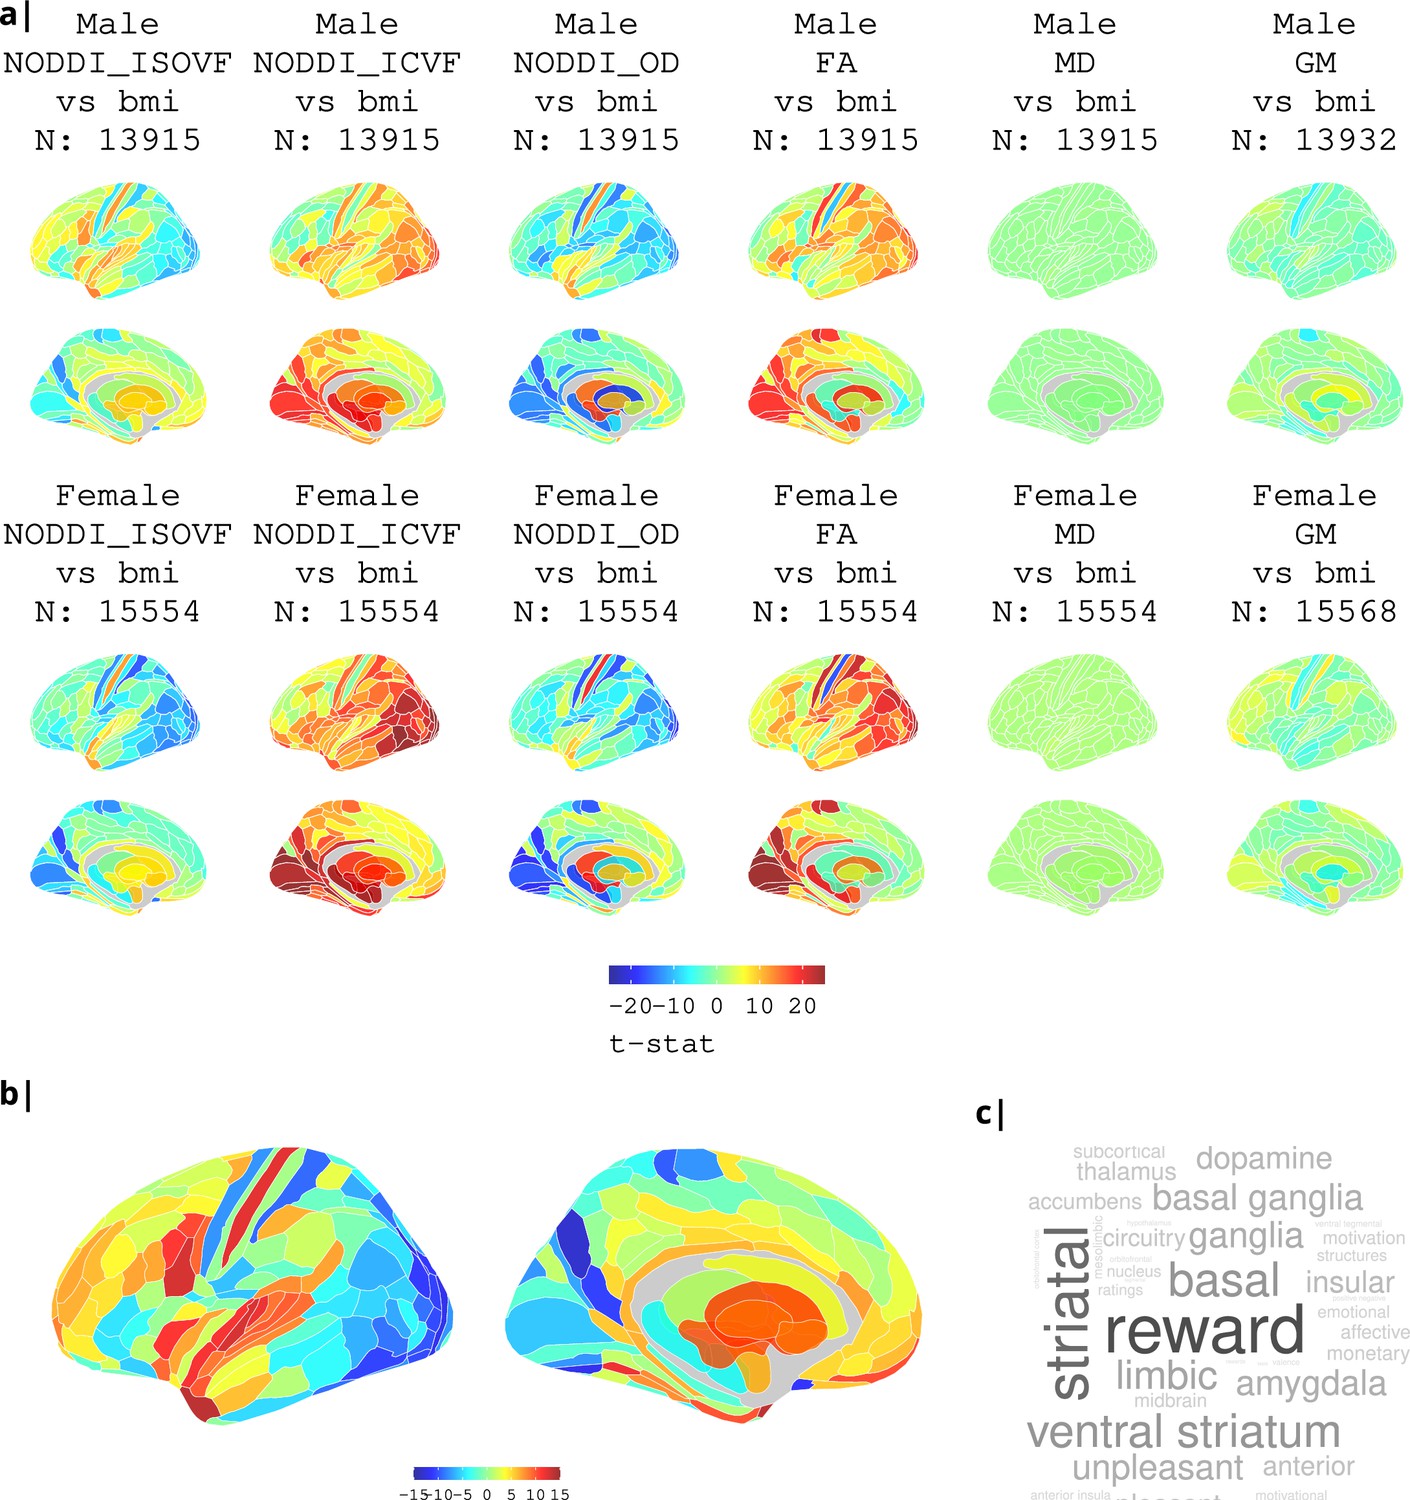
Association of various MRI metrics with BMI.
(a) Brain maps showing dependence of NODDI metrics and gray matter density on body mass index, separately for males and females. Bottom: (b) enlarged ISOVF-BMI map and (c) corresponding terms from Neurosynth arranged as a word cloud.
Appendix 2—figure 3
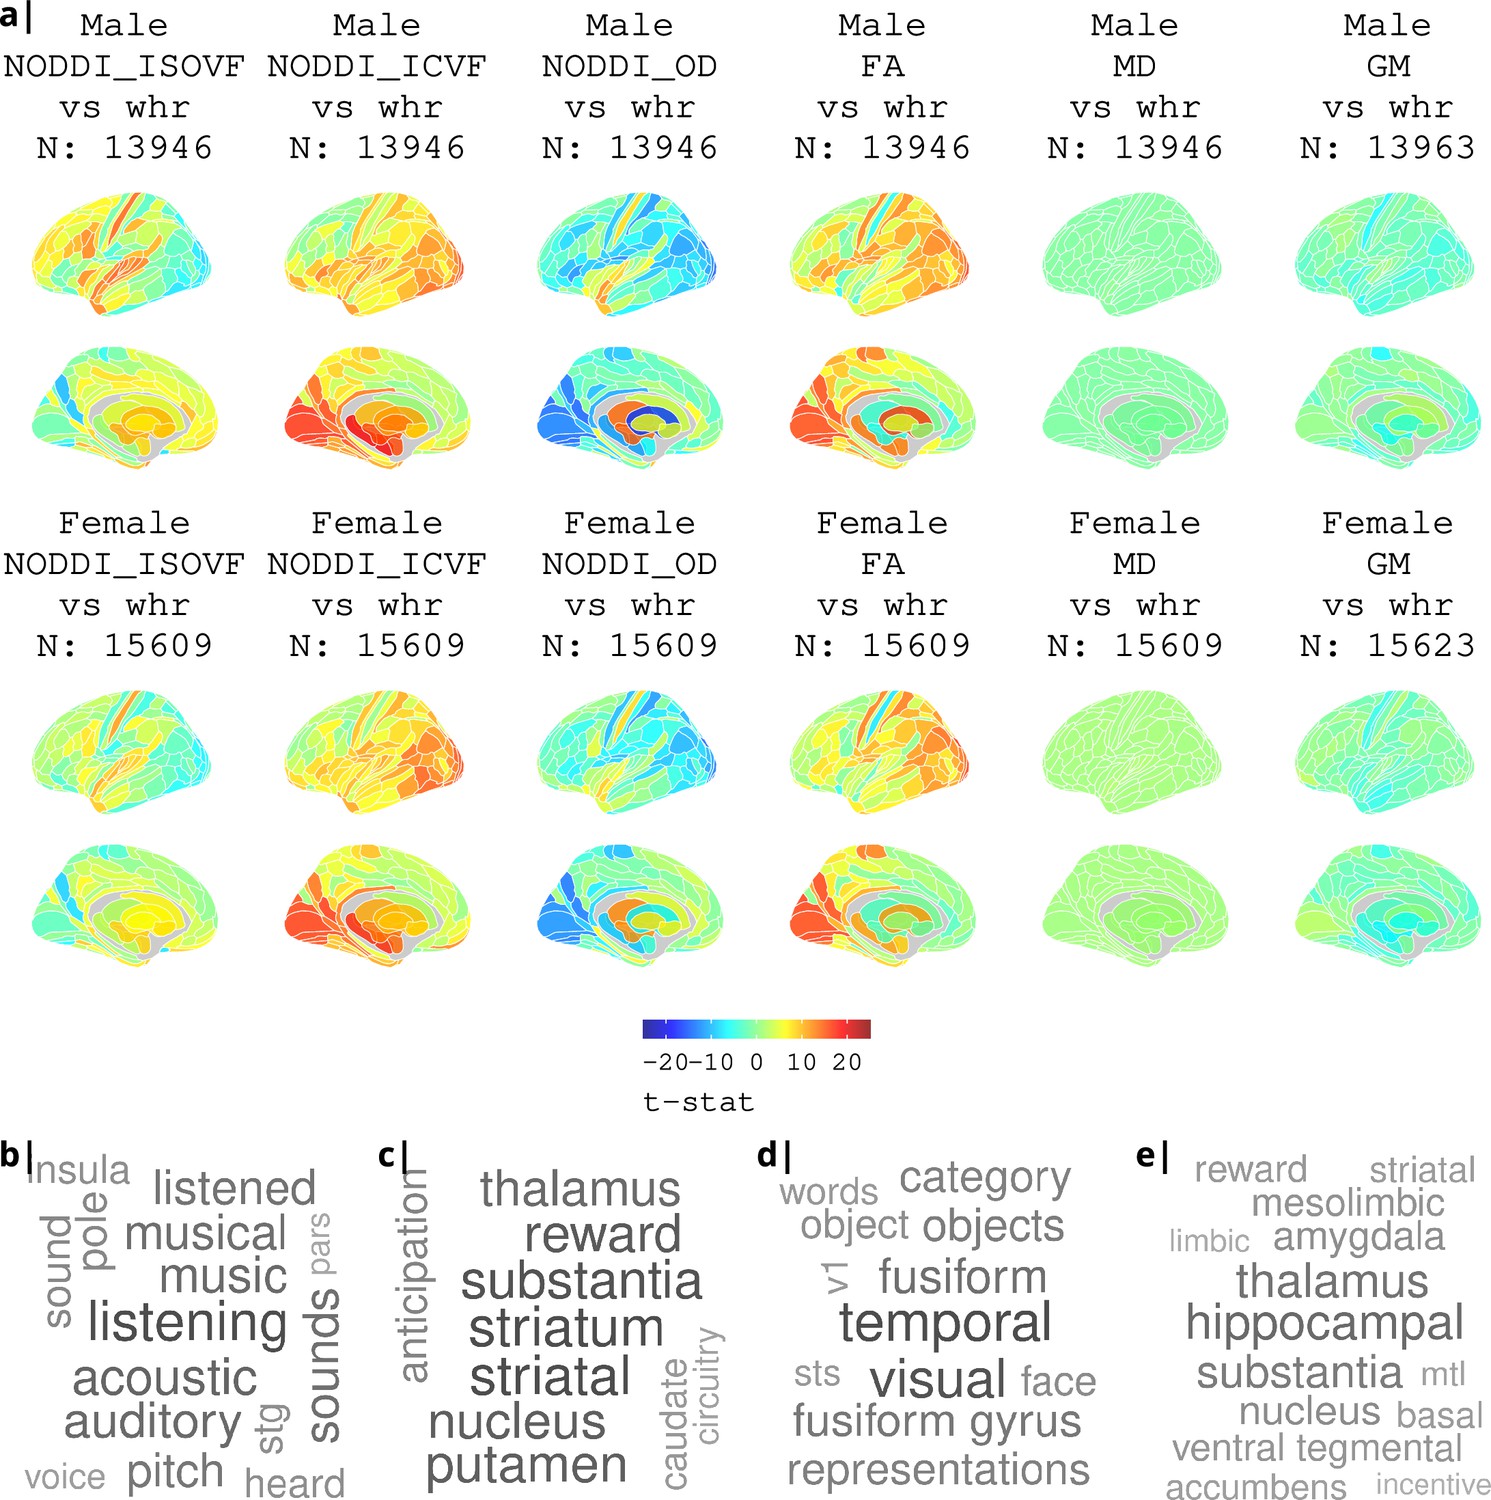
Association of various MRI metrics with BMI.
(a) Brain maps showing dependence of NODDI metrics and gray matter density on body mass index, separately for males and females. Bottom: terms from Neurosynth arranged as a word cloud corresponding respectively to (b) ISOVF, (c) ISOVF sub-cortical, (d) ICVF, and (e) ICVF sub-cortical maps.
Appendix 2—figure 4
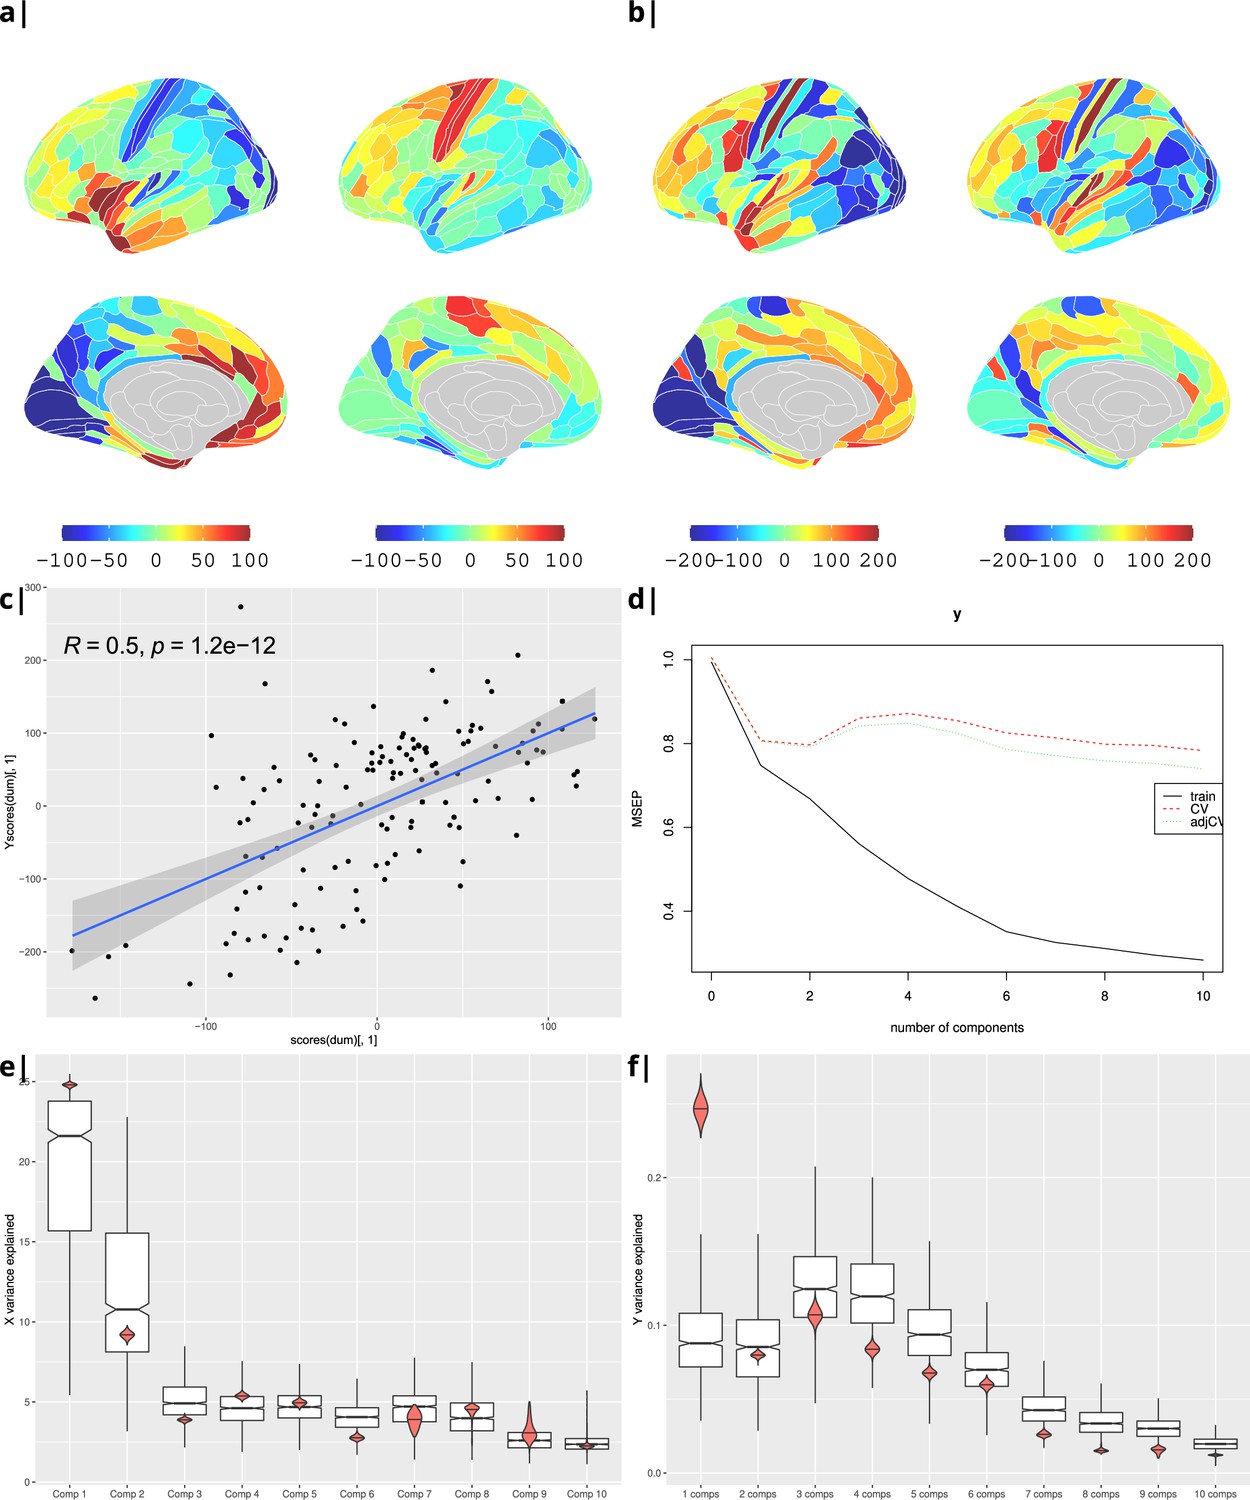
Body mass index.
Gene correlational maps of first two X scores (A) and Y scores (B). Scatterplot of X vs Y scores across ROIs (C). (D) Cross validation of the PLS analysis. Only the first component contributes significantly to reduce the mean square error of the prediction. (E) and (F) Explained variance in X and Y respectively per component in real data (red) compared to surrogate data (boxes).
Appendix 2—figure 5
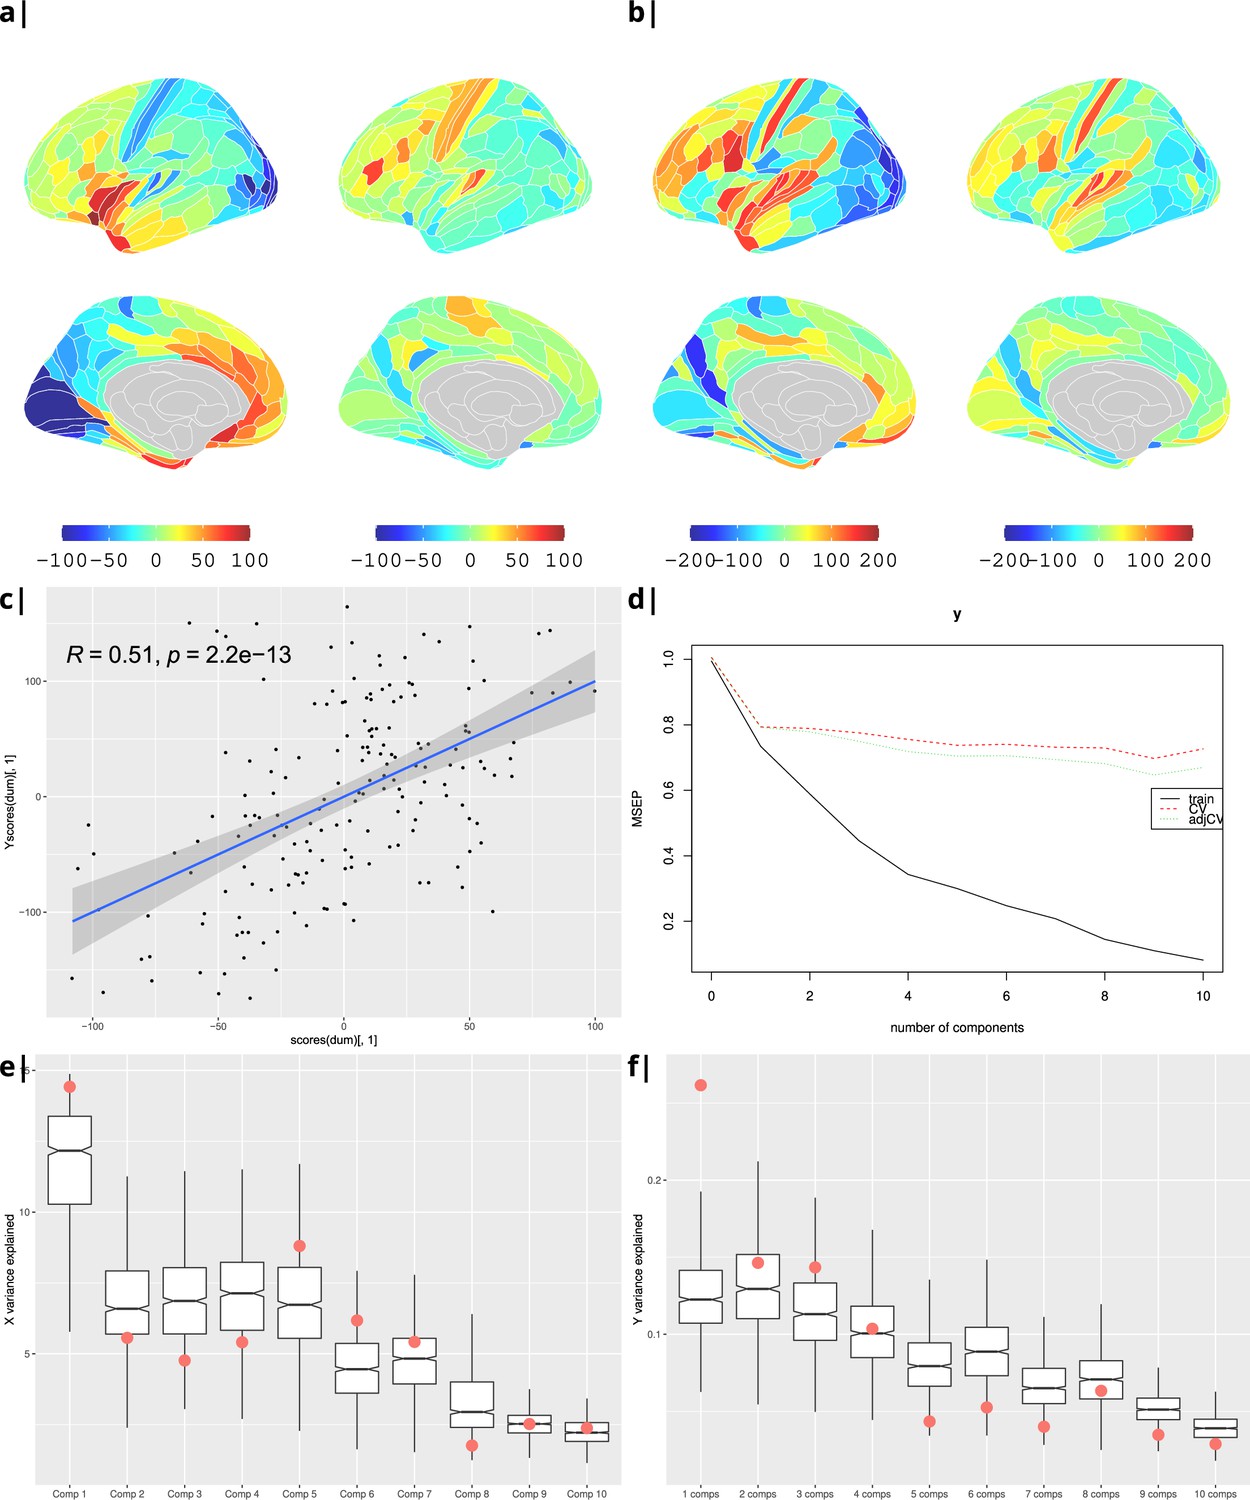
Waist-to-hip ratio: gene correlational maps of first two X scores (A) and Y scores (B).
Scatterplot of X vs Y scores across ROIs (C). (D) Cross validation of the PLS analysis. Only the first component contributes significantly to reduce the mean square error of the prediction. (E) and (F) Explained variance in X and Y respectively per component in real data (red) compared to surrogate data (boxes).
Appendix 2—figure 6
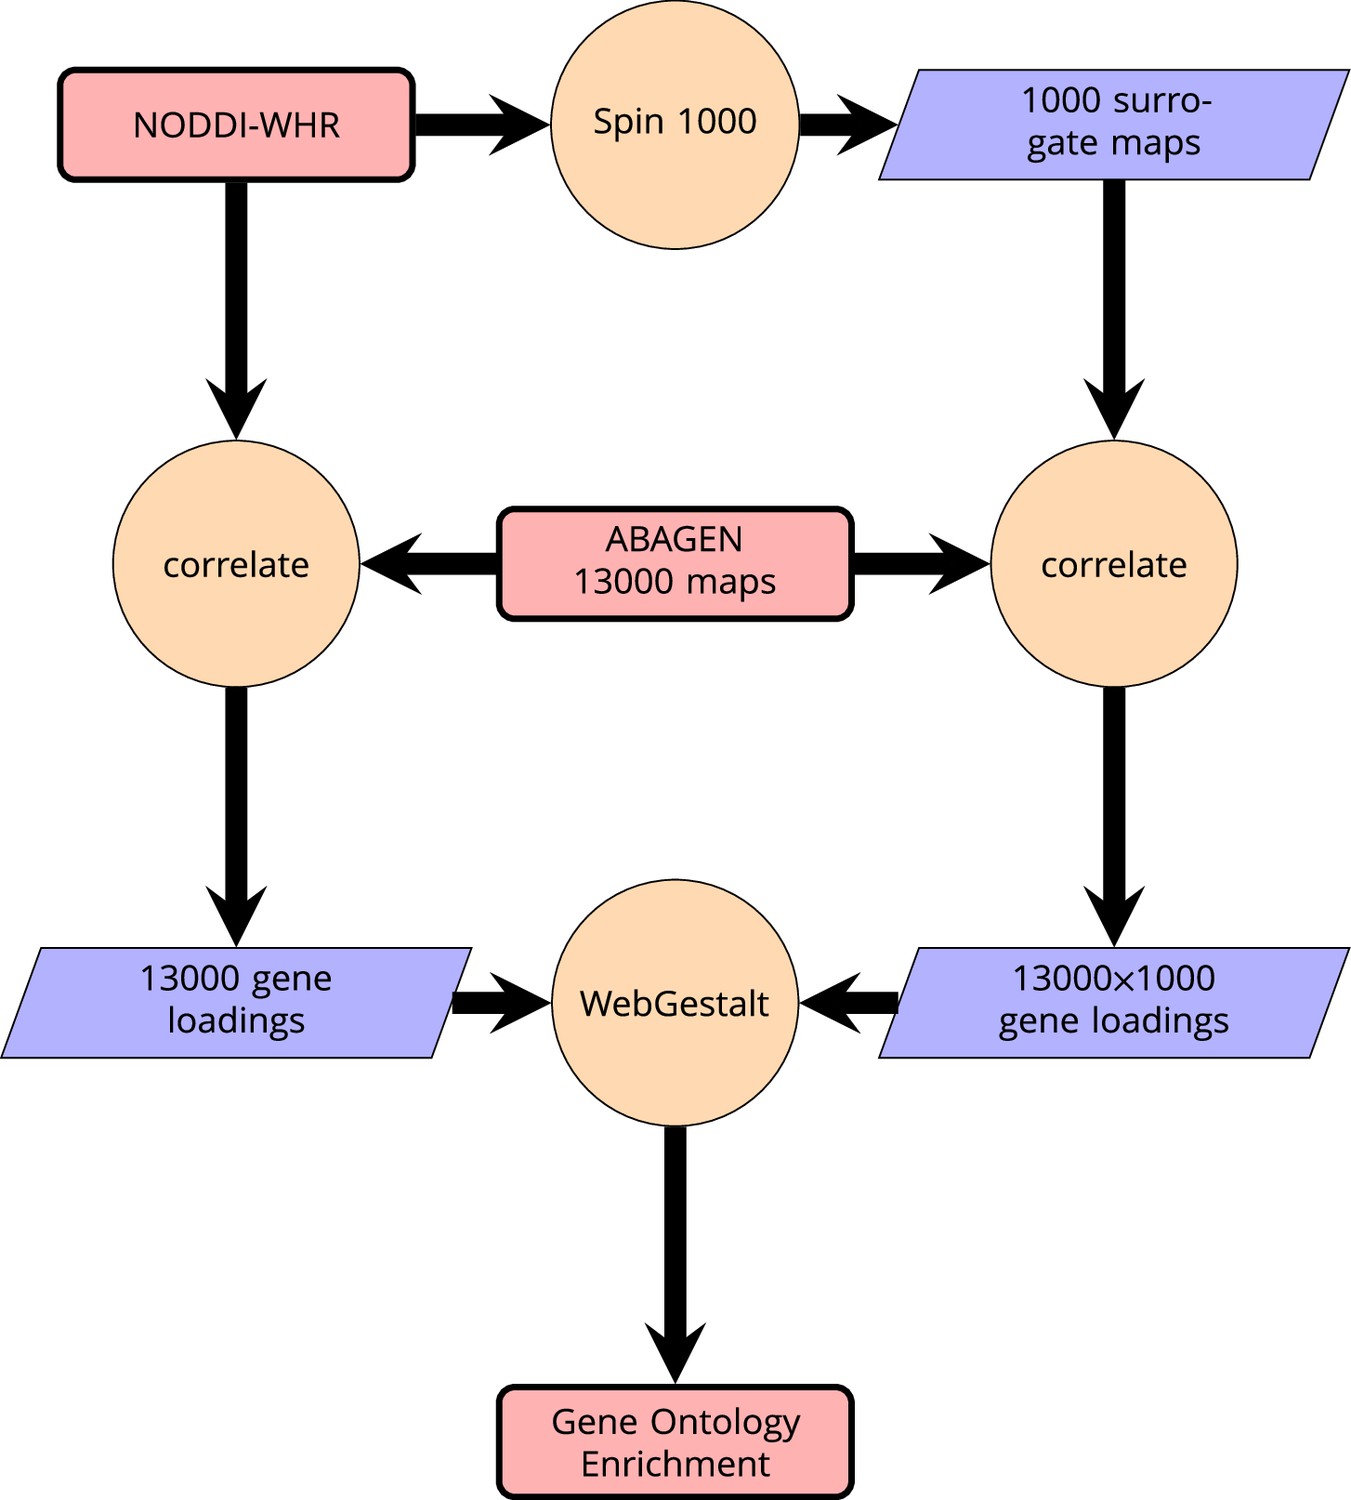
Schematic of analysis pipeline for gene ontology analysis with Webgestalt based on the correlation of NODDI-WHR and gene expression maps.
Significance calculation is based on permutations taking into account the smoothness of cortical patterns (spin permutations).
Appendix 2—figure 7
Waist-to-hip ratio: significantly enriched gene ontology categories according to Webgestalt based on the correlation of NODDI-WHR and gene expression maps.
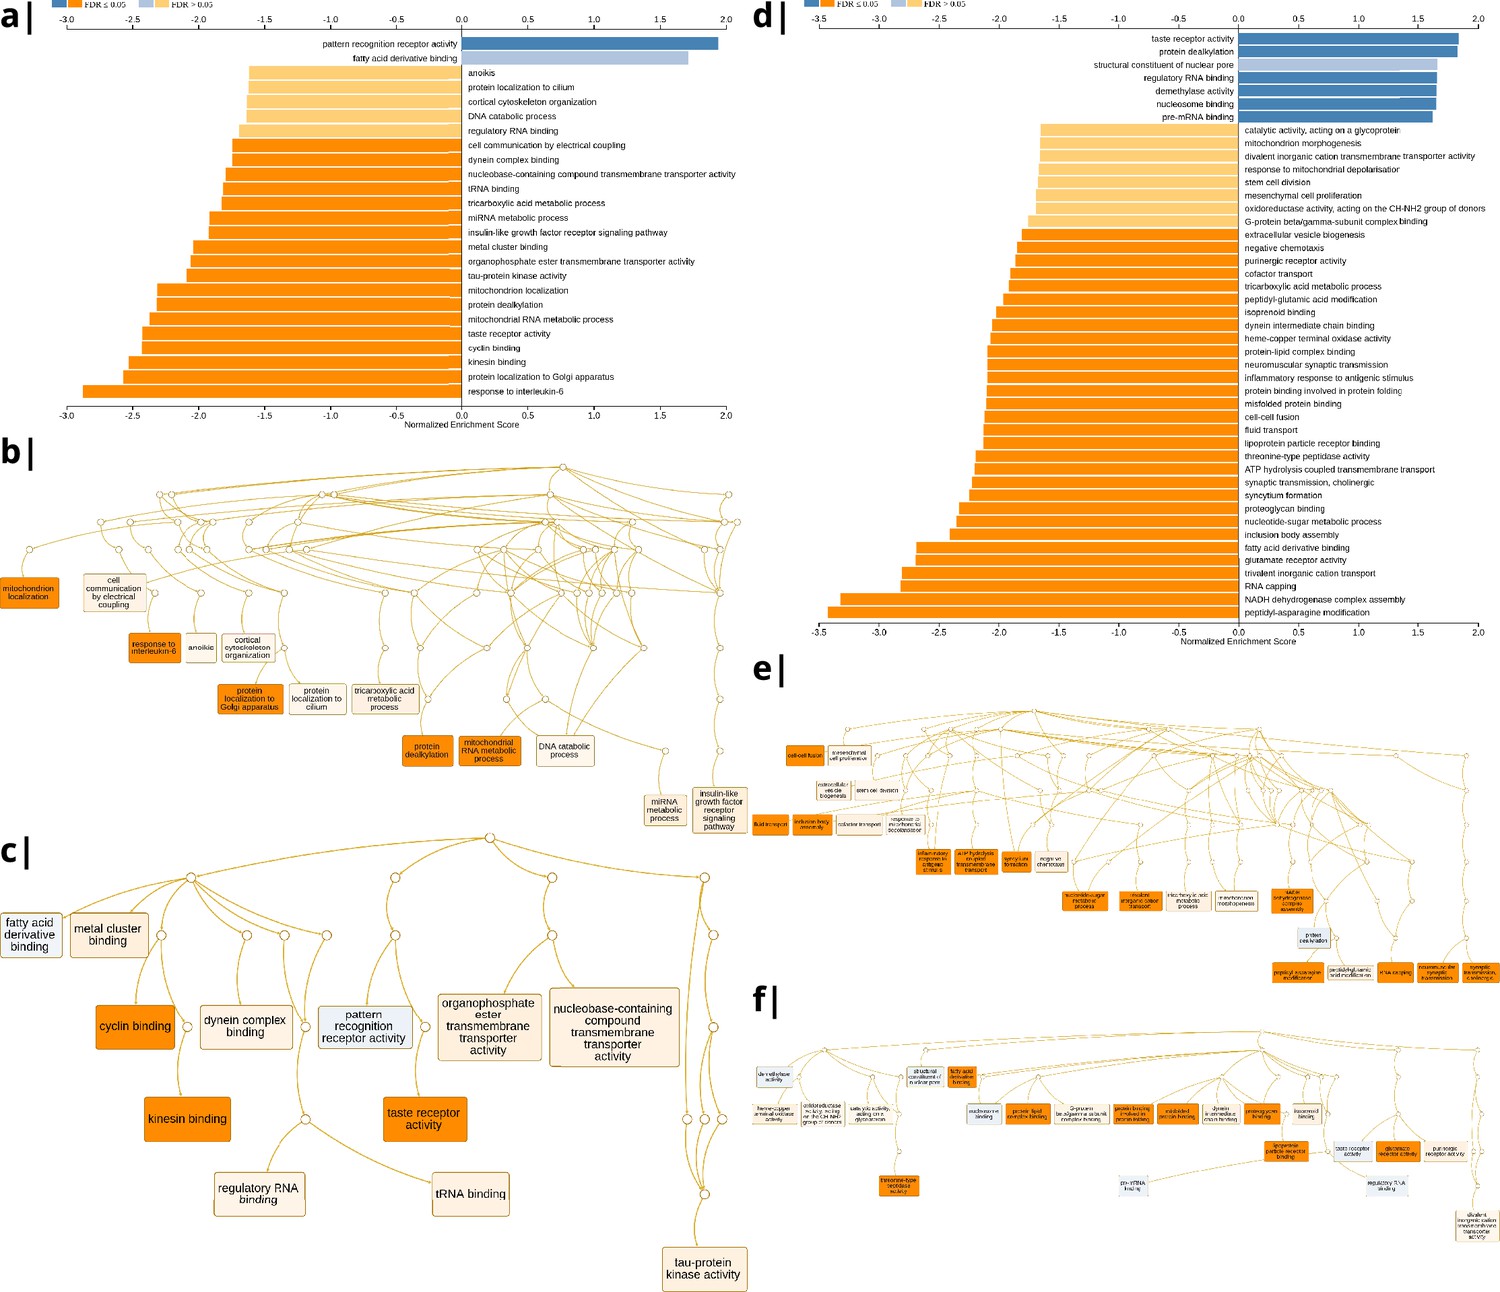
Left: results using the ISOVF-WHR maps (free water vs adiposity). (a) bar graph of significant gene ontologies showing normalized enrichment score on the x-axis. (b) Directed acyclic hierarchical graph (DAG) of GOs in the Biological Processes category. (c) DAG of GOs in the Molecular Function category. Right: (d-f) are exactly the same as (a-c) on the left, using instead the ICVF-WHR maps (neurite density vs adiposity). Significance calculation is based on permutations taking into account the smoothness of cortical patterns (spin permutations).
Appendix 2—figure 8
Significantly enriched gene ontology categories according to Webgestalt based on the correlation of NODDI-WHR and gene expression maps.
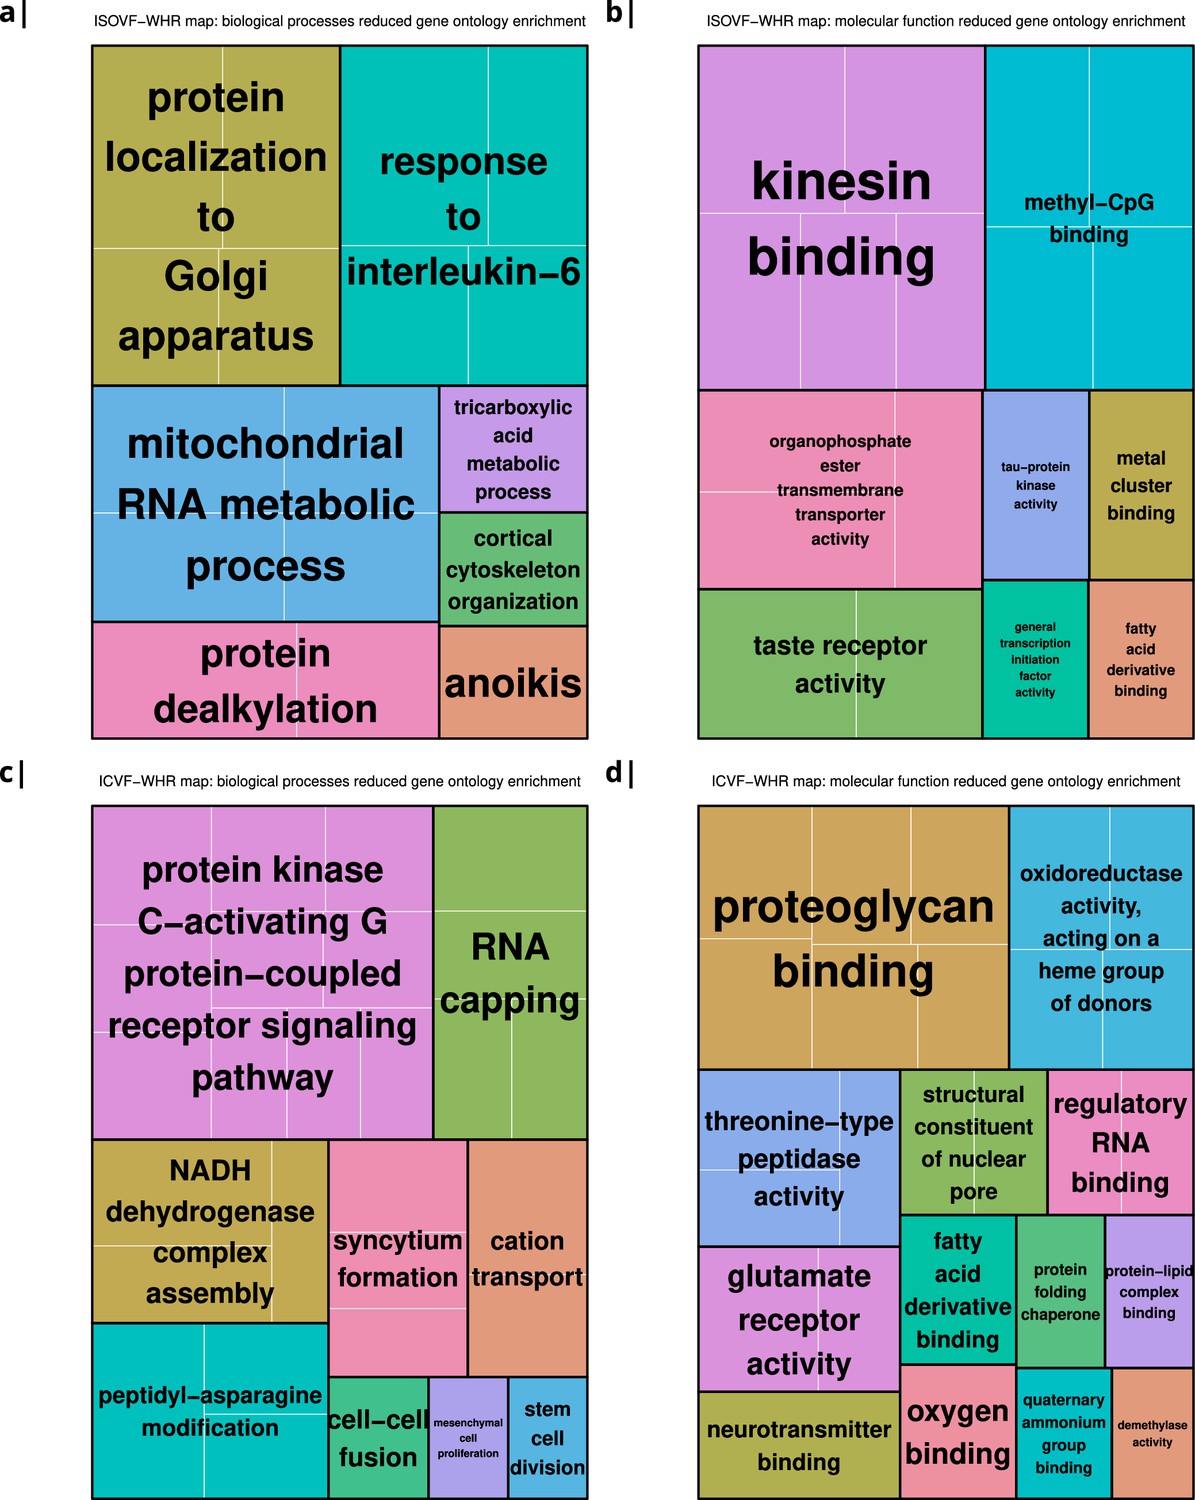
(a–b) same results as in Figure 2a but with semantically reduced GO categories illustrating hierarchical dependencies. Results are split by category: biological processes (a) and molecular function (b). (c–d) same results as in Figure 2b but with semantically reduced GO categories split by category: biological processes (c) and molecular function (d).
Appendix 2—figure 9
Body mass index: correlations of cortical neurotransmitter maps from the literature with the NODDI ICVF-BMI maps shown above.
Significance after Bonferroni correction is indicated by shading. Left: individual studies, right: same neurotransmitters from different studies combined. The CB1 (cannabinoid) receptors show the maximum (absolute) correlation with the maps of microstructural effect of obesity.
Appendix 2—figure 10
Left: Correlations of Brain cell type maps for 31 cell types from Lake et al., 2018 with the NODDI ISOVF and ICVF-WHR maps shown above.
Significance is indicated by shading (based on spin permutation and Bonferroni correction). Right: The Astrocytes, Microglia, and OPC cell type maps show the maximum (absolute) correlation with the ISOVF maps of microstructural effect of obesity.
Appendix 2—figure 11
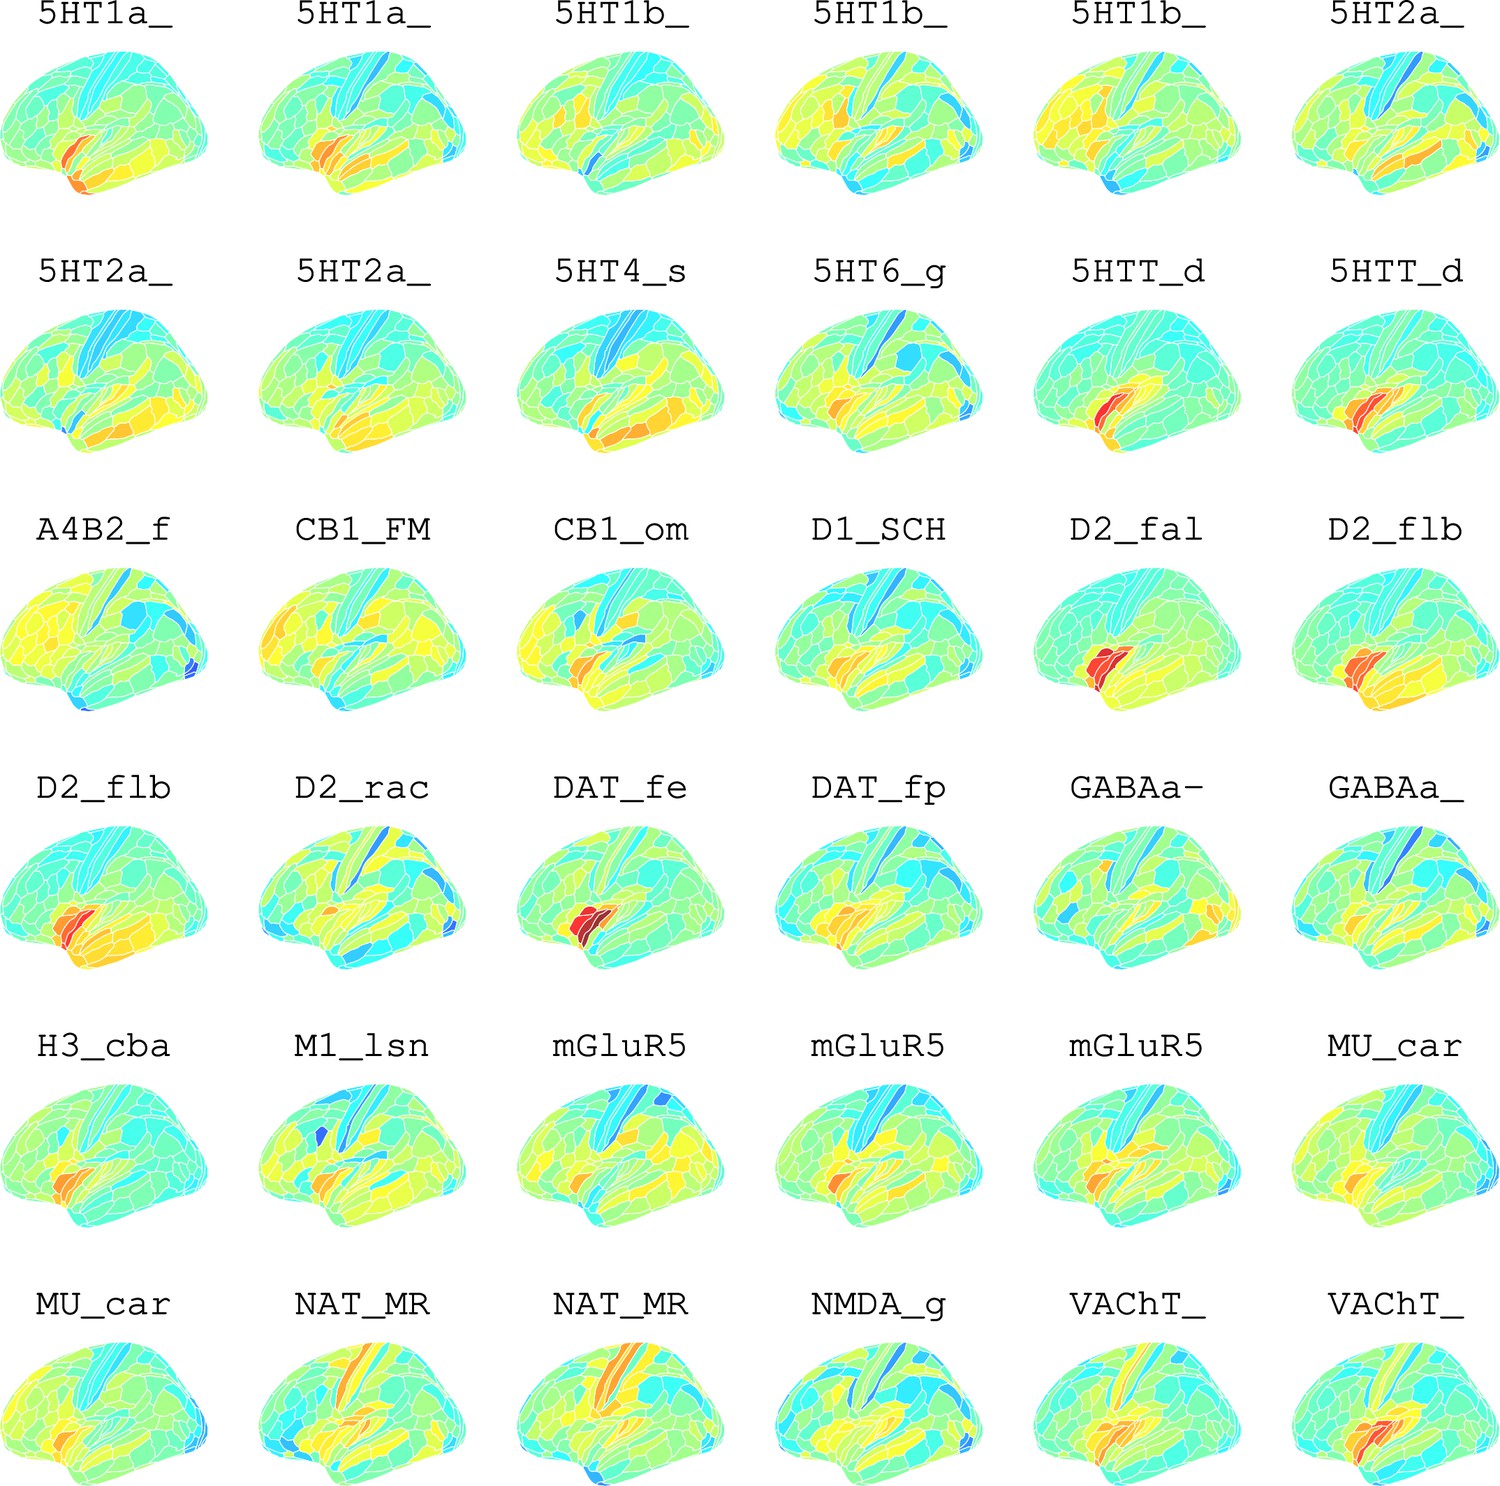
Neurotransmitter maps for 36 neurotransmitters from Hansen et al., 2022.
Appendix 2—figure 12
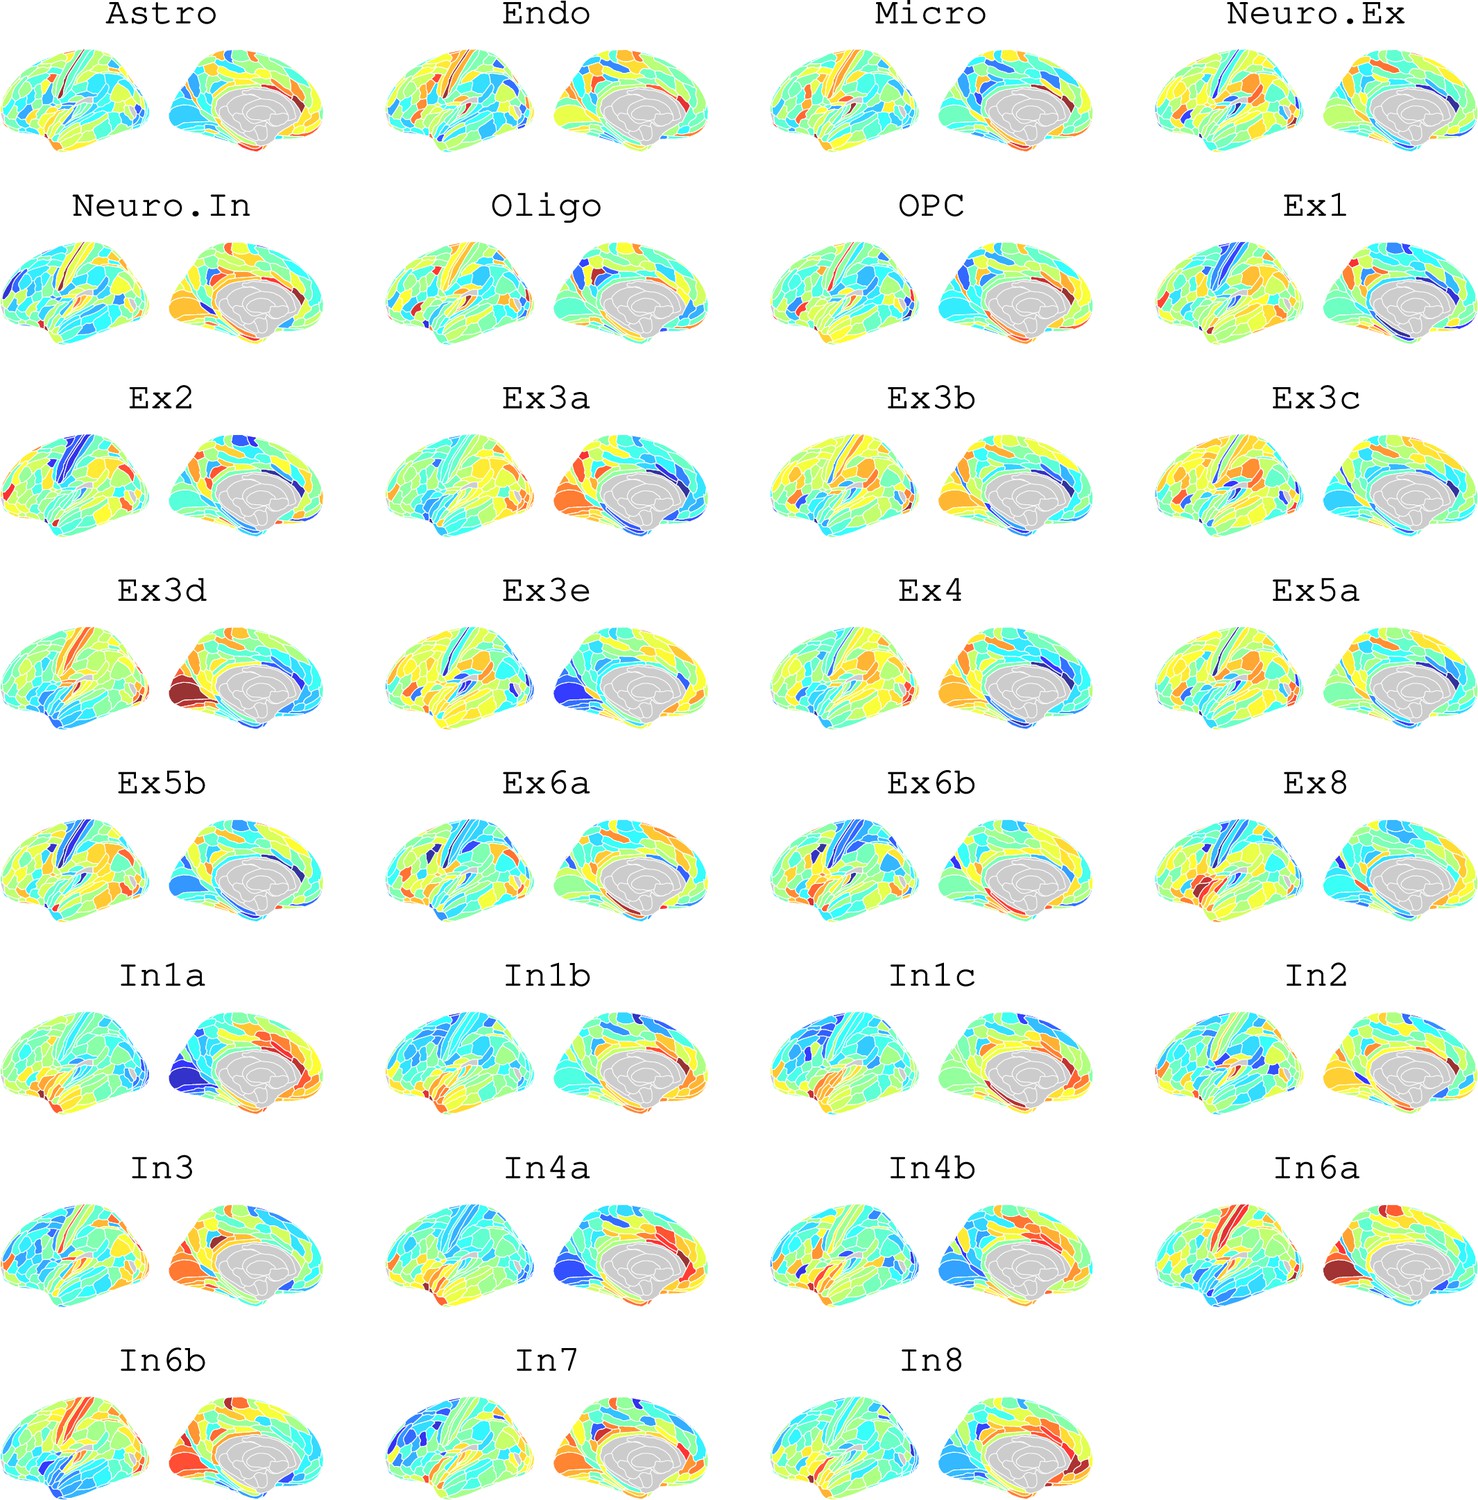
Brain cell type maps for 31 cell types from Lake et al., 2018.
Appendix 2—figure 13
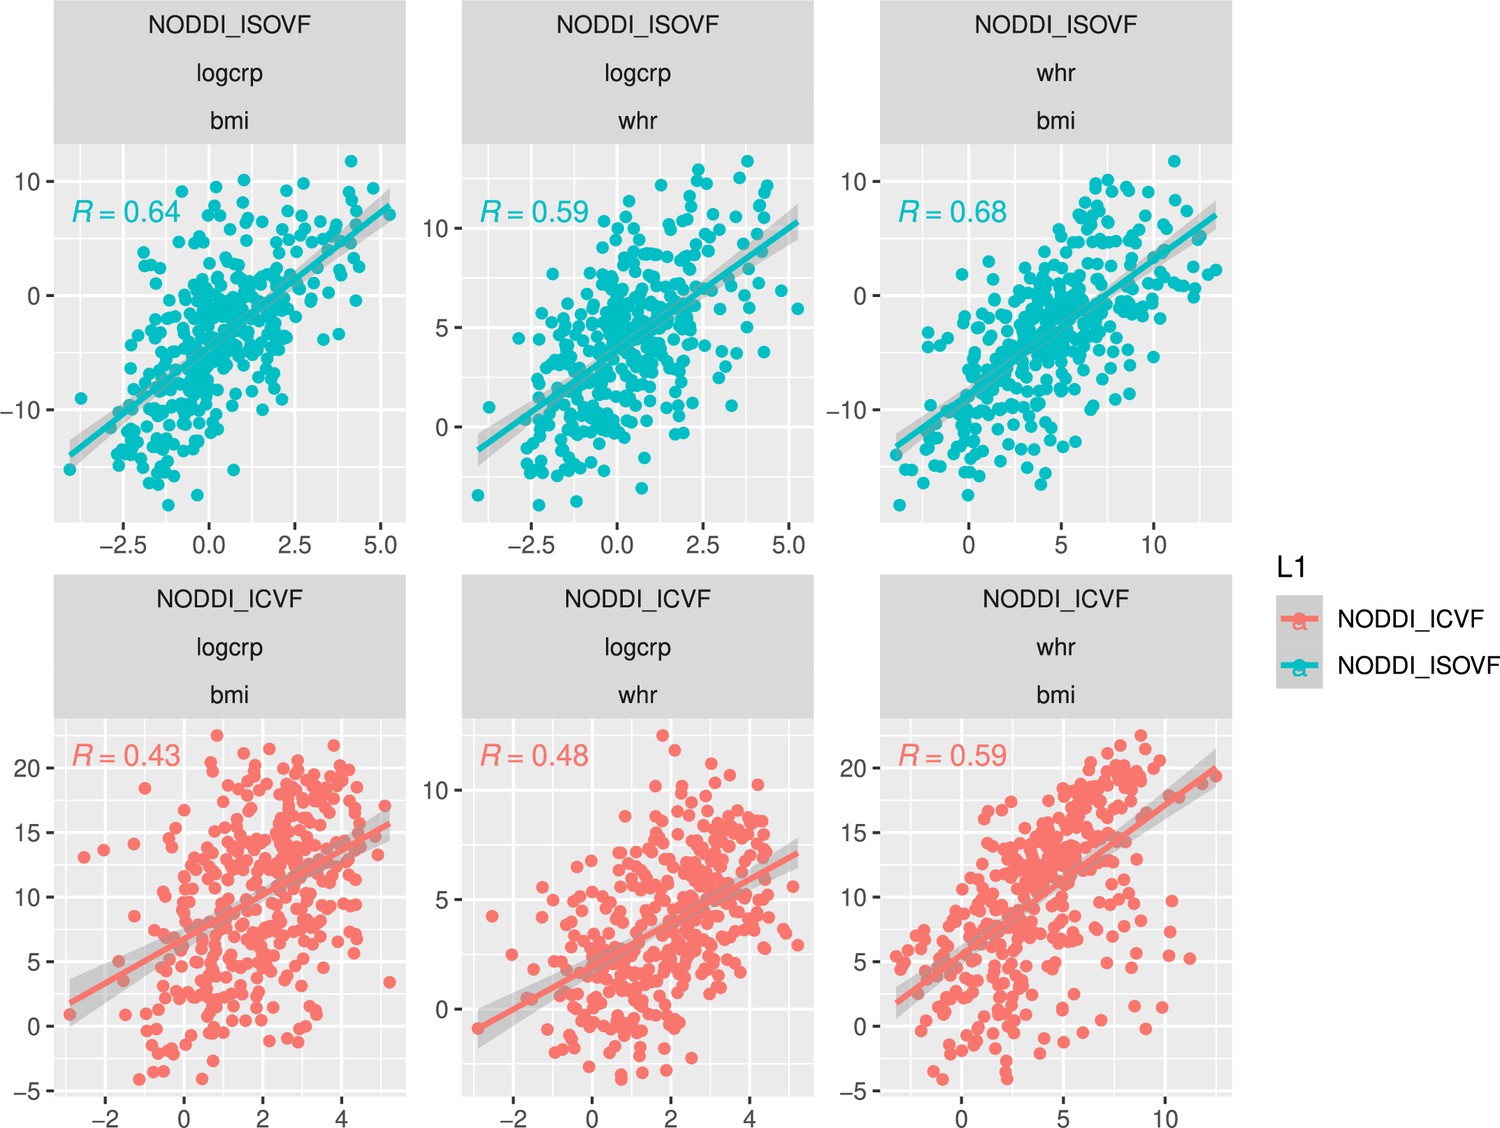
Scatterplot over 376 regions of pairwise relationships between t-score maps for variables WHR, BMI, and CRP respectively.
Top: similarity between ISOVF maps, bottom: similarity between ICVF maps. Calculating statistics based on Fisher transformed correlation values, for both CRP pairs the correlation is significantly stronger for the ISOVF maps than the ICVF maps (CRP-BMI: , CRP-WHR: , one-tailed) and we also find that the BMI and WHR maps are marginally different (BMI-WHR: , two-tailed).
Tables
Table 1
Summary of differences between two obesity-associated micro-structural MRI phenotypes in terms of their associations with other brain phenotypes (gene ontology, receptor expression, and cell types) and their genetic correlations with obesity.
| Scaling with obesity (WHR) | Gene ontology | Neurotransmitter receptors or transporters | Cell types | Genetic correlation with WHR | |
|---|---|---|---|---|---|
| ISOVF (free water) |  prefrontal-temporo-striatal system prefrontal-temporo-striatal system |  pattern recognition receptors (PRR) pattern recognition receptors (PRR) receptors for fatty acid derivatives receptors for fatty acid derivatives IL-6 responses IL-6 responses |  H3, Mu, D1 and 5HTT H3, Mu, D1 and 5HTT |  astrocytes, microglia and oligodendrocyte precursor cells (not any class of neurons) astrocytes, microglia and oligodendrocyte precursor cells (not any class of neurons) |  not significant not significant |
| ICVF (neurite density) |  medial temporal-occipito-striatal system medial temporal-occipito-striatal system |  taste receptor activity taste receptor activity fatty acid receptors, glutamate receptor activity and GPCR signalling fatty acid receptors, glutamate receptor activity and GPCR signalling |  H3, Mu, CB1 and A4B2 H3, Mu, CB1 and A4B2 |  not significant not significant |  significant (positive) significant (positive) |
Appendix 2—table 1
UK Biobank data.
| Variable | N | Female | Male |
|---|---|---|---|
| Age | 34,229 | 18,143 | 16,086 |
| Body Mass Index (BMI), kg/m2 | 33,090 | 17,501 | 15,589 |
| Waist to Hip Ratio (WHR) | 33,183 | 17,560 | 15,623 |
| Visceral Adipose Tissue (VAT) | 7539 | 3957 | 3582 |
| Extracellular free water (isotropic volume fraction ISOVF) | 34,194 | 18,126 | 16,068 |
| Intracellular neurite density (intracellular volume fraction ICVF) | 34,194 | 18,126 | 16,068 |
| Intracellular neurite dispersion (orientation dispersion OD) | 34,194 | 18,126 | 16,068 |
| Fractional anisotropy (FA) | 34,194 | 18,126 | 16,068 |
| Mean diffusivity (MD) | 34,194 | 18,126 | 16,068 |
| Gray matter volume (GM) | 34,229 | 18,143 | 16,086 |
Appendix 2—table 2
Gene correlation analysis results.
| *trait 1 | †trait 2 | rg | std error | z-score | p-value |
|---|---|---|---|---|---|
| WHR | ISOVF | 0.0259 | 0.0282 | 0.9184 | 0.3584 |
| WHR | ICVF | 0.1118 | 0.0337 | 3.3187 | 9×10⁻⁴ *** |
-
*
from Pulit et al., 2019.
-
†
from Warrier et al., 2022.
Additional files
Download links
A two-part list of links to download the article, or parts of the article, in various formats.
Downloads (link to download the article as PDF)
Open citations (links to open the citations from this article in various online reference manager services)
Cite this article (links to download the citations from this article in formats compatible with various reference manager tools)
Two human brain systems micro-structurally associated with obesity
eLife 12:e85175.
https://doi.org/10.7554/eLife.85175


