Projected long-term effects of colorectal cancer screening disruptions following the COVID-19 pandemic
- RAND Corporation, United States
- Erasmus MC, Netherlands
- Memorial Sloan Kettering Cancer Center, United States
- Argonne National Laboratory, United States
- Fred Hutchinson Cancer Center, United States
Figures
Figure 1 with 1 supplement
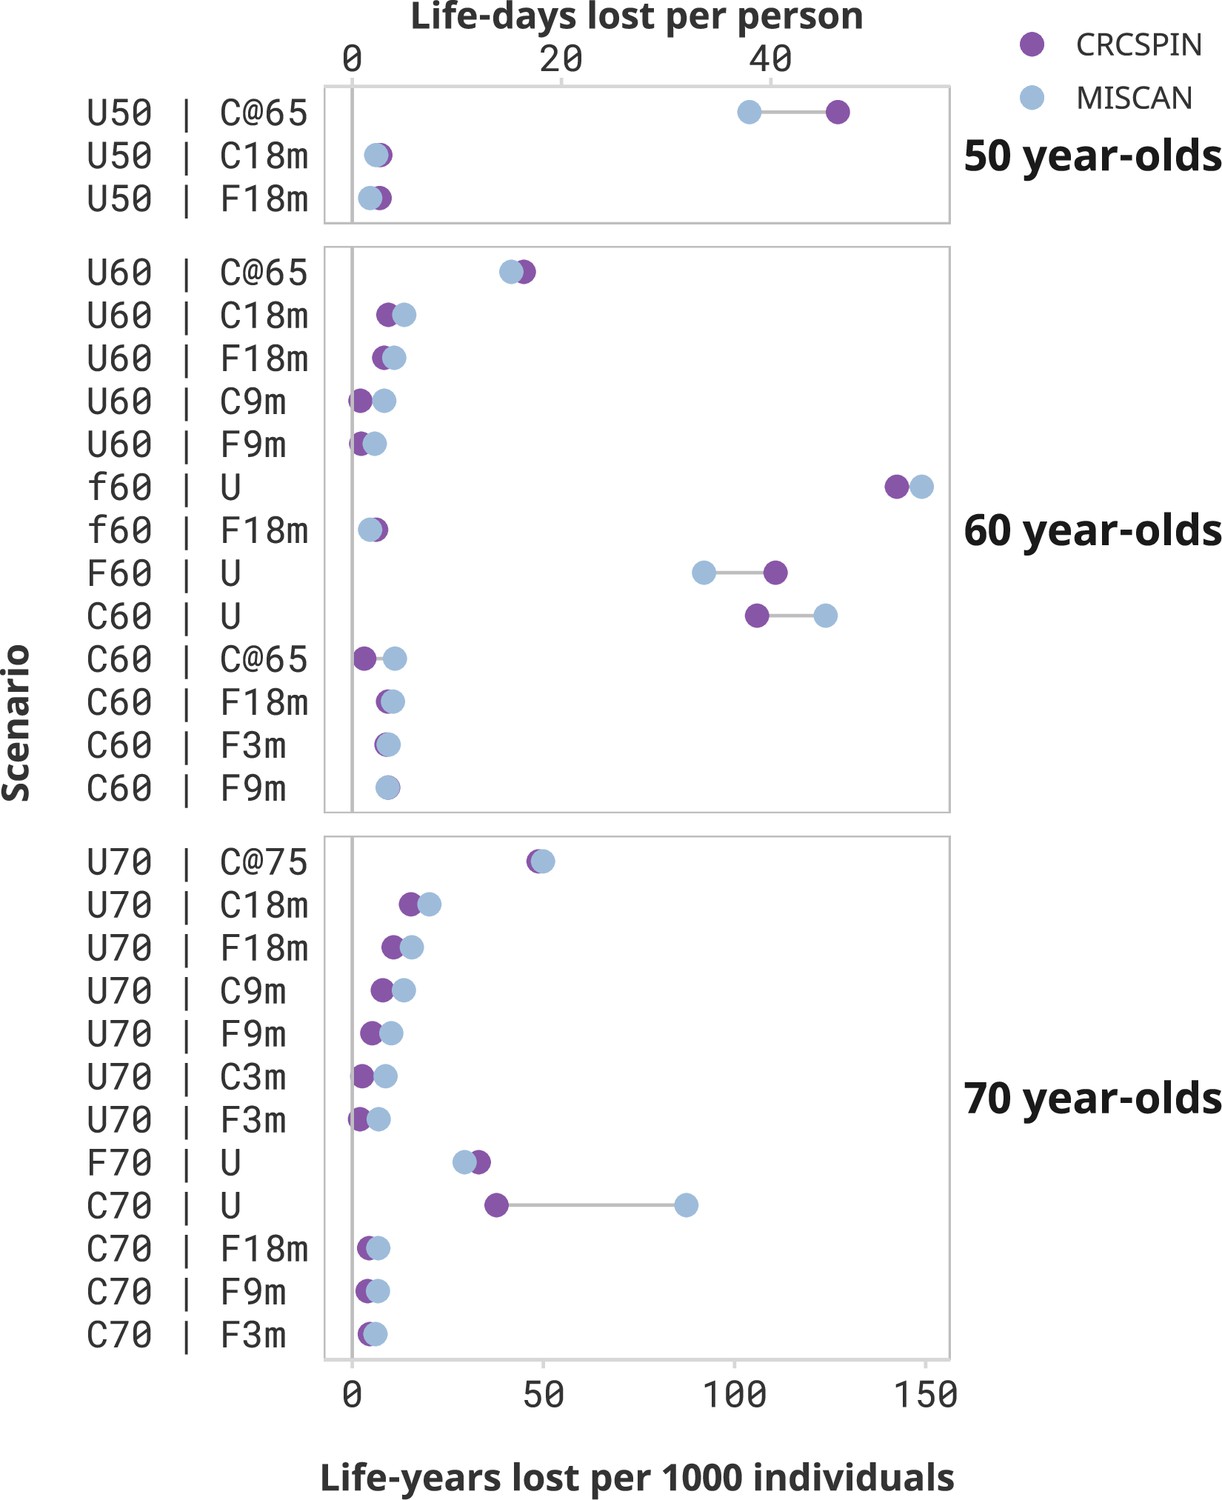
Screening benefits lost due to disruptions by cohort and scenario.
Notes: Each dot represents the estimated life-years lost per 1000 individuals or life-days lost from one model under the high sensitivity scenario. Results are ordered from highest to lowest reduction in benefit induced by the pandemic. Scenarios that result in less than 2 life-days lost per person are omitted from this figure and presented in a Supplementary figure. This figure does not present a counterfactual no-screening scenario for the 50-year-olds.
Figure 1—figure supplement 1
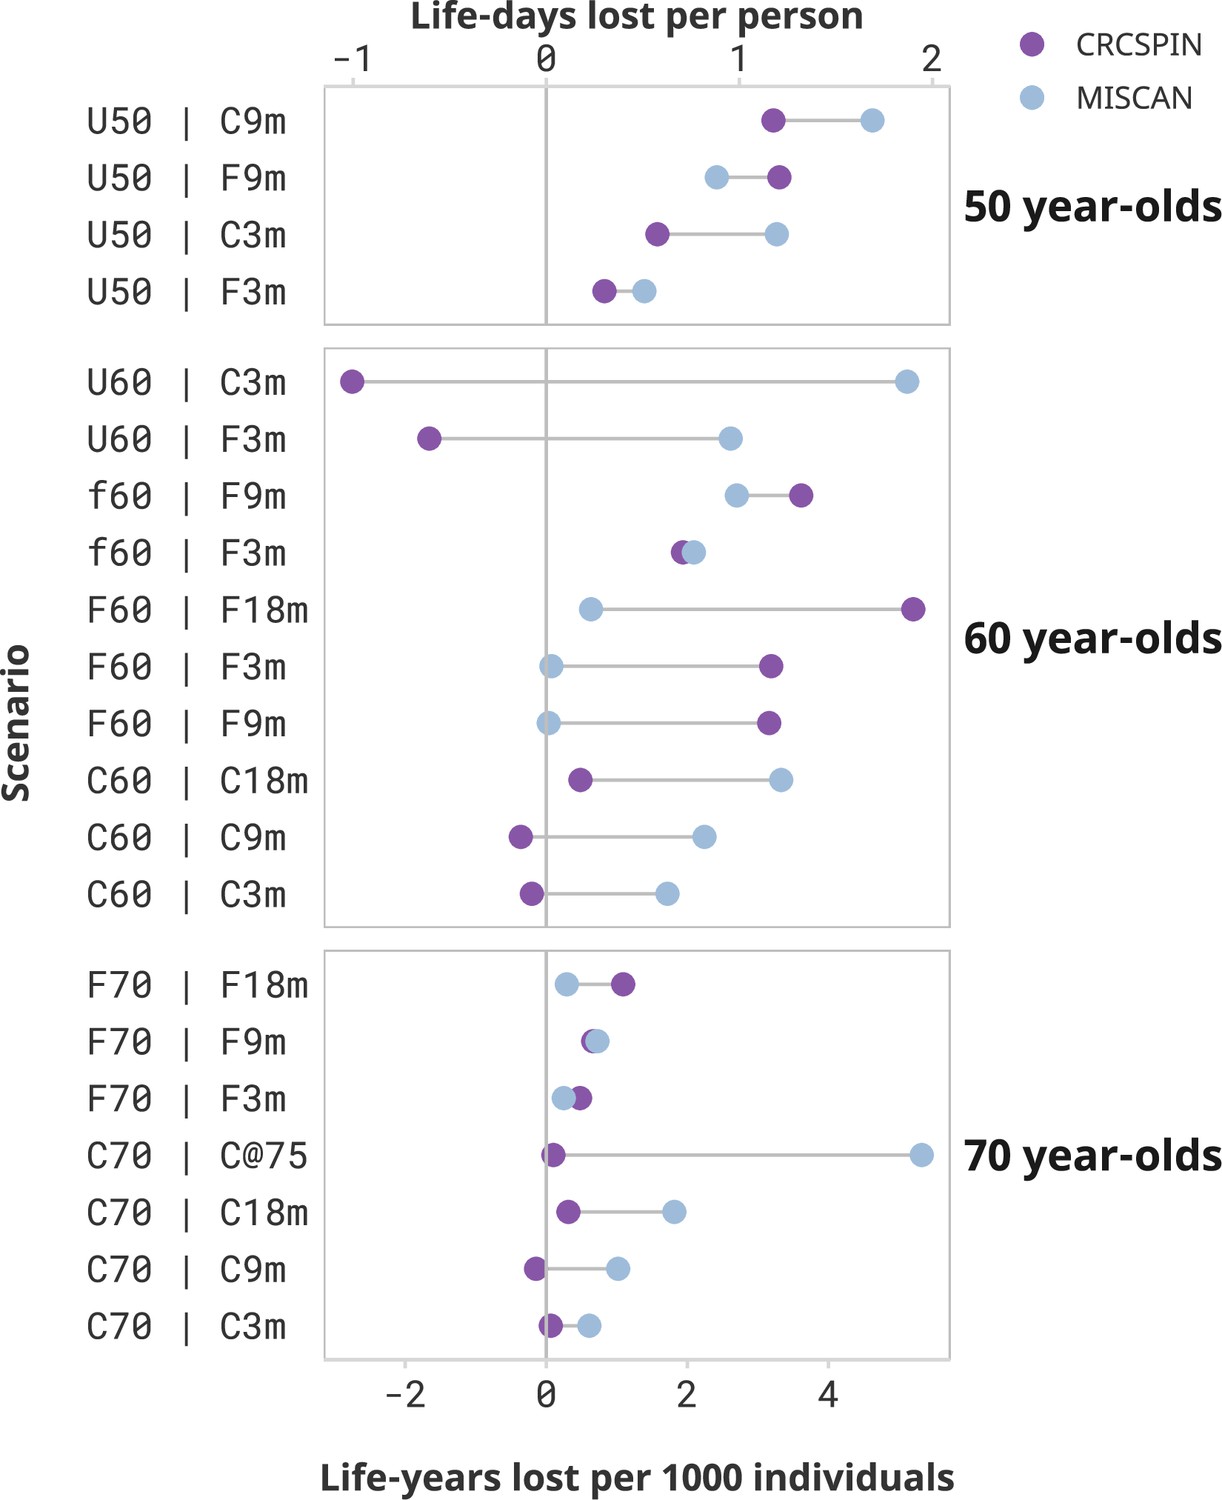
Estimated loss of life in minor disruption scenarios.
Notes: Each dot represents the estimated life-years lost per 1000 individuals or life-days lost from one model under the high sensitivity scenario. Results are ordered from highest to lowest reduction in benefit induced by the pandemic. This figure supplement only shows scenarios that resulted in in less than 2 life-days lost per person. This figure does not present a counterfactual no-screening scenario for the 50-year-olds.
Figure 2 with 1 supplement

Life-years gained (LYG) in high- vs. low-sensitivity scenarios.
Notes: Each dot represents one scenario considered in this study. The horizontal axis displays the number of LYG estimated in that scenario under a high colonoscopy sensitivity scenario. The vertical axis shows the results for the same cohort under a low colonoscopy sensitivity scenario. If sensitivity did not affect the estimate, then all points would be on top of a 45-degree line. Different colors represent CRCSPIN and MISCAN models.
Figure 2—figure supplement 1
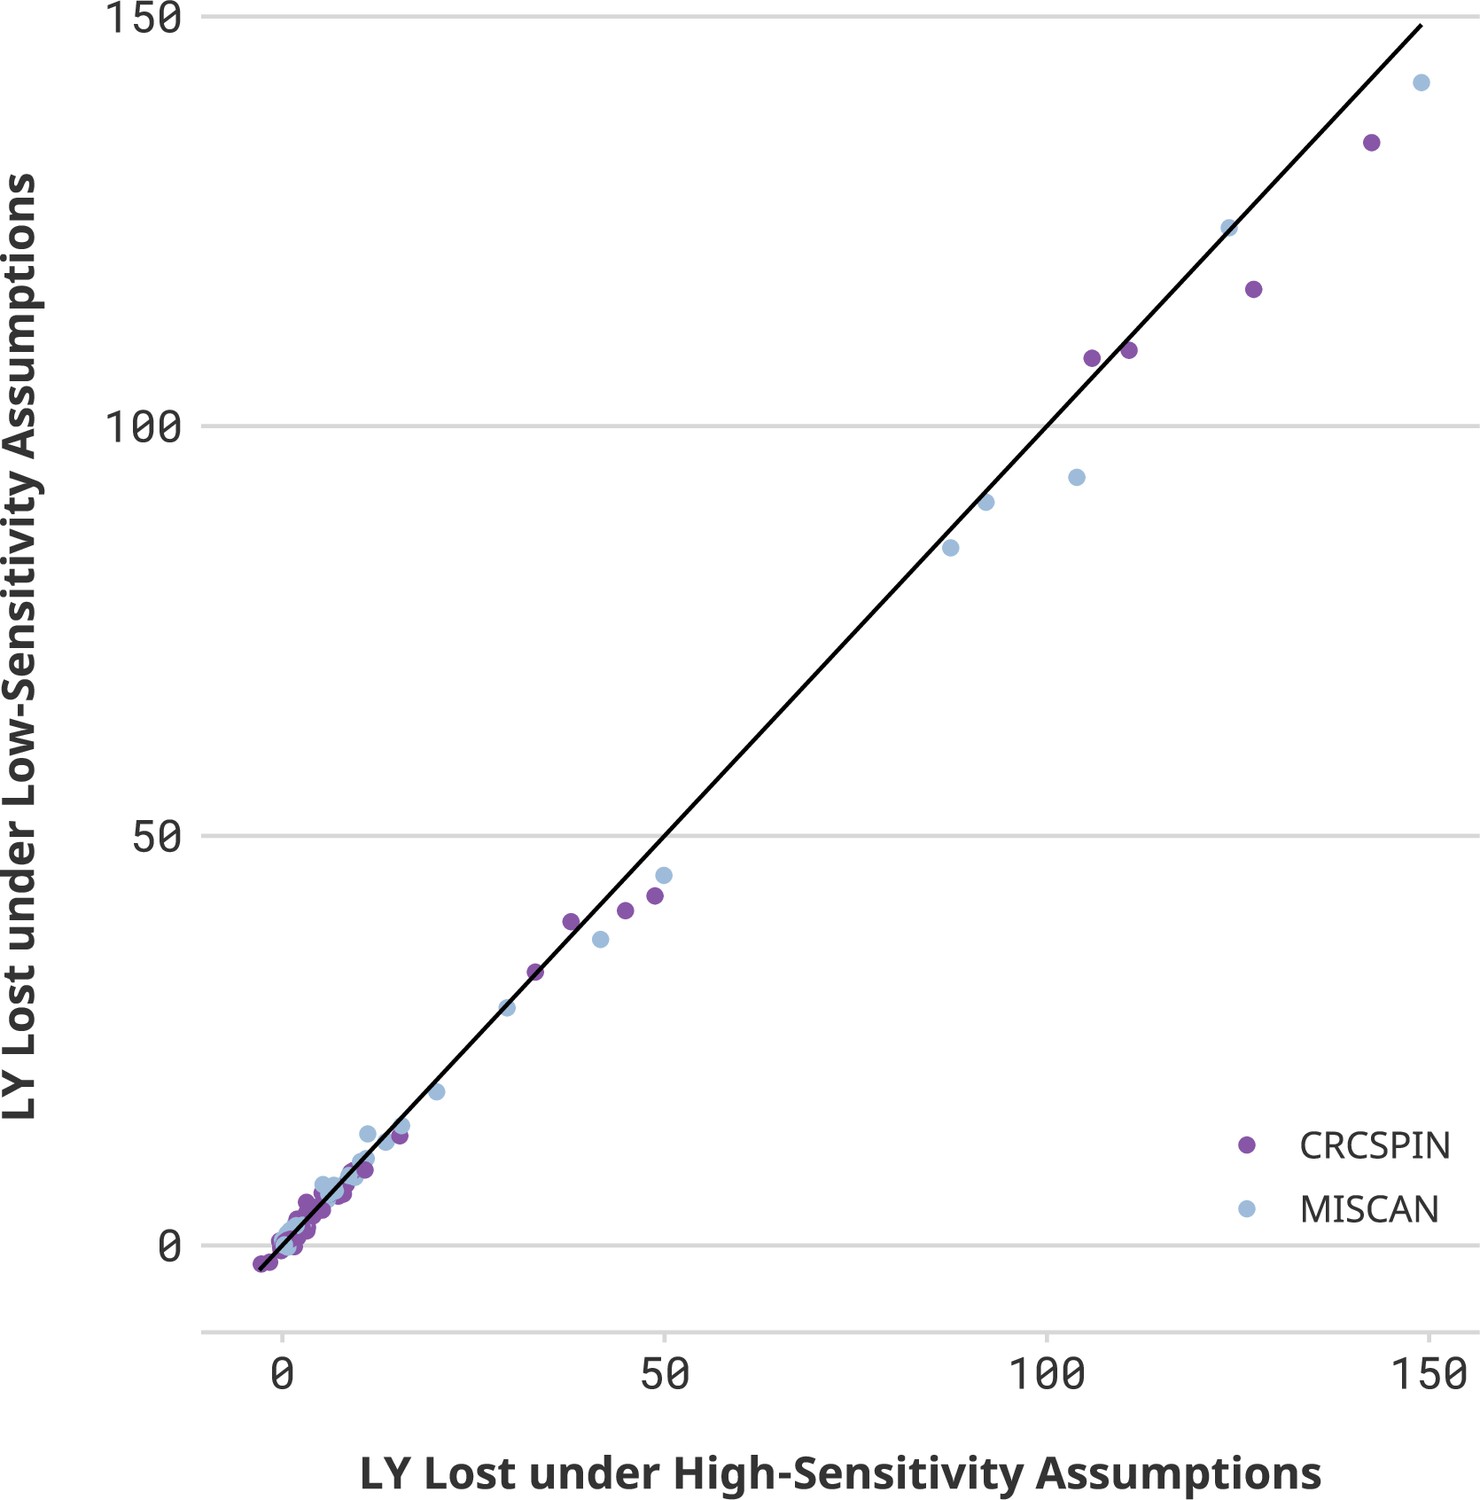
Life-years lost in high- vs. low-sensitivity scenarios.
Notes: Each dot represents one scenario considered in this study. The horizontal axis displays the number of life-years lost due to disruptions (LYL) estimated in that scenario under a high colonoscopy sensitivity scenario. The vertical axis shows the results for the same cohort under a low colonoscopy sensitivity scenario. If sensitivity did not affect the estimate, then all points would be on top of a 45-degree line. Different colors represent CRCSPIN and MISCAN models.
Tables
Table 1
Study cohorts and scenarios.
| Cohort | No-disruption counterfactual | CRC screening disruption scenario | |
|---|---|---|---|
| Description | Label | ||
| Unscreened 50-year-olds (U50) | Decennial COL from age 50 to 70 | Short-term delays of [d] months* | U50 | C[d]m |
| Long-term delay (COL at age 65 and 75) | U50 | C@65 | ||
| Annual FIT from age 50 to 75 | Short-term delays* | U50 | F[d]m | |
| Unscreened 60-year-olds (U60) | Decennial COL from age 60 to 70 | Short-term delays* | U60 | C[d]m |
| Long-term delay (COL at age 65 and 75) | U60 | C@65 | ||
| Annual FIT from age 60 to 75 | Short-term delays* | U60 | F[d]m | |
| COL-adherent 60-year-olds (C60) | Decennial COL from age 50 to 70 | Short-term delays* | C60 | C[d]m |
| Switch to annual FIT and short-term delays | C60 | F[d]m | ||
| Long-term delay (COL at age 65 and 75) | C60 | C@65 | ||
| Discontinue screening | C60 | U | ||
| FIT-adherent 60-year-olds (F60) | Annual FIT from age 50 to 75 | Short-term delays* | F60 | F[d]m |
| Discontinue screening | F60 | U | ||
| FIT-semi-adherent 60-year-olds (f60) | Biannual FIT from age 50 to 56, annual FIT from age 60 to 75 | Short-term delays* | f60 | F[d]m |
| Discontinue screening | f60 | U | ||
| Unscreened 70-year-olds (U70) | COL at age 70 | Short-term delays* | U70 | C[d]m |
| Long-term delay (COL at age 75) | U70 | C@75 | ||
| Annual FIT from age 70 to 75 | Short-term delays | U70 | F[d]m | |
| COL-adherent 70-year-olds (C70) | Decennial COL from age 50 to 70 | Short-term delays* | C70 | C[d]m |
| Switch to annual FIT and short-term delays | C70 | F[d]m | ||
| Long-term delay Perform COL at age 75 | C70 | C@75 | ||
| Discontinue screening | C70 | U | ||
| FIT-adherent 70-year-olds (F70) | Annual FIT from age 50 to 75 | Short-term delays* | F70 | F[d]m |
| Discontinue screening | F70 | U | ||
-
Notes: This table presents the scenarios considered in this study. Each scenario corresponds to a combination of a population cohort, indicated by their age during the first COVID-19 lockdowns (March 2020), a pre-pandemic, and a post-pandemic screening regimen. The scenarios aim to represent possible combinations of screening regimens followed in the United States. The first letter in the scenario code represents screening before the pandemic and the second letter represents screening after the pandemic.
-
*
Delays of 3, 9, and 18 months. Letter d stands for the number of months of delays.
Table 2
Per lesion test sensitivity and specificity.
| Sensitivity* | Specificity† | ||||
|---|---|---|---|---|---|
| Test | Adenoma1–5 mm | Adenoma6–9 mm | Adenoma ≥10 mm | Preclinical cancer | |
| Colonoscopy, high sensitivity‡ | 0.75 | 0.85 | 0.95 | 0.95 | 0.86 |
| Colonoscopy, low sensitivity§ | 0.55 | 0.70 | 0.90 | 0.95 | 0.86 |
| FIT¶ | |||||
| MISCAN | 0.00 | 0.114 | 0.159 | 0.62565/0.886 | 0.97 |
| CRC-SPIN | 0.05 | 0.15 | 0.22 | *0.74 | 0.97 |
-
Notes: This table presents the assumed test characteristics. We simulated two colonoscopy sensitivity scenarios seeking to represent a range of colonoscopy sensitivity of gastroenterologists in the United States.
-
*
Sensitivity is for lesions within reach of the scope. We assume the same test characteristics for follow-up and surveillance colonoscopy as for screening colonoscopy.
-
†
For FIT, the lack of specificity reflects detection of bleeding from other causes. We assume other-cause bleeding is independent of adenoma status. For colonoscopy, the lack of specificity reflects detection of non-adenomatous lesions, but specificity is handled in post-processing in cost-effectiveness analyses. Since this study does not consider burden outcomes, specificity is not considered in this paper. Specificity values were obtained from Lin et al., 2021.
-
‡
Baseline scenarios used in Zauber et al., 2008.
-
§
In line with low-sensitivity scenarios compatible with Rutter et al., 2022.
-
¶
CRC-SPIN uses per-person test sensitivity for stool-based tests that are based on the size of the most advanced lesion. To account for the likelihood that a person with multiple adenomas is more likely than a person with only one to have a positive stool test, MISCAN uses lesion-based sensitivities instead of person-based sensitivities. Lesion-based sensitivities were derived by calibrating the person-based sensitivities to the number of people having one or more small/medium/large adenomas or cancers detected by stool-based testing with diagnostic colonoscopy, divided by those having one or more small/medium/large adenomas or cancers detected by colonoscopy screening.
Table 3
CRC surveillance intervals.
| Finding at second-most recent colonoscopy*† | Finding at first-most recent colonoscopy*† | Interval‡ to next colonoscopy, years |
|---|---|---|
| No prior colonoscopy | Normal colonoscopy | See note below§ |
| 1–2 adenomas <10 mm | 7 | |
| 3–4 adenomas <10 mm | 3 | |
| 10 adenomas <10 mm or any adenoma ≥10 mm | 3 | |
| >10 adenomas | 1 | |
| Normal colonoscopy | Normal colonoscopy | 10 |
| 1–2 adenomas <10 mm | 7 | |
| 3–4 adenomas <10 mm | 3 | |
| 5–10 adenomas <10 mm or any adenoma ≥10 mm | 3 | |
| >10 adenomas | 1 | |
| 1–2 adenomas <10 mm | Normal colonoscopy | 10 |
| 1–2 adenomas <10 mm | 7 | |
| 3–4 adenomas <10 mm | 3 | |
| 5–10 adenomas <10 mm or any adenoma ≥10 mm | 3 | |
| >10 adenomas | 1 | |
| 3–4 adenomas <10 mm | Normal colonoscopy | 10 |
| 1–2 adenomas <10 mm | 7 | |
| 3–4 adenomas <10 mm | 3 | |
| 5–10 adenomas <10 mm or any adenoma ≥10 mm | 3 | |
| >10 adenomas | 1 | |
| 5–10 adenomas <10 mm | Normal colonoscopy | 5 |
| or | 1–2 adenomas <10 mm | 5 |
| any adenoma ≥10 mm | 3–4 adenomas <10 mm | 3 |
| 5–10 adenomas <10 mm or any adenoma ≥10 mm | 3 | |
| >10 adenomas | 1 | |
| >10 adenomas of any size | Normal colonoscopy | 5 |
| 1–2 adenomas <10 mm | 5 | |
| 3–4 adenomas <10 mm | 3 | |
| 5–10 adenomas <10 mm or any adenoma ≥10 mm | 3 | |
| >10 adenomas | 1 |
-
*
A normal colonoscopy is one in which no adenomas, SSPs (not currently simulated), or CRC is detected.
-
†
This table omits the case where CRC is detected at a screening, diagnostic, or surveillance colonoscopy because the CISNET CRC models do not simulate detailed events following CRC diagnosis.
-
‡
The Multi-Society Task Force provides a range for some intervals (e.g. the interval for 3–4 adenomas <10 mm is 3–5 years). In such cases, we selected the shortest intervals provided.
-
§
A person whose first screening or diagnostic colonoscopy is normal does not enter surveillance but instead resumes screening with the original modality 10 years after the normal colonoscopy. The exception to the 10-year waiting period is when the first colonoscopy is a screening colonoscopy with an x-year interval, where x>10. In that case, the next colonoscopy is in x years.
Table 4
Projected life-years (LY) per 1000 individuals.
| Scenario | Model | No screening | Screening without disruptions | Screening with disruptions | Loss due to disruptions | |||
|---|---|---|---|---|---|---|---|---|
| LY[a] | LY[b] | LYG[b-a] | LY[c] | LYG[c-a] | LY[b-c] | % LYG loss[(b-c)/b] | ||
| U50 | C3m | CRCSPIN | 31,595 | 31,893 | 299 | 31,892 | 297 | 2 | 1 |
| MISCAN | 31,222 | 31,494 | 273 | 31,491 | 270 | 3 | 1 | |
| U50 | C9m | CRCSPIN | 31,595 | 31,893 | 299 | 31,890 | 295 | 3 | 1 |
| MISCAN | 31,222 | 31,494 | 273 | 31,490 | 268 | 5 | 2 | |
| U50 | C18m | CRCSPIN | 31,595 | 31,893 | 299 | 31,886 | 291 | 7 | 2 |
| MISCAN | 31,222 | 31,494 | 273 | 31,488 | 266 | 6 | 2 | |
| U50 | C@65 | CRCSPIN | 31,595 | 31,893 | 299 | 31,766 | 172 | 127 | 43 |
| MISCAN | 31,222 | 31,494 | 273 | 31,390 | 169 | 104 | 38 | |
| U50 | F3m | CRCSPIN | 31,595 | 31,866 | 271 | 31,865 | 270 | 1 | 0 |
| MISCAN | 31,222 | 31,483 | 261 | 31,481 | 259 | 1 | 1 | |
| U50 | F9m | CRCSPIN | 31,595 | 31,866 | 271 | 31,862 | 268 | 3 | 1 |
| MISCAN | 31,222 | 31,483 | 261 | 31,480 | 258 | 2 | 1 | |
| U50 | F18m | CRCSPIN | 31,595 | 31,866 | 271 | 31,858 | 264 | 7 | 3 |
| MISCAN | 31,222 | 31,483 | 261 | 31,478 | 256 | 5 | 2 | |
| U60 | C3m | CRCSPIN | 23,336 | 23,557 | 221 | 23,560 | 224 | -3 | -1 |
| MISCAN | 23,114 | 23,309 | 195 | 23,304 | 190 | 5 | 3 | |
| U60 | C9m | CRCSPIN | 23,336 | 23,557 | 221 | 23,555 | 219 | 2 | 1 |
| MISCAN | 23,114 | 23,309 | 195 | 23,301 | 187 | 8 | 4 | |
| U60 | C18m | CRCSPIN | 23,336 | 23,557 | 221 | 23,547 | 211 | 10 | 4 |
| MISCAN | 23,114 | 23,309 | 195 | 23,296 | 182 | 14 | 7 | |
| U60 | C@65 | CRCSPIN | 23,336 | 23,557 | 221 | 23,512 | 176 | 45 | 20 |
| MISCAN | 23,114 | 23,309 | 195 | 23,267 | 153 | 42 | 21 | |
| U60 | F3m | CRCSPIN | 23,336 | 23,528 | 191 | 23,529 | 193 | -2 | -1 |
| MISCAN | 23,114 | 23,291 | 177 | 23,288 | 174 | 3 | 1 | |
| U60 | F9m | CRCSPIN | 23,336 | 23,528 | 191 | 23,525 | 189 | 2 | 1 |
| MISCAN | 23,114 | 23,291 | 177 | 23,285 | 171 | 6 | 3 | |
| U60 | F18m | CRCSPIN | 23,336 | 23,528 | 191 | 23,519 | 183 | 8 | 4 |
| MISCAN | 23,114 | 23,291 | 177 | 23,280 | 166 | 11 | 6 | |
| C60 | C3m | CRCSPIN | 23,243 | 23,541 | 298 | 23,541 | 299 | 0 | 0 |
| MISCAN | 23,077 | 23,320 | 243 | 23,318 | 241 | 2 | 1 | |
| C60 | C9m | CRCSPIN | 23,242 | 23,541 | 298 | 23,541 | 299 | 0 | 0 |
| MISCAN | 23,077 | 23,319 | 243 | 23,317 | 240 | 2 | 1 | |
| C60 | C18m | CRCSPIN | 23,242 | 23,541 | 298 | 23,540 | 298 | 0 | 0 |
| MISCAN | 23,077 | 23,320 | 243 | 23,317 | 239 | 3 | 1 | |
| C60 | F3m | CRCSPIN | 23,242 | 23,541 | 298 | 23,532 | 289 | 9 | 3 |
| MISCAN | 23,077 | 23,320 | 243 | 23,310 | 233 | 10 | 4 | |
| C60 | F9m | CRCSPIN | 23,243 | 23,541 | 298 | 23,532 | 289 | 9 | 3 |
| MISCAN | 23,077 | 23,319 | 243 | 23,310 | 233 | 9 | 4 | |
| C60 | F18m | CRCSPIN | 23,243 | 23,541 | 298 | 23,532 | 289 | 9 | 3 |
| MISCAN | 23,077 | 23,320 | 243 | 23,309 | 232 | 11 | 4 | |
| C60 | C@65 | CRCSPIN | 23,243 | 23,541 | 298 | 23,538 | 295 | 3 | 1 |
| MISCAN | 23,077 | 23,320 | 243 | 23,308 | 231 | 11 | 5 | |
| C60 | U | CRCSPIN | 23,243 | 23,541 | 298 | 23,435 | 192 | 106 | 36 |
| MISCAN | 23,077 | 23,320 | 243 | 23,195 | 118 | 125 | 51 | |
| F60 | F3m | CRCSPIN | 23,307 | 23,579 | 272 | 23,576 | 269 | 3 | 1 |
| MISCAN | 23,144 | 23,377 | 234 | 23,377 | 233 | 0 | 0 | |
| F60 | F9m | CRCSPIN | 23,306 | 23,578 | 272 | 23,575 | 269 | 3 | 1 |
| MISCAN | 23,143 | 23,376 | 234 | 23,376 | 234 | 0 | 0 | |
| F60 | F18m | CRCSPIN | 23,307 | 23,578 | 272 | 23,573 | 267 | 5 | 2 |
| MISCAN | 23,143 | 23,377 | 234 | 23,376 | 233 | 1 | 0 | |
| F60 | U | CRCSPIN | 23,307 | 23,579 | 272 | 23,467 | 160 | 111 | 41 |
| MISCAN | 23,143 | 23,376 | 234 | 23,283 | 141 | 93 | 40 | |
| f60 | F3m | CRCSPIN | 23,314 | 23,562 | 249 | 23,560 | 247 | 2 | 1 |
| MISCAN | 23,136 | 23,355 | 219 | 23,353 | 217 | 2 | 1 | |
| f60 | F9m | CRCSPIN | 23,314 | 23,563 | 249 | 23,559 | 245 | 4 | 1 |
| MISCAN | 23,136 | 23,355 | 219 | 23,352 | 216 | 3 | 1 | |
| f60 | F18m | CRCSPIN | 23,313 | 23,562 | 249 | 23,556 | 242 | 6 | 3 |
| MISCAN | 23,136 | 23,355 | 219 | 23,350 | 214 | 5 | 2 | |
| f60 | U | CRCSPIN | 23,313 | 23,562 | 249 | 23,419 | 105 | 143 | 58 |
| MISCAN | 23,134 | 23,353 | 219 | 23,203 | 68 | 150 | 69 | |
| U70 | C3m | CRCSPIN | 15,973 | 16,102 | 128 | 16,099 | 126 | 3 | 2 |
| MISCAN | 15,748 | 15,866 | 117 | 15,857 | 108 | 9 | 8 | |
| U70 | C9m | CRCSPIN | 15,973 | 16,102 | 128 | 16,094 | 120 | 8 | 6 |
| MISCAN | 15,748 | 15,866 | 117 | 15,852 | 103 | 14 | 12 | |
| U70 | C18m | CRCSPIN | 15,973 | 16,102 | 128 | 16,086 | 113 | 16 | 12 |
| MISCAN | 15,748 | 15,866 | 117 | 15,845 | 97 | 21 | 18 | |
| U70 | C@75 | CRCSPIN | 15,973 | 16,102 | 128 | 16,052 | 79 | 50 | 39 |
| MISCAN | 15,748 | 15,866 | 117 | 15,815 | 66 | 51 | 43 | |
| U70 | F3m | CRCSPIN | 15,973 | 16,069 | 95 | 16,067 | 93 | 2 | 2 |
| MISCAN | 15,748 | 15,840 | 92 | 15,833 | 85 | 7 | 8 | |
| U70 | F9m | CRCSPIN | 15,973 | 16,069 | 95 | 16,063 | 90 | 5 | 6 |
| MISCAN | 15,748 | 15,840 | 92 | 15,830 | 81 | 10 | 11 | |
| U70 | F18m | CRCSPIN | 15,973 | 16,069 | 95 | 16,058 | 84 | 11 | 12 |
| MISCAN | 15,748 | 15,840 | 92 | 15,824 | 76 | 16 | 17 | |
| C70 | C3m | CRCSPIN | 15,683 | 15,968 | 285 | 15,968 | 285 | 0 | 0 |
| MISCAN | 15,590 | 15,824 | 234 | 15,823 | 234 | 1 | 0 | |
| C70 | C9m | CRCSPIN | 15,683 | 15,968 | 285 | 15,968 | 285 | 0 | 0 |
| MISCAN | 15,590 | 15,824 | 234 | 15,823 | 233 | 1 | 0 | |
| C70 | C18m | CRCSPIN | 15,684 | 15,969 | 285 | 15,968 | 285 | 0 | 0 |
| MISCAN | 15,589 | 15,824 | 234 | 15,822 | 233 | 2 | 1 | |
| C70 | C@75 | CRCSPIN | 15,683 | 15,968 | 285 | 15,968 | 285 | 0 | 0 |
| MISCAN | 15,590 | 15,824 | 234 | 15,819 | 229 | 5 | 2 | |
| C70 | F3m | CRCSPIN | 15,683 | 15,968 | 285 | 15,964 | 281 | 5 | 2 |
| MISCAN | 15,590 | 15,824 | 234 | 15,818 | 228 | 6 | 3 | |
| C70 | F9m | CRCSPIN | 15,683 | 15,968 | 285 | 15,964 | 281 | 4 | 1 |
| MISCAN | 15,590 | 15,824 | 234 | 15,817 | 228 | 7 | 3 | |
| C70 | F18m | CRCSPIN | 15,683 | 15,968 | 285 | 15,964 | 281 | 4 | 2 |
| MISCAN | 15,589 | 15,824 | 234 | 15,817 | 227 | 7 | 3 | |
| C70 | U | CRCSPIN | 15,683 | 15,968 | 285 | 15,930 | 247 | 38 | 13 |
| MISCAN | 15,581 | 15,815 | 234 | 15,726 | 146 | 89 | 38 | |
| F70 | F3m | CRCSPIN | 15,764 | 16,024 | 259 | 16,023 | 259 | 0 | 0 |
| MISCAN | 15,676 | 15,902 | 226 | 15,902 | 226 | 0 | 0 | |
| F70 | F9m | CRCSPIN | 15,765 | 16,024 | 259 | 16,023 | 259 | 1 | 0 |
| MISCAN | 15,677 | 15,903 | 226 | 15,903 | 225 | 1 | 0 | |
| F70 | F18m | CRCSPIN | 15,766 | 16,025 | 259 | 16,024 | 258 | 1 | 0 |
| MISCAN | 15,677 | 15,903 | 226 | 15,903 | 226 | 0 | 0 | |
| F70 | U | CRCSPIN | 15,764 | 16,024 | 259 | 15,990 | 226 | 33 | 13 |
| MISCAN | 15,677 | 15,903 | 226 | 15,873 | 196 | 30 | 13 | |
-
Notes: Outcomes calculated over the lifetime of a cohort of 1000 average-risk, CRC-free individuals with age at pandemic defined in the scenario description. The scenario column describes colorectal cancer screening disruption scenarios, as presented in Table 1. Life-years (LY) and Life-years gained (LYG) are computed over the remaining lifespan of individuals starting at the beginning of 2020. All values refer to cohort-level estimates – that is, the expected LY of an average-risk person. This table presents results assuming high colonoscopy sensitivity. Supplementary file 1 presents additional results for the low colonoscopy sensitivity scenario, and Supplementary files 2 and 3 present CRC cases and deaths outcomes.
Additional files
-
MDAR checklist
- https://cdn.elifesciences.org/articles/85264/elife-85264-mdarchecklist1-v1.pdf
-
Supplementary file 1
Projected lifetime life-years (LY) per 1,000 individuals.
- https://cdn.elifesciences.org/articles/85264/elife-85264-supp1-v1.xlsx
-
Supplementary file 2
Projected lifetime CRC cases per 1,000 individuals.
- https://cdn.elifesciences.org/articles/85264/elife-85264-supp2-v1.xlsx
-
Supplementary file 3
Projected lifetime CRC deaths per 1,000 individuals.
- https://cdn.elifesciences.org/articles/85264/elife-85264-supp3-v1.xlsx
Download links
A two-part list of links to download the article, or parts of the article, in various formats.
Downloads (link to download the article as PDF)
Open citations (links to open the citations from this article in various online reference manager services)
Cite this article (links to download the citations from this article in formats compatible with various reference manager tools)
Projected long-term effects of colorectal cancer screening disruptions following the COVID-19 pandemic
eLife 12:e85264.
https://doi.org/10.7554/eLife.85264


