Changing the incentive structure of social media platforms to halt the spread of misinformation
- Affective Brain Lab, Department of Experimental Psychology, University College London, United Kingdom
- The Max Planck UCL Centre for Computational Psychiatry and Ageing Research, University College London, United Kingdom
- Department of Brain and Cognitive Sciences, Massachusetts Institute of Technology, United States
Figures
Figure 1
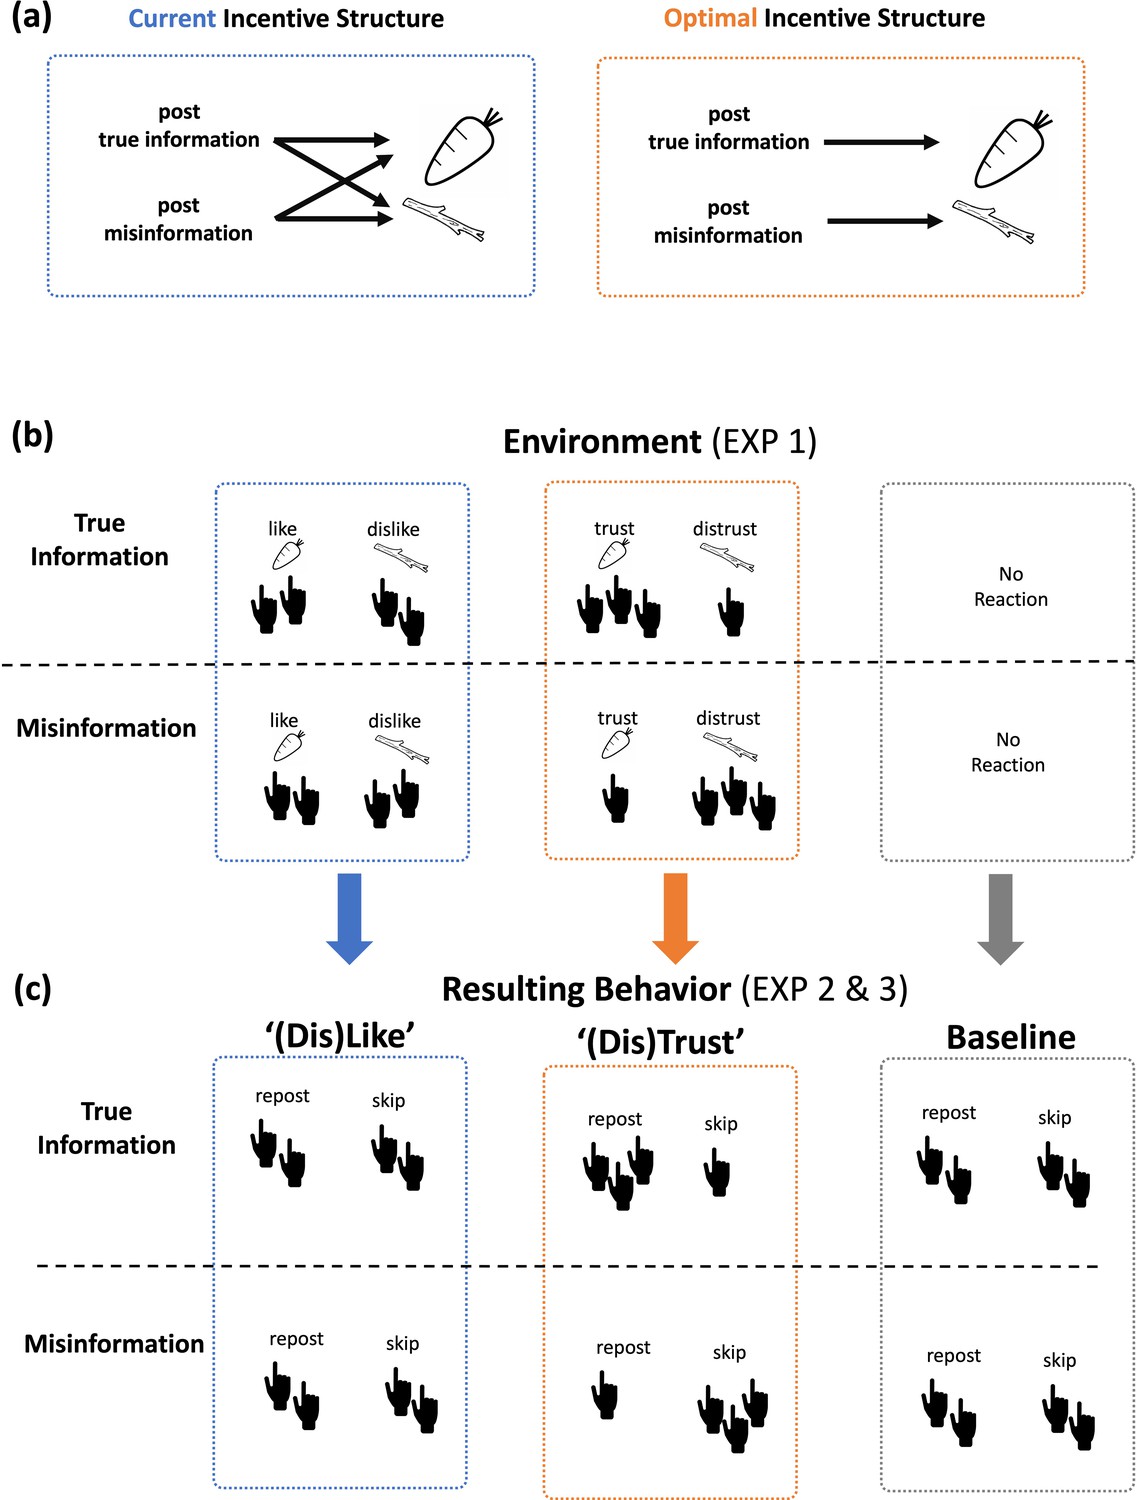
Theoretical framework.
(a) The current incentive structure (blue) is such that the veracity of shared information is dissociated from rewards (‘carrots’) and punishments (‘sticks’). That is, true information and misinformation may lead to roughly equal number of rewards and punishments. An optimal incentive structure (orange) is such that sharing true information is rewarded with more ‘carrots’ than sharing misinformation, which in turn is penalized with more ‘sticks’ than true information. To create an optimal environment, an intervention is needed by which the number of rewards and punishments are directly associated with the veracity of information. (b) We test one such possible intervention (Experiment 1). In particular, we allow people to engage with posts using ‘trust’ reaction buttons and ‘distrust’ reaction buttons (orange). The rationale is that they will use these reactions to discern true from false information more so than ‘like’ and ‘dislike’ reaction buttons. (c) As a result, to obtain a greater number of ‘trust’ carrots and a smaller number of ‘distrust’ sticks in response to a post, people in the optimal environment (orange) will share more true than misinformation compared to those in the suboptimal environment which includes no feedback at all (gray), and those in an environment where the association between veracity of information and number of carrots and sticks is weak (blue). This second step is tested in Experiments 2 and 3.
Figure 2 with 1 supplement
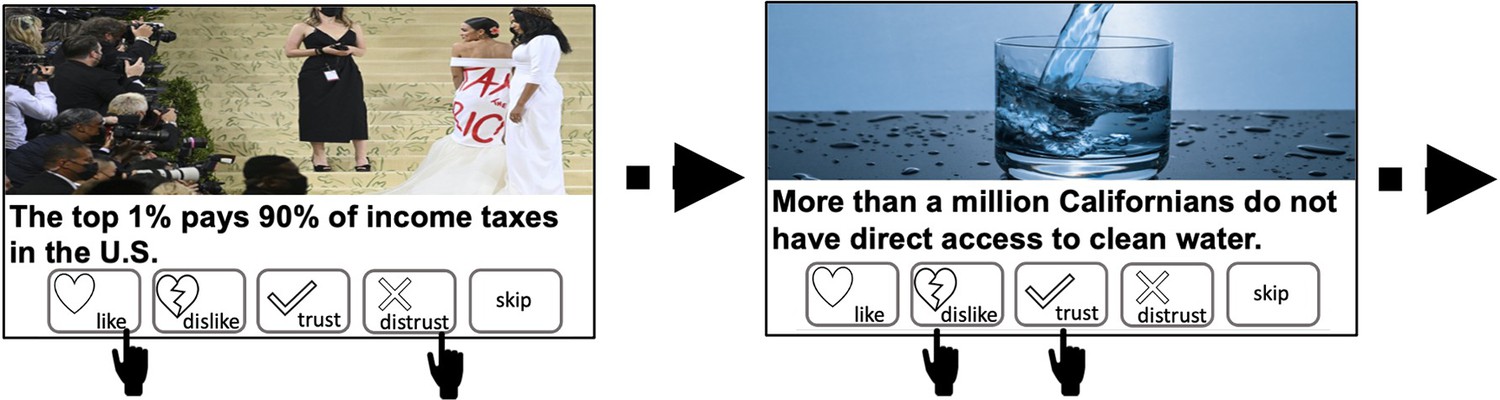
Task (Experiment 1).
Participants observed a series of 100 posts in random order (50 true, 50 false). Their task was to react using one or more of the ‘like’, ‘dislike’, ‘trust’, or ‘distrust’ buttons or to skip. The task was self-paced.
Figure 2—figure supplement 1
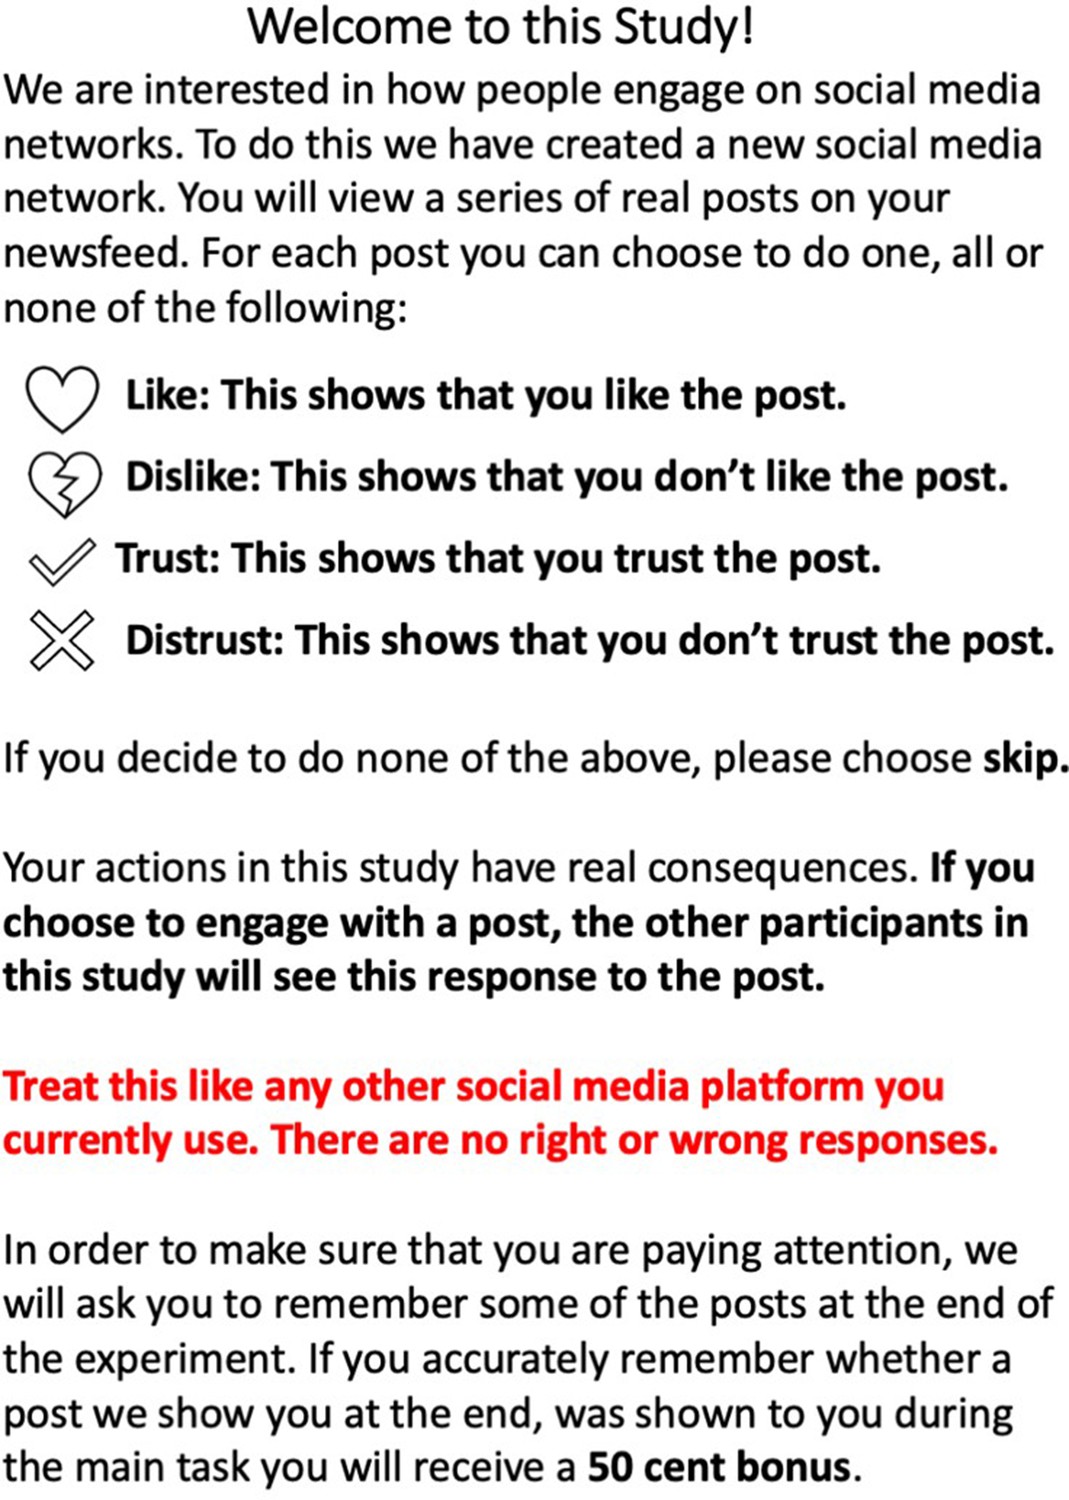
Instructions for Experiment 1.
At the start of the experiment participants received extensive instructions explaining the task.
Figure 3 with 1 supplement
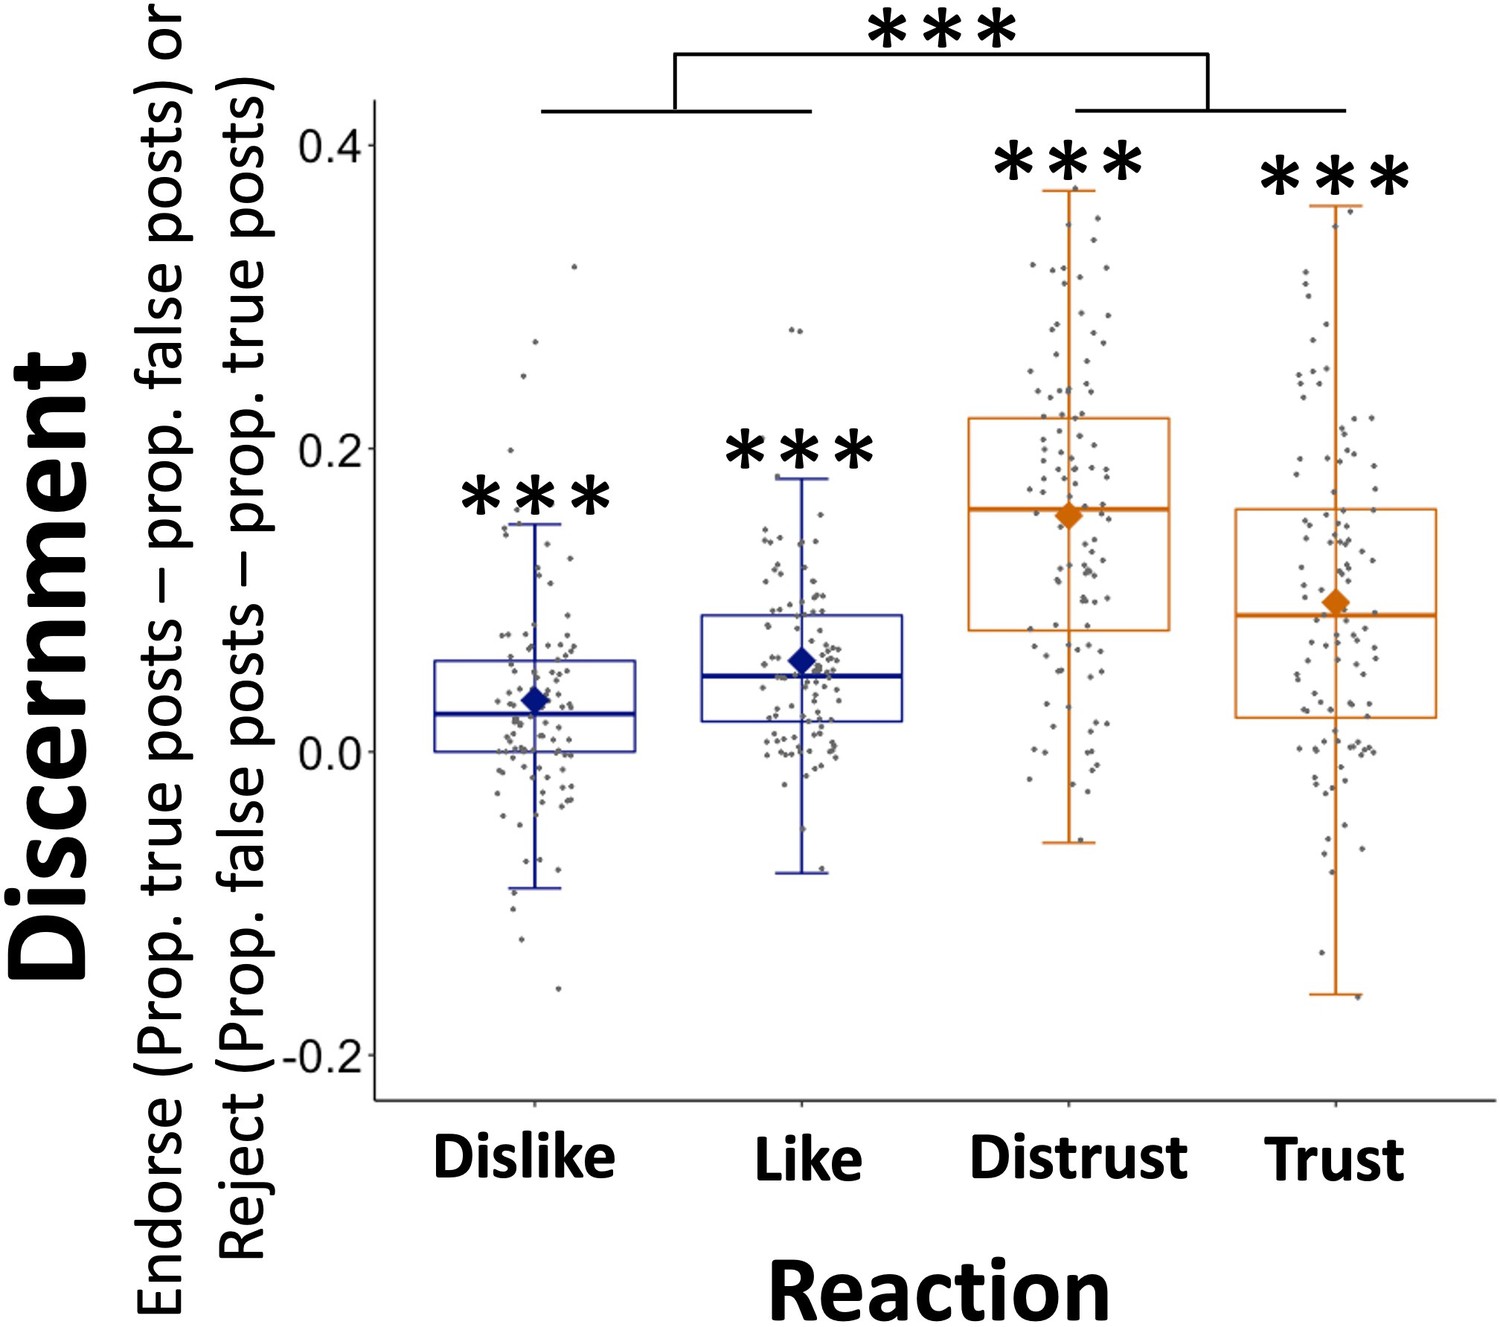
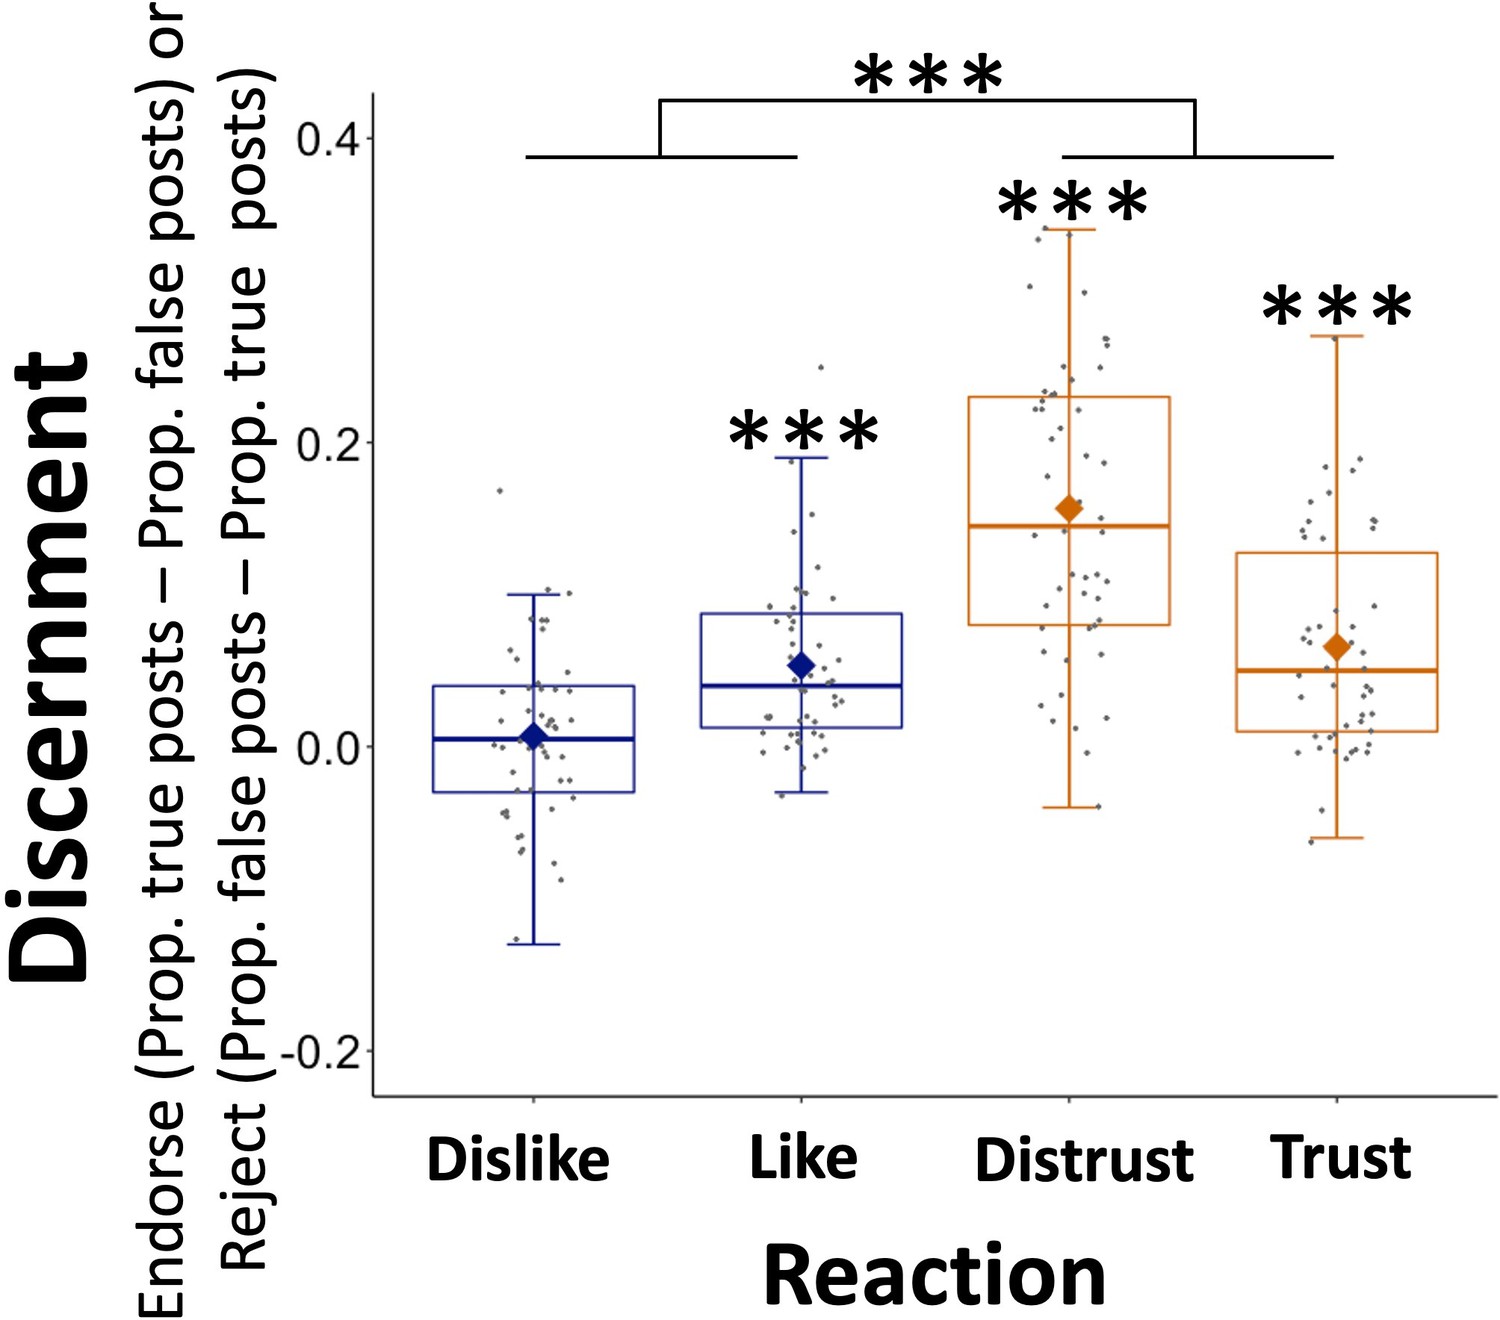
Participants use ‘trust’ and ‘distrust’ reactions to discern true from false information.
‘Distrust’ and ‘trust’ reactions were used in a more discerning manner than ‘like’ and ‘dislike’ reactions. Y axis shows discernment between true and false posts. For positive reactions (e.g., ‘likes’ and ‘trusts’), discernment is equal to the proportion of positive reactions for true information minus false information, and vice versa for negative reactions (‘dislikes’ and ‘distrusts’). X axis shows reaction options. Data are plotted as box plots for each reaction button, in which horizontal lines indicate median values, boxes indicate 25/75% interquartile range and whiskers indicate 1.5 × interquartile range. Diamond shape indicates the mean discernment per reaction. Individuals’ mean discernment data are shown separately as gray dots. Symbols above each box plot indicate significance level compared to 0 using a t-test. N=106, ***p < 0.001.
Figure 3—figure supplement 1
Participants’ use ‘(Dis)Trust’ buttons to discern true from false information (Experiment 4).
Experiment 4 is a replication of Experiment 1, in which participants (N=50) observe posts (half true half false) and can respond by clicking all, none or some of the following buttons: ‘like’, ‘dislike’, ‘trust’, and ‘distrust’ (see Materials and methods for details). Y axis shows discernment. For positive reactions (e.g., ‘likes’ and ‘trusts’) discernment is equal to the proportion of those reactions in response to true posts minus false posts, and vice versa for negative reactions (‘dislikes’ and ‘distrusts’). A 2 (type of reaction: ‘trust’ and ‘distrust’/‘like’ and ‘dislike’) by 2 (valence: positive, i.e., ‘like’, ‘trust’/negative, i.e., ‘dislike’, ‘distrust’) within-subject analysis of variance (ANOVA) revealed an effect of type of feedback (F(1,49) = 51.996, p < 0.001, partial η2 = 0.51): participants used ‘(Dis)Trust’ (M = 0.111; SE = 0.01) in a more discerning manner than ‘(Dis)Like’ (M = 0.03; SE = 0.006). There was also an effect of valence (F(1,49) = 7.147, p = 0.01, partial η2 = 0.13): participants used negative reactions (M = 0.082; SE = 0.011) in a more discerning manner than positive reactions (M = 0.06, SE = 0.006). Participants’ used all reaction buttons, except ‘dislike’, to discern between true and false posts (‘like’: M = 0.053; SE = 0.008; t(49) = 6.982, p < 0.001, Cohen’s d = 0.987; ‘trust’: M = 0.066; SE = 0.01; t(49) = 6.641, p < 0.001, Cohen’s d = 0.939; ‘dislike’: M = 0.007; SE = 0.008; t(49) = 0.883, p = 0.381, Cohen’s d = 0.125; ‘distrust’: M = 0.157; SE = 0.014; t(49) = 11.312, p < 0.001, Cohen’s d = 1.6). Data are plotted as box plots for each reaction, in which horizontal lines indicate median values, boxes indicate 25/75% interquartile range, and whiskers indicate 1.5 × interquartile range. Diamond shape indicates the mean discernment per reaction. Individuals’ mean discernment data are shown separately as gray dots. Symbols above each box plot indicate significance level compared to 0 using a t-test. ***p < 0.001.
Figure 4 with 2 supplements
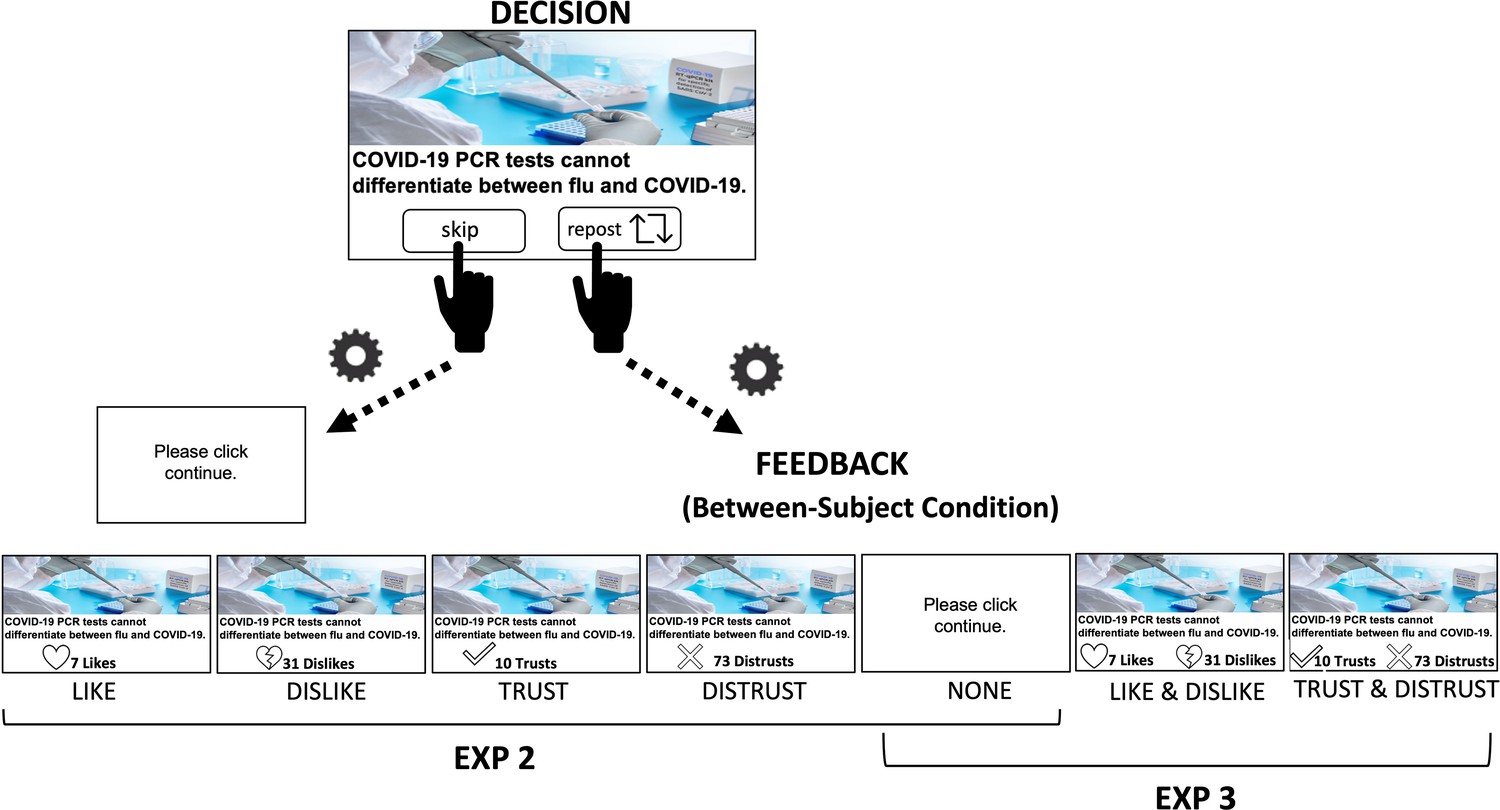
Task.
In Experiment 2 on each of 100 trials participants observed a post (50 true, 50 false content). They then chose whether to share it or skip (self-paced). They were told that if they chose to share a post, it would be shared to their feed such that other participants would be able to see the post and react to it in real time (feedback). Depending on the environment participants were in, they could either observe the number of (1) ‘dislikes’ (N = 45), (2) ‘likes’ (N = 89), (3) ‘distrusts’ (N = 49), or (4) ‘trusts’ (N = 46) feedback. The feedback was in fact the number of reactions gathered from Experiment 1, though the participants believed the reactions were in real time as indicated by a rotating cogwheel (1 s). Once the feedback appeared, participants could then click continue. If participants selected to skip, they would observe a white screen asking them to click continue (self-paced). In the Baseline environment (N = 59) participants received no feedback. Experiment 3 was identical to Experiment 2 with two distinctions: (1) Depending on the environment participants were in, they could either observe the number of (i) both ‘dislikes’ and ‘likes’ (N = 128), (ii) both ‘distrusts’ and ‘trusts’ (N = 137), or (iii) no feedback (Baseline, N = 126). (2) In Experiment 3, we selected 40 posts (20 true, 20 false) to which Republicans and Democrats had on average reacted to similarly using the ‘trust’ button in Experiment 1. Discernment was calculated for each participant by subtracting the proportion of sharing false information from the proportion of sharing true information. High discernment indicates greater sharing of true than false information.
Figure 4—figure supplement 1
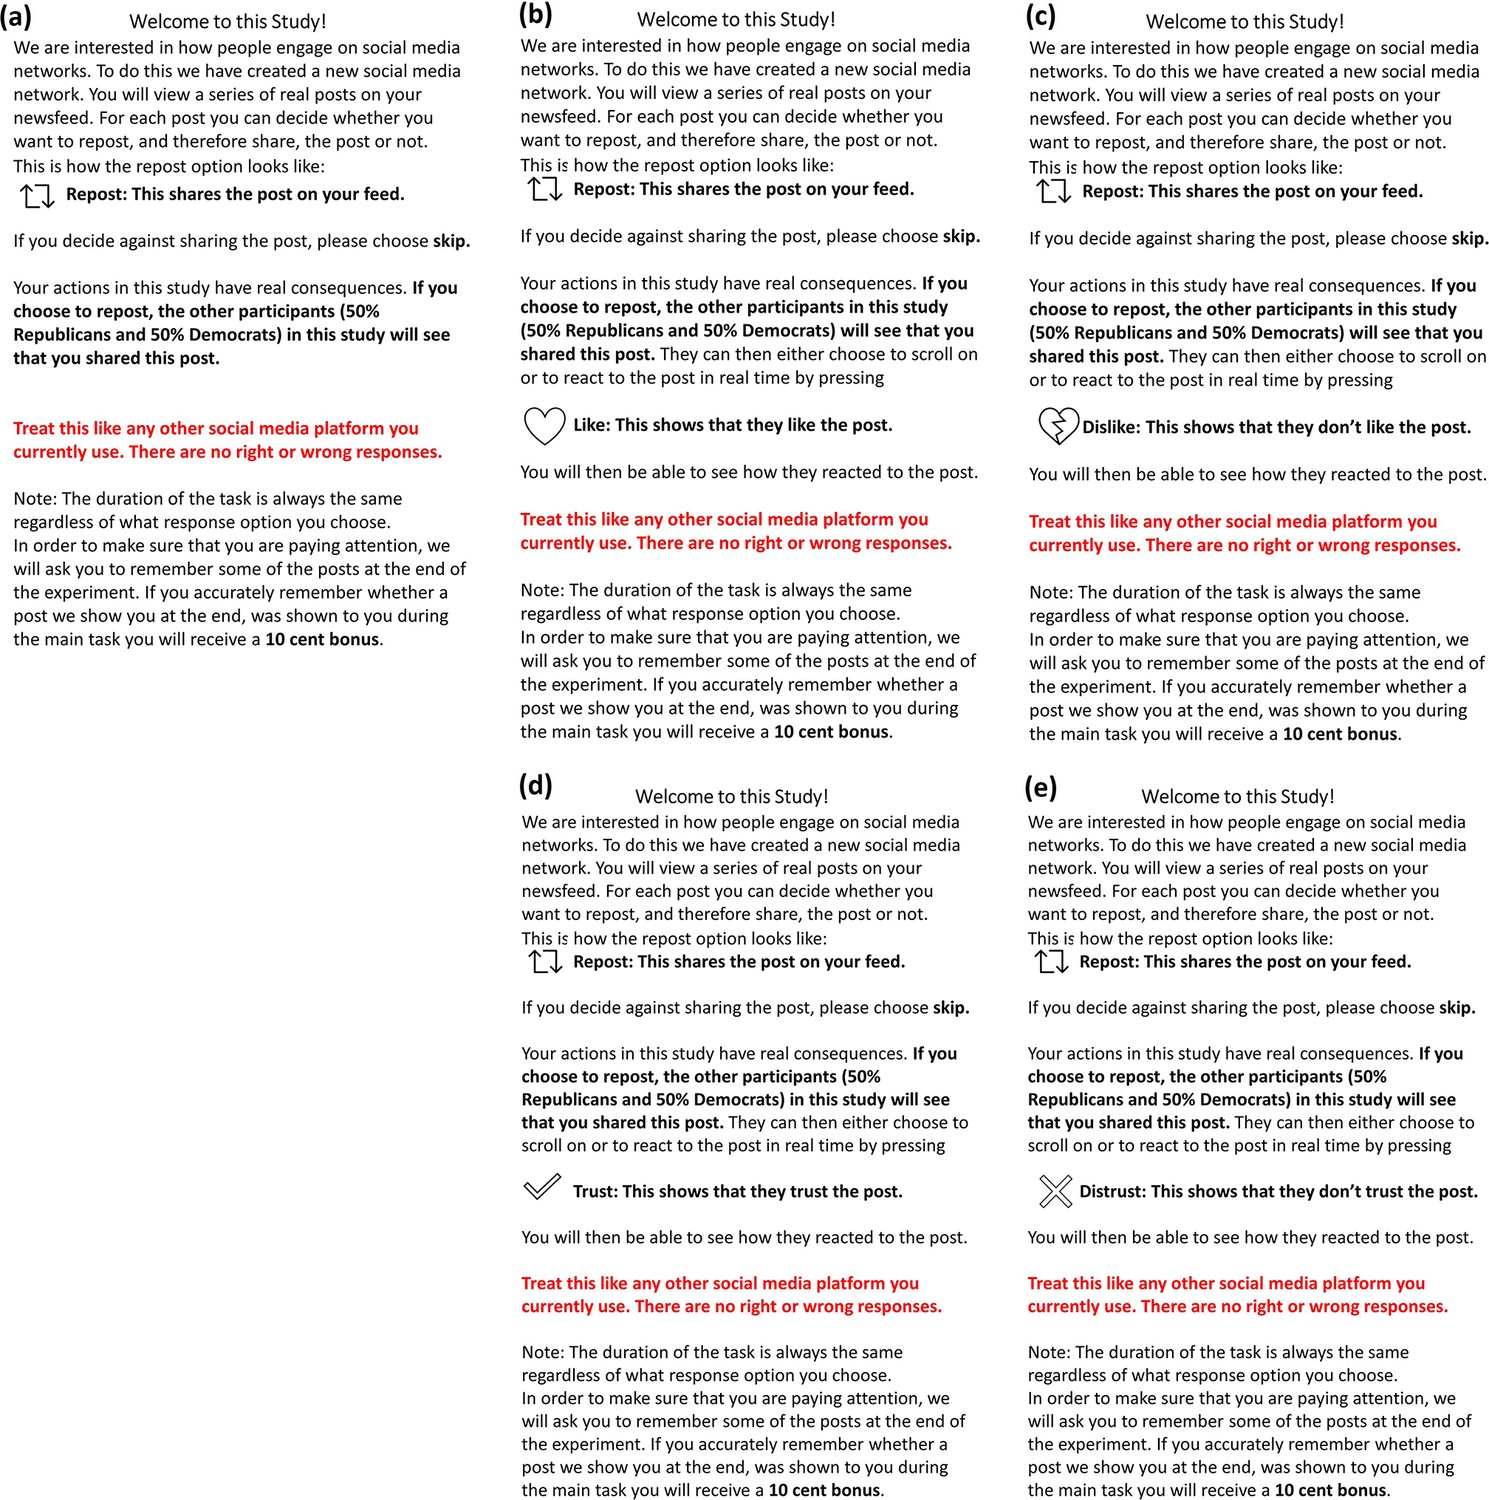
Instructions for Experiment 2.
At the start of the experiment participants received extensive instructions explaining the task. Depending on which condition they were assigned to participants would receive Instructions for either the (a) Baseline environment, (b) Like environment, (c) Dislike environment, (d) Trust environment, or (e) Distrust environment.
Figure 4—figure supplement 2
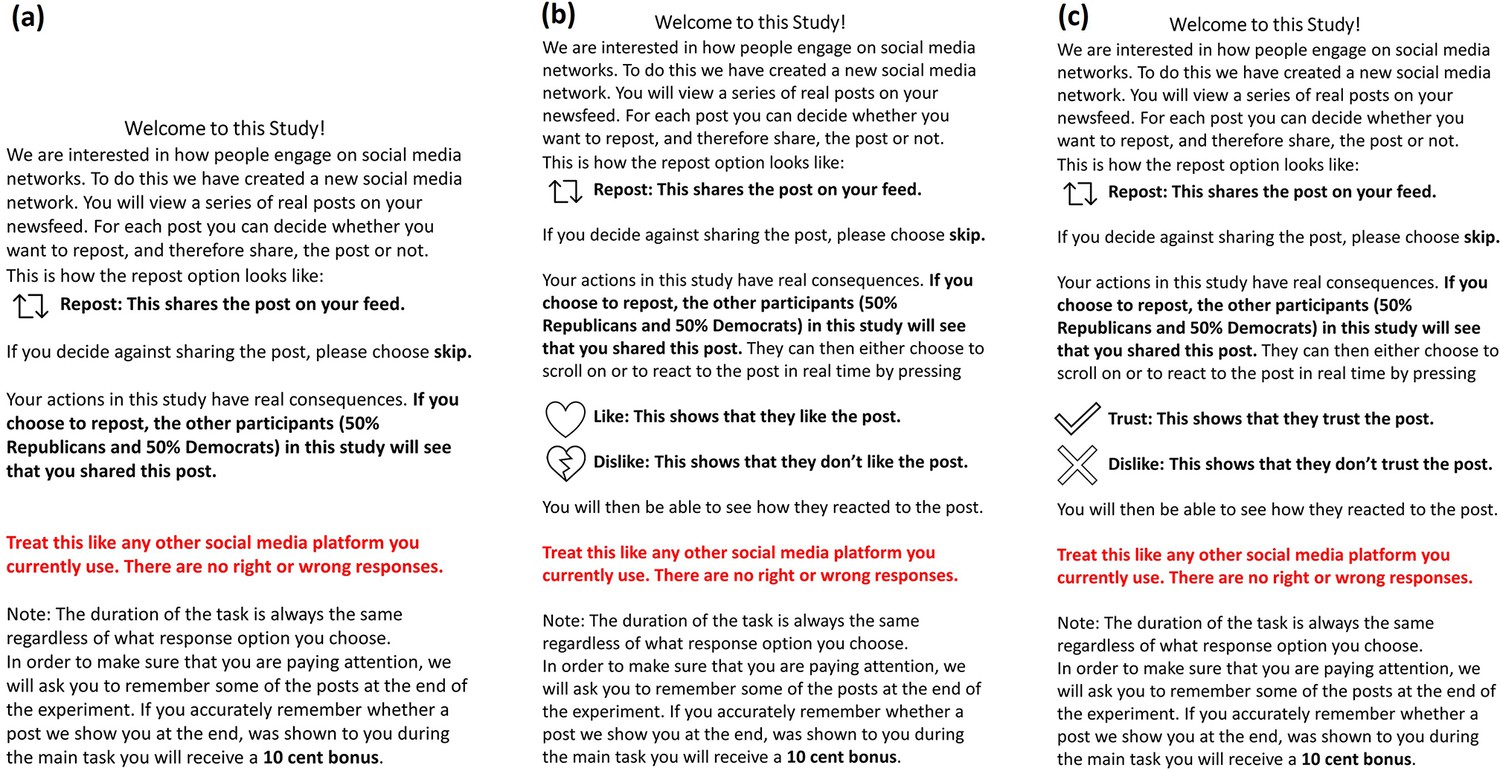
Instructions for Experiment 3.
At the start of the experiment participants received extensive instructions explaining the task. Depending on which condition they were assigned to participants would receive Instructions for either the (a) Baseline environment, (b) Like & Dislike environment, or (c) Trust & Distrust environment.
Figure 5 with 1 supplement
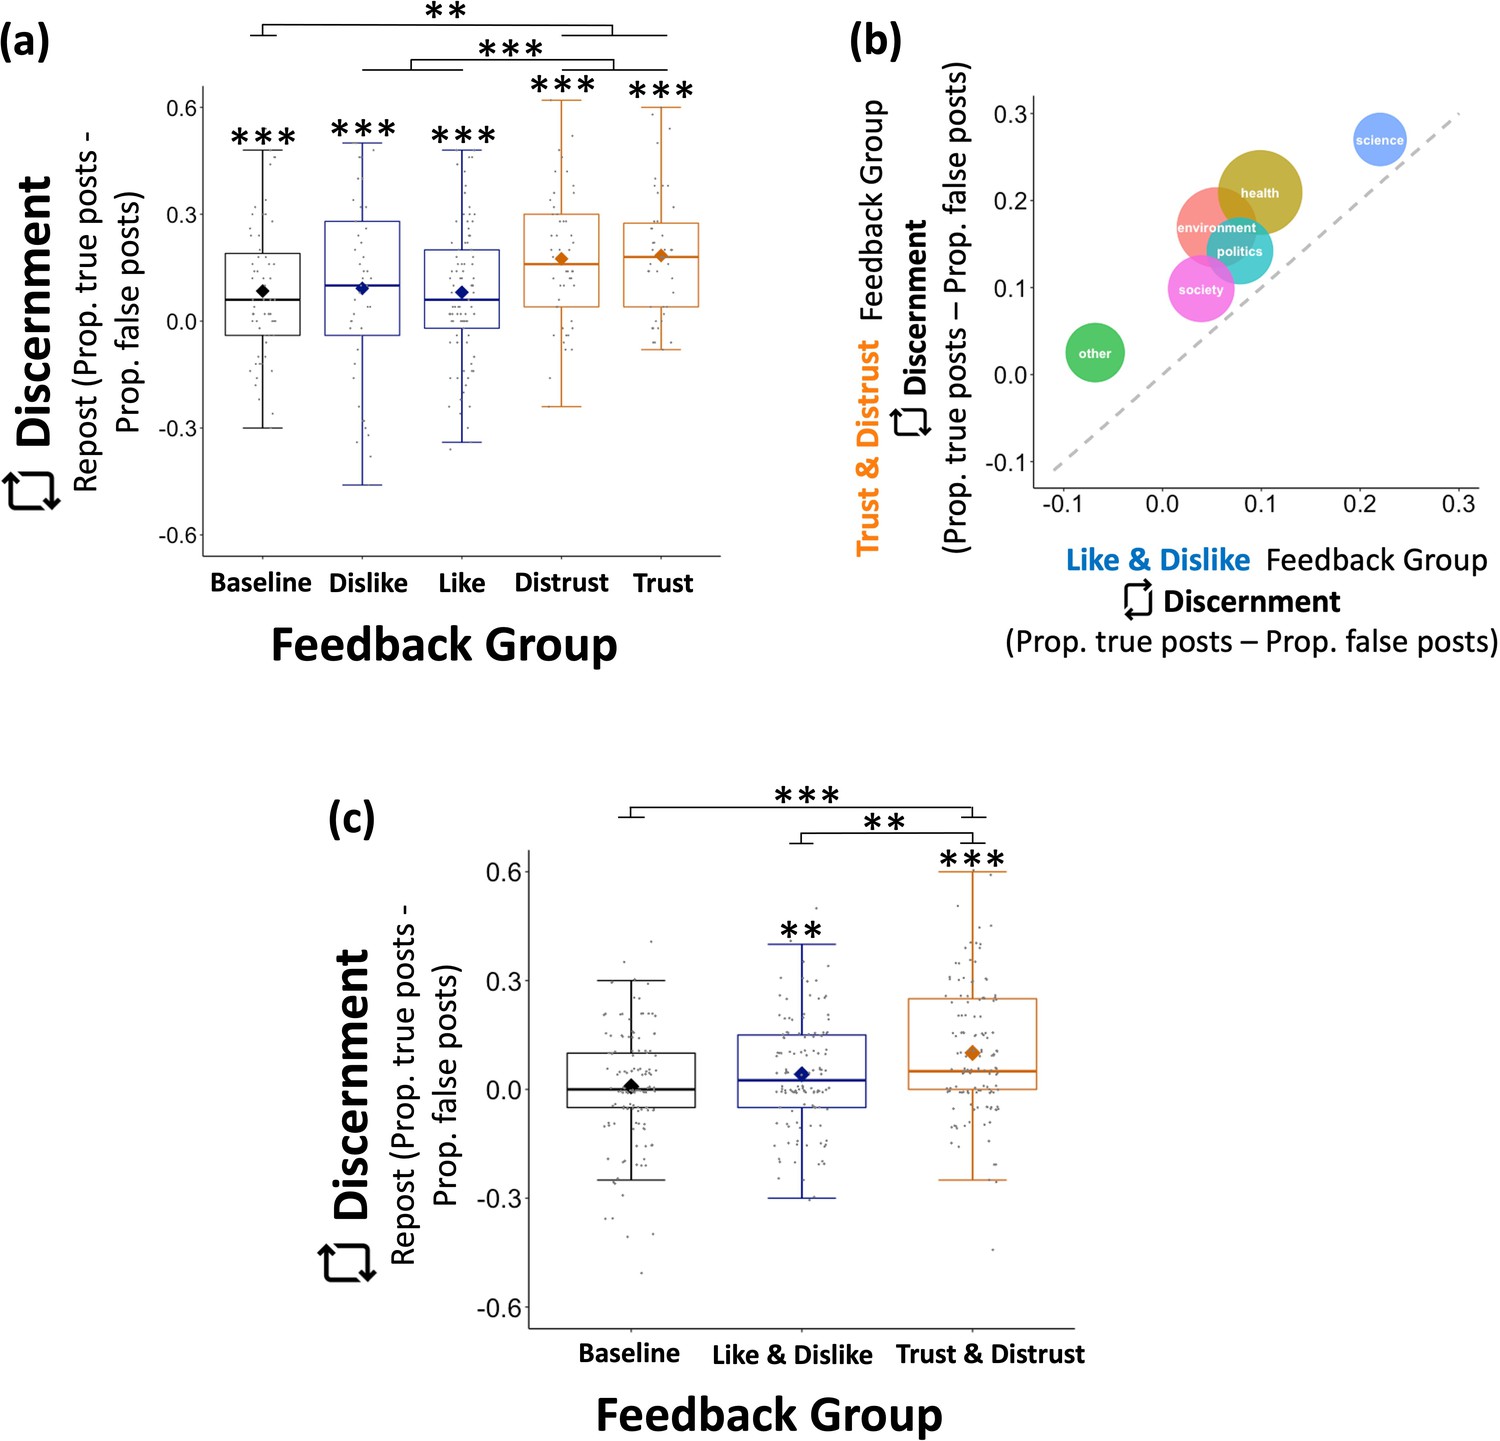
Altering the incentive structure of social media environments increases discernment of information shared.
(a) Participants (N=288) operating in an environment where ‘(Dis)Trust’ feedback was introduced shared more true information relative to false information than participants operating in an environment where only ‘(Dis)Like’ feedback was available, or no feedback at all (Baseline) Y axis shows discernment, that is, proportion of true posts shared minus proportion of false posts shared. X axis shows the group environment (type of feedback). (b) This was the case regardless of the topic of the post (politics, science, health, environment, society, other). Bubble size corresponds to number of the posts included in the study. Diagonal dashed line indicates point of equivalence, where discernment in equal across the ‘(Dis)Like’ and ‘(Dis)Trust’ environments. As can be seen, all circles are above the dashed line indicating that in all cases discernment is greater in an environment that offers ‘(Dis)Trust’ feedback. Y axis shows discernment in the ‘(Dis)Trust’ environment, X axis shows discernment in the ‘(Dis)Like’ environment. (c) Experiment 3 (N=391) showed the same results as Experiment 2. Data are plotted as box plots for each reaction, in which horizontal lines indicate median values, boxes indicate 25/75% interquartile range, and whiskers indicate 1.5 × interquartile range. Diamond shape indicates the mean discernment per reaction. Individuals’ mean discernment data are shown separately as gray dots; symbols above each box plot indicate significance level compared to 0 using a t-test.***p < 0.001, **p < 0.01.
Figure 5—figure supplement 1
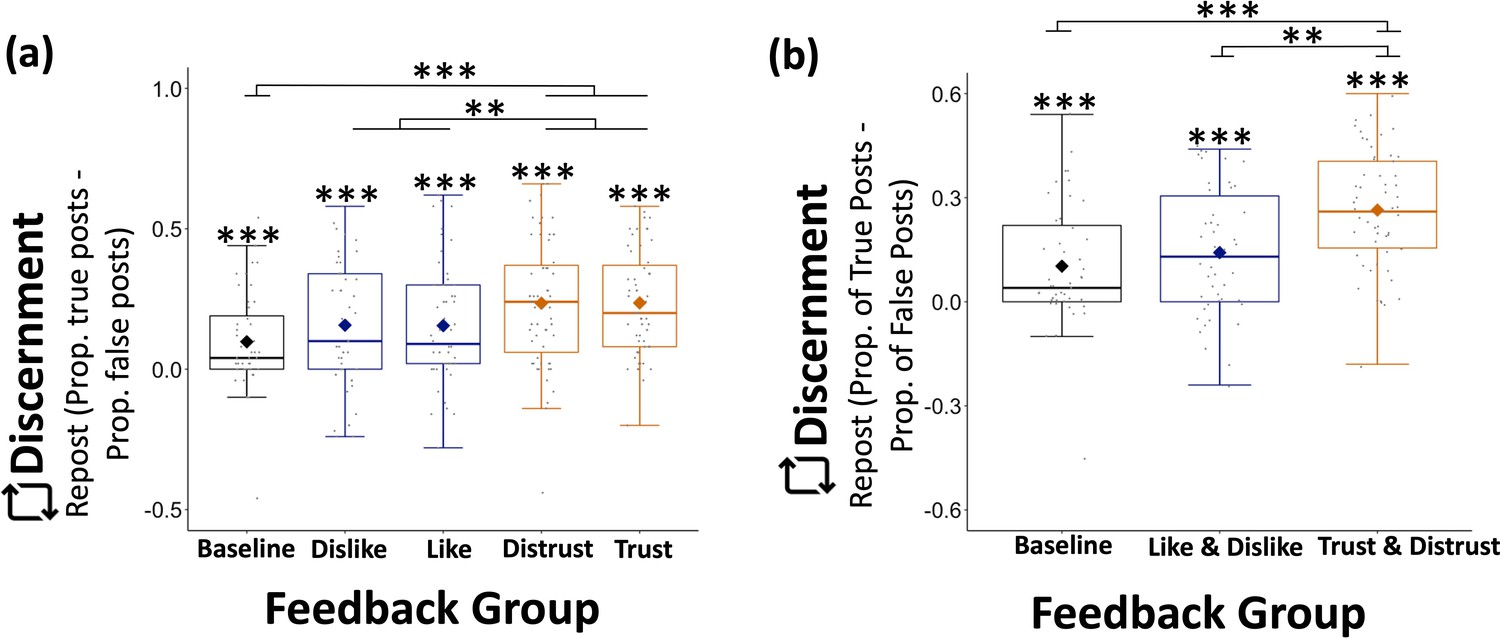
‘(Dis)Trust’ feedback improves discernment in sharing behavior (Experiments 5 and 6).
(a) Experiment 5 and (b) Experiment 6 are replications of Experiments 2 and 3. (a) In Experiment 5 participants (N=261) observed the same 100 posts (50 true, 50 false) shown to participants in Experiment 4, but instead of reacting to the posts they could either share the post or skip it. Depending on their group, participants would then receive feedback from other participants in the form of the number of either (1) ‘dislikes’, or (2) ‘likes’, or (3) ‘distrusts’, or (4) ‘trusts’. The Baseline group received no feedback (see Materials and methods for details). On the Y axis is ‘Discernment’ = proportion of sharing true information − proportion of sharing false information. A between-subject analysis of variance (ANOVA) on discernment with type of feedback (‘trust’ and ‘distrust’/‘like’ and ‘dislike’/Baseline) and valence (positive, i.e., ‘like’, ‘trust’/negative, i.e., ‘dislike’, ‘distrust’ vs neutral/no feedback) revealed an effect of type of feedback (F(1,257) = 8.112, p = 0.005, partial η2 = 0.031): discernment was greater in the ‘(Dis)Trust’ conditions (M = 0.236, SE = 0.019) than the ‘(Dis)Like’ (M = 0.111, SE = 0.022; F(1,212) = 7.682, p = 0.006, partial η2=0.035) and Baseline (M = 0.102, SE = 0.026; F(1,163) = 16.246, p < 0.001, partial η2 = 0.087) conditions. No other effects were significant. (b) Experiment 6 (N=150) was the same as Experiment 5, but with three groups: Baseline group (receiving no feedback), 'Trust & Distrust’ group, in which participants received both the number of Trust and Distrust feedback, and a ‘Like & Dislike’ environment, in which participants received the number of Like and Dislike feedback (see Materials and methods and for details). Once again, an ANOVA revealed a main effect of type of feedback (F(1,147) = 11.150, p < 0.001, partial η2 = 0.132): participants in the ‘Trust and Distrust’ group were more discerning (M = 0.264, SE = 0.023) than those in the ‘Like and Dislike’ (M = 0.147, SE = 0.027; F(1,101) = 11.122, p = 0.001, partial η2 = 0.099) and baseline (M = 0.106, SE = 0.026; F(1,101) = 21.141, p < 0.001, partial η2 = 0.173) groups. Data are plotted as box plots for each reaction, in which horizontal lines indicate median values, boxes indicate 25/75% interquartile range, and whiskers indicate 1.5 × interquartile range. Diamond shape indicates the mean discernment per reaction. Individuals’ mean discernment data are shown separately as gray dots; symbols above each box plot indicate significance level compared to 0 using a t-test . ***p < 0.001, **p < 0.01.
Figure 6
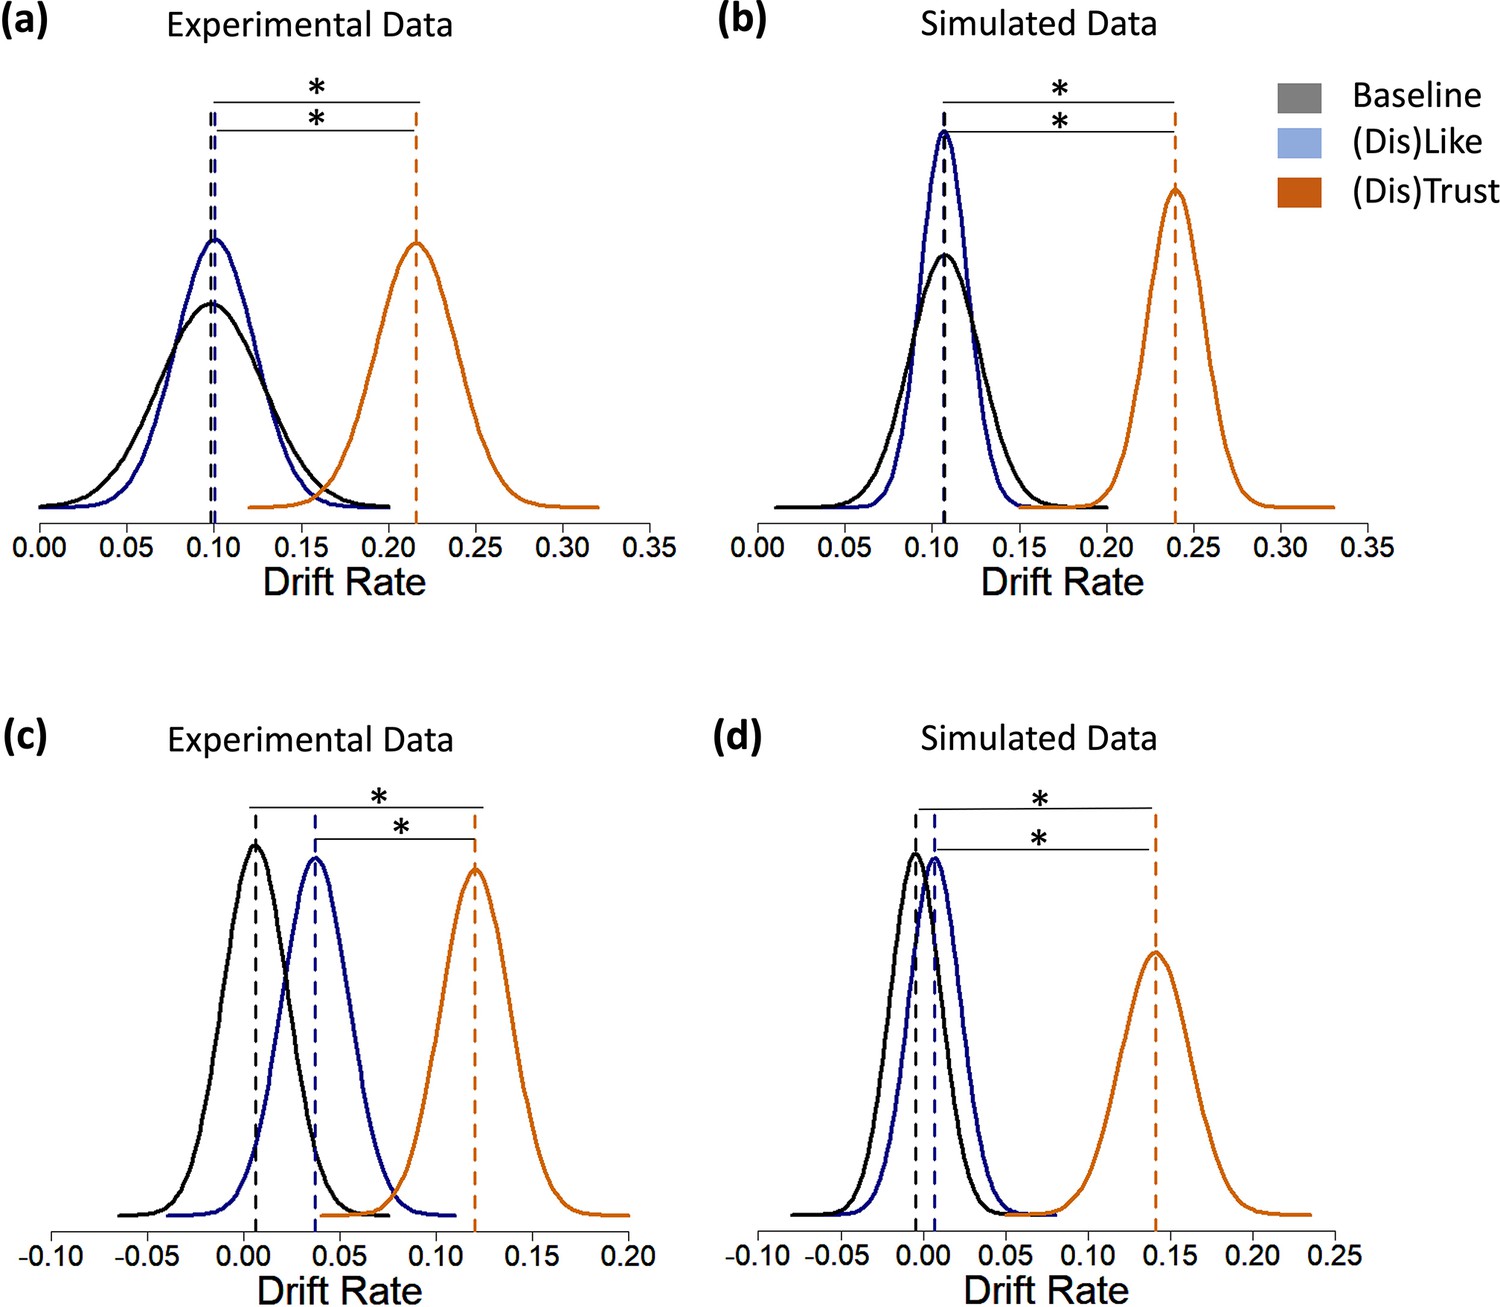
‘(Dis)Trust’ feedback increases the drift rate.
Displayed are the posterior distributions of parameter estimates for the Baseline environment, the ‘(Dis)Like’ environment and the ‘(Dis)Trust’ environment. Dashed vertical lines indicate respective group means. In both (a) Experiment 2 (N=288) and (c) Experiment 3 (N=391) highest density interval (HDI) comparison revealed that participants had a larger drift rate in the ‘(Dis)Trust’ environments than in the other environments. No credible difference was observed between the latter two environments. Recovered model parameter estimates reproduced experimental results for both (b) Experiment 2 and (d) Experiment 3. * indicates credible difference between environments.
Figure 7
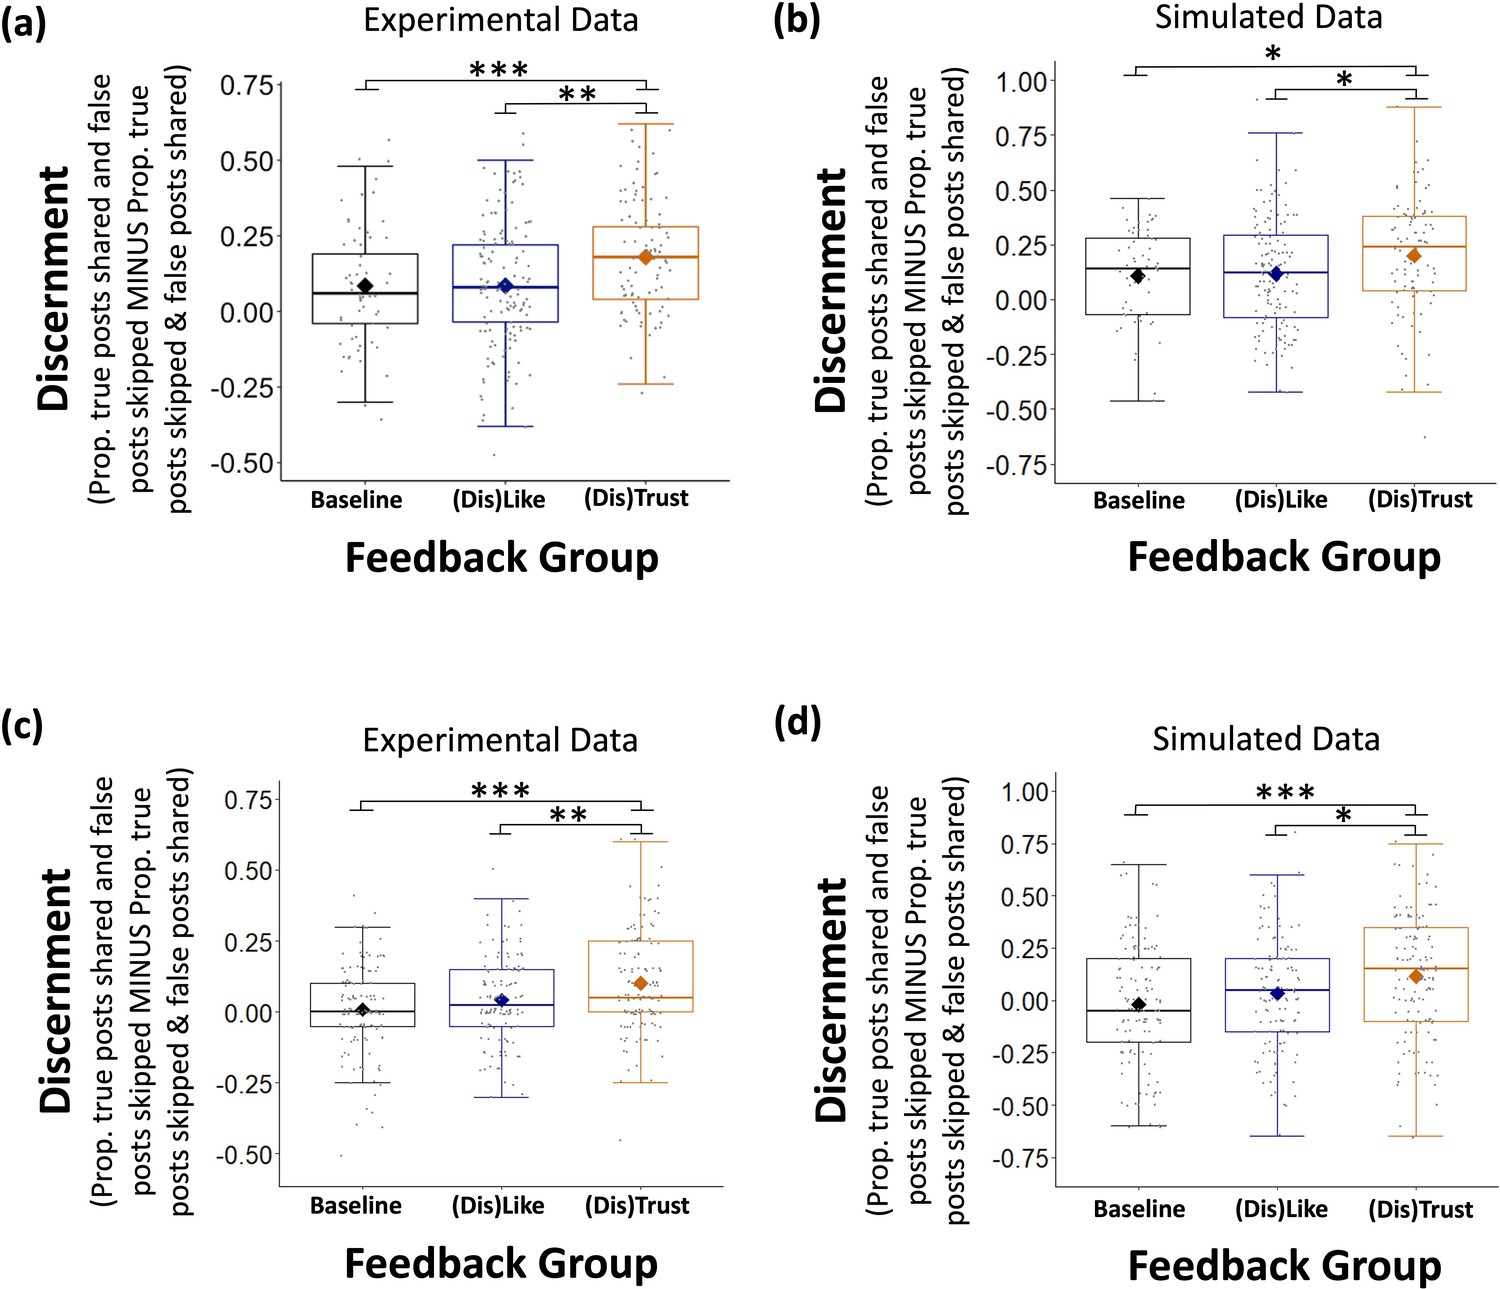
Simulated data reproduced experimental findings.
One-way ANOVAs revealed that In both (a) Experiment 2 (N=288) and (c) Experiment 3 (N=391) participants who received ‘(Dis)Trust’ feedback were more discerning than participants in the ‘(Dis)Like’ and Baseline environments. Simulated data reproduced these findings (b, d). Y axis shows discernment, that is, proportion of true posts shared and false posts skipped minus the proportion of true posts skipped and false posts shared. X axis shows feedback group. Data are plotted as box plots for each reaction, in which horizontal lines indicate median values, boxes indicate 25/75% interquartile range and whiskers indicate 1.5 × interquartile range. Diamond shape indicates the mean discernment per reaction. Individuals’ mean discernment data are shown separately as gray dots; symbols above each box plot indicate significance level compared to 0 using a t-test. ***p < 0.001, **p < 0.01, *p < 0.05.
Tables
Table 1
Group estimates for drift-diffusion model (DDM) in Experiment 2.
| Estimate | Baseline | ‘(Dis)Like’ | ‘(Dis)Trust’ |
|---|---|---|---|
| Distance between decision thresholds (α) | 2.153 95% CI [2.09; 2.214] | 2.373 95% CI [2.281; 2.466] | 2.403 95% CI [2.280; 2.529] |
| Non-decision time (t0) | 7.025 95% CI [6.898; 7.154] | 6.936 95% CI [6.802; 7.071] | 6.681 95% CI [6.425; 6.94] |
| Starting point (z) | 0.497 95% CI [0.486; 0.508] | 0.491 95% CI [0.483; 0.50] | 0.48 95% CI [0.471; 0.49] |
| Drift rate (v) | 0.098 95% CI [0.039; 0.158] | 0.10 95% CI [0.056; 0.145] | 0.216 95% CI [0.17; 0.262] |
Table 2
Group estimates for drift-diffusion model (DDM) in Experiment 3.
| Estimate | Baseline | ‘(Dis)Like’ | ‘(Dis)Trust’ |
|---|---|---|---|
| Distance between decision thresholds (α) | 2.238 95% CI [2.153; 2.328] | 2.207 95% CI [2.132; 2.286] | 2.209 95% CI [2.134; 2.286] |
| Non-decision time (t0) | 6.9 95% CI [6.762; 7.04] | 7.051 95% CI [6.918; 7.186] | 7.076 95% CI [6.944; 7.208] |
| Starting point (z) | 0.5 95% CI [0.49; 0.51] | 0.5 95% CI [0.49; 0.511] | 0.489 95% CI [0.476; 0.5] |
| Drift rate (v) | 0.006 95% CI [−0.027; 0.037] | 0.037 95% CI [0.002; 0.069] | 0.12 95% CI [0.086; 0.155] |
Additional files
-
Supplementary file 1
Discernment of reactions (Experiment 1).
- https://cdn.elifesciences.org/articles/85767/elife-85767-supp1-v1.docx
-
Supplementary file 2
% Reactions out of all posts (Experiment 1).
- https://cdn.elifesciences.org/articles/85767/elife-85767-supp2-v1.docx
-
Supplementary file 3
Discernment of reactions (Experiment 4, including type x valence of reaction interaction).
- https://cdn.elifesciences.org/articles/85767/elife-85767-supp3-v1.docx
-
Supplementary file 4
% true and false posts shared out of all true or false posts in that feedback condition (Experiment 2).
- https://cdn.elifesciences.org/articles/85767/elife-85767-supp4-v1.docx
-
Supplementary file 5
Discernment of sharing behavior (Experiment 2).
- https://cdn.elifesciences.org/articles/85767/elife-85767-supp5-v1.docx
-
Supplementary file 6
% posts shared out of all posts (Experiment 2).
- https://cdn.elifesciences.org/articles/85767/elife-85767-supp6-v1.docx
-
Supplementary file 7
Discernment of sharing behavior (Experiment 5).
- https://cdn.elifesciences.org/articles/85767/elife-85767-supp7-v1.docx
-
Supplementary file 8
Belief Accuracy (Experiment 2).
- https://cdn.elifesciences.org/articles/85767/elife-85767-supp8-v1.docx
-
Supplementary file 9
Belief Accuracy (Experiment 5).
- https://cdn.elifesciences.org/articles/85767/elife-85767-supp9-v1.docx
-
Supplementary file 10
Discernment of sharing behavior (Experiment 3).
- https://cdn.elifesciences.org/articles/85767/elife-85767-supp10-v1.docx
-
Supplementary file 11
% posts shared out of all posts (Experiment 3).
- https://cdn.elifesciences.org/articles/85767/elife-85767-supp11-v1.docx
-
Supplementary file 12
Belief Accuracy (Experiment 3).
- https://cdn.elifesciences.org/articles/85767/elife-85767-supp12-v1.docx
-
Supplementary file 13
Mean difference in posterior distributions and 95% HDI Comparison (Experiment 2).
- https://cdn.elifesciences.org/articles/85767/elife-85767-supp13-v1.docx
-
Supplementary file 14
Mean difference in posterior distributions and 95% HDI Comparison (Experiment 3).
- https://cdn.elifesciences.org/articles/85767/elife-85767-supp14-v1.docx
-
Supplementary file 15
Group estimates for DDM (Experiment 5).
- https://cdn.elifesciences.org/articles/85767/elife-85767-supp15-v1.docx
-
Supplementary file 16
Mean difference in posterior distributions and 95% HDI Comparison (Experiment 5).
- https://cdn.elifesciences.org/articles/85767/elife-85767-supp16-v1.docx
-
Supplementary file 17
Group estimates for DDM (Experiment 6).
- https://cdn.elifesciences.org/articles/85767/elife-85767-supp17-v1.docx
-
Supplementary file 18
Mean difference in posterior distributions and 95% HDI Comparison (Experiment 6).
- https://cdn.elifesciences.org/articles/85767/elife-85767-supp18-v1.docx
-
Supplementary file 19
Recovered Group estimates for DDM based on simulated data (Experiment 2).
- https://cdn.elifesciences.org/articles/85767/elife-85767-supp19-v1.docx
-
Supplementary file 20
Recovered Group estimates for DDM based on simulated data (Experiment 3).
- https://cdn.elifesciences.org/articles/85767/elife-85767-supp20-v1.docx
-
Supplementary file 21
Pairwise Comparisons for Discernment (Experiment 2).
- https://cdn.elifesciences.org/articles/85767/elife-85767-supp21-v1.docx
-
Supplementary file 22
Pairwise Comparisons for Discernment (Experiment 3).
- https://cdn.elifesciences.org/articles/85767/elife-85767-supp22-v1.docx
-
Supplementary file 23
Correlations between participants’ real and recovered DDM estimates (Experiment 2 and Experiment 3).
- https://cdn.elifesciences.org/articles/85767/elife-85767-supp23-v1.docx
-
Supplementary file 24
Individual Ratings per Stimulus (Experiment 1).
- https://cdn.elifesciences.org/articles/85767/elife-85767-supp24-v1.docx
-
MDAR checklist
- https://cdn.elifesciences.org/articles/85767/elife-85767-mdarchecklist1-v1.pdf
Download links
A two-part list of links to download the article, or parts of the article, in various formats.
Downloads (link to download the article as PDF)
Open citations (links to open the citations from this article in various online reference manager services)
Cite this article (links to download the citations from this article in formats compatible with various reference manager tools)
Changing the incentive structure of social media platforms to halt the spread of misinformation
eLife 12:e85767.
https://doi.org/10.7554/eLife.85767


