Combining mutation and recombination statistics to infer clonal families in antibody repertoires
- Laboratoire de physique de l’École normale supérieure, CNRS, PSL University, Sorbonne Université and Université de Paris, France
- Saber Bio SAS, Institut du Cerveau, iPEPS The Healthtech Hub, France
- Department of Organismic and Evolutionary Biology, Harvard University, United States
Figures
Figure 1

Clonal families and classes.
(A) Variable region of the immunoglobulin heavy chain (IgH)-coding gene. (B) A clonal family is a lineage of related B cells stemming from the same VDJ recombination event. The partition of the B-cell receptor (BCR) repertoire into clonal families is a refinement of the partition into classes, defined by sequences with the same V and J usage and the same complementarity determining region 3 (CDR3) length . (C–D) Properties of classes in donor 326651 from Briney et al., 2019. (C) Distribution of class sizes exhibits power-law scaling. The total number of pairwise comparisons in the largest classes is . (D) Distribution of the CDR3 length . The distribution is in yellow for in-frame CDR3 sequences ( multiple of 3), and in gray for out-of-frame sequences.
Figure 2 with 7 supplements
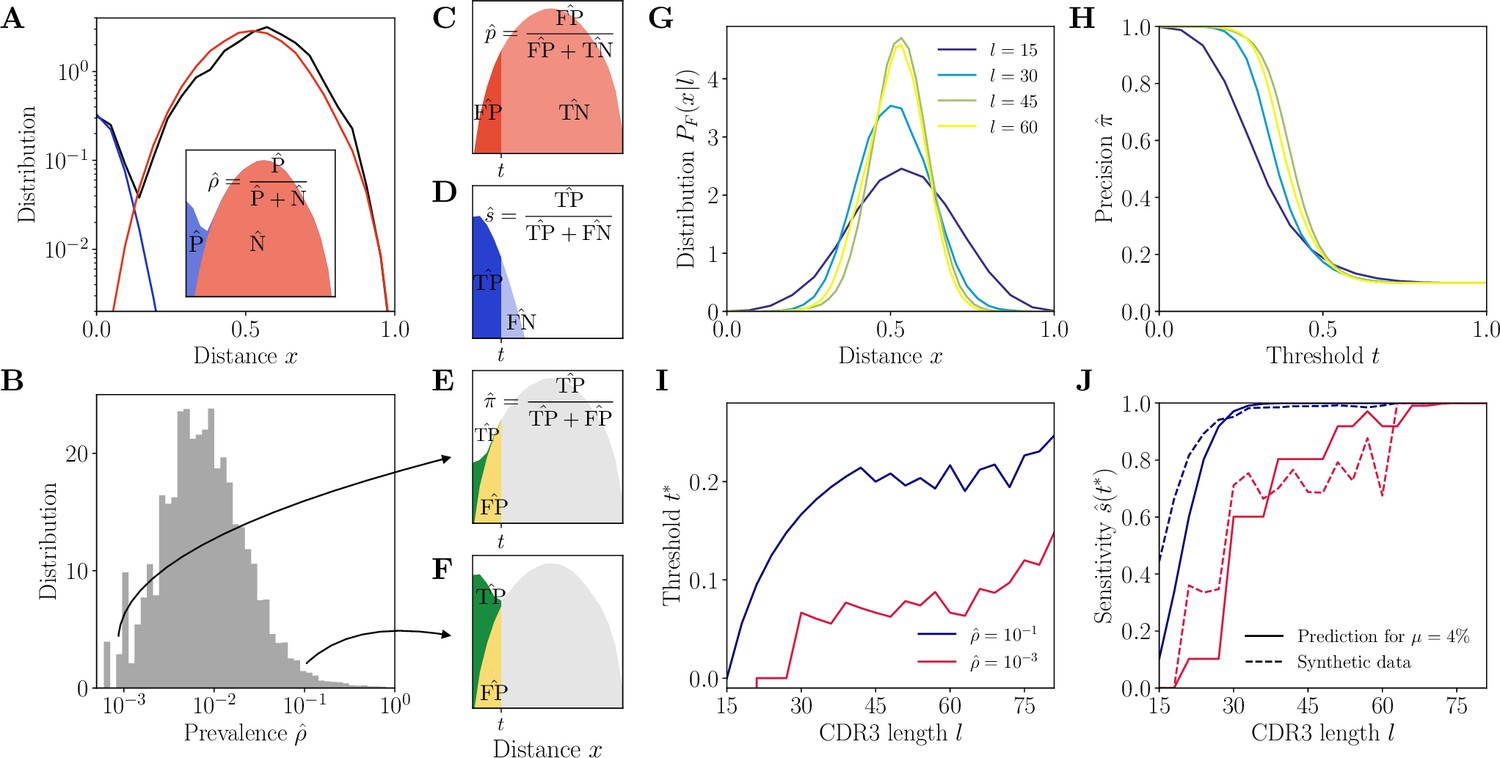
Complementarity determining region 3 (CDR3)-based inference method (HILARy-CDR3).
(A) Example distribution of normalized Hamming distances, , for one class with CDR3 length , V gene IGHV3-9 and J gene IGHJ4 (black). We fit the distribution by a mixture of positive pairs (belonging to the same family, in blue) and negative pairs (belonging to different families, in red). See Figure 2—figure supplement 5 for example fit results across different CDR3 lengths. Inset: the prevalence is defined as a fraction of positive pairs and was estimated to . Data from donor 326651 of Briney et al., 2019. (B) Distribution of the maximum likelihood estimates of prevalence across classes in donor 326651. (C–F) The choice of threshold on the normalized Hamming distance translates to the following a priori characteristics of inference (illustrated here for arbitrarily chosen and ). (C) Fallout rate . The null distribution of all negatives (N=FP + TN) is estimated using the soNNia sequence generation software. (D) Sensitivity . (E–F) Precision . For the same choice of threshold , a low prevalence of (E) leads to lower precision than high prevalence of (F). (G) Model distribution of distances between unrelated sequences, for , computed by the soNNia software. (H) Precision , computed a priori (i.e. before doing the inference) from the model with , , and (colors as in G), as a function of the threshold . For each class and its own inferred and , the threshold is chosen to achieve a desired . (I) High-precision threshold ensuring a priori, as a function of CDR3 length for different values of the prevalence , and , as predicted by the model. (J) Sensitivity at the high-precision threshold , as a function of CDR3 length for different values of the prevalence (colors as in I). Solid lines denote a priori prediction for intermediate mean distance , dashed lines denote actual performance of HILARy-CDR3 in a synthetic dataset.
Figure 2—figure supplement 1

Mean intra-family distances.
Distribution of the maximum likelihood estimates of mean intra-family distance across classes.
Figure 2—figure supplement 2

Null distribution of CDR3 distances between unrelated sequences for , computed by soNNia software.
White line denotes a growing threshold ensuring a fallout rate as determined by this distribution.
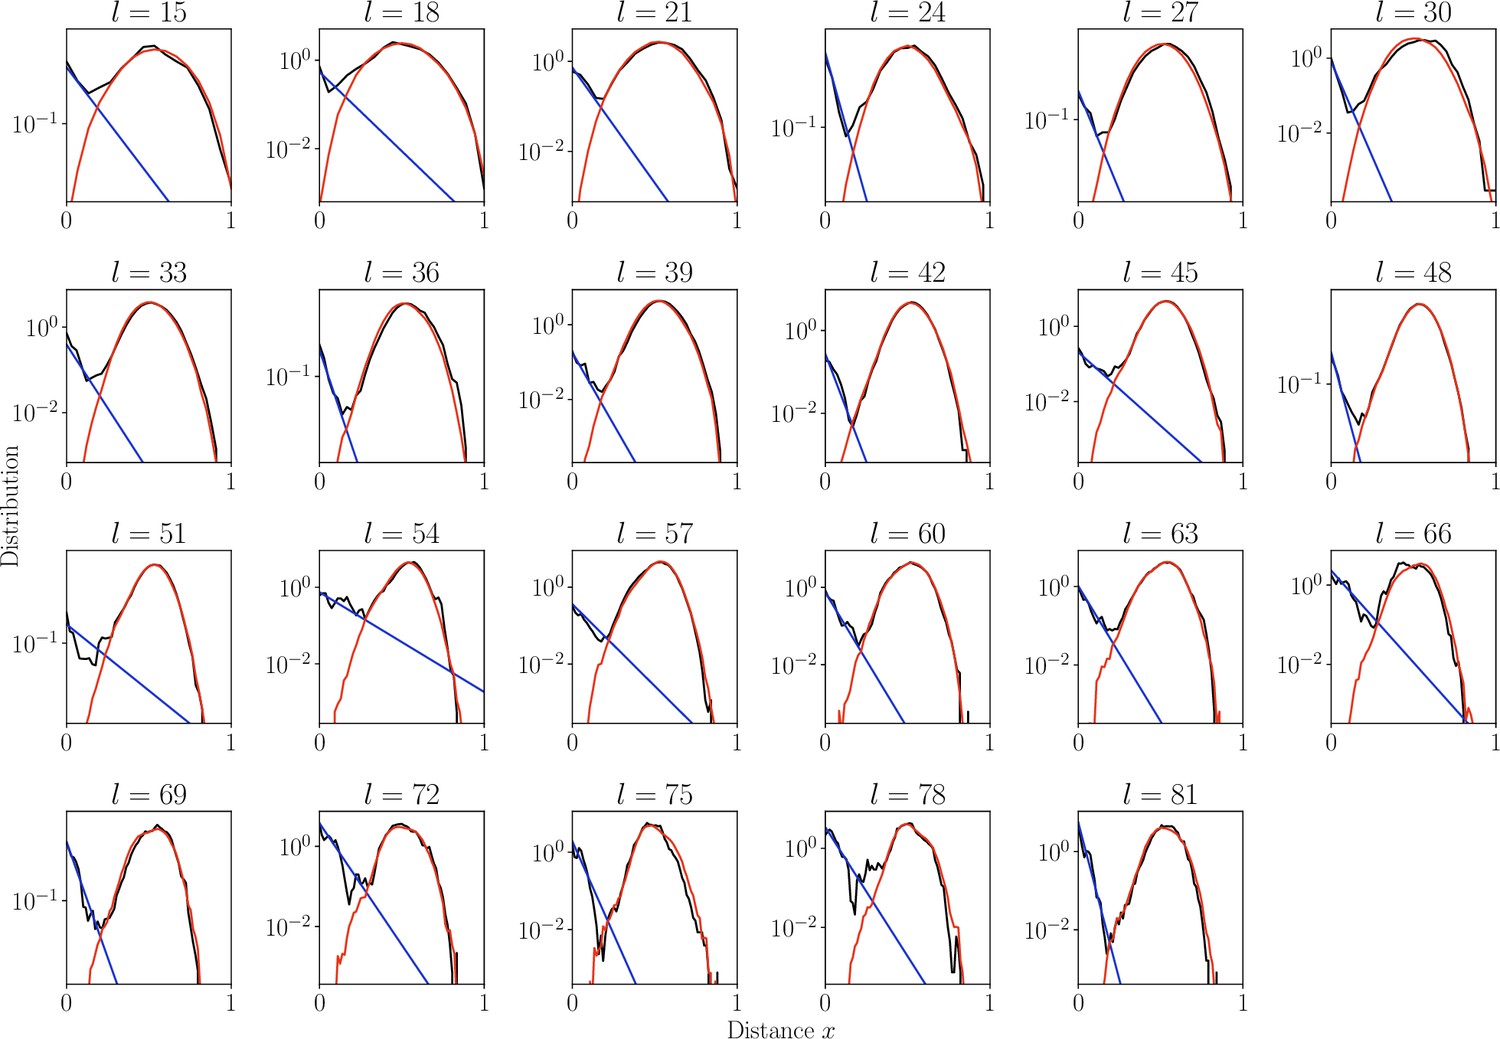
Figure 2—figure supplement 3
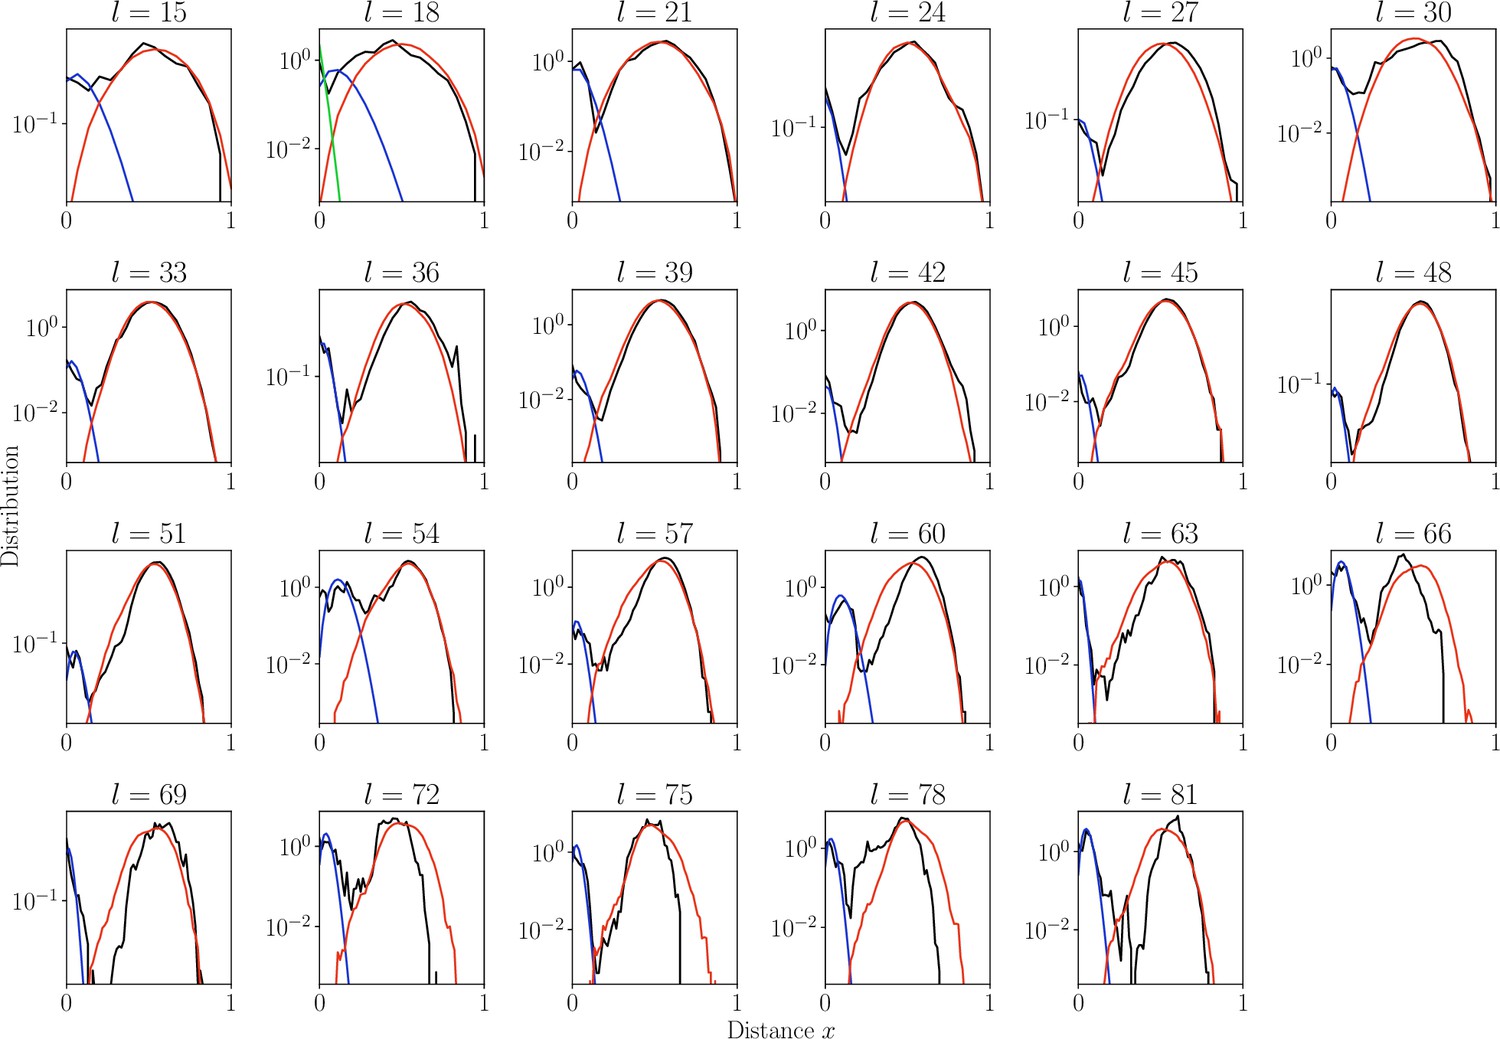
Distribution of normalized Hamming distances.
, for largest class for each CDR3 length (black). We fit the distribution by a mixture of positive pairs ( in blue), and negative pairs (, in red). For the estimate is too large results in large fitting error and for sensitivity computation we used global (in green).
Figure 2—figure supplement 4
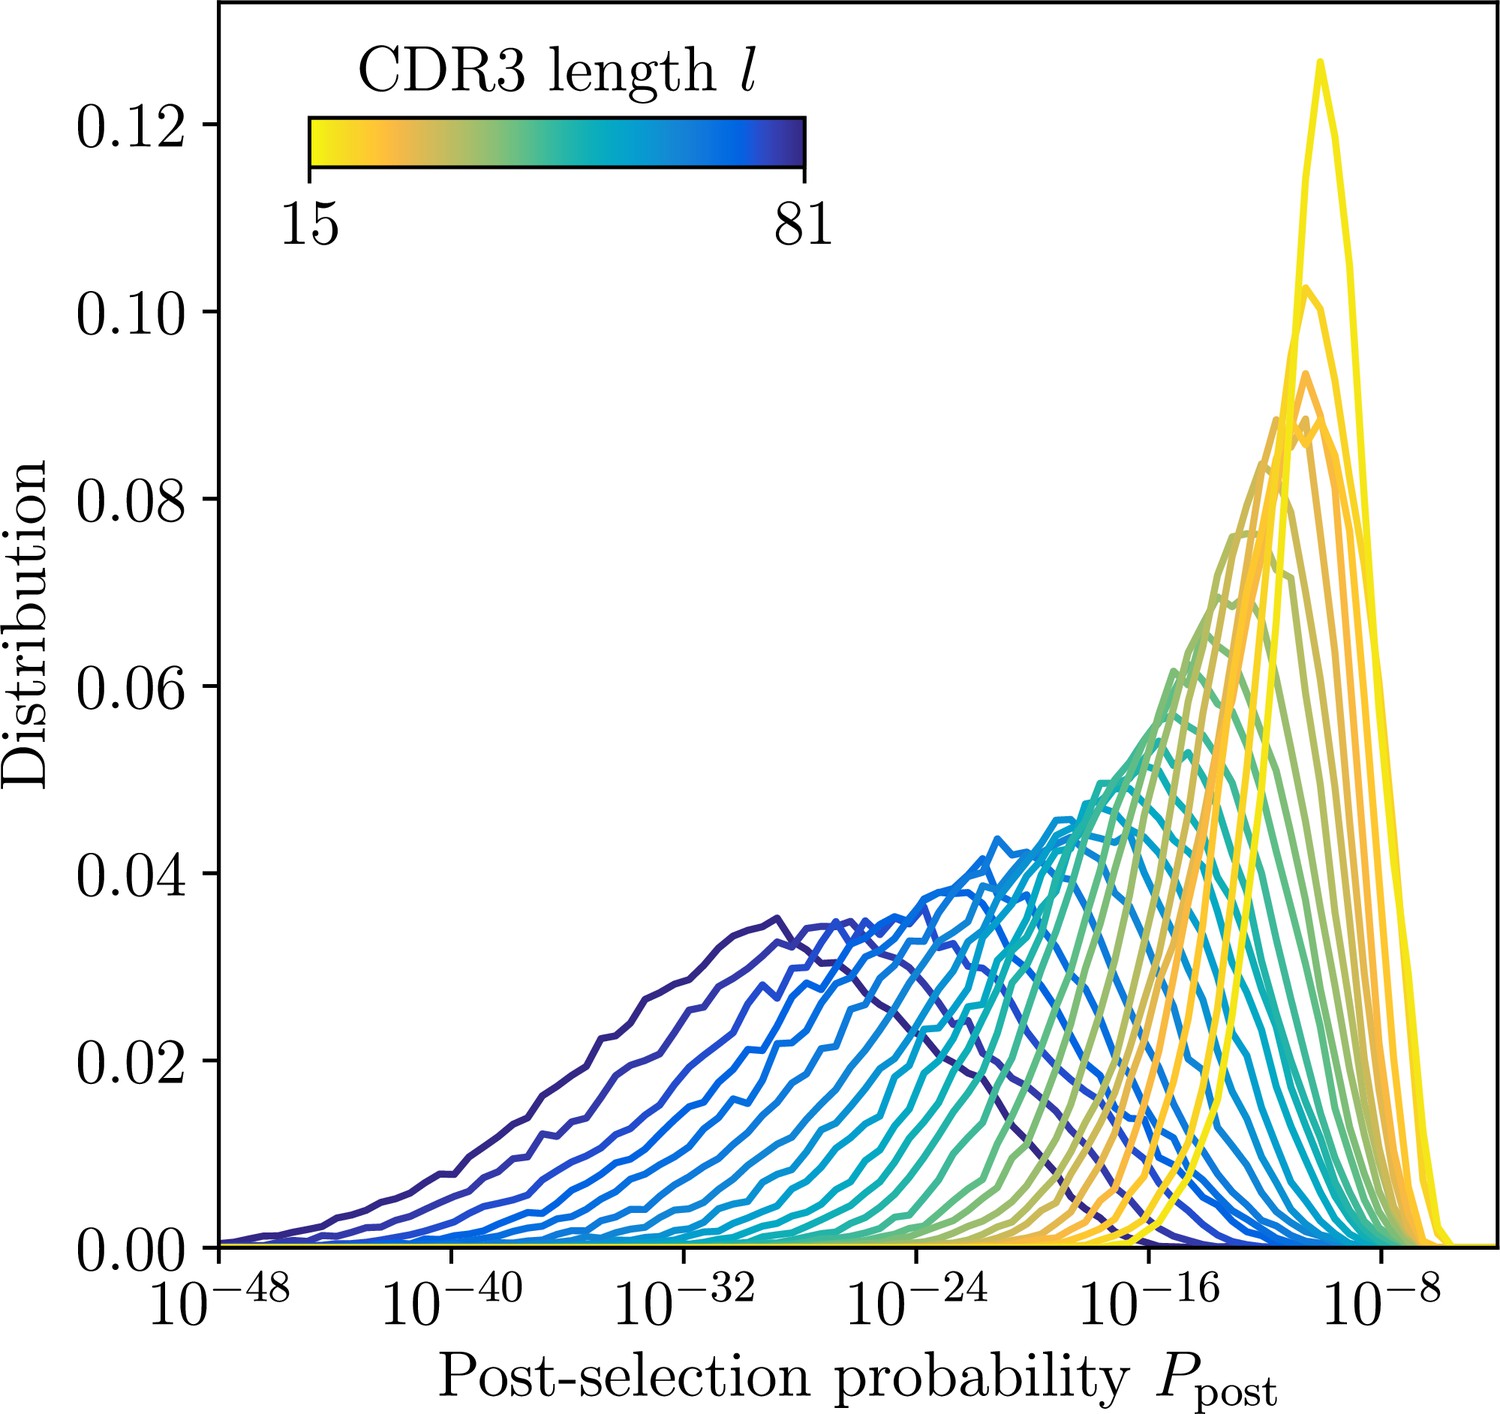
Distribution of post-selection probabilities.
Ppost of CDR3 nucleotide sequences computed using soNNia across CDR3 lengths. Short junctions are on average more likely to be generated in VDJ recombination and pass subsequent selection (Isacchini et al., 2021). This makes inference in low-l classes more difficult, a feature reflected by synthetic dataset constructed by sampling unmutated lineage progenitors from the soNNia model.
Figure 2—figure supplement 5
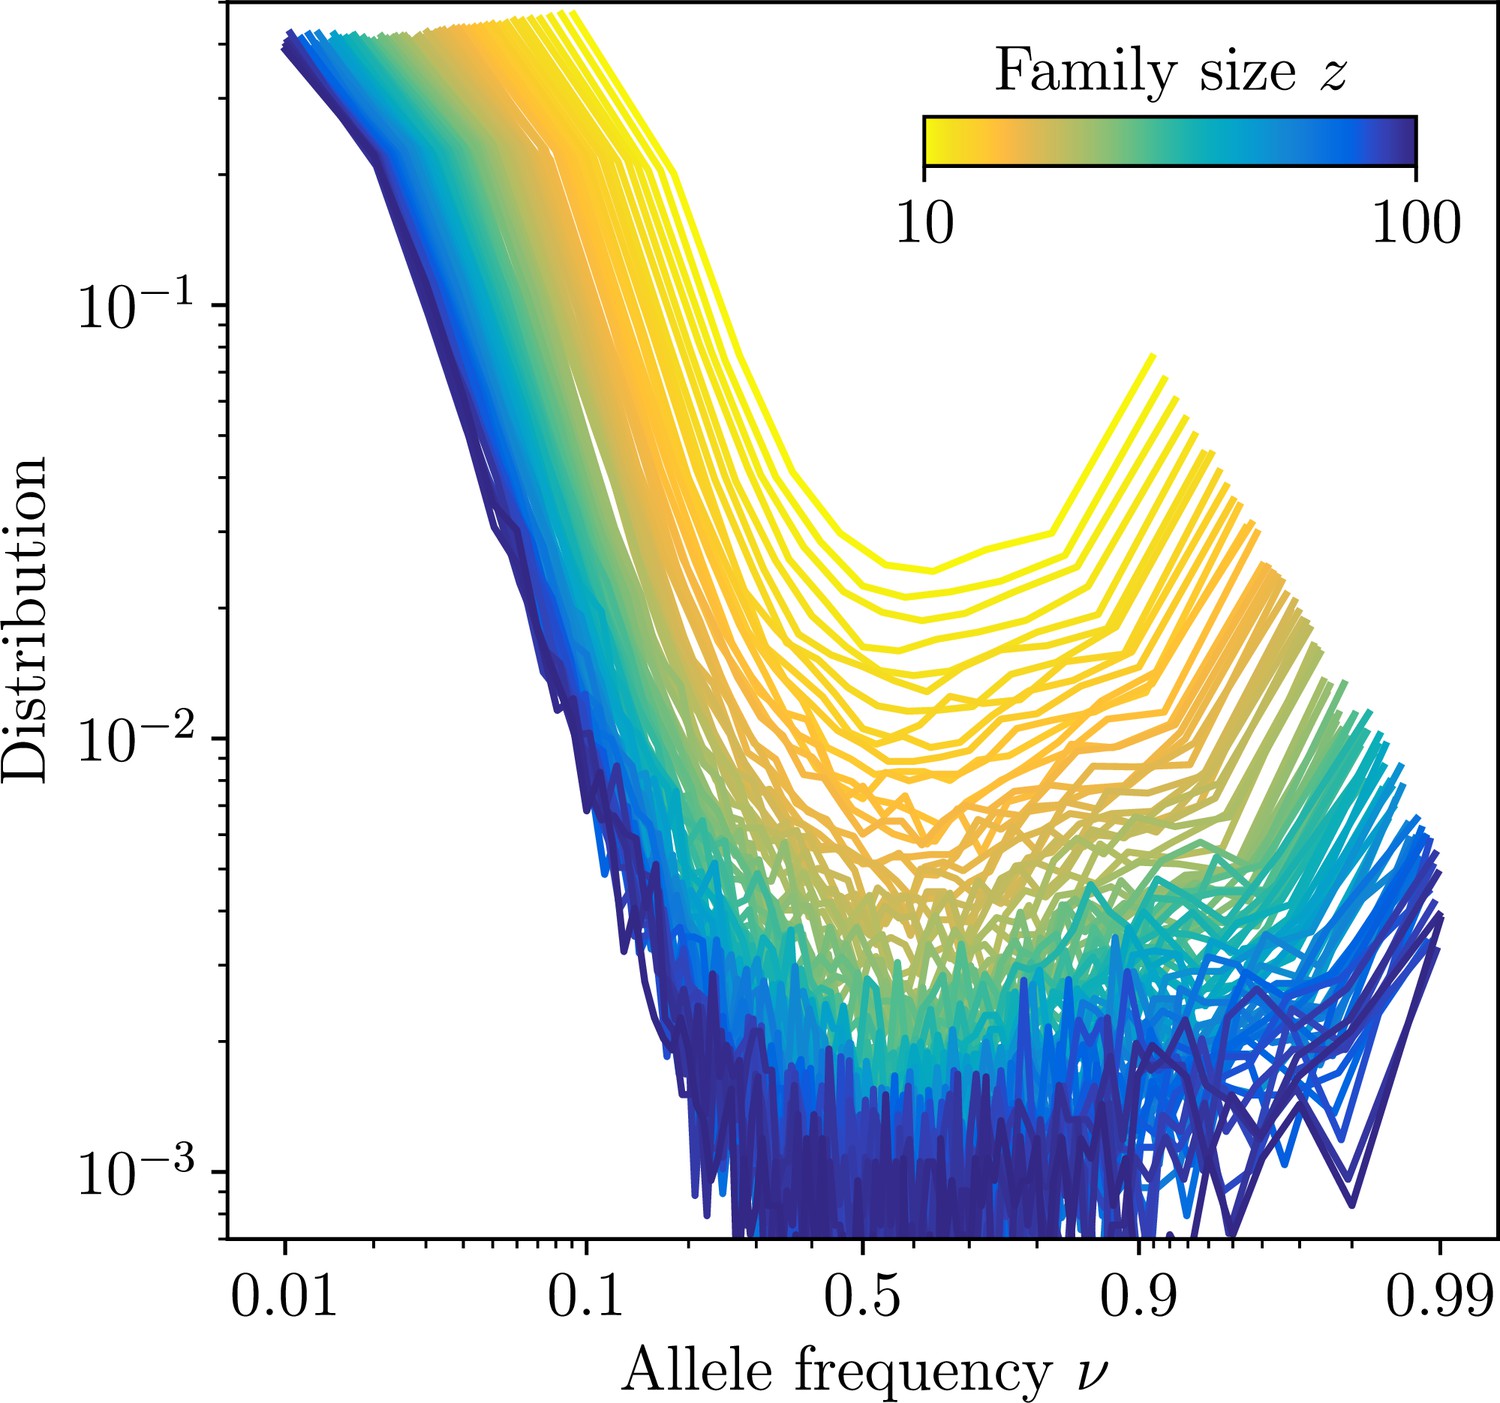
Site frequency spectra estimated for families identifed using high-precision CDR3-based inference method (HILARy-CDR3) in the subset of the data where this approach is highly reliable (large- and large- regime).
The distributions are shown for families of varying family size, and averaged over all families of a given size. Together with the exact configuration of sequences carrying a given substitution, synthetic datasets of the sames ignatures of mutations and clonal expansions can be generated.
Figure 2—figure supplement 6
Distribution of normalized Hamming distances , for classes, averaging over all classes.
We fit the distribution by a mixture of positive pairs using a geometric distribution ( in blue), and negative pairs (, in red). The corresponding prevalence estimates are used for small classes for which this parameter cannot be reliably estimated independently.
Figure 2—figure supplement 7

Prevalence and class size.
Dependence of prevalence estimates on class size N for largest classes in donor 326651 from Briney et al., 2019. 28% of variation in prevalence estimates can be explained by variation in class sizes.
Figure 3 with 2 supplements
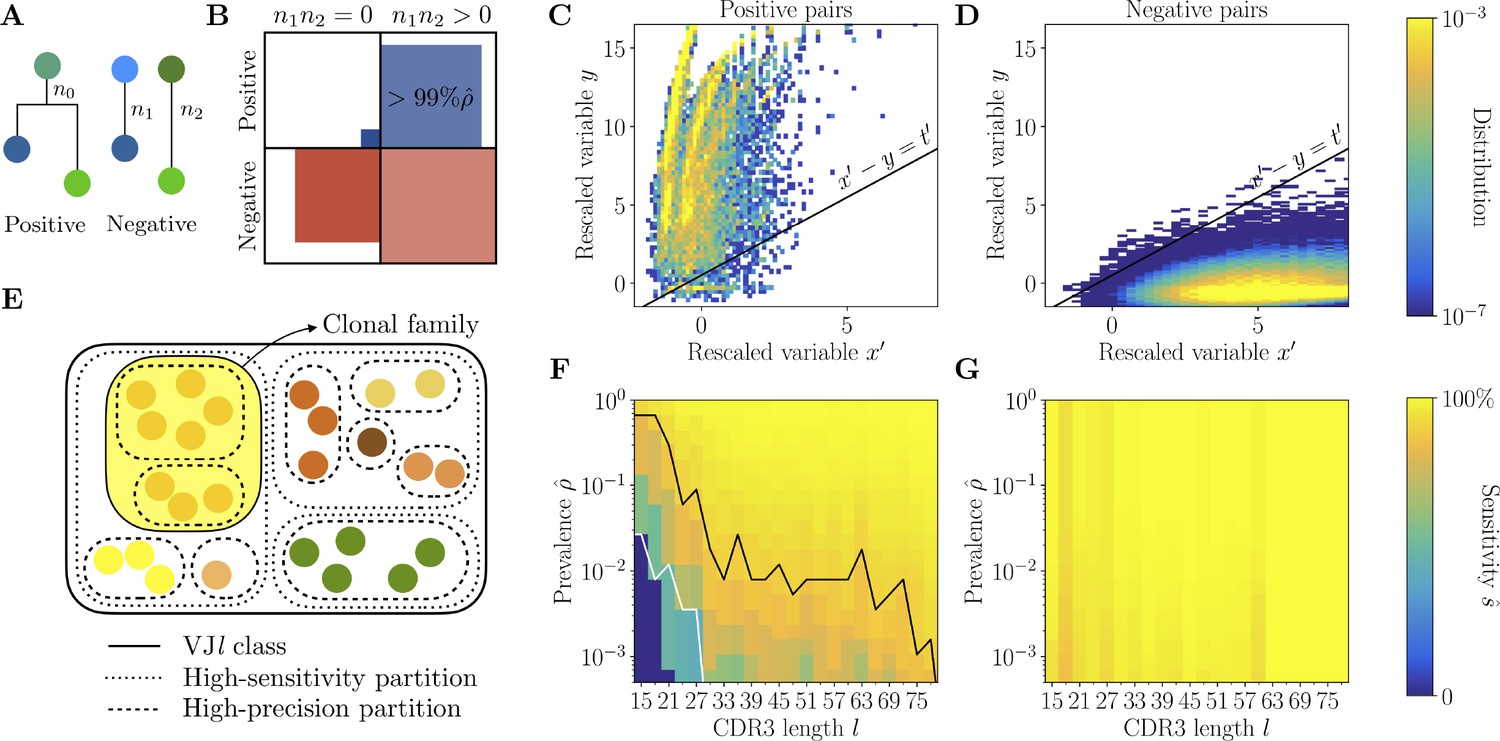
Full inference method with mutational information.
(A) For a pair of sequences, denote the numbers of mutations along the templated region (V and J), and is the number of shared mutations. For related sequences, corresponds to mutations on the initial branch of the tree, and is expected to be larger than for unrelated sequences, where corresponds to coincidental mutations. (B) Positive and negative pairs are called mutated if both sequences have mutations . Among positive pairs in the synthetic datasets, more than 99% are mutated. (C, D) Distributions of the rescaled variables and (Equation 4), for pairs of synthetic sequences belonging to the same lineage (positive pairs) and sequences belonging to different lineages (negative pairs). The separatrix marks a high-precision (99%) threshold choice. (E) To limit the number of pairwise comparisons we make use of high-precision and high-sensitivity complementarity determining region 3 (CDR3)-based partitions. High precision corresponds to the choice . High sensitivity corresponds to a coarser partition where is set to achieve 90% sensitivity. When the two partitions disagree, mutational information can be used to break the coarse, high-sensitivity partition into smaller clonal families. (F, G) Mutations-based methods achieve high sensitivity across all CDR3 lengths in the synthetic dataset (G), extending the range of applicability with respect to the CDR3-based method (F).
Figure 3—figure supplement 1
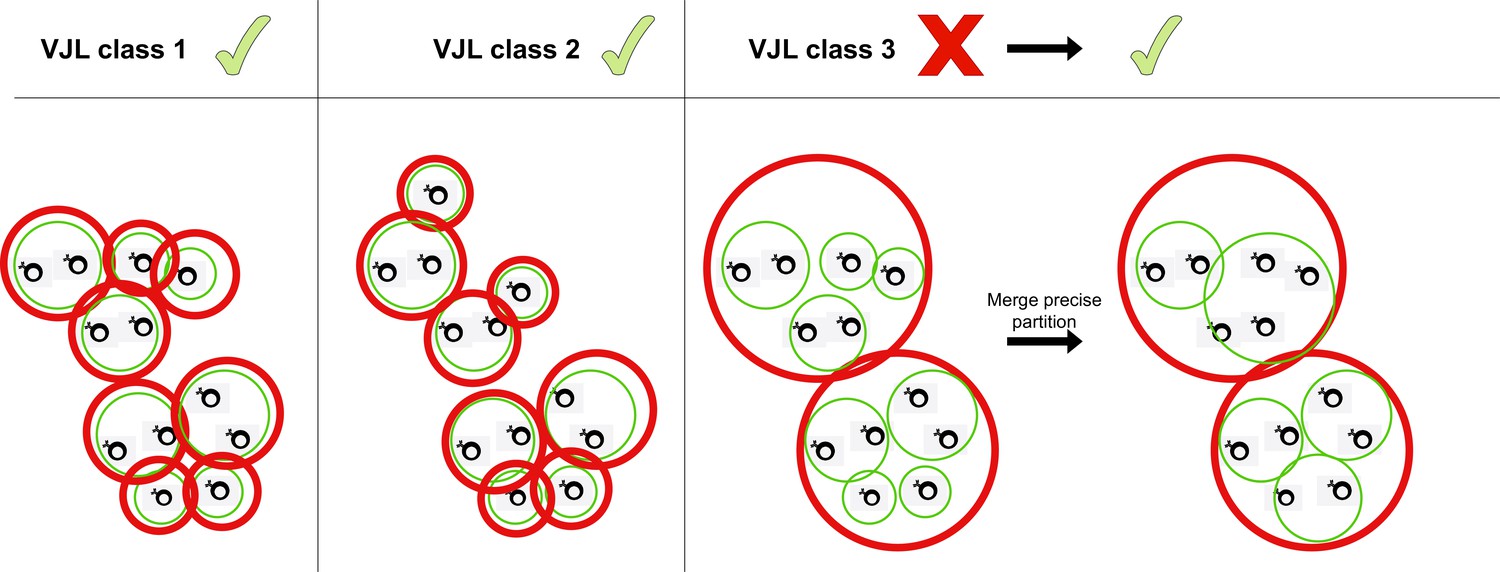
Merging partitions.
Red circles represent clusters from the coarse (high-sensitivity) partition, while green clusters represent the fine (high-precision) partition. When the two partitions differ, HILARy-full merges precise clusters inside each sensitive cluster whenever there exists of pair of positive sequences linking them.
Figure 3—figure supplement 2
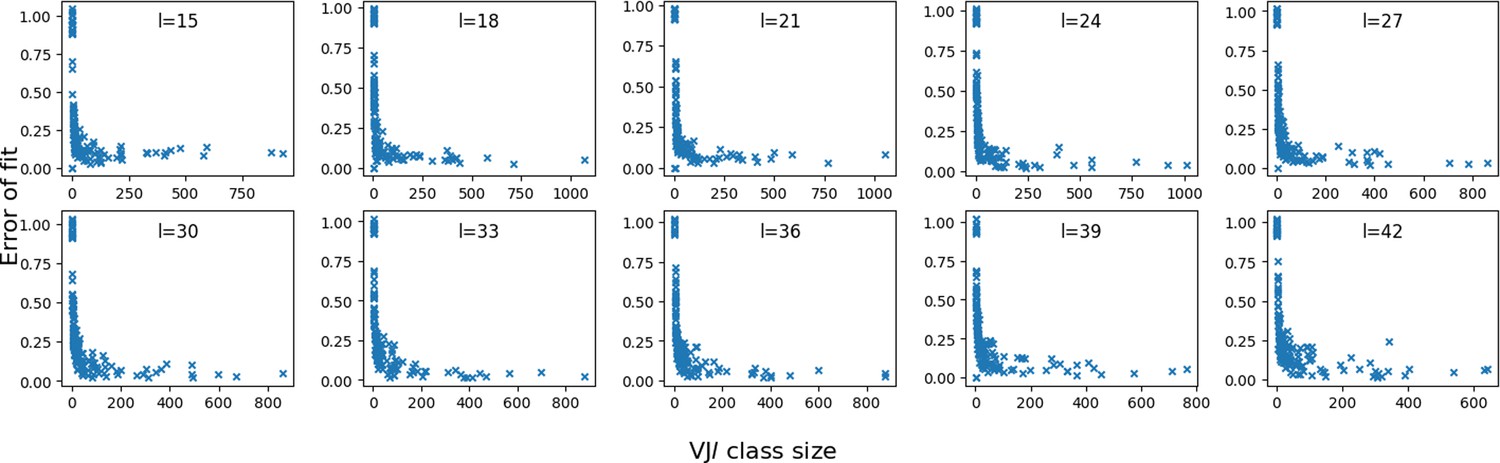
Error vs class size.
We plot the fitting error of P(x) by the mixture model, for each class in the synthetic dataset, as a function of their sizes. The error is computed as the squared difference between the model and data distributions of distances.
Figure 4 with 2 supplements
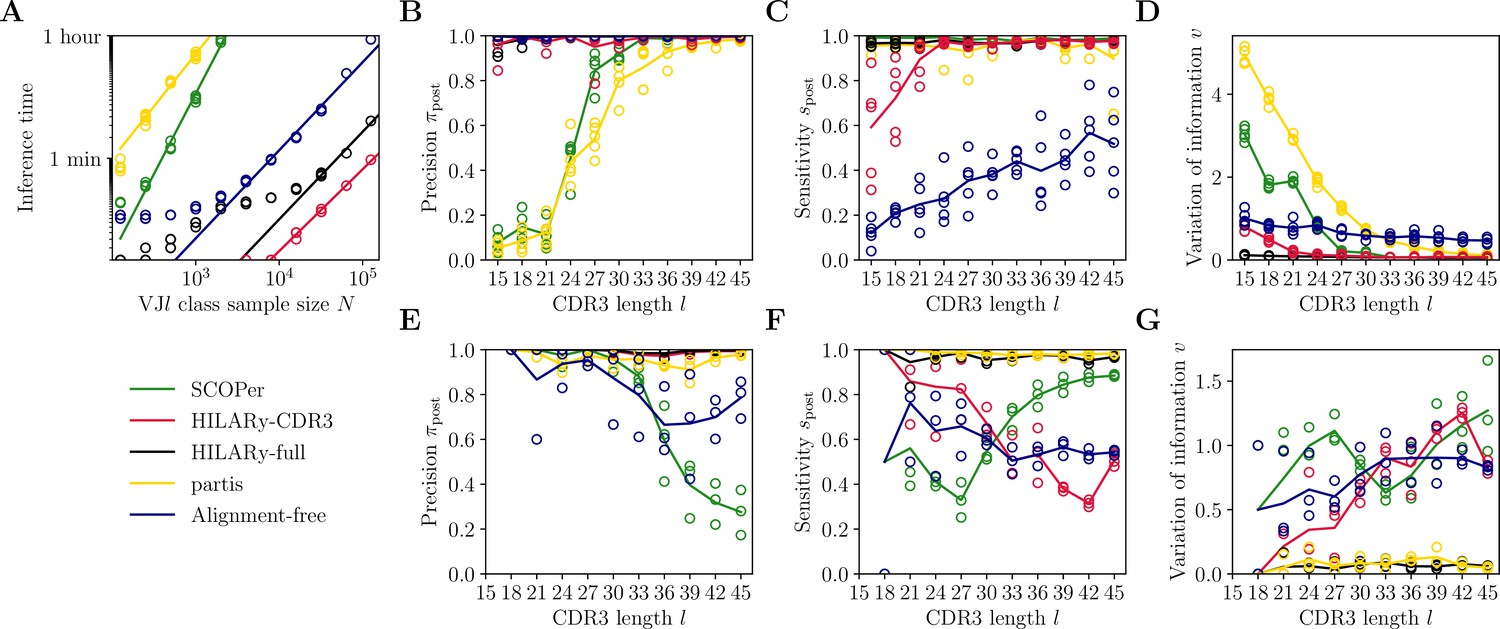
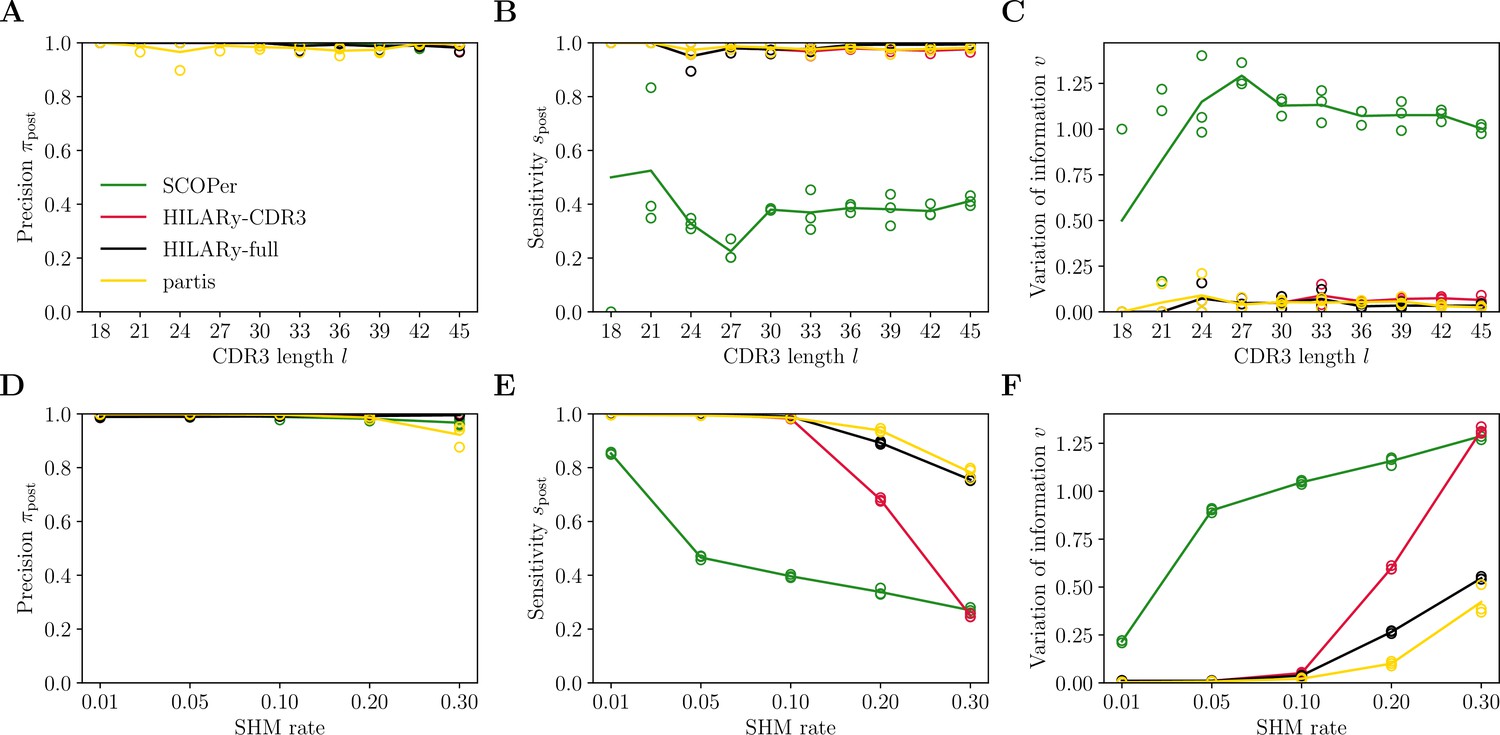
Benchmark of the alternative methods on synthetic heavy-chain repertoires.
(A) Comparison of inference time using subsamples from the largest class found in donor 326651 from Briney et al., 2019. Comparisons were done on a computer with 14 double-threaded 2.60 GHz CPUs (28 threads in total) and 62.7 Gb of RAM. (B) Clustering precision (post single-linkage clustering of positive pairs), (C) sensitivity , and (D) variation of information as a function of complementarity determining region 3 (CDR3) length in the realistic synthetic dataset generated for this study. Solid lines represent the mean value averaged over five synthetic datasets. (E–G) Same as (B–D) but for the synthetic dataset from Ralph and Matsen, 2022, designed for the development and testing of the partis software. The solid lines represent the mean over the three datasets.
Figure 4—figure supplement 1
Performance of spectral SCOPer using V gene mutations.
(A) Comparison of inference time using subsamples from the largest class found in donor 326651 from Briney et al., 2019. Comparisons were done on a computer with 14 double-threaded 2.60GHz CPUs (28 threads in total) and 62.7Gb of RAM. (B) Clustering precision (post single linkage clustering of positive pairs), (C) Sensitivity , and (D) variation of information υ vs CDR3 length in the realistic synthetic dataset generated for this study. Solid lines represent the mean value averaged over 5 synthetic datasets.
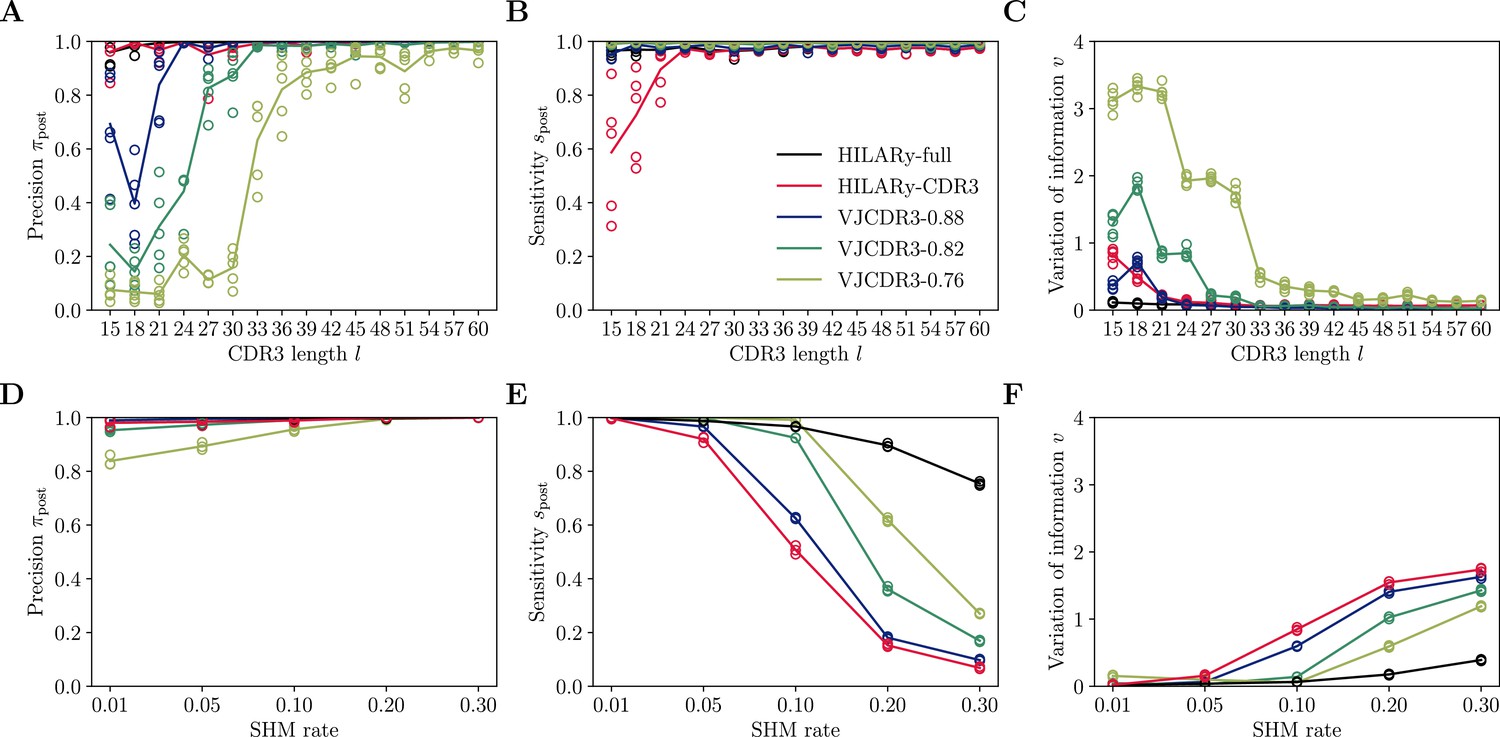
Figure 4—figure supplement 2
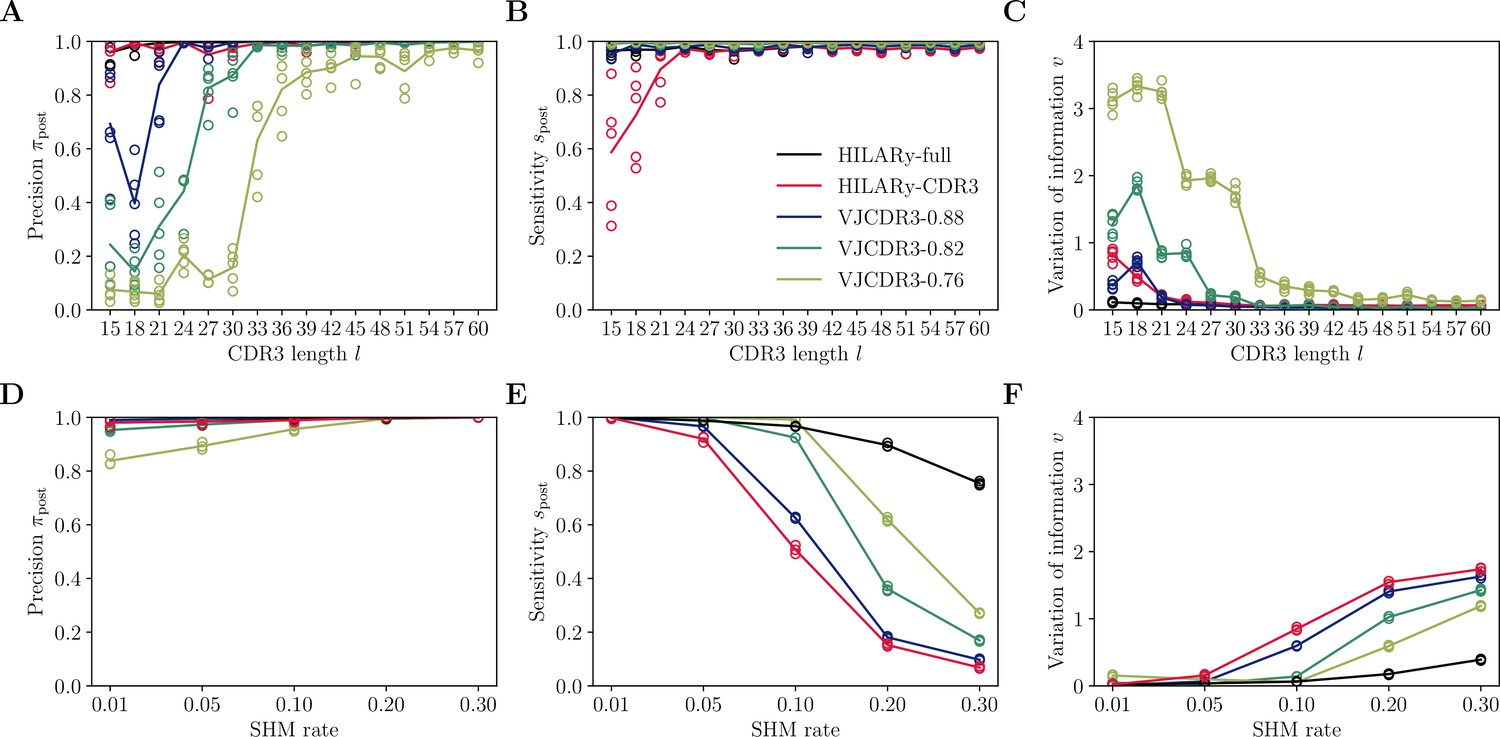
Performance of single-linkage clustering with fixed threshold.
We call this method VJCDR3-sim, where sim is the threshold on the normalized similarity between two CDR3s, equal to , where is our normalized Hamming distance. (A) Clustering precision (post single linkage clustering of positive pairs), (B) sensitivity , and (C) variation of information υ as a function of CDR3 length in the realistic synthetic dataset generated for this study. Solid lines represent the mean value averaged over 5 synthetic datasets. (D-F): Same than (A-C) using the synthetic data from Ralph and Matsen, 2022 and across mutation rates.
Figure 5
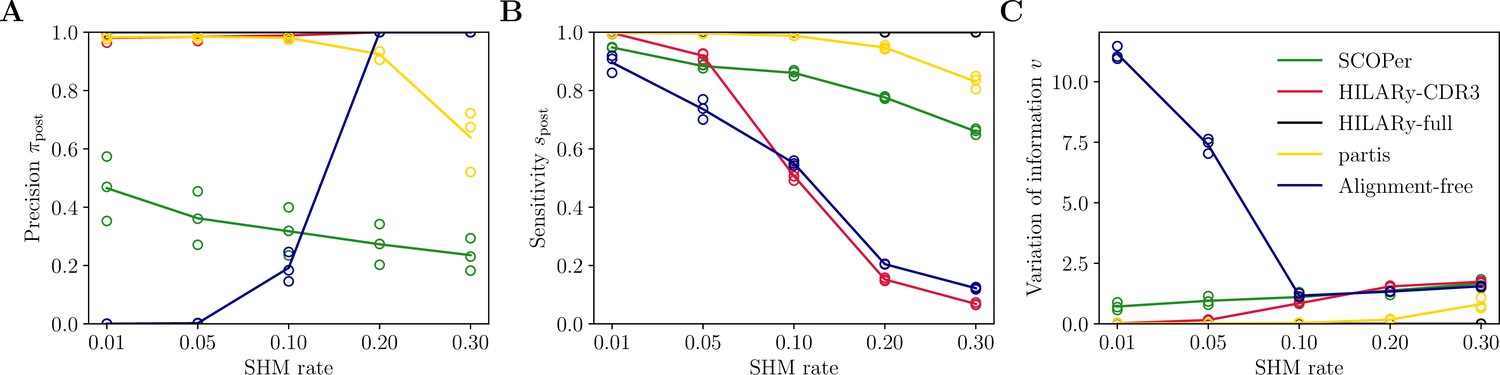
Performance of HILARy as a function of mutation rate for heavy chains, on synthetic data from Ralph and Matsen, 2022, designed for the development and testing of the partis software.
(A) Clustering precision (post single-linkage clustering of positive pairs), (B) sensitivity , and (C) variation of information as a function of mutation rate, using the heavy chain only. Solid lines represent the mean value averaged over the three datasets.
Figure 6
Benchmark of HILARy with paired light and heavy chains.
(A) Clustering precision (post single-linkage clustering of positive pairs), (B) sensitivity , and (C) variation of information as a function of complementarity determining region 3 (CDR3) length , on the synthetic datasets from Ralph and Matsen, 2022, designed for the development and testing of the partis software. (D–F): Same as (A–C) but as a function of mutation rate.
Figure 7
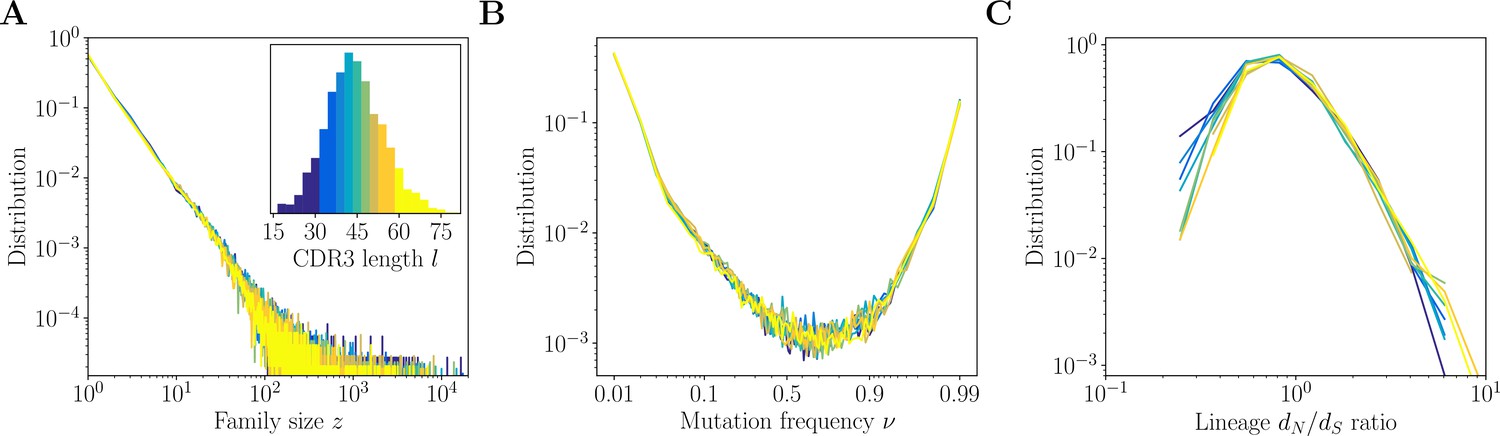
Inference results across complementarity determining region 3 (CDR3) lengths.
Inference results for donor 326651 of Briney et al., 2019, are presented for nine quantiles of the CDR3 distribution, each containing between 8% and 12% of the total number of sequences (corresponding to nine colors in the inset of A). (A) Distributions of family size . All CDR3 length quantiles exhibit universal power-law scaling with exponent −2.3. (B) Site frequency spectra estimated for families of sizes . Families of larger sizes were subsampled to to subtract the influence of varying family sizes. (C) Distribution of lineage ratios computed for polymorphisms in CDR3 regions over all lineages within each nine quantile.
Author response image 1
Author response image 2

Tables
Table 1
Summary of notations used throughout the paper.
Hats ˆ denote estimates from the fit of the mixture model. Stars ∗ denote estimates after imposing 99% precision. The ‘post’ subscript denotes quantities after applying single-linkage clustering to obtain a partition from positive pairs.
| Definition | |
|---|---|
| Prevalence/fraction of positive pairs | |
| Precision = TP/(TP+FP) | |
| Sensitivity = TP/(TP+FN) | |
| Fallout = FP/(FP+TN) | |
| Threshold on CDR3 distance | |
| CDR3 length | |
| CDR3 Hamming distance of a pair | |
| Normalized CDR3 Hamming distance | |
| CDR3 Hamming distance, centered and scaled | |
| Shared mutations on V segment, centered and scaled | |
| Mean between positive pairs | |
| Model distribution for positive pairs | |
| Model distribution for negative pairs |
Additional files
Download links
A two-part list of links to download the article, or parts of the article, in various formats.
Downloads (link to download the article as PDF)
Open citations (links to open the citations from this article in various online reference manager services)
Cite this article (links to download the citations from this article in formats compatible with various reference manager tools)
Combining mutation and recombination statistics to infer clonal families in antibody repertoires
eLife 13:e86181.
https://doi.org/10.7554/eLife.86181


