Linking genotypic and phenotypic changes in the E. coli long-term evolution experiment using metabolomics
- Department of Genetics, Rutgers University, United States
- Human Genetics Institute of New Jersey, United States
- Waksman Institute, Rutgers University, United States
- Cancer Institute of New Jersey, United States
Figures
Figure 1 with 6 supplements
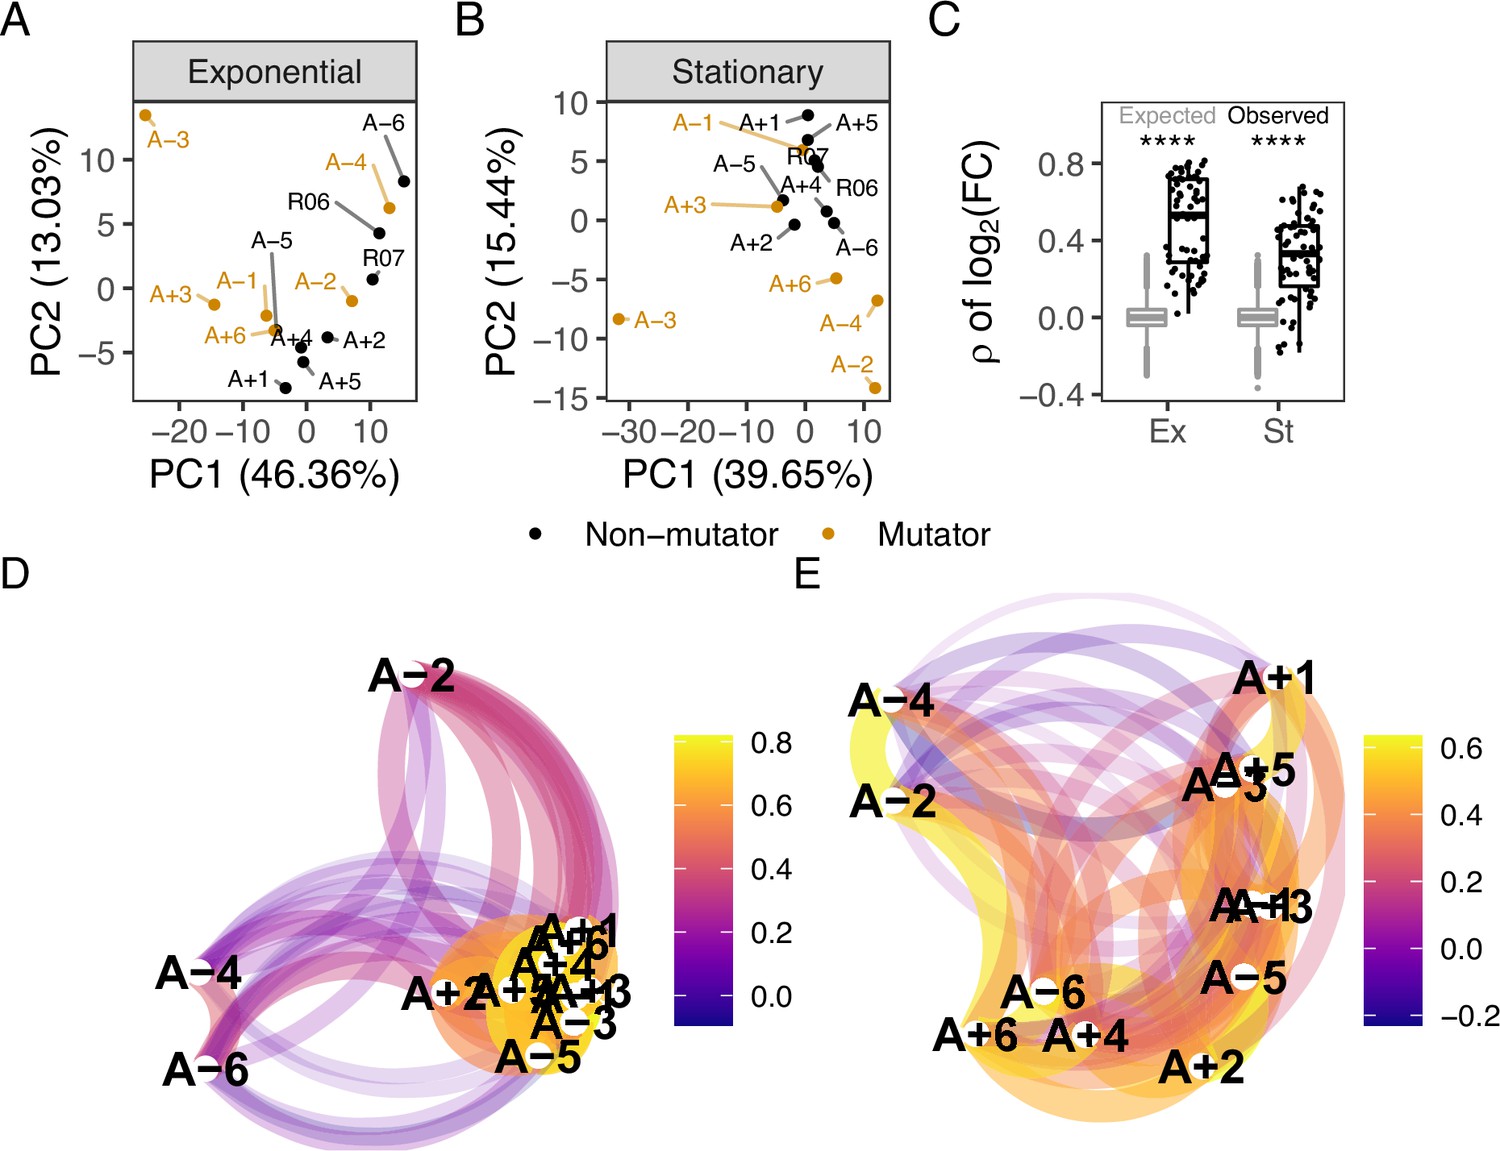
Comparison of metabolic changes in evolved lines within each growth phase.
(A, B) Principal component analysis based on separated by growth phase. R06 and R07 are the ancestors (REL606 and REL607). For this figure, the combination of ionization mode and metabolite was treated as a feature of the data. (C) Pairwise Spearman’s correlations based on relative to the ancestor. The black boxes and points indicate the observed correlations, the gray boxes indicate correlations calculated after 100,000 randomizations of fold-changes within each line. p-values indicate the results of a two-tailed t-test between the observed and expected distributions. **** indicates a p-value ≤0.0001. (D, E) The observed correlations from C plotted in a network manner. (D) is the exponential phase and (E) is the stationary phase. Lines are clustered based on similarity and the color of the line connecting two points indicates the strength of the correlation.
Figure 1—figure supplement 1

Pairwise comparisons of mass-spectrometry data across growth phases.
(A) Distributions of different pairwise correlations based on , both (+) and (−) ionization mode data are considered. Data are from all samples with no averaging of replicates. Pairwise indicates all possible pairwise correlations. Replicates indicate comparisons of biological replicates. Intraphase and interphase are comparisons within or across growth phases, respectively. p-value indicates the result of a t-test testing if the within growth-phase distribution is greater than the interphase distribution. (B) Correlations of compounds across ionization mode. Each point is the correlation of (+) and (−) ionization modes within a single evolved line. (C) Distributions of normalized peak areas are similar across replicates and samples. (+) and (−) indicate ionization mode and colors indicate replicates.
Figure 1—figure supplement 2
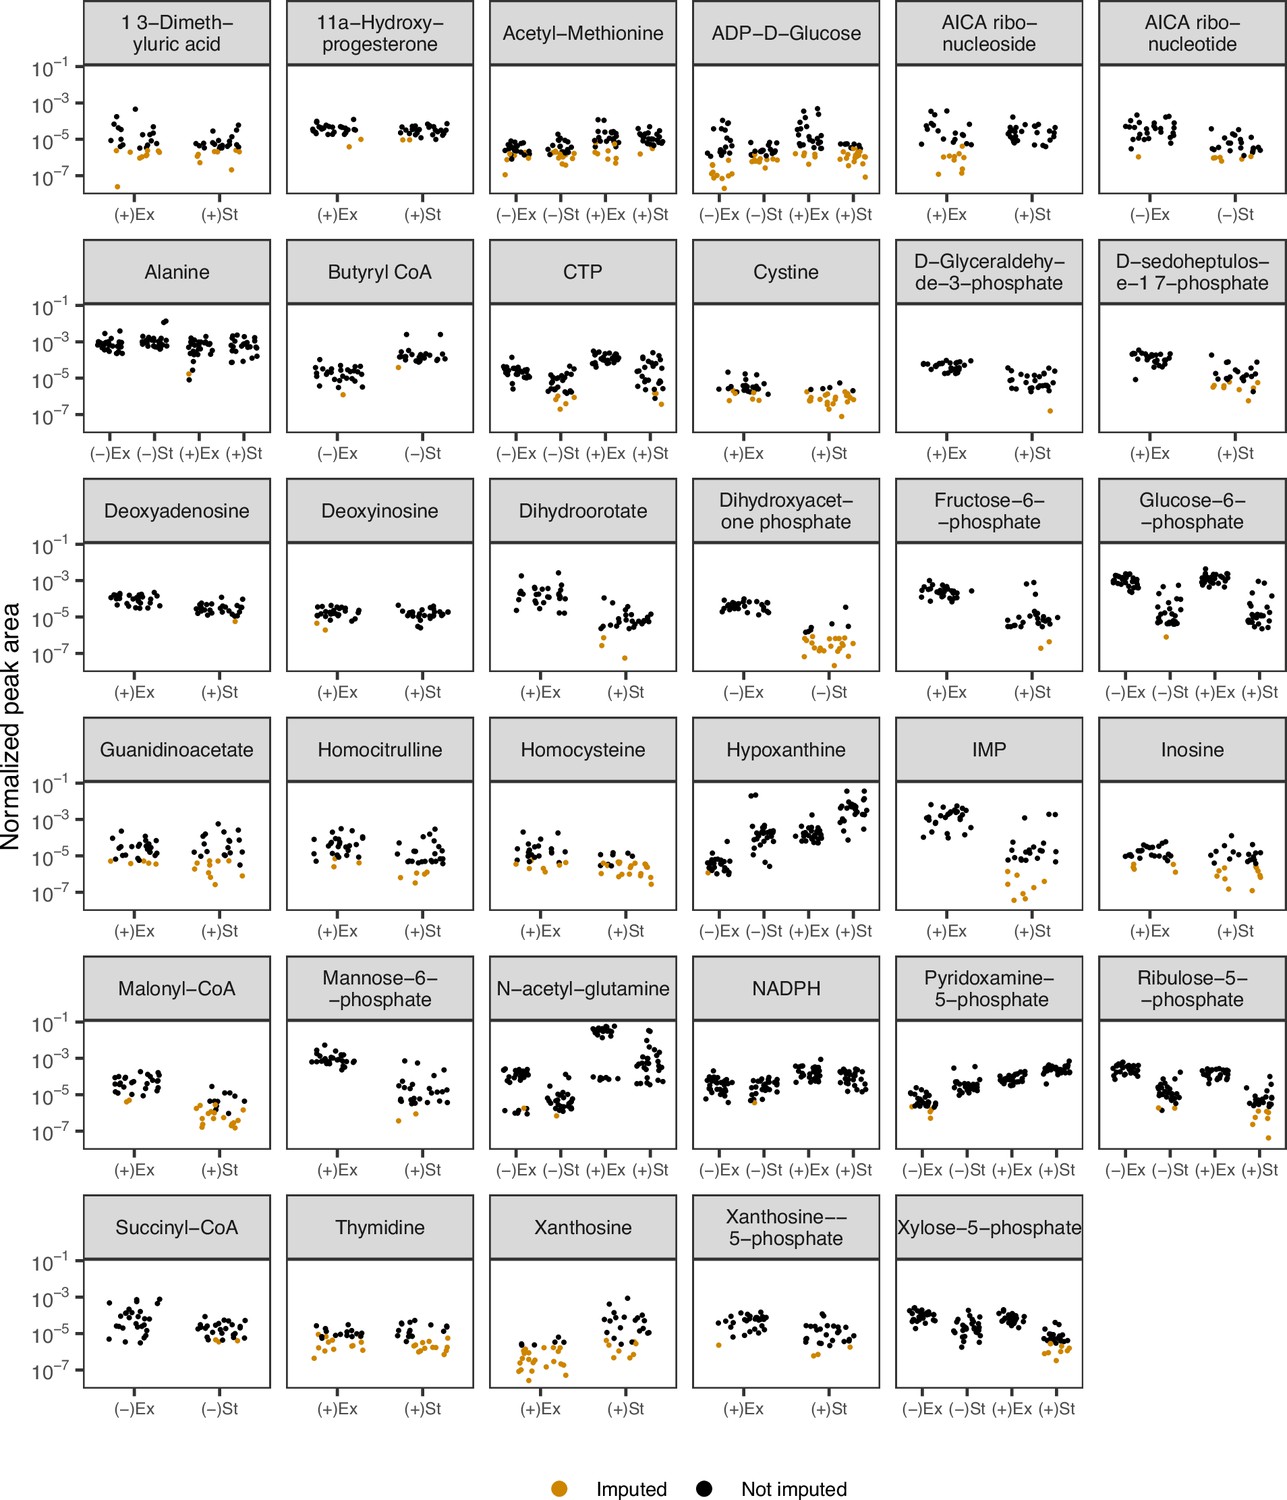
Distributions of peak areas for compounds whose values were imputed using a quantile regression imputation of left-censored (QRILC) method (see Data processing and description for a complete description).
Imputed values are in orange. The combination of the growth phase (exponential, Ex; stationary, St) and the ionization mode (positive, (+); negative, (−)) is listed on the x-axis.
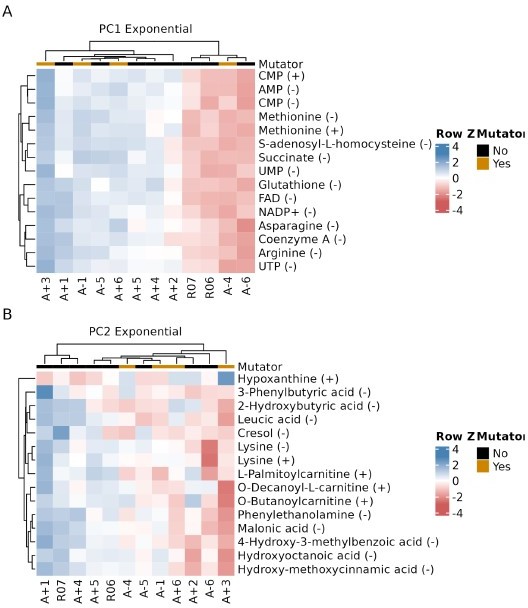
Figure 1—figure supplement 3

Relationship between key metabolites impacting principal components of exponential phase metabolomes of evolved lines.
(A, B) The top 15 compounds contributing to PC1 and PC2 for the exponential phase metabolomes. The (+) or (−) next to a compound indicates the ionization mode of detection, not the charge of the molecule. Colors indicate the row-wise Z-scores based on normalized peak areas.
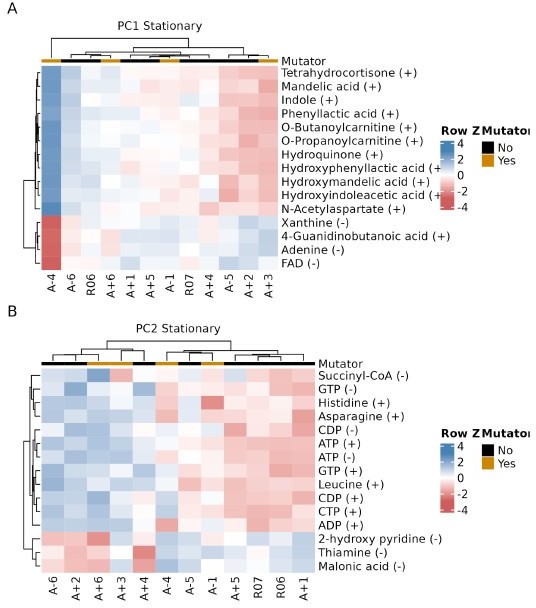
Figure 1—figure supplement 4
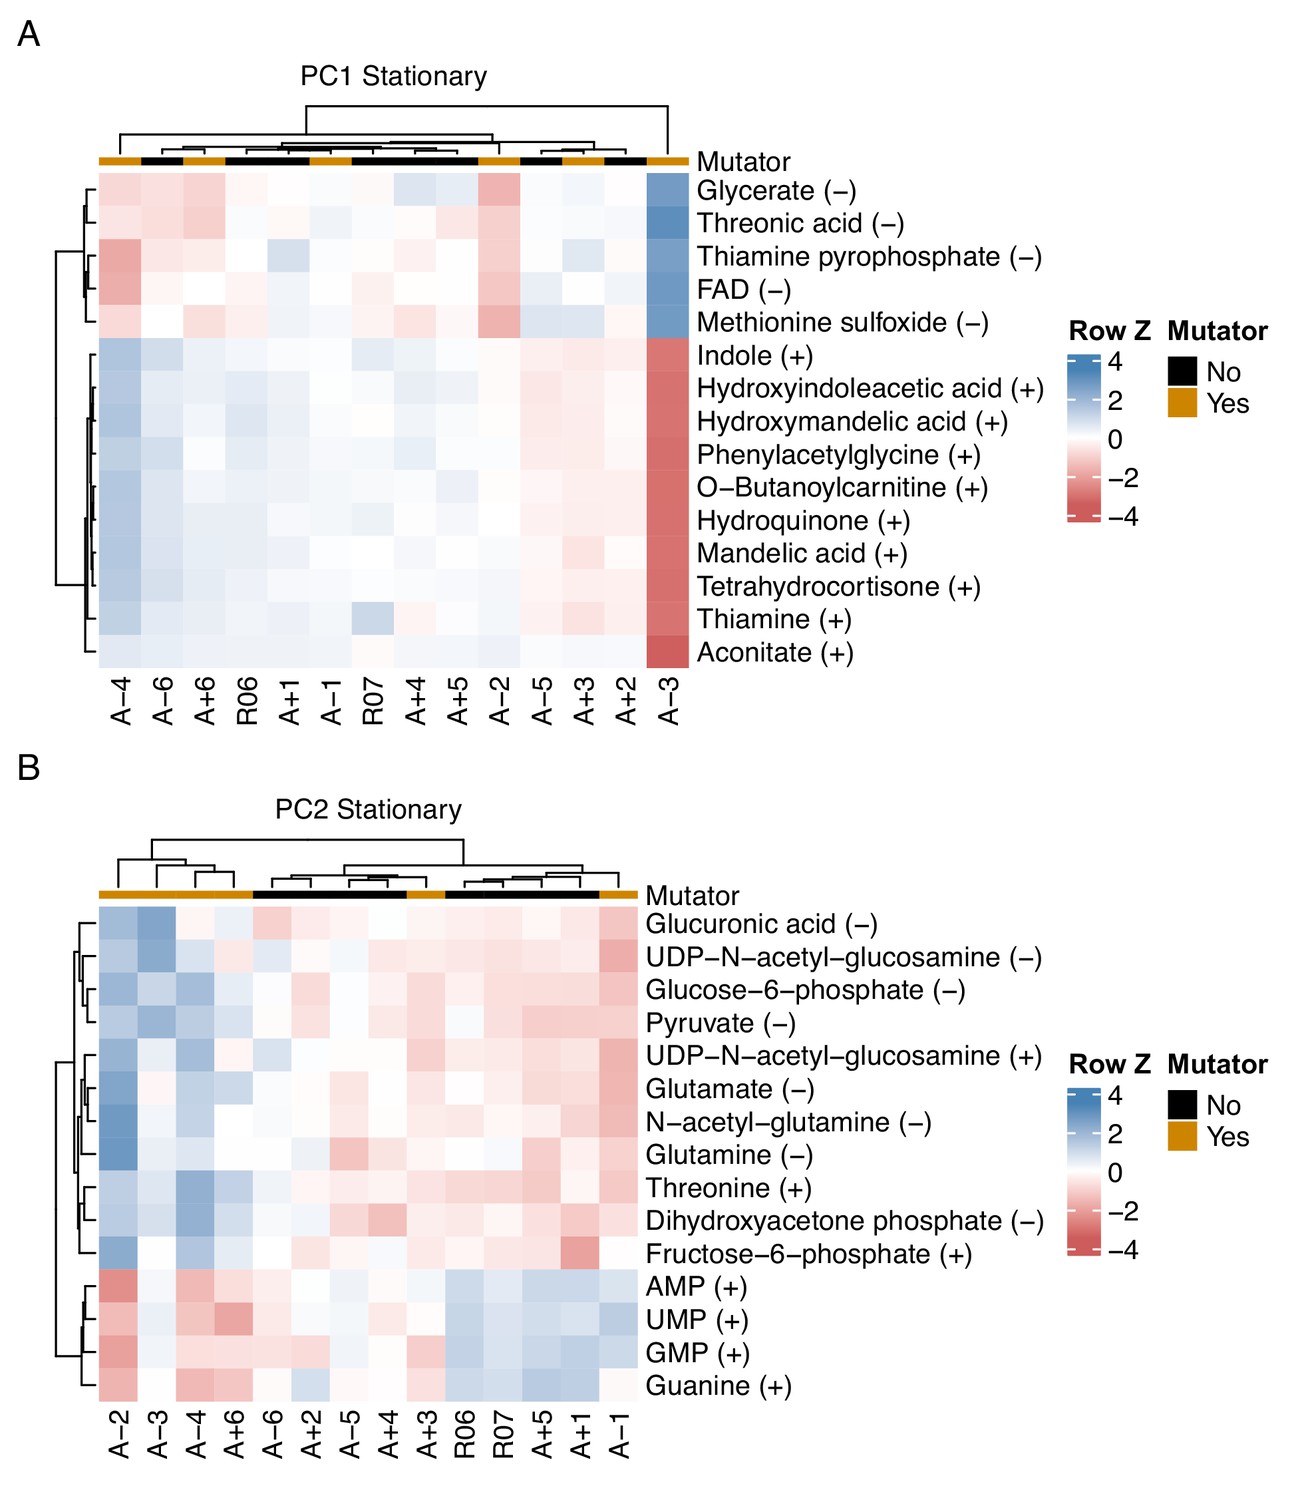
Relationship between key metabolites impacting principal components of stationary phase metabolomes of evolved lines.
(A, B) The top 15 compounds contributing to PC1 and PC2 for the stationary phase metabolomes. The (+) or (−) next to a compound indicates the ionization mode of detection, not the charge of the molecule. Colors indicate the row-wise Z-scores based on normalized peak areas.
Figure 1—figure supplement 5

The theoretical and observed probabilities of finding features (the combination of metabolite and the ionization mode it was detected in) that are significantly altered () in a given number of evolved lines (x-axis).
Up and down refer to metabolites that are increased and decreased relative to the ancestral strain. Theoretical distributions were calculated using the Sum of Independent Non-Identical Binomial Random Variables (SINIB) method (Liu and Quertermous, 2018). For more details on this method, see Theoretical distributions for parallel changes in metabolites.
Figure 1—figure supplement 6
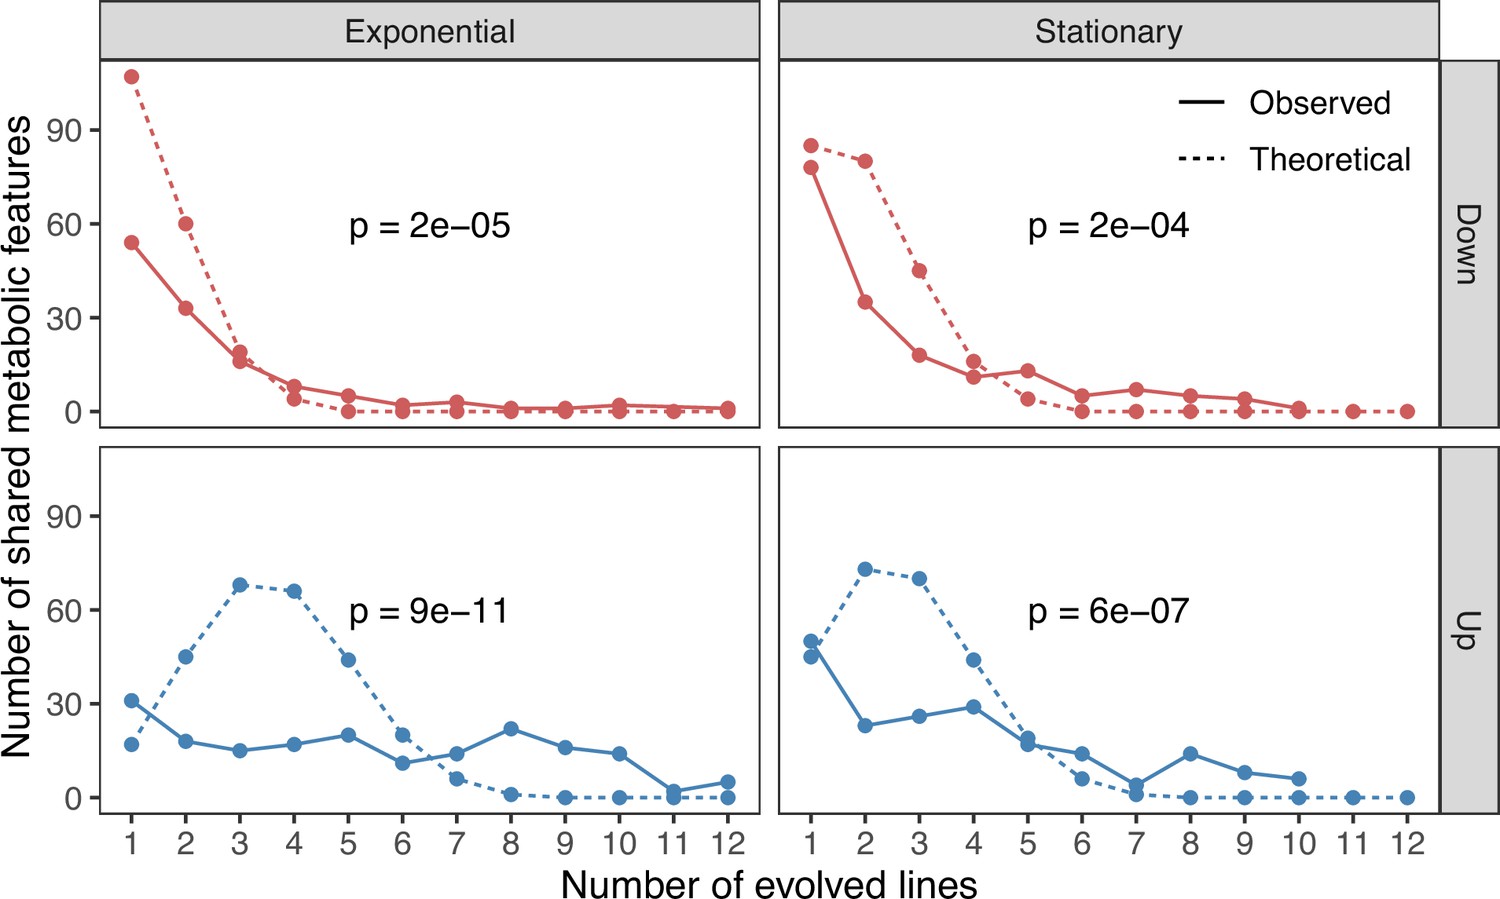
The theoretical and observed number of shared, significantly altered () metabolic features (the combination of metabolite and the ionization mode it was detected in) in a given number of evolved lines (x-axis).
p-values represent two-tailed t-tests between the observed and theoretical distributions of the number of shared features. The predicted number of shared metabolic features is calculated based on the theoretical probabilities in Figure 1—figure supplement 5. Up and down refer to metabolites that are increased and decreased relative to the ancestral strain.
Figure 2 with 1 supplement
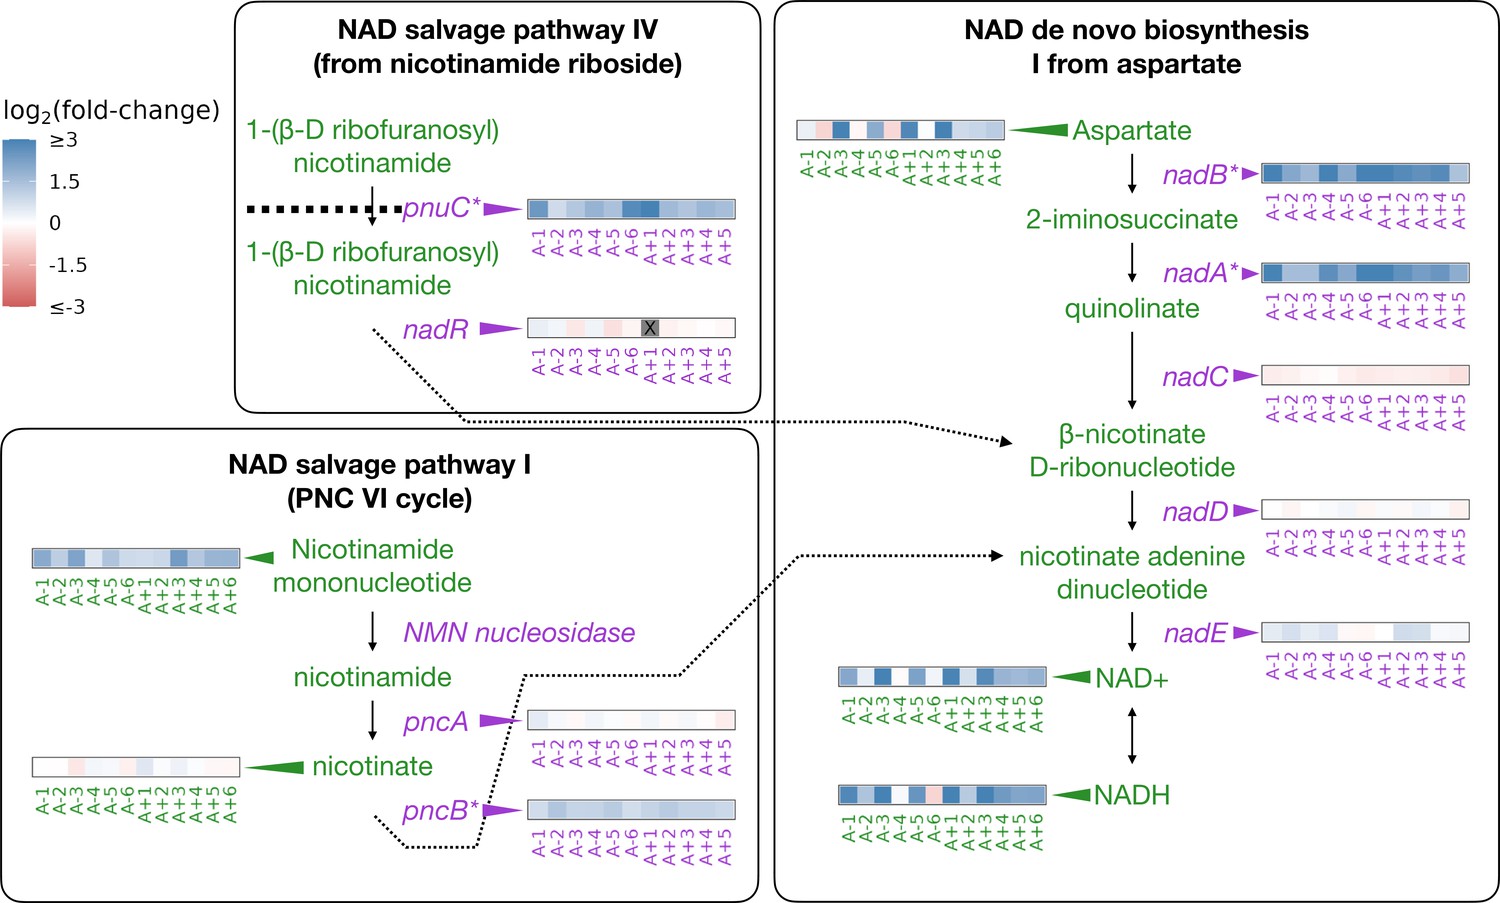
Depiction of three pathways (bold-faced text) that contribute to NAD abundances in the cell.
Graphics and pathway names are adapted from the EcoCyc database (Keseler et al., 2005). All data represent exponential phase measurements. Genes that code for enzymes are shown in purple and metabolites in green. Heatmaps positioned to the right of gene names show the fold-change in expression relative to the ancestor (data from Favate et al., 2022). Gray spaces (also marked with an X) in gene expression heatmaps represent evolved lines where that gene contains an indel or is deleted. Asterisks indicate genes that are transcriptionally regulated by NadR. Heatmaps positioned to the left of metabolite names show changes in metabolite abundance relative to the ancestor. PnuC transports compounds into the cell. Each heatmap represents one ionization mode, but a mixture of positive and negative ionization mode data is shown depending on which mode a compound was detected. See Figure 2—figure supplement 1A for complete data.
Figure 2—figure supplement 1
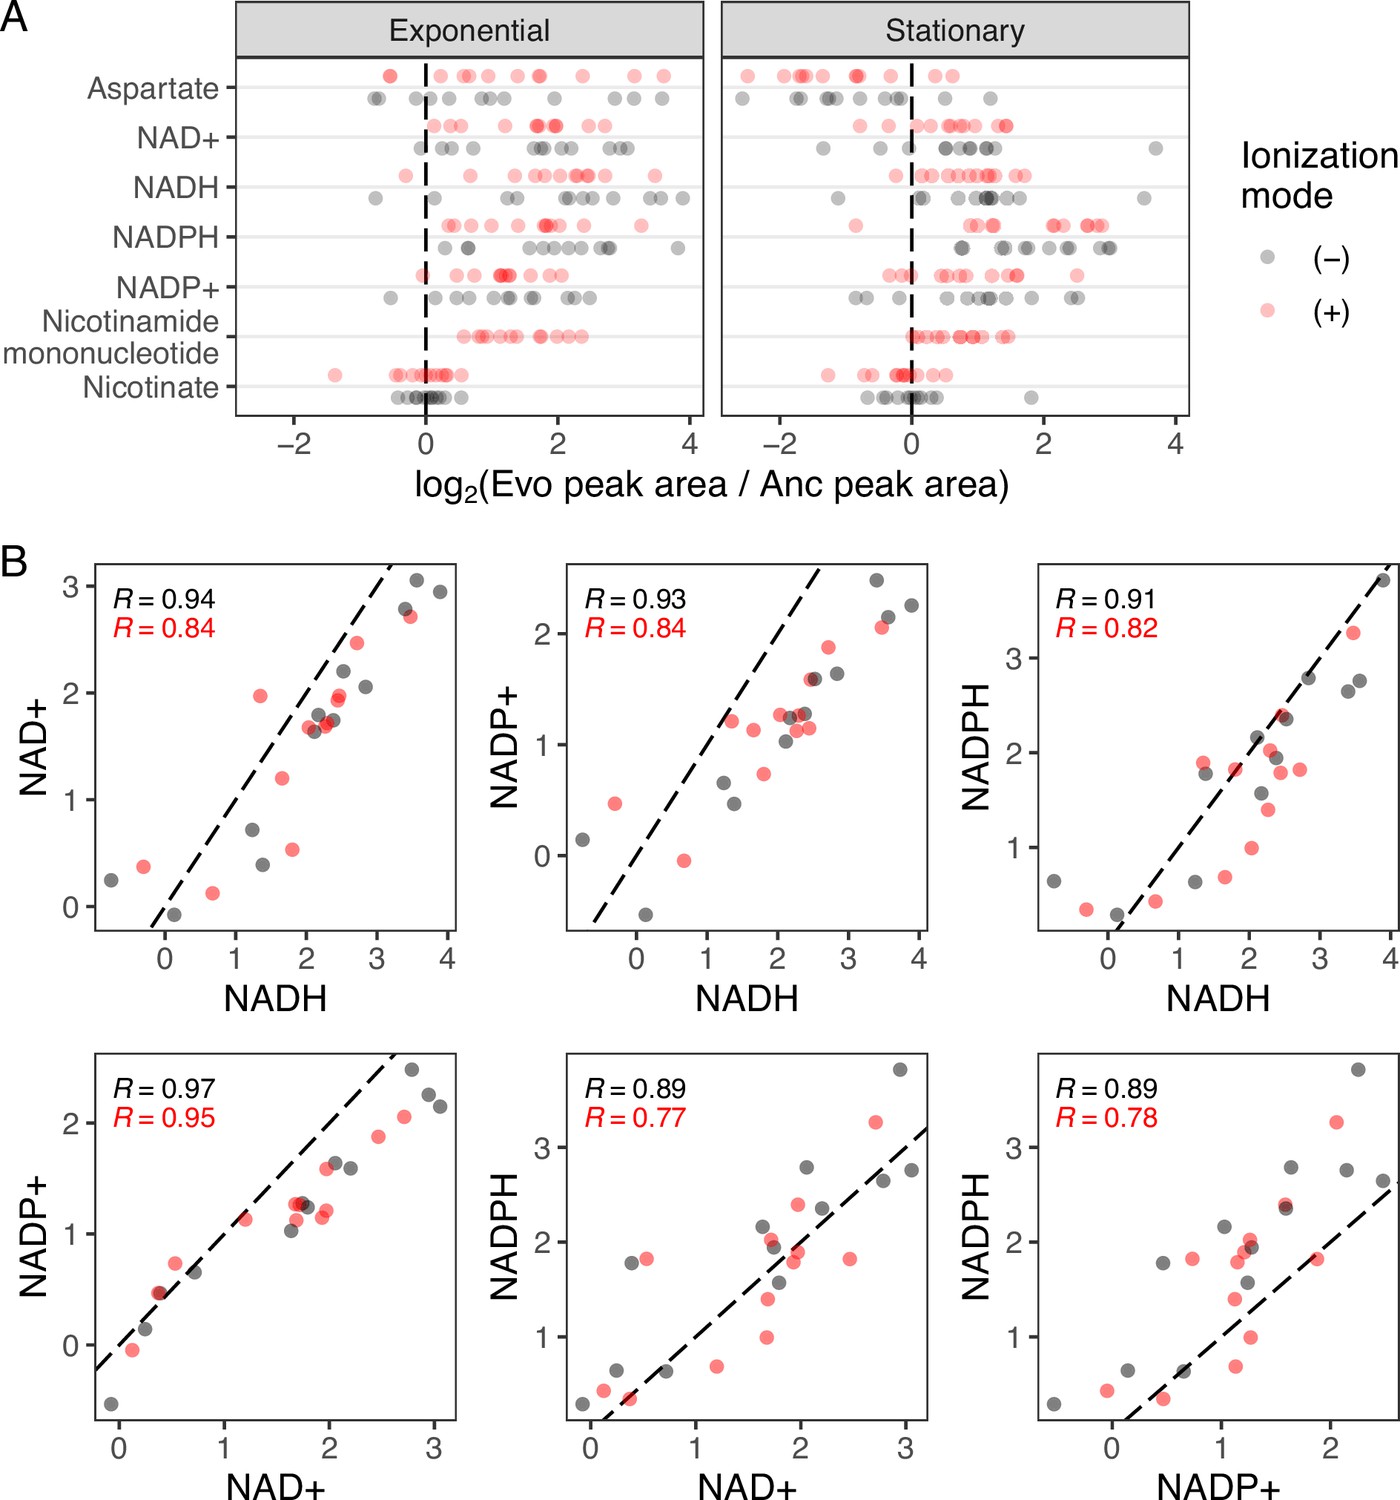
Relationship between metabolites of the NAD pathway across evolved lines.
(A) Complete data for Figure 2. The distribution of fold-changes relative to the ancestor for each compound in each ionization mode is shown. Fold-change is calculated after averaging replicates normalized peak areas. The ancestors are averaged together. (B) Correlations between the various nicotinamide adenine dinucleotide (NAD)-derived compounds. Each axis represents the exponential phase relative to the ancestor for that compound, and each point is an evolved line. The dotted line is the 1:1 line.
Figure 3 with 2 supplements
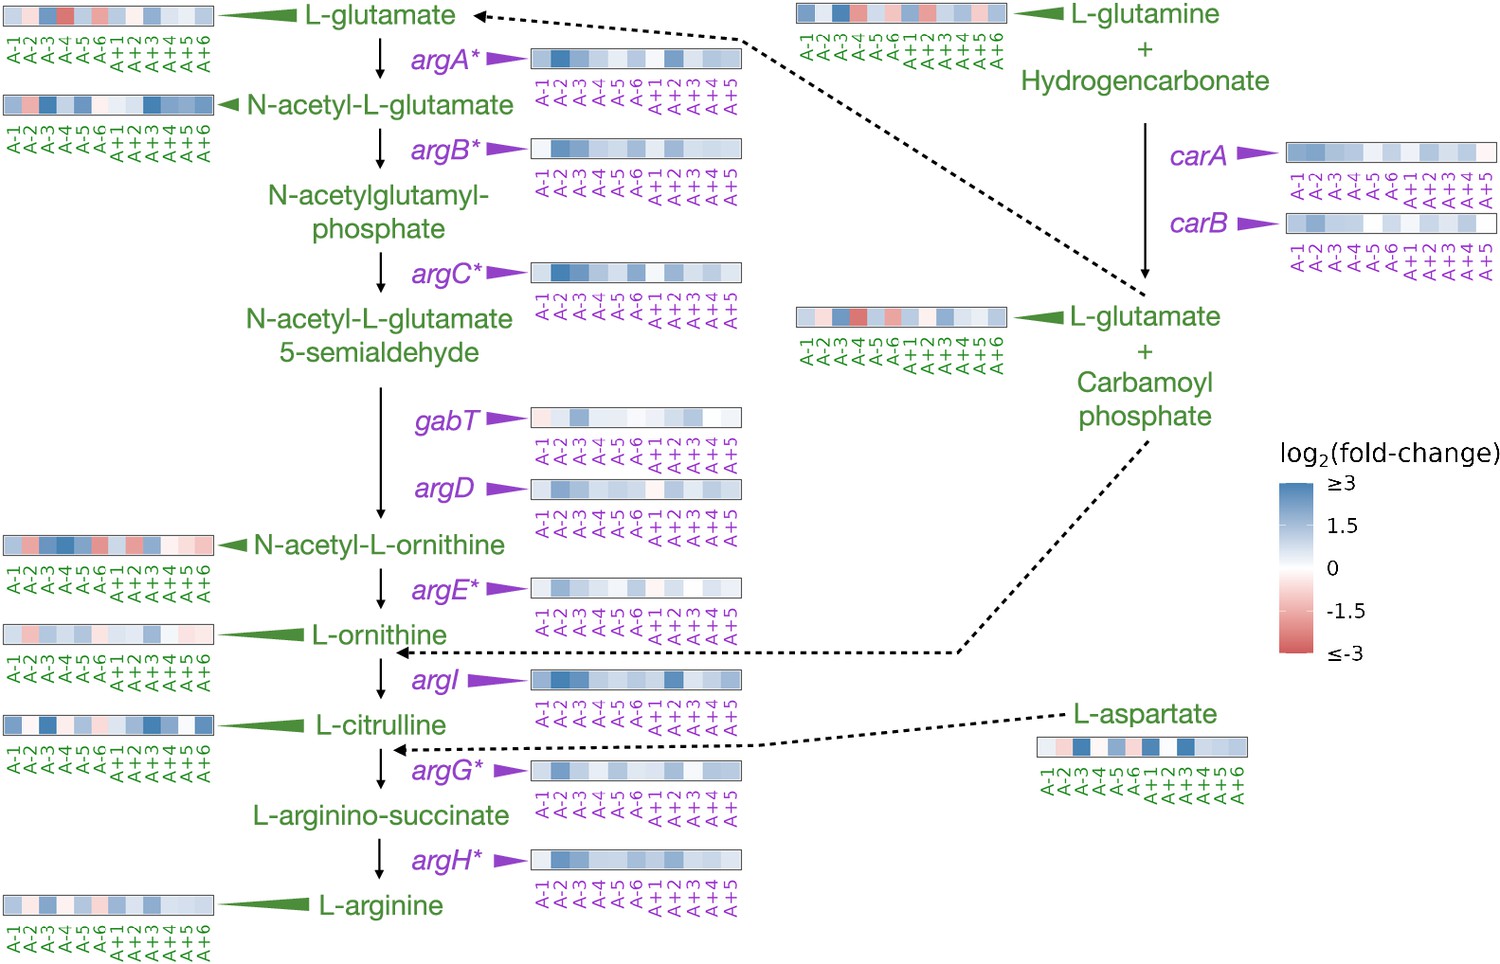
Partial depiction of the pathway ‘superpathway of arginine and polyamine biosynthesis’(Keseler et al., 2005).
All data represent exponential phase measurements. Genes that code for enzymes are shown in purple, and metabolites in green. Heatmaps positioned to the right of gene names show the fold-change in expression relative to the ancestor (data from Favate et al., 2022). Asterisks indicate genes that are transcriptionally regulated by ArgR. Heatmaps positioned near metabolite names show changes in metabolite abundance relative to the ancestor. Each heatmap represents one ionization mode, but a mixture of positive and negative ionization mode data is shown depending on which mode a compound was detected. See Figure 3—figure supplement 1A for complete data and Figure 3—figure supplement 2 for line-specific data.
Figure 3—figure supplement 1
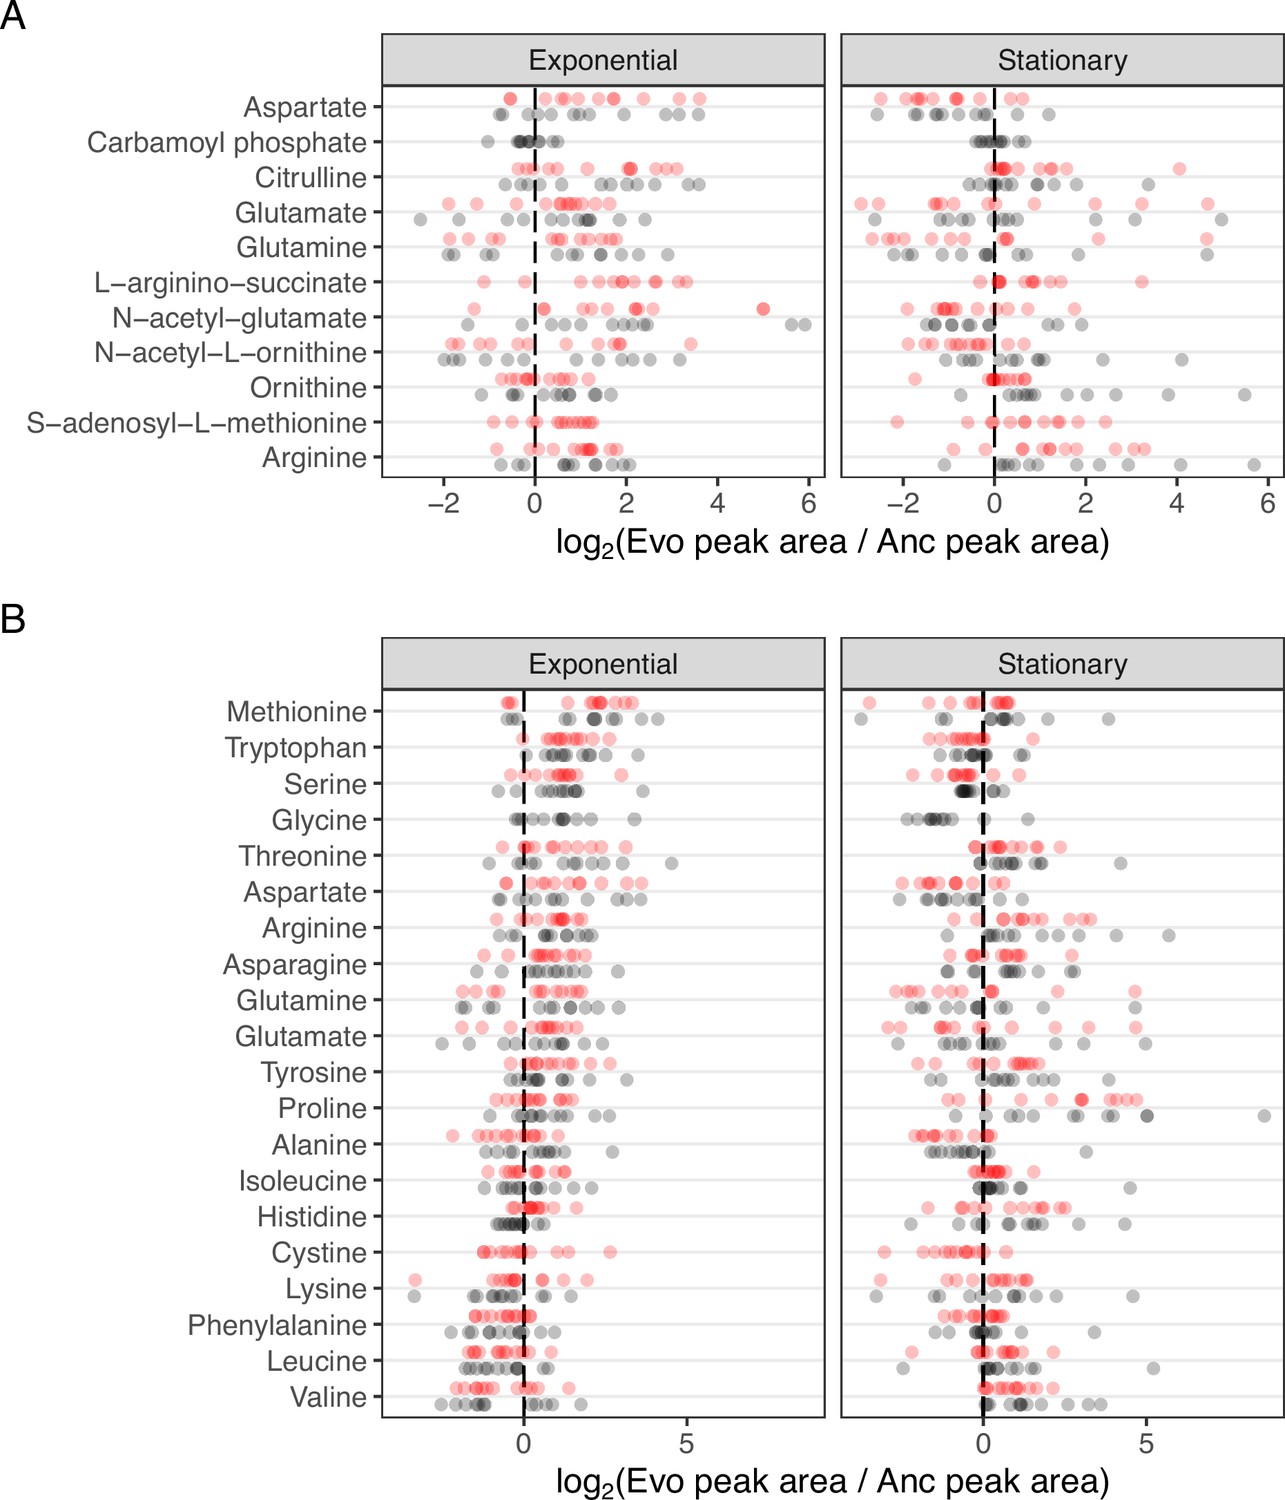
Changes in metabolite abundances of the Arginine biosynthesis pathway across evolved lines.
(A) Complete data for Figure 3. The distribution of fold-changes relative to the ancestor for each compound in each ionization mode is shown. Compounds are ordered from top to bottom roughly as they occur in the pathway. (B) Fold-change values for all amino acids. Amino acids are ordered by median fold-change in the exponential phase across both ionization modes.
Figure 3—figure supplement 2

Evolved line-specific metabolite and expression changes in Arginine biosynthesis pathways.
(A) Fold-changes for arginine-associated metabolites shown in a line-specific manner. Evolved lines are clustered based on fold-changes. Compounds are shown in positive ionization mode or in negative mode if they were not detected in positive mode. (B) Changes in gene expression for arginine-associated genes. RNAseq data are from Favate et al., 2022, and asterisks indicate a statistically significant change in expression. A+6 did not have RNAseq data.
Figure 4 with 1 supplement
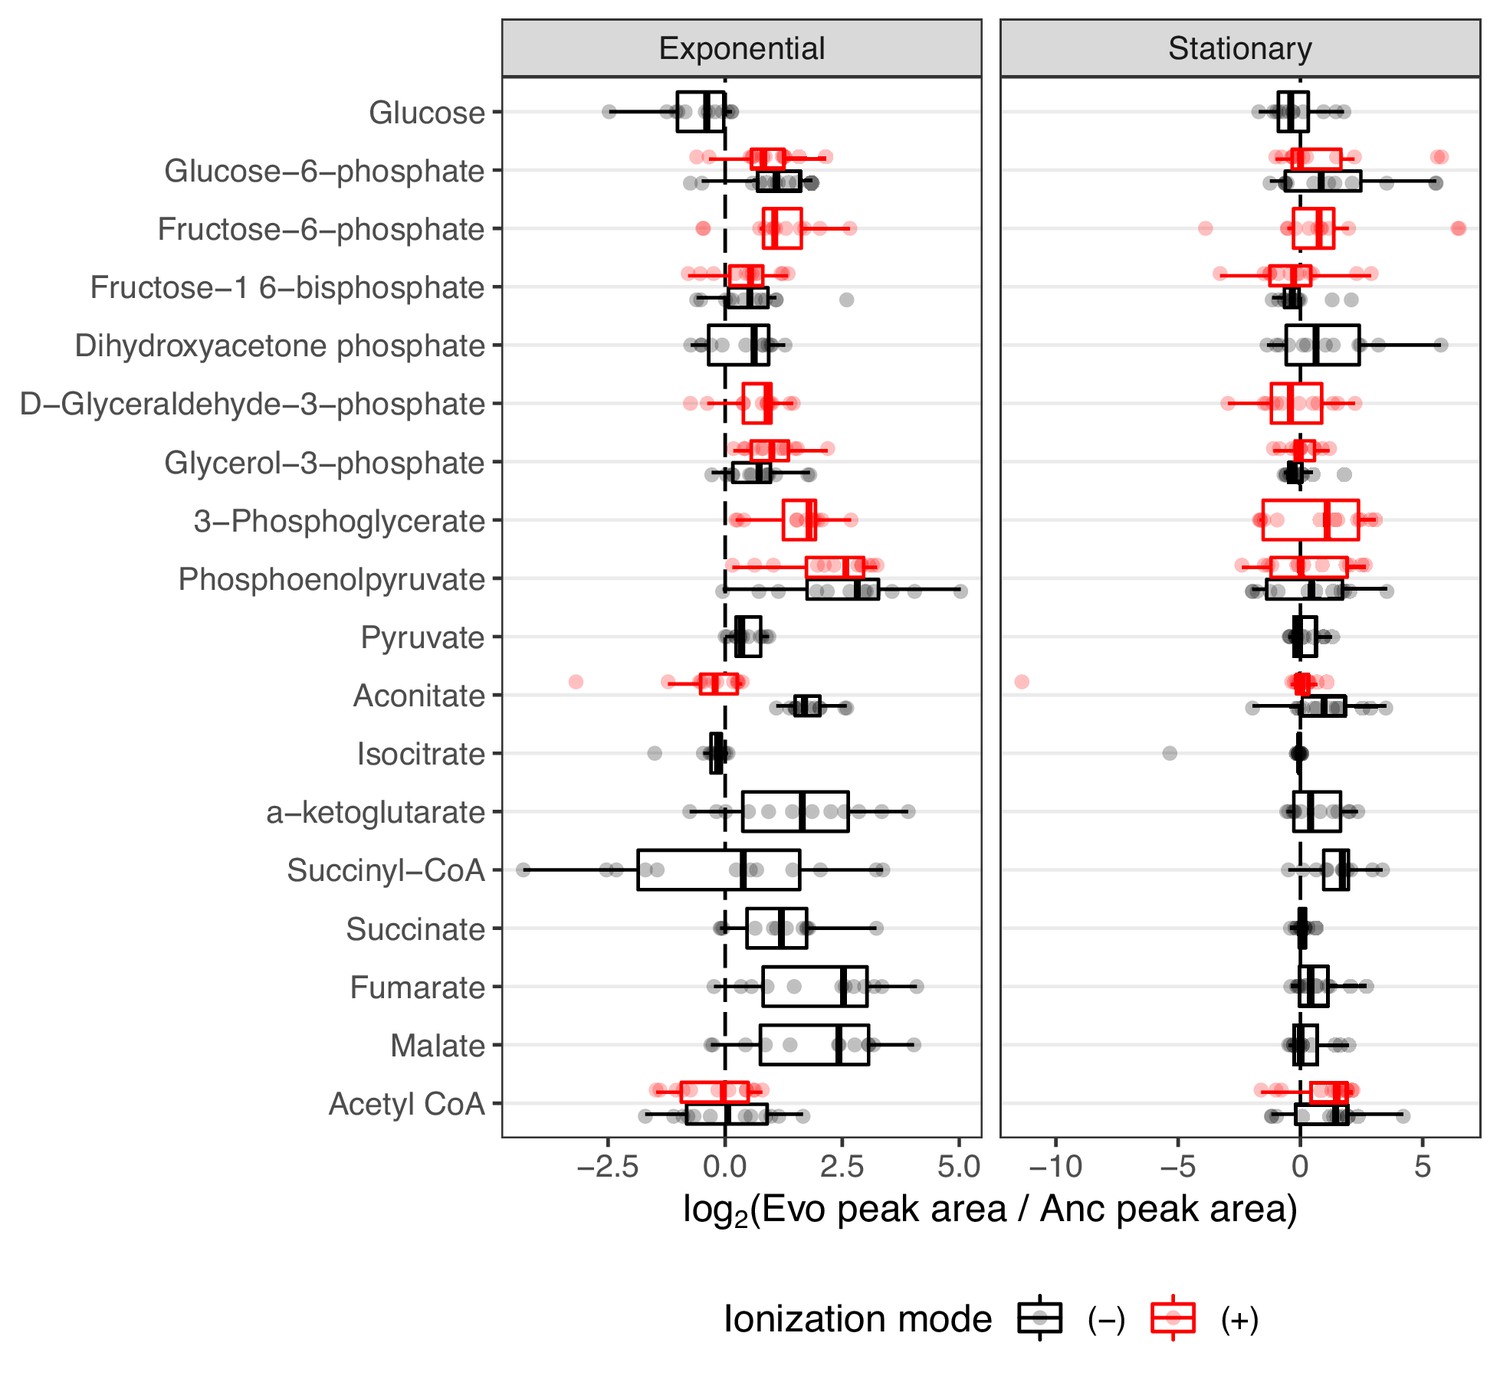
The distribution of fold-changes relative to the ancestor for compounds involved in carbon metabolism.
Red and black indicate detection in positive or negative ionization mode, respectively. Not all compounds were detected in both ionization modes. Compounds are ordered from top to bottom roughly as they occur in glycolysis or other reactions.
Figure 4—figure supplement 1

The relationship between fold-changes in malate and α-ketoglutarate and NAD(H) are correlated within an individual evolved line.
Because malate and α-ketoglutarate were only detected in negative ionization mode, only data from this mode are shown. The dotted line is the 1:1 line.
Author response image 1

Author response image 2
Author response image 3
Additional files
-
MDAR checklist
- https://cdn.elifesciences.org/articles/87039/elife-87039-mdarchecklist1-v1.pdf
-
Supplementary file 1
Mass-specrometry data.
This table contains the finalized data using for the analysis, including the imputed values. It contains the following columns; charge - the ionization mode of the instrument; line - the name of the strain; phase - (e)xponential or (s)tationary growth phase; repl - replicate; compound - name of the compound; is_standard- was this compound a calibratrion standard?; was_imputed - was this value imputed?; peak_area - the raw peak area; n_peak_area - the normalized peak area.
- https://cdn.elifesciences.org/articles/87039/elife-87039-supp1-v1.csv
Download links
A two-part list of links to download the article, or parts of the article, in various formats.
Downloads (link to download the article as PDF)
Open citations (links to open the citations from this article in various online reference manager services)
Cite this article (links to download the citations from this article in formats compatible with various reference manager tools)
Linking genotypic and phenotypic changes in the E. coli long-term evolution experiment using metabolomics
eLife 12:RP87039.
https://doi.org/10.7554/eLife.87039.3


