Switching of RNA splicing regulators in immature neuroblasts during adult neurogenesis
- Université Paris Cité, Inserm, CEA, Stabilité Génétique Cellules Souches et Radiations, LRP/iRCM, France
- Université Paris-Saclay, Inserm, CEA, Stabilité Génétique Cellules Souches et Radiations, LRP/iRCM, France
- Spinal Cord Injury and Tissue Regeneration Center Salzburg (SCI-TReCS), Paracelsus Medical University, Austria
- Institute of Experimental Neuroregeneration, Paracelsus Medical University, Austria
- Austrian Cluster for Tissue Regeneration, Austria
- Inserm, ARTbio Bioinformatics Analysis Facility, Sorbonne Université, CNRS, Institut de Biologie Paris Seine, France
- ARTbio Bioinformatics Analysis Facility, Sorbonne Université, CNRS, Institut de Biologie Paris Seine, France
Figures
Figure 1 with 2 supplements
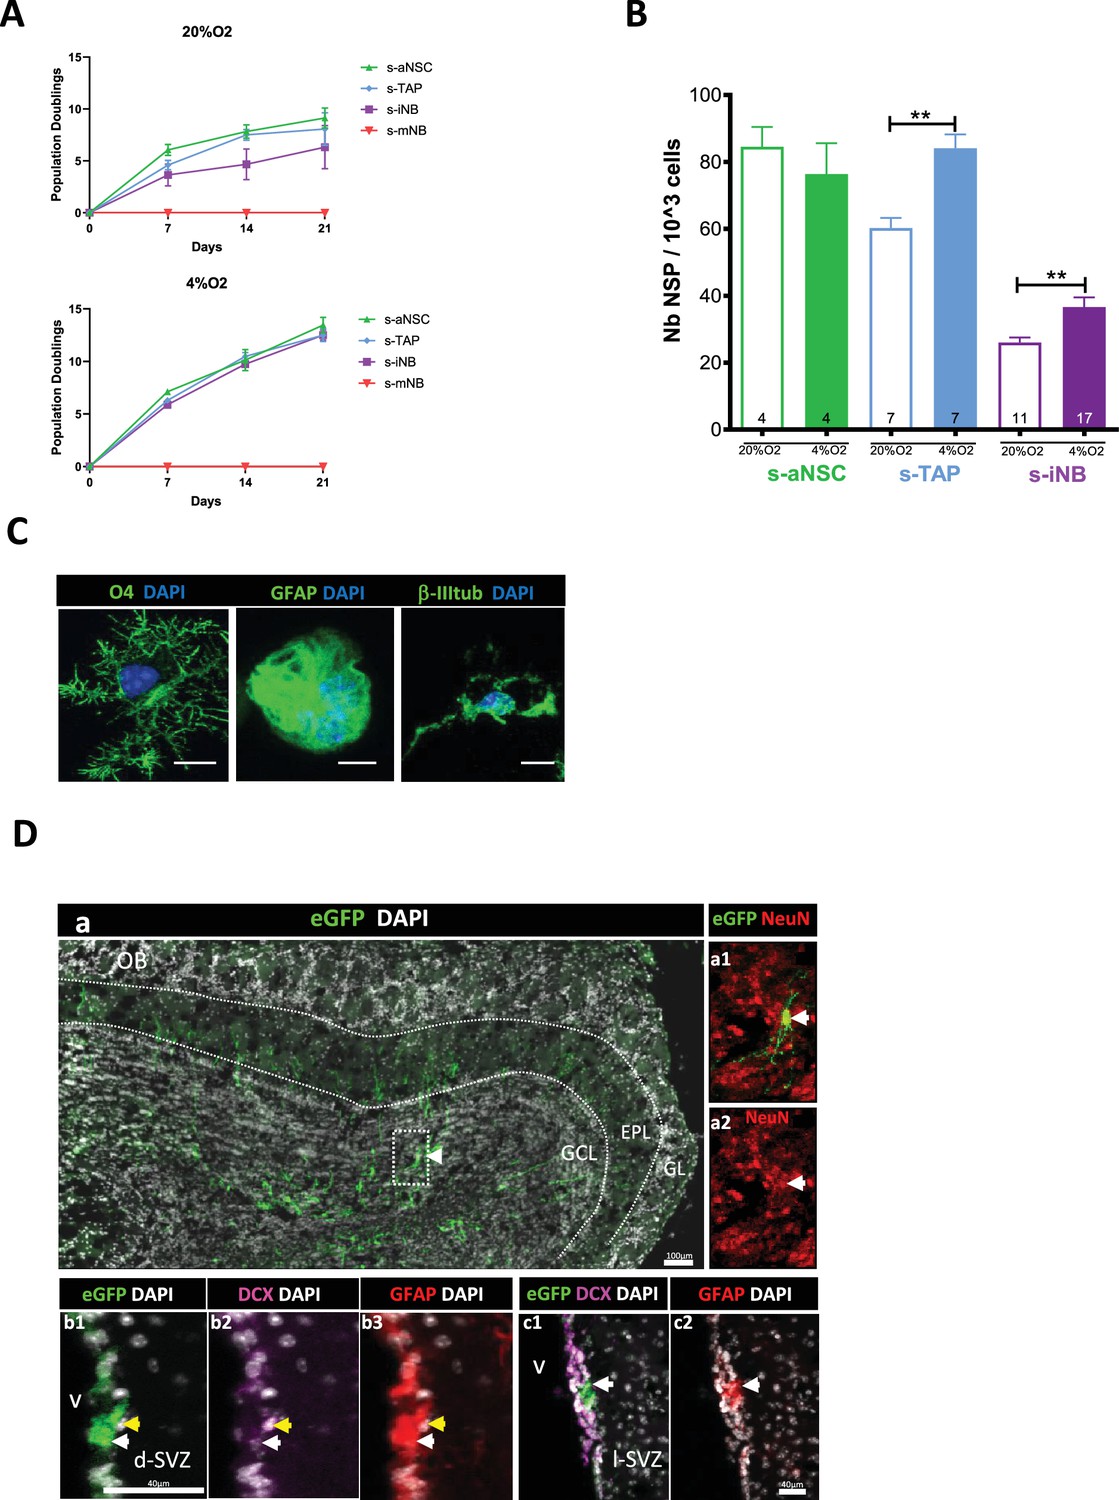
Plasticity of iNB in vitro and in vivo: s-aNSC, s-TAP, s-iNB, and s-mNB were sorted from the SVZ of 2-month-old C57Bl/6 mice.
(A) Population doublings (PD). Data were obtained from three independent experiments (n=8). (B) Clonogenicity assay. Results were obtained from two independent experiments. The number inside the bars indicated the number of microplate wells analyszed (mean ± SEM). (C) Differentiation assay. Representative images of immunofluorescence of freshly sorted iNB cells cultured in oligodendrocyte, astrocyte, or neuronal differentiation medium, and stained for NG2 and CNPase, GFAP and CD133 or βIII-Tubulin and doublecortin (DCX) expressions, respectively. *p<0.05, **p<0.01, ***p<0.001 (Mann-Whitney U-test). Scale bar: 20 µm. (D) EGFP-positive s-iNB were isolated from β−actin:eGFP mice and transplanted unilaterally at three injection points at proximity of the dSVZ/RMS of recipient C57Bl/6 J mice. Transplanted brains were analyszed 5 weeks later by immunostaining. (a) Detection of eGFP + cells in the granule cell layer and the external cell layer of the olfactory bulb of a mouse transplanted. (a1–a2) a2 high magnification of the inset (dotted line in a) showing eGFP + NeuN + cells (white arrows). (b–c) Detection of eGFP+ GFAP+ DCX+ cells (yellow arrows) and eGFP +GFAP + (white arrows) in the dorsal (b2) and lateral (c2) SVZ. GCL:granule cell layer, EPL: external plexiform layer, GL: glomerular layer, lSVZ: lateral SVZ, dSVZ: dorsal SVZ, Scale bars = 40 µm or 100 µm.
Figure 1—figure supplement 1

Expression of neural progenitor markers by SVZ cell-sorted populations.
s-aNSC, s-TAP, s-iNB, and s-mNB cells were sorted from the SVZ of 2-month-old C57Bl/6 mice, fixed and stained with antibodies against DLX2, a marker of proliferating progenitors (Doetsch et al., 2002) and SOX2 that plays an essential role in the maintenance of neural progenitors (Zhu et al., 2014) Quantifications of sorted SVZ cells (s-aNSC/s-TAP n=81, s-iNB=154, s-mNB=62) expressing DLX2 (A) and SOX2 (B). *p<0.05, **p<0.01, ***p<0.001 (Mann -Whitney U-test).
Figure 1—figure supplement 2
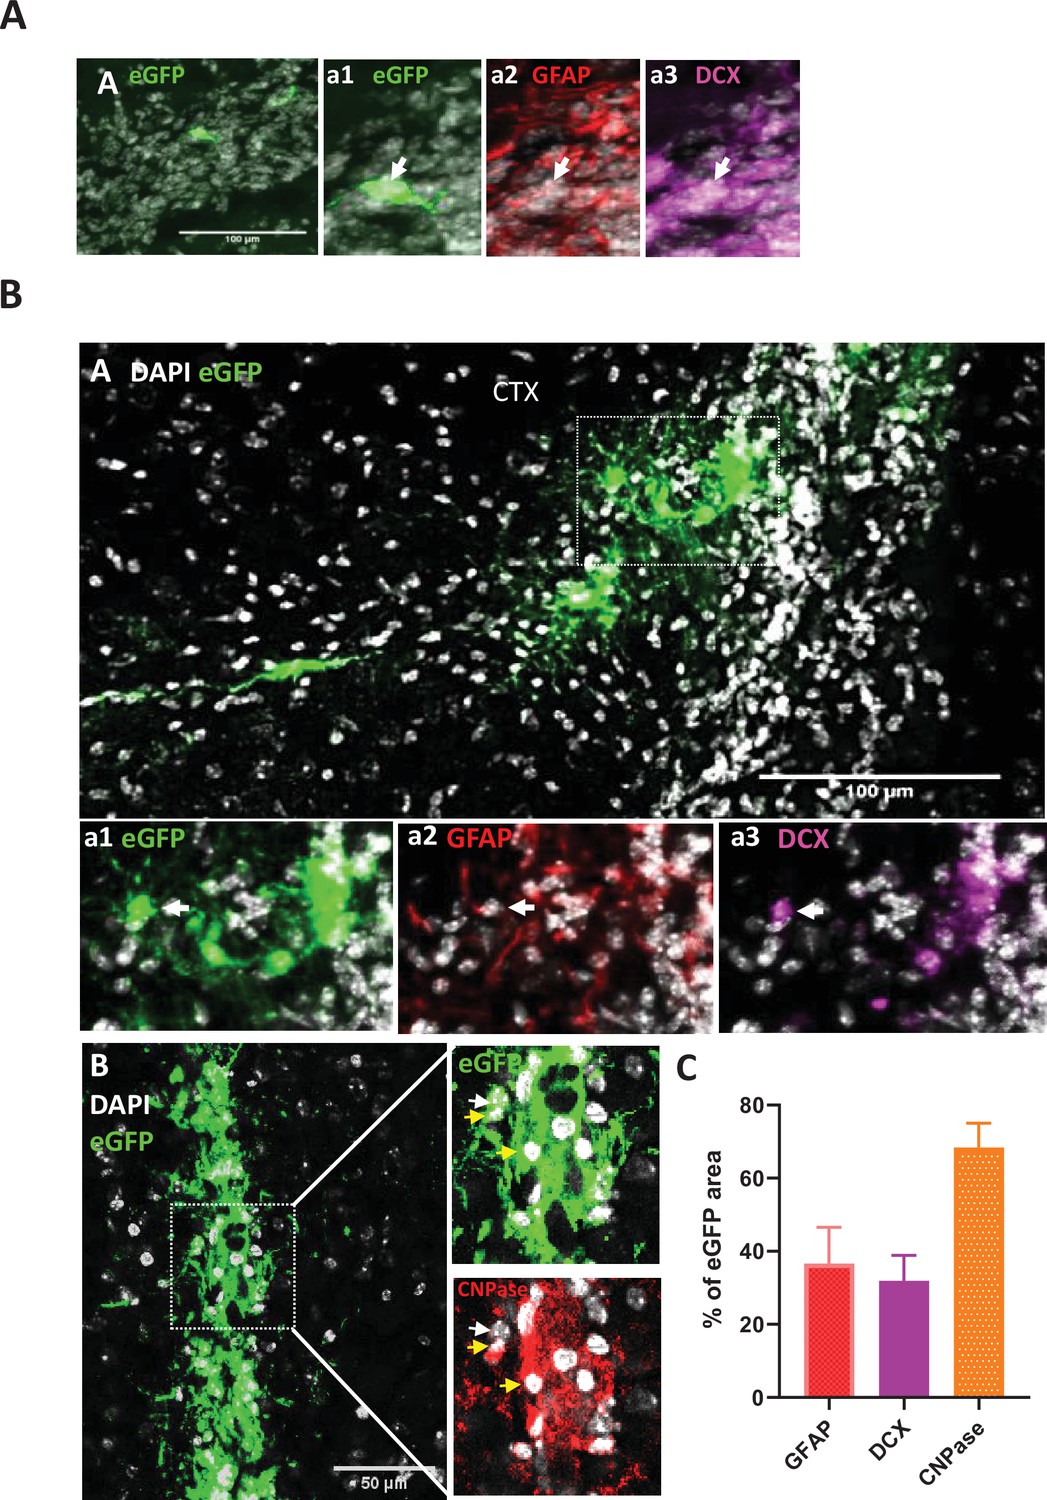
eGFP+ s-iNB cells in the rostral migratory stream and regenerative potential of eGFP +s iNB in vivo.
Immunofluorescence of mouse brains transplanted unilaterally in 3 injection points near the dSVZ/RMS with eGFP+iNB cells isolated from β-actin:eGFP mice. Transplanted brains were analyszed 5 weeks later. (A) Example of EGFP+iNB cell (white arrow) that has reached the rostral migratory stream and expressed DCX (inset a3), but not GFAP (inset a2). Insets are high magnification panels. (B) eGFP+ cells persisting at IS expressing astrocyte or oligodendrocyte markers. High magnifications of the inset1 (dotted line in A) showing eGFP+ GFAP+ cells (white arrow) (a2) and eGFP+DCX+ cells (white arrow) (a3). High magnifications of the inset2 (dotted line in B) showing eGFP+ CNPase+ (yellow arrow) and eGFP+CNPase- (white arrow). Scale bars = 100 µm. (C) Quantitative analysis of GFAP, CNPase or DCX antibodies staining of GFP-positive cells persisting at IS (where high number of grafted cells were found) in (A, B, C). This was performed by using the NIS software measuring eGFP-, GFAP-, CNPase- and DCX-positive areas, n = 7-8 mice brains. The intersections between each marker and eGFP areas were determined as a percentage of staining. The results showed that approximately one third of eGFP + cells expressed GFAP or DCX. The quantitative analysis of CNPase expression specific to eGFP + cells was complicated by host cells, but an overexpression in eGFP-positive areas clearly revealed the expression of CNPase by a significant faction of these cells.
Figure 2 with 3 supplements
Transcriptomic analysis of SVZ neural progenitor cells.
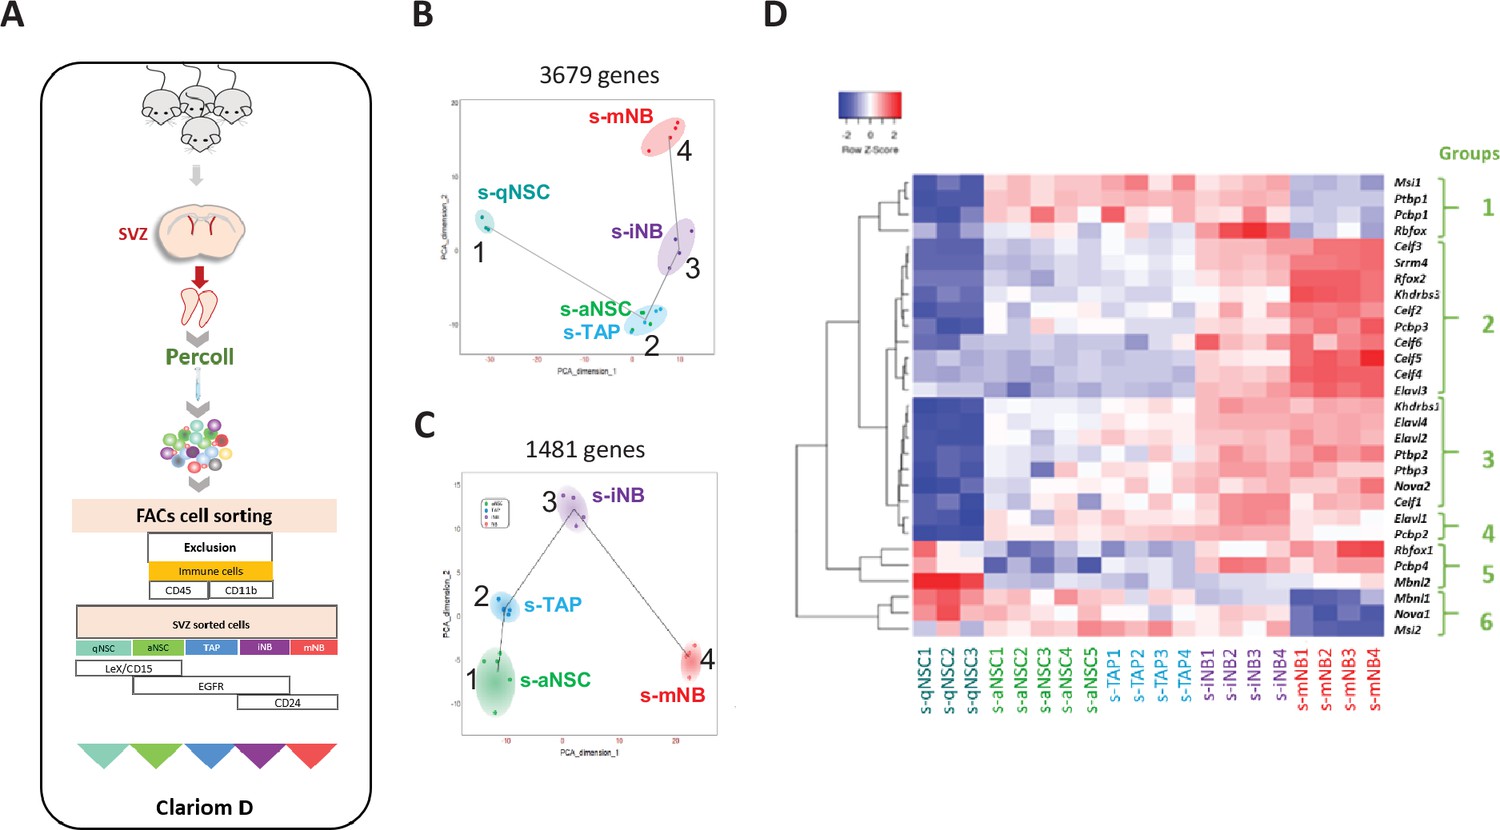
(A) Schematic illustration of our strategy of flow cytometry cell sorting of the five major neurogenic populations (s-qNSC, s-aNSC, s-TAP, s-iNB, s-mNB) of SVZ microdissected from adult mouse brains. (B) Pseudotime analysis showing the lineage progression of sorted cell populations based on the highly dispersed genes between s-qNSC, s-aNSC, s-TAP, s-iNB, and s-mNB. (C) Pseudotime analysis after exclusion of s-qNSC based to further discriminate s-aNSC and s-TAP. (D) Heatmap representation of RSR genes differentially expressed among s-aNSC, s-TAP, s-iNB, s-mNB (FDR p-value <0.05).
Figure 2—figure supplement 1

Functional enrichment analyses of the individual transcriptome signature of neurogenic populations.
Comparisons of individual transcriptome signatures with various Gene Ontology gene sets and Biological pathways using the g:Profiler software highlight significant stage-dependant changes. S-qNSCs expressed genes related to Metabolism of lipids, Transport of small molecules. S-aNSC expressed genes involved in Glyoxylate and decarboxylate metabolism. S-TAP significantly displayed genes involved in Mitotic G1 phase and G1/S transition and S Phase. S-iNB specifically expressed Cell Cycle and Mitotic genes in contrast to s-mNB which are characterised by the expression of Axon guidance and Nervous system development genes.
-
Figure 2—figure supplement 1—source data 1
Transcriptomic signatures of s-qNSC, s-aNSC, s-TAP, s-iNB and s-mNB (Clariom assay) and corresponding g:Profiler Gene Ontology analyses.
- https://cdn.elifesciences.org/articles/87083/elife-87083-fig2-figsupp1-data1-v1.xlsx
Figure 2—figure supplement 2

Enrichment of GO terms corresponding to mRNA splicing isoforms in the different types of sorted SVZ cells.
Comparisons of individual mRNA splicing isoforms with the Gene Ontology Biological pathway sets using the Gene Set Enrichment Analysis (GSEA) interface. This analysis clearly revealed splicing in genes involved in neuron development and neurogenesis in all SVZ cells. Interestingly, this also showed that s-qNSC logically differed from the other cell types by splicing in genes involved in mitosis and cell cycle. More importantly, GO annotations in differentially spliced isoforms emphasized the close proximity of s-aNSC and s-TAP on one hand and s-iNB and s-mNB on the other hand confirming than s-iNB are closer to s-mNB than s-TAP.
-
Figure 2—figure supplement 2—source data 1
Differentially spliced genes (DSG) unique to s-qNSC, s-aNSC, s-TAP, s-iNB, and s-mNB and corresponding Gene Enrichment Analyses (GSEA).
- https://cdn.elifesciences.org/articles/87083/elife-87083-fig2-figsupp2-data1-v1.xlsx
-
Figure 2—figure supplement 2—source data 2
Differentially spliced genes in each transition along SVZ neurogenesis and corresponding g.Profiler Gene Ontology analyses.
- https://cdn.elifesciences.org/articles/87083/elife-87083-fig2-figsupp2-data2-v1.xlsx
-
Figure 2—figure supplement 2—source data 3
Differentially expressed genes (DEG) among RNA splicing regulators (RSR) genes in each transition along SVZ neurogenesis.
- https://cdn.elifesciences.org/articles/87083/elife-87083-fig2-figsupp2-data3-v1.xlsx
Figure 2—figure supplement 3

Correspondence between the molecular signatures of sorted neural progenitor populations in our study and available sc-RNA-seq datasets.
Violin diagrams representing the expression of selected clusters from published sc-RNAseq analysis in our Clariom microarray(14,17,32). S-qNSC perfectly matched the expression of Glial markers (Class III)(32), qNSC(17) and Quiescent B cells (clusters 5 and 14)(14). In contrast, s-aNSC poorly matched with Lipid biosynthesis (Class III) and Cell cycle (Class IV)(32), aNSC(17) and Activated B cells (Cluster 13)(14). Similarly, s-TAP poorly matched with TAP(17) and C cells (Cluster 12)(14). S-iNB perfectly fit with Mitosis (Class VI), mitotic TAP (mTAP) (Zywitza et al., 2018) and Mitosis (Cluster 8, 10,16 and 17)(14). s-mNB overlapped genes related to Neuron differentiation (Class VII), Late NBs (17) and A cells (clusters 0, 1 and 4).
Figure 3 with 2 supplements
scRNA-seq analysis: whole SVZ.
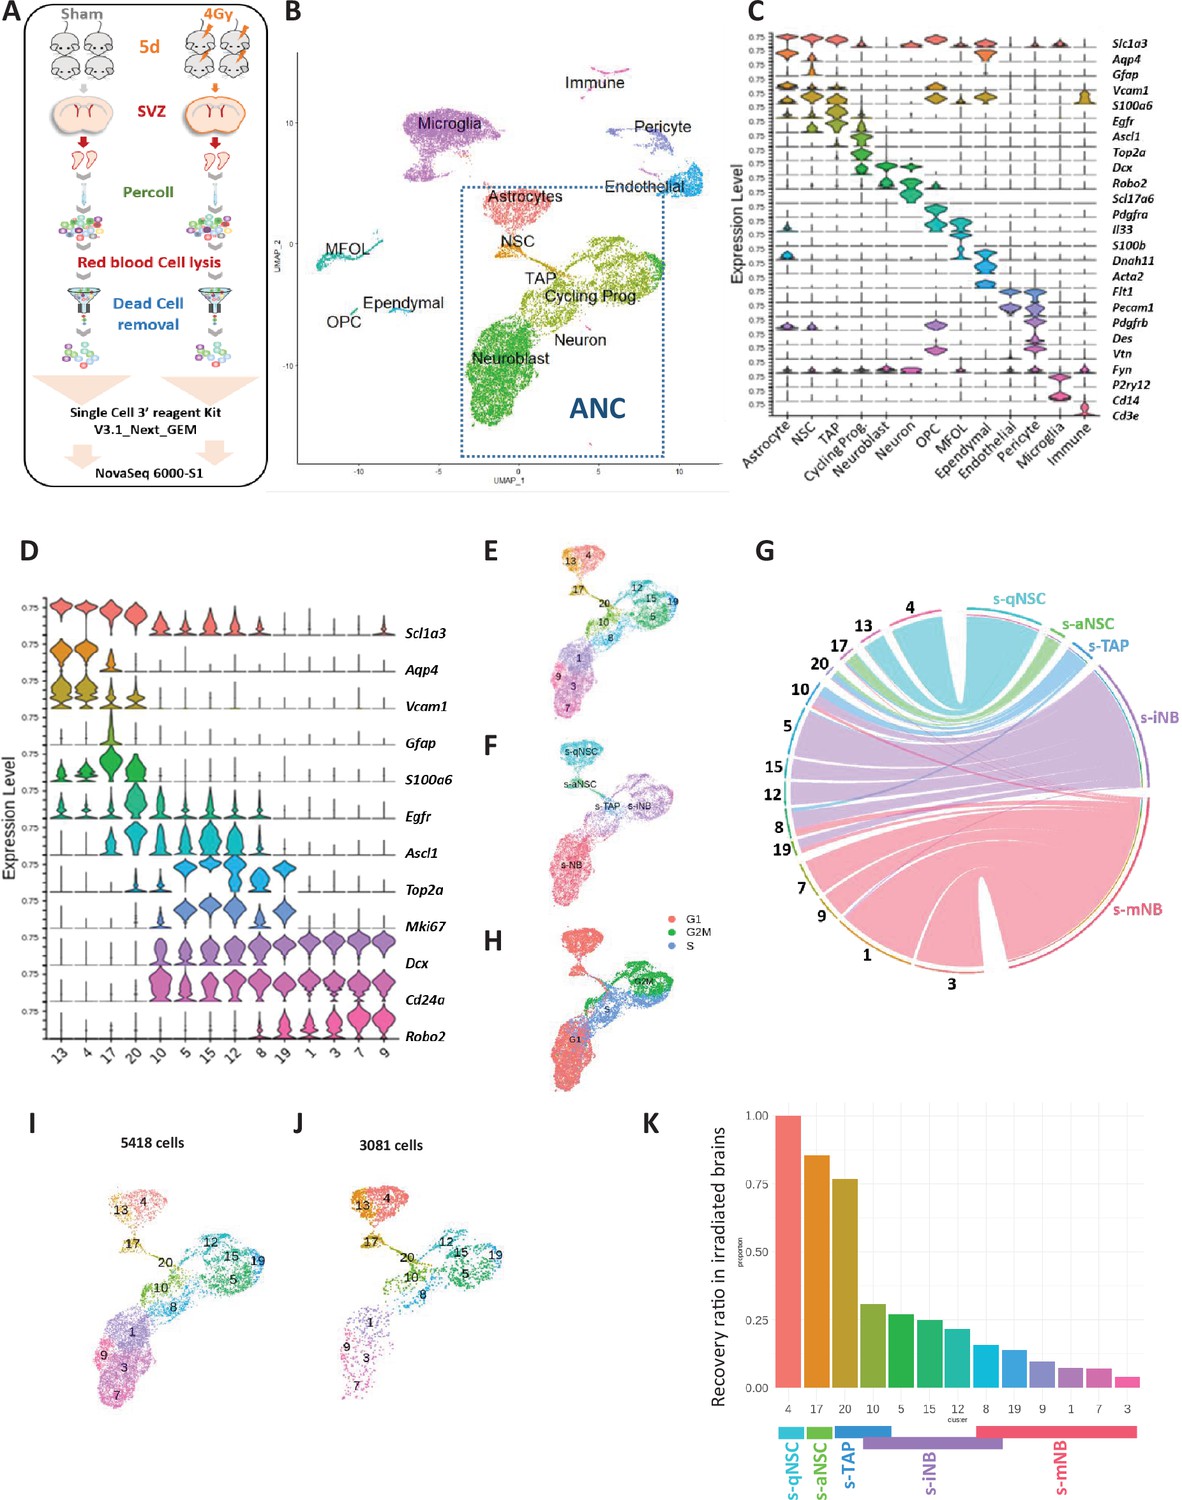
(A) Experimental design. (B) Uniform Manifold Approximation and Projection (UMAP) of the 17343 high-quality sequenced cells annotated with corresponding cell type, combining scRNA-seq datasets of non-irradiated mice and 4 Gy irradiated mice. Clustering analysis at resolution 1.2 segregated cells into 33 clusters that were matched with corresponding cell types determined with marker expression in (C). Among them, 14 clusters (dotted lines rectangle) corresponded to the clusters of astrocytes and neurogenic cells (ANC). (C) Violin diagrams illustrating the expression level of known cell markers in the 33 clusters according to the literature. (D) Violin diagrams representing the expression level of selected markers specific to neurogenic cells and astrocyte from ANC clusters at the resolution 1.2. (E) UMAP focusing on the ANC subset. (F) UMAP of the top UCell score for the top 100 highly expressed genes of each neurogenic cell sorted population in the ANC clusters (Figure 2—figure supplement 1—source data 1). (G) Chord diagram illustrating the correspondence of cell clusters with cell top score. Cluster 10 matched with both s-TAP and s-iNB and clusters 8 and 19 both to s-iNB and to s-mNB. (H) Feature plot of cell cycle scoring (I, J) UMAP representation of ANC clusters in the unirradiated (I) and irradiated (J) samples. (K) Barplot showing the recovery ratios of each ANC cluster in irradiated brains calculated as the number of cells per clusters from irradiated brains /control brains normalized to the respective numbers of s-qNSC (cluster 4). Taking into account UCell score results, s-iNB clusters overlapped the cluster 10 and 8 containing s-TAP and s-mNB, respectively.
Figure 3—figure supplement 1
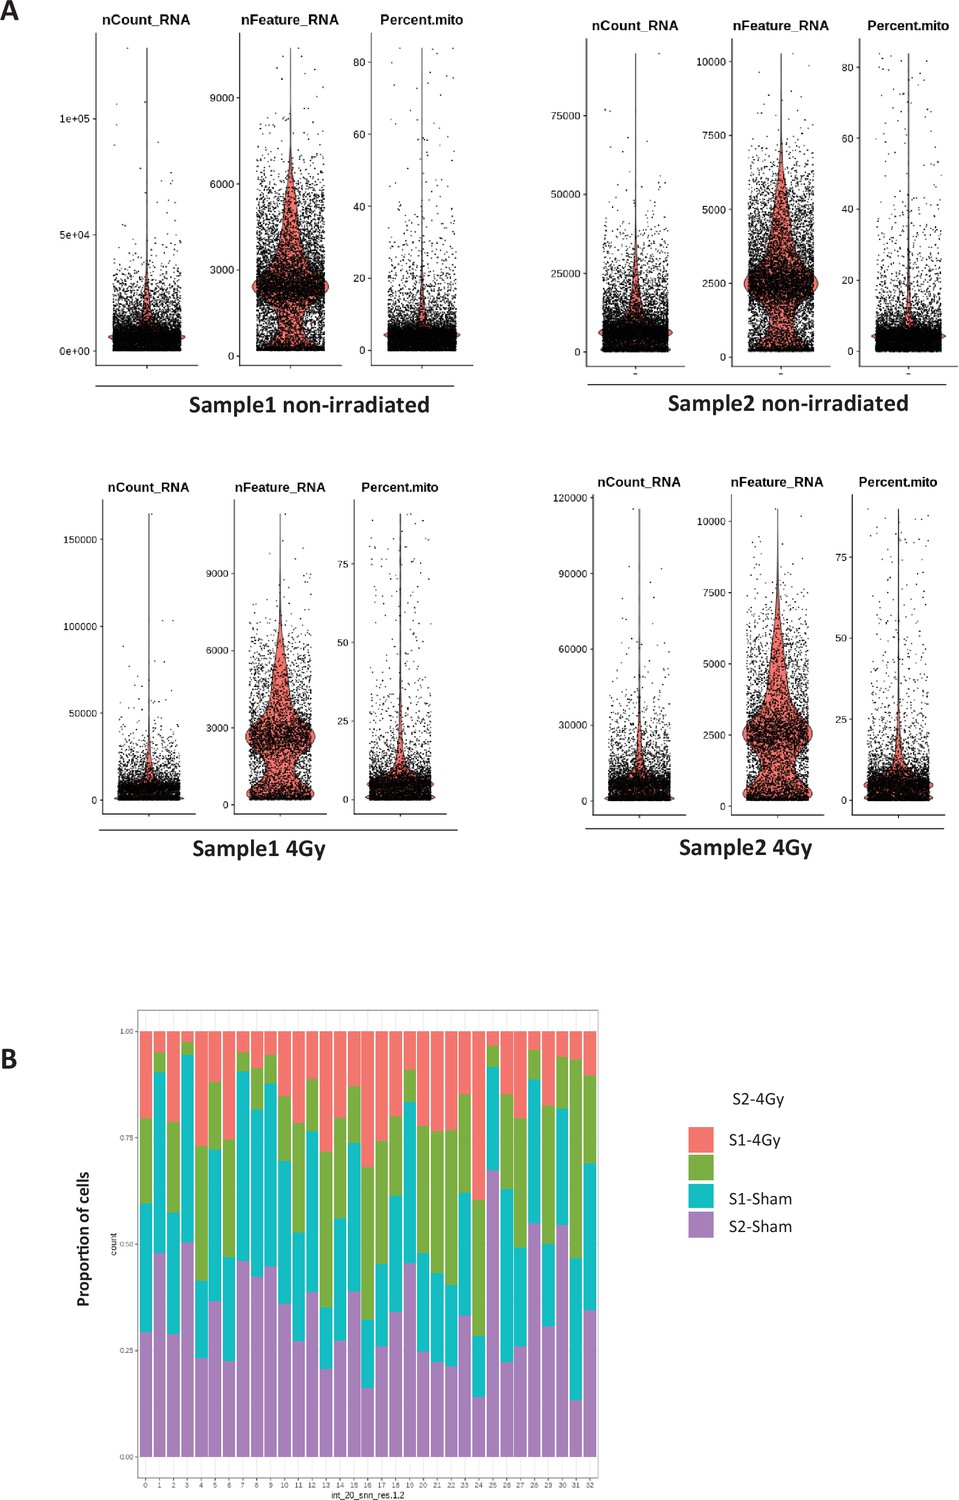
Quality controls of scRNA-seq on whole SVZ tissues.
Quality controls of scRNA-seq on whole SVZ tissues (A) Violin diagrams of the nCount_RNA, the nFeature_RNA and the mitochondrial percentage (Percent.mito) before applying cut-offs adapted to each non-irradiated and irradiated samples. (B) Proportion of cells from the 4 samples in the 33 clusters.
Figure 3—figure supplement 2

Annotation of sc-RNAseq clusters and identification of astrocytes and qNSCs.
(A) UMAP at the resolution 1.2 combining scRNA-seq datasets of unirradiated and 4Gy irradiated cells segregated into 33 clusters. (B) Violin diagrams illustrating the expression level of known cell markers in the 33 clusters according to the literature. (C) UMAP of top normalized UCellScore Astrocyte- and the B-cell-specific genes described by Cebrian-Silla et al., 2021 for cells from clusters 4 and 13.
Figure 4
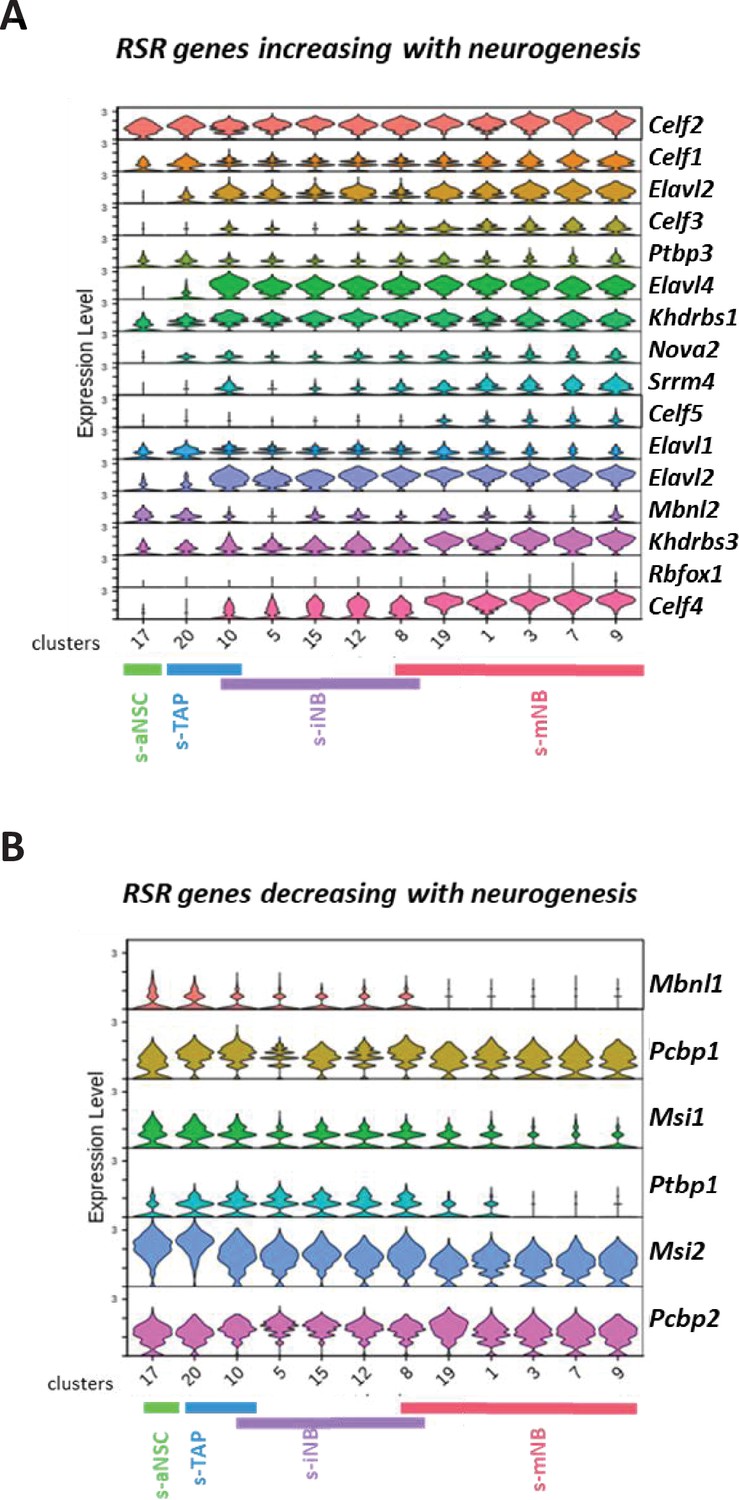
Expression of RSR genes in scRNA-seq neurogenic clusters.
Violin diagrams illustrating the expression of the RSR genes increasing (A) or decreasing (B) with neurogenesis.
Figure 5 with 2 supplements
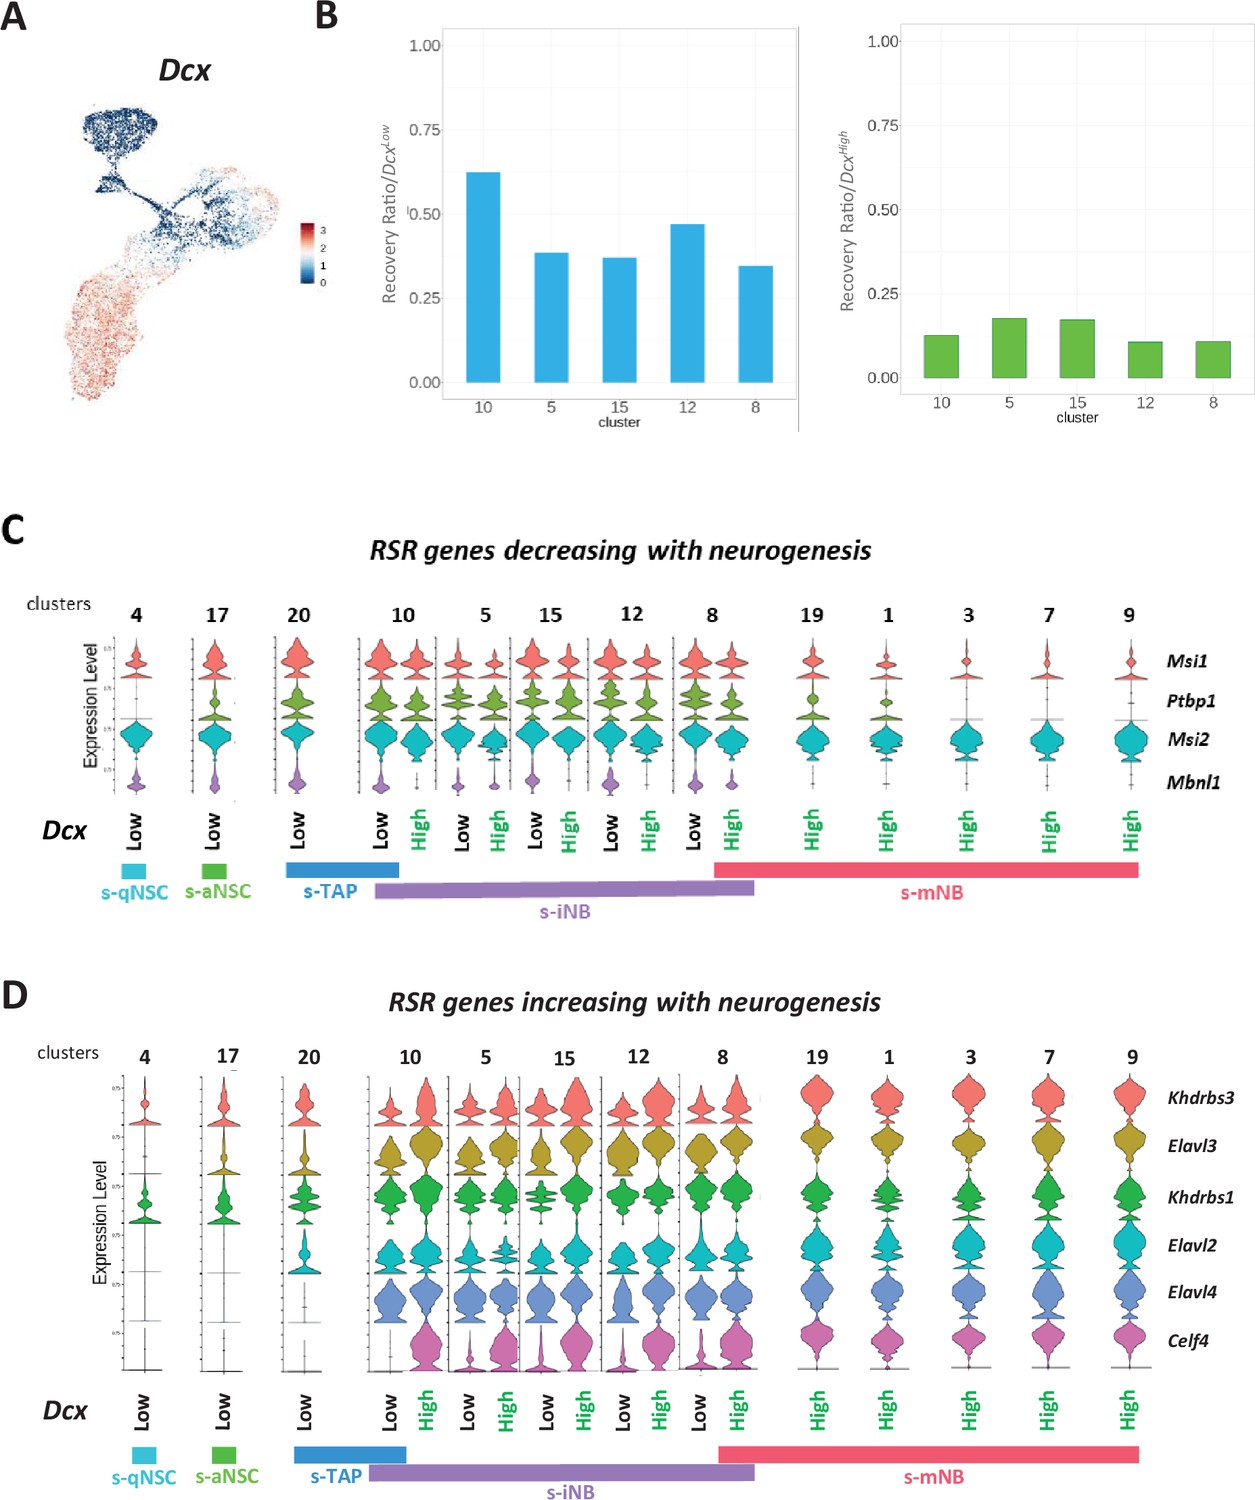
Dcx expression in the neurogenic cell clusters.
(A) Feature plot. (B) Barplot representations of the recovery ratios of Dcxlow (left) and DcxHigh (right) in the iNB clusters of the irradiated brains, calculated as in Figure 3K. Violin diagrams illustrating the expression level of RSR genes decreasing (C) and increasing (D) with neurogenesis in Dcxlow and DcxHigh in neurogenic cell clusters.
-
Figure 5—source data 1
Differentially expressed genes of s-INB DcxHigh and s-iNB DcxLow cells and functional profiling using g:Profiler interface.
- https://cdn.elifesciences.org/articles/87083/elife-87083-fig5-data1-v1.xlsx
Figure 5—figure supplement 1

Expression of Dcx in scRNA-seq neurogenic clusters.
Violin diagram of the expression of Dcx in cells from neurogenic clusters illustrating two populations of iNB: iNB DcxHiigh and iNB DcxLow cells.
Figure 5—figure supplement 2

Expression of RSR genes in scRNA-seq neurogenic clusters in irradiated brains.
Violin diagrams illustrating the expression of the RSR genes increasing (A) or decreasing (B) with neurogenesis.
Figure 6

Plasticity of DcxHigh iNB in vitro.
(A) Clonogenic potential of FACS-isolated eGFP+iNB and eGFP-iNB, and recombined eGFP+mNB isolated from DCX-CreERT2::CAG-floxed-eGFP mice, 7 days after the first injection of tamoxifen. (B) Population doublings (PD) of FACS-isolated eGFP+iNB and eGFP-iNB, eGFP+mNB cells and total iNB cells (regardless of eGFP status). No statistical difference was found in the growth rate of the different isolated populationss, Mann-Whitney U-test., (n=8) (C) Representative images of immunofluorescence of freshly sorted eGFP+iNB cells cultured in oligodendrocyte,astrocyte, or neuronal differentiation medium, and stained for NG2 and CNPase, GFAP and CD133, βIII-Tubulin and DCX, respectively. Scale: 10 µm. (D) Quantification of the percentage of eGFP+ iNB among DAPI cells cultured in differentiation media that differentiate in either neurons (βIII-tubulin), oligodendrocytes (NG2) or astrocytes (GFAP).
Figure 7
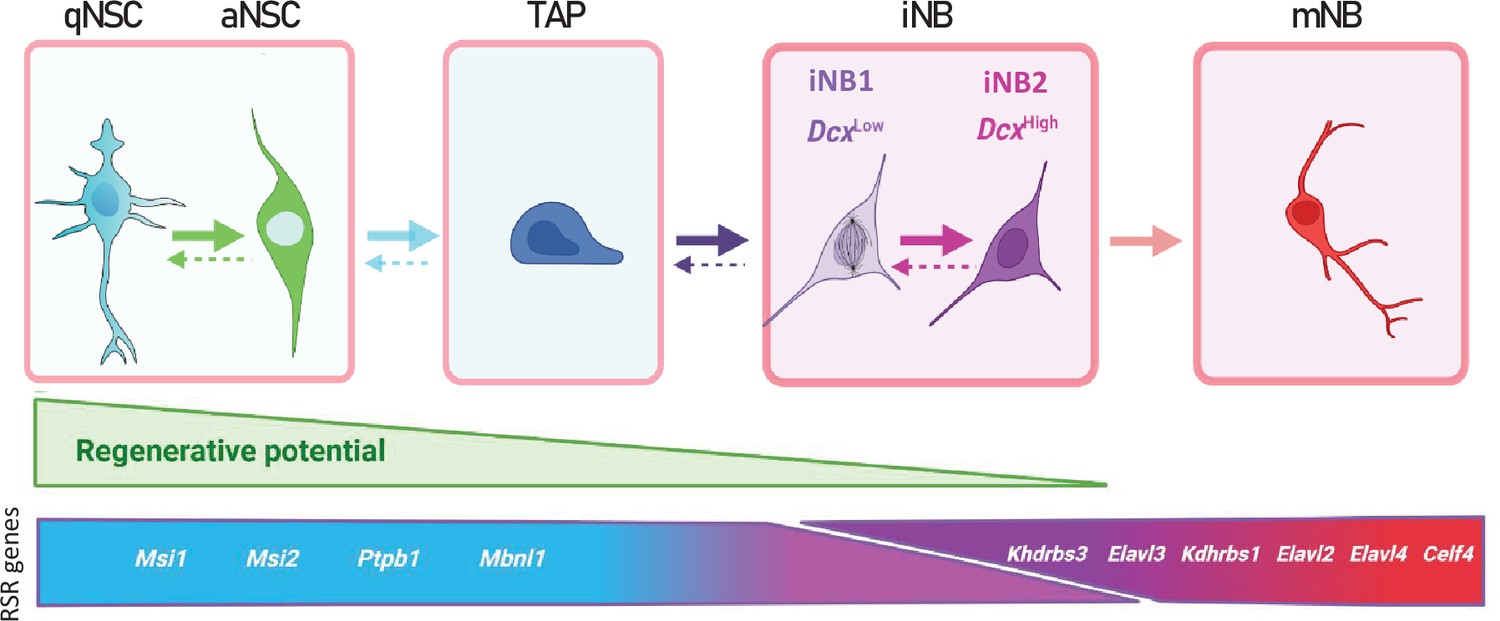
Proposed model of adult mouse SVZ neurogenesis involving major changes in RSR genes expression.
Possible interconversion of iNB states would require further experimental confirmation.
Author response image 1

Modal histogram representation of DCX expression level in unstained, iNB and mNB cells determined by flow cytometry (FlowJo).
Author response image 2

Pseudotime analysis using Monocle 3 (excluding the cluster 13 corresponding to astrocytes and starting from s-qNSC) revealed two branches starting from s-TAP, one towards cell cycle the other towards neuronal differentiation.
Tables
Table 1
Transplantations of eGFP+s-iNB, eGFP-s-iNB and eGFP+s-mNB freshly isolated from β-actin:eGFP mice model.
Table recapitulating the immunohistological analyses of the numbers of eGFP+ cells in different regions in recipient C57Bl6/J mice brains, 5 weeks after transplantation.
| IS | SVZ | CC | OB | |||||||
|---|---|---|---|---|---|---|---|---|---|---|
| Nb eGFP + cells | % | Nb eGFP + cells | % | Nb eGFP + cells | % | Nb eGFP + cells | % | Total eGFP + cells | ||
| s-aNSC/s- TAP | Animal 1 | 271 | 62.6 | 17 | 3.9 | 55 | 12.7 | 90 | 20.8 | 433 |
| 1.3–1.5x10⁴ | Animal 2 | 300 | 31.9 | 79 | 8.4 | 47 | 5.0 | 515 | 54.7 | 941 |
| eGFP + engrafted cells | Animal 3 | 95 | 37.1 | 73 | 28.5 | 22 | 8.6 | 66 | 25.8 | 256 |
| s-iNB | Animal 1 | 1025 | 65.2 | 16 | 1.0 | 49 | 3.1 | 483 | 30.7 | 1573 |
| 2x10⁴ | Animal 2 | 196 | 15.5 | 41 | 3.2 | 41 | 3.2 | 989 | 78.1 | 1267 |
| eGFP + engrafted cells | Animal 3 | 240 | 84.8 | 43 | 15.2 | 0 | 0 | 0 | 0 | 283 |
| s- aNSC/s- TAP | Animal 1 | 0 | 0 | 0 | 0 | 0 | 0 | 0 | 0 | 0 |
| 1.3– 1.5x 10⁴ | Animal 2 | 0 | 0 | 0 | 0 | 0 | 0 | 0 | 0 | 0 |
| eGFP + engrafted cells | Animal 3 | 0 | 0 | 0 | 0 | 0 | 0 | 0 | 0 | 0 |
-
IS = Injection Site; CC = Corpus callosum; SVZ = Subventricular zone; OB = Olfactive bulb.
Table 2
Transplantations of eGFP+s-iNB, eGFP-s-iNB and eGFP+s-mNB freshly isolated from DCX-CreERT2::CAG-floxed-eGFP mice model.
Table recapitulating the immunohistological analyses of the numbers of eGFP+ cells in different regions in recipient C57Bl6/J mice brains, 5 weeks after transplantation.
| IS | SVZ | CC | OB | Total eGFP + cells | |||||||
|---|---|---|---|---|---|---|---|---|---|---|---|
| eGFP + engrafted cells | NbeGFP + cells | % | NbeGFP + cells | % | NbeGFP + cells | % | NbeGFP + cells | % | 0 | ||
| s-iNB eGFP + | Animal1 | 0 | 0.0% | 0 | 0.0% | 0 | 0.0% | 0 | 0.0% | 0 | |
| s-iNB eGFP+ | Animal2 | 0 | 0.0% | 0 | 0.0% | 0 | 0.0% | 0 | 0.0% | 0 | |
| s-iNB eGFP + /eGFP- | Animal1 | 0 | 0.0% | 0 | 0.0% | 0 | 0.0% | 0 | 0.0% | 0 | |
| s-iNB eGFP+ /eGFP- | Animal2 | 0 | 0.0% | 0 | 0.0% | 0 | 0.0% | 0 | 0.0% | 0 | |
| s-iNB eGFP +eGFP- | Animal3 | 0 | 0.0% | 0 | 0.0% | 0 | 0.0% | 0 | 0.0% | 0 | |
| s-mNB eGFP+ | Animal1 | 0 | 0.0% | 0 | 0.0% | 0 | 0.0% | 0 | 0.0% | 0 | |
| s-mNB eGFP + | Animal2 | 0 | 0.0% | 0 | 0.0% | 0 | 0.0% | 0 | 0.0% | 0 | |
| s-mNB eGFP + | Animal3 | 0 | 0.0% | 0 | 0.0% | 0 | 0.0% | 0 | 0.0% | 0 | |
Key resources table
| Reagent type (species) or resource | Designation | Source or reference | Identifiers | Additional information |
|---|---|---|---|---|
| Genetic reagent (mouse) | β-actin:eGFP | The Jackson Laboratory (Okabe et al., 1997) | ||
| Genetic reagent (mouse) | DCX-CreERT2 ::CAG-CAT-eGFP | kindly given by Pr Couillard-Despres Sebastien (Zhang et al., 2010) | ||
| Antibody | PE-rat Anti-mouse monoclonal CD24 (clone 1/69) | BD Biosciences | Cat#307567; RRID:AB_2034001 | 1:50 |
| Antibody | FITC-rat Anti-mouse monoclonal CD15 (clone MMA) | BD Biosciences | Cat#340703; RRID:AB_400103 | 1:50 |
| Antibody | BV421-mouse monoclonal anti-human CD15 (Clone W6D3) | BioLegend | Cat#323039; RRID:AB_2566519 | 1:50 |
| Antibody | Alexa647-conjugated epidermal growth factor (EGF) ligand (clone 30H45L48) | Thermo Fisher Scientific | Cat#MA7-00308-A647; RRID:AB_2662334 | 1:200 |
| Antibody | Goat polyclonal anti-GFP | Abcam | Cat#ab6673; RRID:AB_305643 | 1:300 |
| Antibody | Rabbit polyclonal Anti-GFP | Abcam | Cat#ab290 | 1:300 |
| Antibody | Mouse monoclonal anti-mouse O4 (clone 81) | Merck Millipore | Cat#MAB345; RRID:AB_2313768 | 1:100 |
| Antibody | Rabbit polyclonal anti-mouse NG2 | Merck Millipore | Cat#AB5320, RRID:AB_91789 | 1:100 |
| Antibody | Goat polyclonal anti-mouse Dcx C-18 | Santa Cruz | Cat#sc-8066, RRID:AB_2088494 | 1:100 |
| Antibody | Rabbit polyclonal anti-mouse Dcx | Cell Signaling | Cat#4604, RRID:AB_561007 | 1:400 |
| Antibody | Rabbit monoclonal anti-mouse Tubulin b3 (TUBB3) | Covance | Cat#PRB-435P, RRID:AB_29163 | 1:200 |
| Antibody | Mouse monoclonal anti-mouse Gfap (clone GA5) | Merck Millipore | Cat#MAB3402, RRID:AB_94844 | 1:400 |
| Antibody | Rabbit polyclonal anti-mouse Gfap | Merck Millipore | Cat#G9269, RRID:AB_477035 | 1:400 |
| Antibody | Rat monoclonal anti-CD133 (clone 13A4) | Merck Millipore | Cat#MAB4310 | 1:100 |
| Antibody | Mouse monoclonal anti-mouse CNPase (clone 11-5B) | Merck Millipore | Cat#MAB326 | 1:100 |
| Antibody | Goat polyclonal anti-mouse Olig2 | Biotechne | Cat#AF2418, RRID:AB_2157554 | 1:200 |
| Antibody | Mouse monoclonal anti-mouse NeuN (clone A60) | Merck Millipore | Cat#MAB377, RRID:AB_2298772 | 1:100 |
| Antibody | Alexa Fluor 594_ donkey polyclonal anti- Mouse IgG (H+L) Secondary Antibody | Thermo Fisher Scientific | Cat#A21203, RRID:AB_141633 | 1:400 |
| Antibody | Alexa Fluor 647_ donkey polyclonal anti-mouse IgG (H+L) Secondary Antibody | Thermo Fisher Scientific | Cat#A21202A-31571, RRID:AB_162542 | 1:400 |
| Antibody | Alexa Fluor 647_ donkey polyclonal anti- mouse IgG (H+L) Secondary Antibody | Thermo Fisher Scientific | Cat#A32787, RRID:AB_2762830 | 1:400 |
| Chemical compound, drug | Percoll | Merck Millipore | Cat#9048-46-8 | 22% |
| Chemical compound, drug | Poly-L- ornithine solution | Merck Millipore | P4957 | |
| Chemical compound, drug | Poly-D- lysine solution | Merck Millipore | 25988-63-0 | |
| Chemical compound, drug | NeuroCult Basal medium | STEMCELL Technologies | Cat#05700 | |
| Chemical compound, drug | Heparin Solution | STEMCELL Technologies | Cat#07980 | |
| Chemical compound, drug | Epidermal Growth Factor Protein, human recombinant | Merck Millipore | Cat#GF144 | |
| Chemical compound, drug | Fibroblast growth Factor basic, human recombinant | Merck Millipore | Cat#GF003AF | |
| Chemical compound, drug | DMEM:F12 medium | Thermo Fisher Scientific | 31331028 | |
| Chemical compound, drug | B-27- Supplement Minus Antioyxidants (AO) | Thermo Fisher Scientific | Cat#10889038 | |
| Chemical compound, drug | Fetal Bovine serum | Thermo Fisher Scientific | Cat#10082139 | |
| Chemical compound, drug | Papain | Worthington Biochemical | Cat#LK003150 | |
| Chemical compound, drug | Tamoxifen | Sigma-Aldrich | Cat#T5648 | |
| Chemical compound, drug | D-(+)- Glucose | Merck Millipore | Cat#G7021 | |
| Chemical compound, drug | Sodium bicarbonate | Merck Millipore | Cat#S5761 | |
| Chemical compound, drug | HEPES sodium salt | Merck Millipore | Cat#H3784 | |
| Chemical compound, drug | Insulin from bovine pancreas | Merck Millipore | Cat#I1882 | |
| Chemical compound, drug | Apo- Transferrin human | Merck Millipore | Cat#T2252 | |
| Chemical compound, drug | Progesterone | Merck Millipore | Cat#P6149 | |
| Chemical compound, drug | Putrescine | Merck Millipore | Cat#P7505 | |
| Chemical compound, drug | Sodium selenite | Merck Millipore | Cat#S9133 | |
| Chemical compound, drug | Papain | Worthington Biochemical | Cat#LK003150 | |
| Commercial assay or kit | Red blood Cell lysis solution | Milteny Biotec | Cat#130-094-183 | |
| Commercial assay or kit | Dead Cell Removal Kit | Milteny Biotec | Cat#130-090-101 | |
| Commercial assay or kit | RNeasy Micro Kit | QIAGEN | Cat#74004 | |
| Commercial assay or kit | RNase-Free DNase Set | QIAGEN | Cat#79254 | |
| Commercial assay or kit | Agilent High Sensitivity DNA Kit | LabChip | Cat#5067–4626 | |
| Commercial assay or kit | Chromium Next GEM Chip G Single Cell Kit | 10 X GENOMICS | Cat#PN-1000127 | |
| Commercial assay or kit | Dual Index Kit Plate TT Set A | 10 X GENOMICS | Cat#PN-1000215 | |
| Software, algorithm | RStudio | RStudio | https://www.rstudio.com/ | |
| Software, algorithm | Transcriptome Analysis Console (TAC 4.0) | Thermo Fisher Scientific | ||
| Software, algorithm | limma | Ritchie et al., 2015; Smyth et al., 2015 | ||
| Software, algorithm | EventPointer | Romero et al., 2016a; Romero et al., 2016b | ||
| Other | DAPI stain | Sigma-Aldrich | D1306 | Materials and methods >Immunolabeling 1 µg/ml |
| Other | Hoechst 33258 | Thermo Fisher Scientific | Cat#H3569 | Materials and methods> Cell sorting 1 µg/ml |
| Other | Propidium iodide | Sigma-Aldrich | Cat#P4170 | Materials and methods> Cell sorting 1 µg/ml |
| Other | Corn oil | Sigma-Aldrich | Cat#C8267 | Tamoxifen solution 40 mg/ml |
| Other | Solution de paraformaldéhyde, 4% en PBS | Thermo Fisher Scientific | Cat#15670799 | Materials and methods > Tissue processing |
| Other | Triton X-100 | Sigma-Aldrich | Cat# 11332481001 | Materials and methods >Immunolabeling 0.1% |
| Other | 70 µm cell strainer | Thermo Fisher Scientific | Cat#10788201 | Materials and methods > Single cell library preparation |
| Other | 2.5 µl, Model 62 RN SYR, Small Removable NDL, 22 s ga, 2 in, point style 3 | Hamilton | Cat#87942 | Materials and methods > Transplants |
| Other | Small Hub 33 G | Hamilton | Cat#074750 | Materials and methods > Transplants |
Additional files
Download links
A two-part list of links to download the article, or parts of the article, in various formats.
Downloads (link to download the article as PDF)
Open citations (links to open the citations from this article in various online reference manager services)
Cite this article (links to download the citations from this article in formats compatible with various reference manager tools)
Switching of RNA splicing regulators in immature neuroblasts during adult neurogenesis
eLife 12:RP87083.
https://doi.org/10.7554/eLife.87083.3


