Dorsolateral prefrontal activity supports a cognitive space organization of cognitive control
- CAS Key Laboratory of Behavioral Science, Institute of Psychology, China
- Department of Psychology, University of Chinese Academy of Sciences, China
- Department of Psychological and Brain Sciences, University of Iowa, United States
- Cognitive Control Collaborative, University of Iowa, United States
- Centre for Cognitive and Brain Sciences and Department of Psychology, University of Macau, China
- Beijing Key Laboratory of Learning and Cognition, School of Psychology, Capital Normal University, China
- Department of Neurological Surgery, Unversity of Texas Southwestern Medical Center, United States
Figures
Figure 1
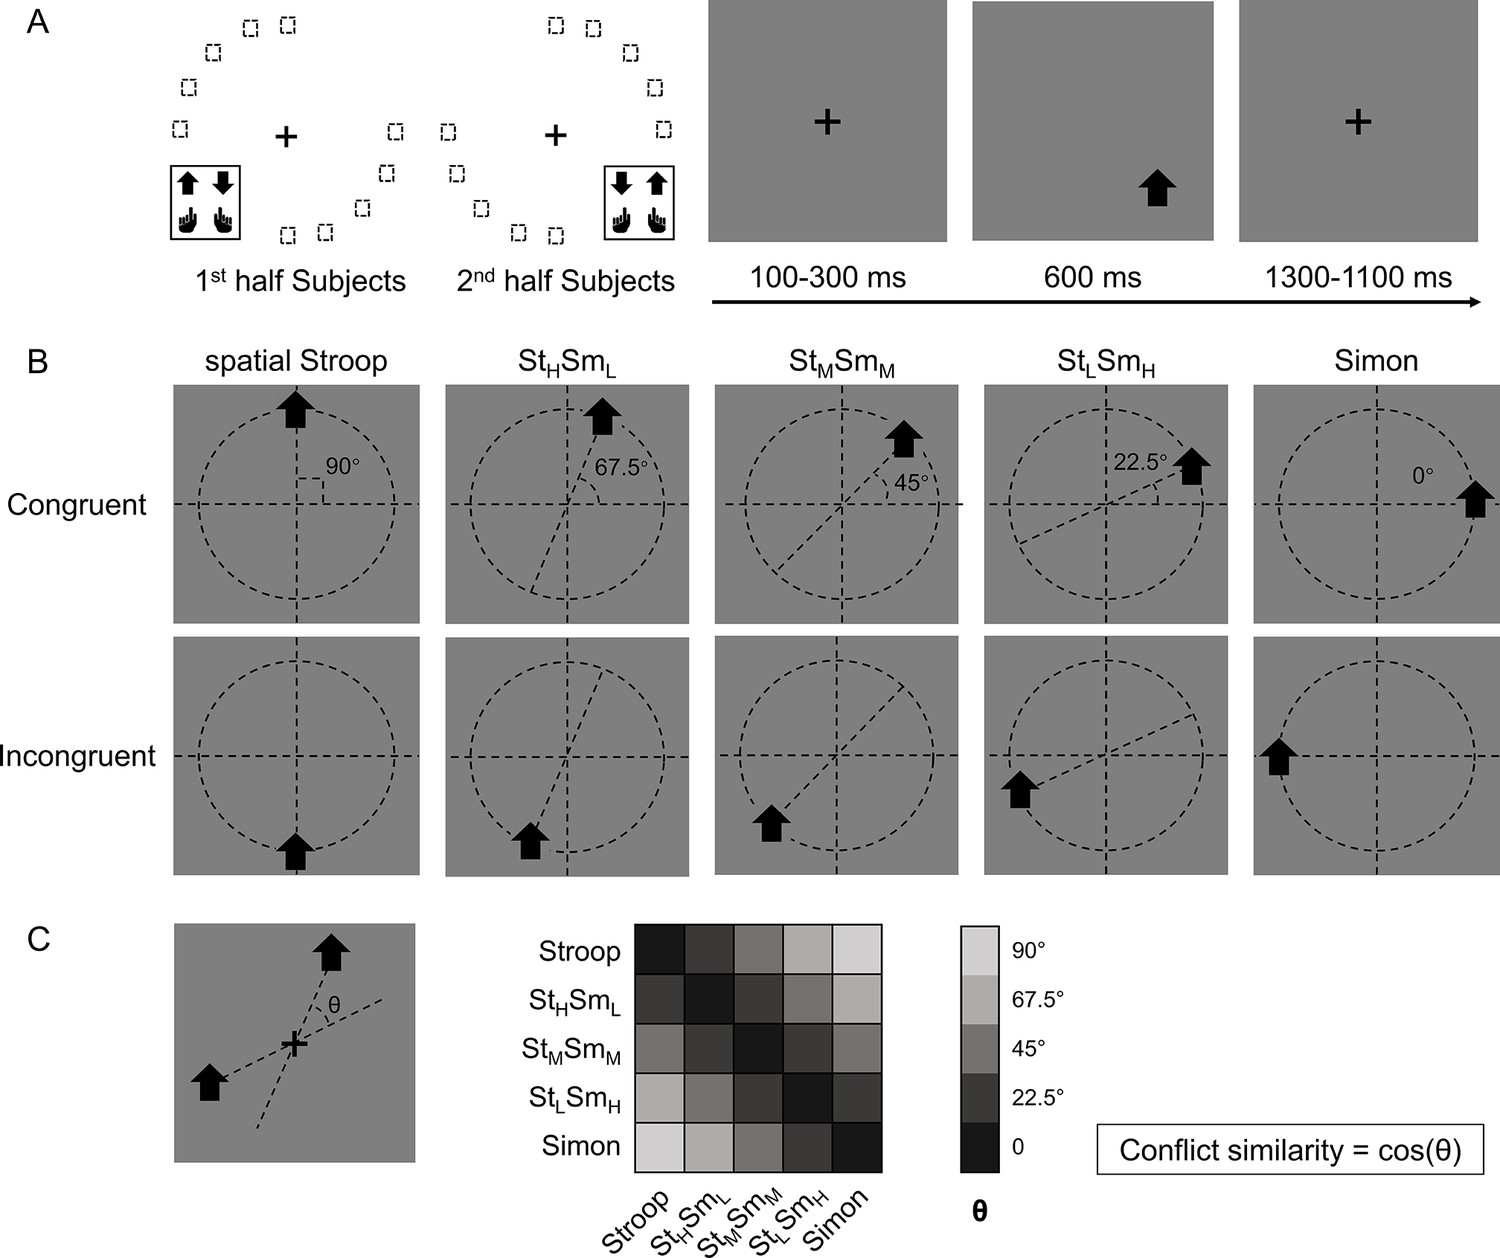
Experimental design.
(A) The left panel shows the orthogonal stimulus–response mappings of the two participant groups. In each group, the stimuli were only displayed at two quadrants of the circular locations. One group was asked to respond with the left button to the upward arrow and with the right button to the downward arrow presented in the top-left and bottom-right quadrants, and the other group vice versa. The right panel shows the time course of one example trial. The stimuli were displayed for 600 ms, preceded and followed by fixation crosses that lasted for 1400 ms in total. (B) Examples of the five types of conflicts, each containing congruent and incongruent conditions. The arrows were presented at locations along five orientations with isometric polar angles, in which the vertical location introduces the spatial Stroop conflict, and the horizontal location introduces the Simon conflict. Dashed lines are shown only to indicate the location of arrows and were not shown in the experiments. (C) The definition of the angular difference between two conflict types and the conflict similarity. The angle θ is determined by the acute angle between two lines that cross the stimuli and the central fixation. Therefore, stimuli of the same conflict type form the smallest angle of 0, and stimuli between Stroop and Simon form the largest angle of 90°, and others are in between. Conflict similarity is defined by the cosine value of θ. H = high; L = low; M = medium.
Figure 2 with 2 supplements
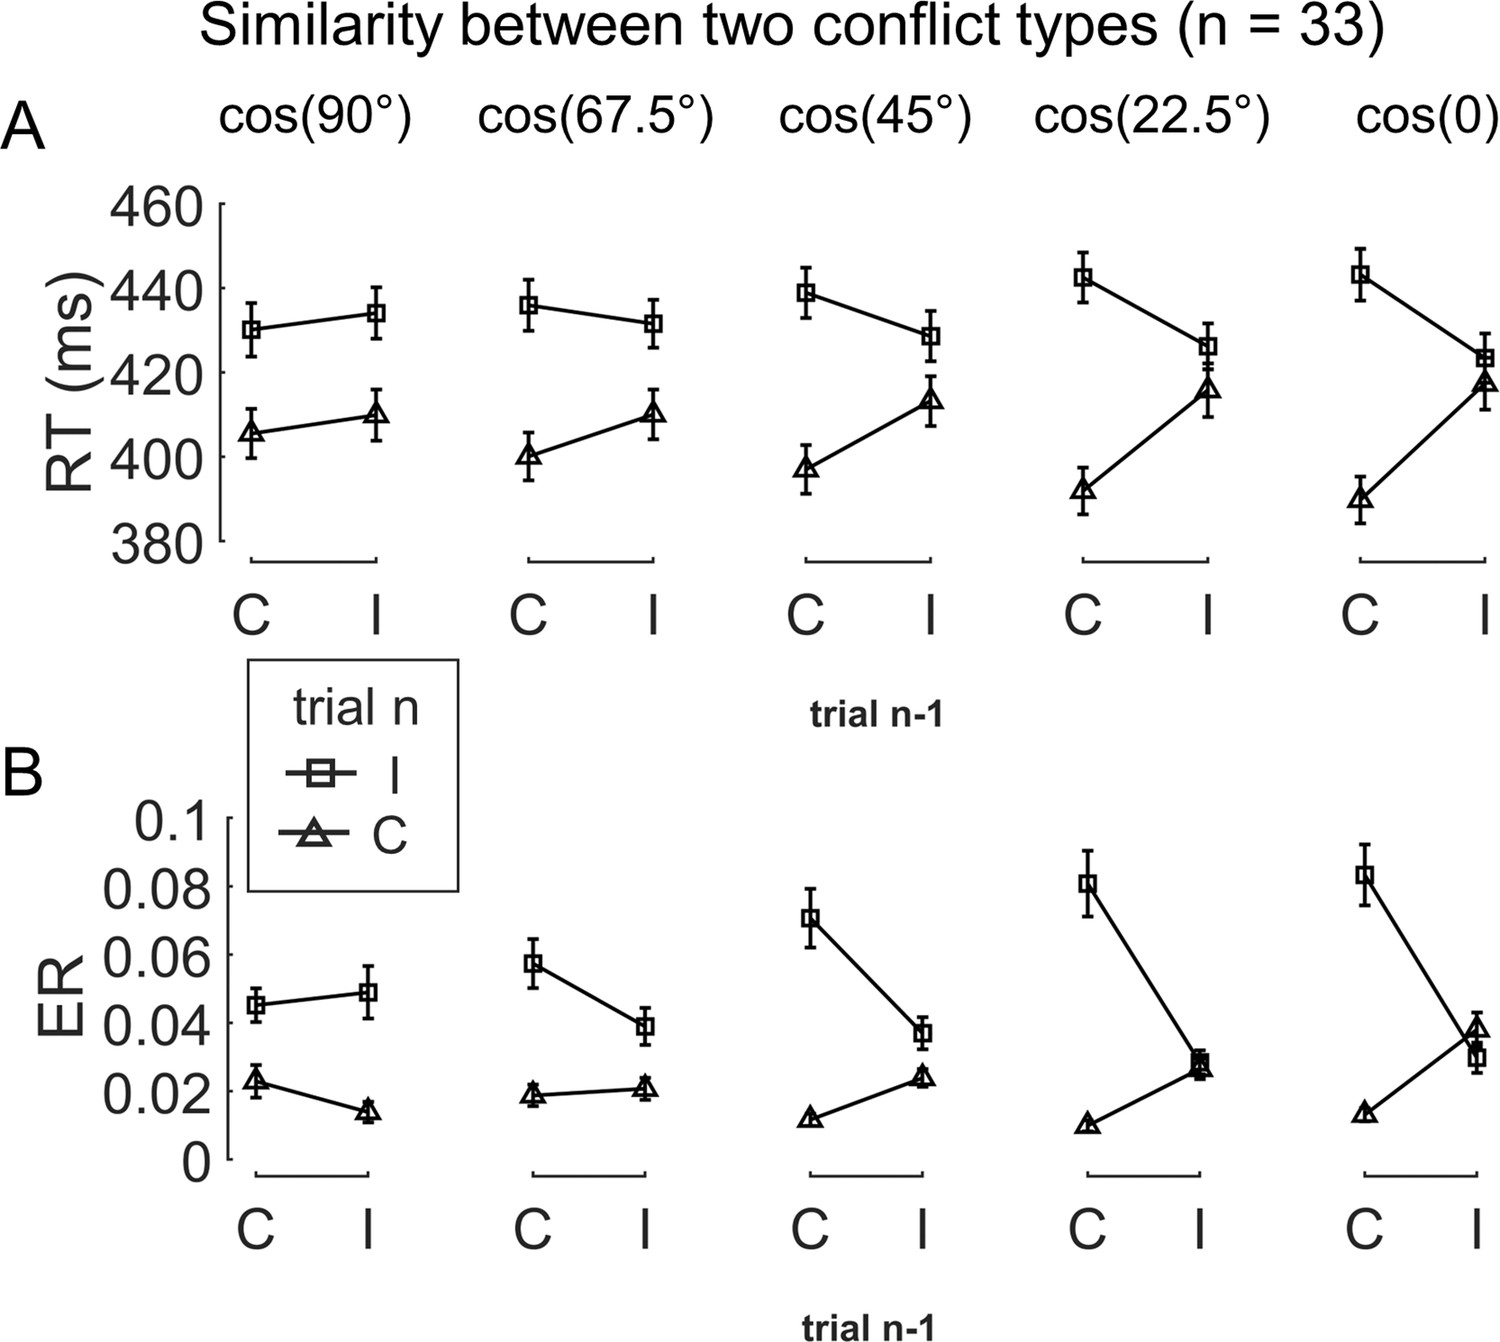
The conflict similarity modulation on the behavioral congruency sequence effect (CSE) in experiment 1.
(A) RT and (B) ER are plotted as a function of congruency types on trial n−1 and trial n. Each column shows one similarity level, as indicated by the defined angular difference between two conflict types. Error bars are standard errors. C = congruent; I = incongruent; RT = reaction time; ER = error rate.
Figure 2—figure supplement 1
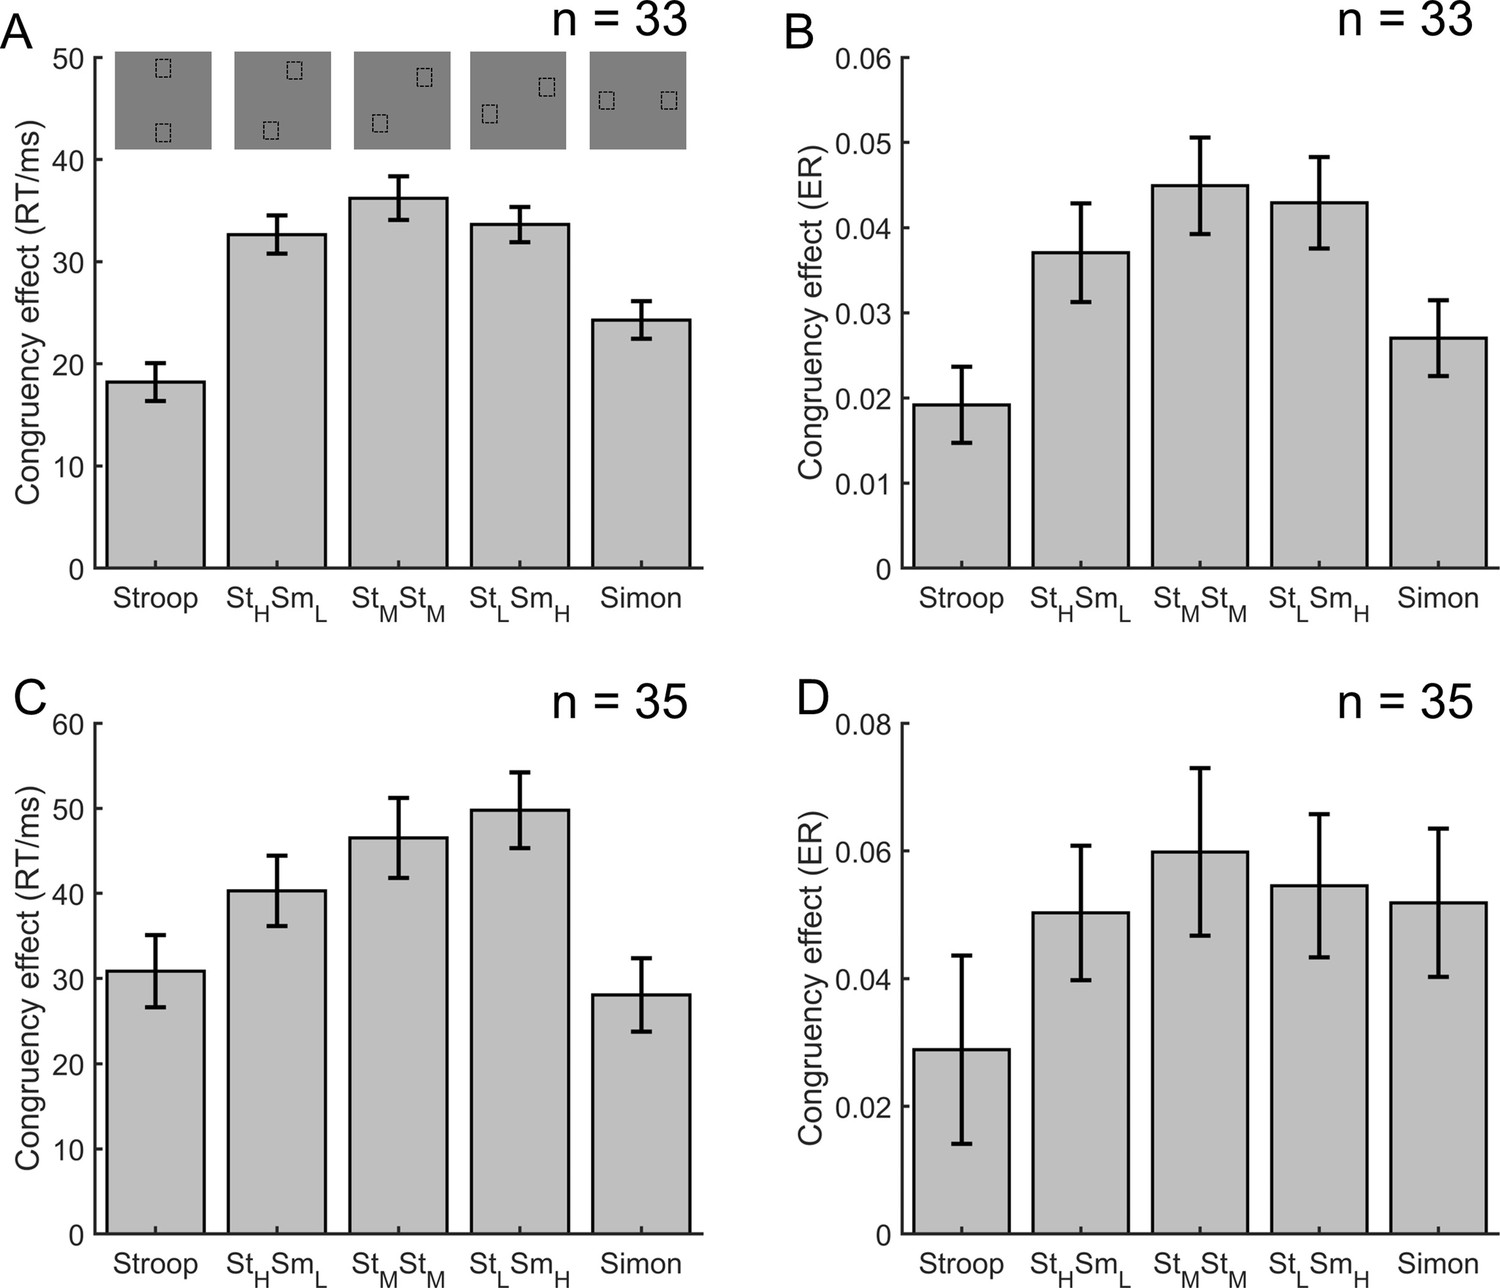
The congruency effects of experiments 1 (A, B) and 2 (C, D).
Error bars denote the standard errors of mean. Small insets on top of panel (A) denote an example of stimuli positions for each conflict type. RT = reaction time; ER = error rate.
Figure 2—figure supplement 2

The conflict similarity modulation on performance of experiments 1 (A, B, D, E) and 2 (C, F), respectively.
(A) and (D) are scatter plots of CSE [i.e., (CI−CC) − (II−IC)] for RT and ER as a function of the cosine similarity, respectively. In (B, C, E, F), the cosine similarity and RT/ER are normalized across conflict similarity levels within each of the four CSE conditions (i.e., CC, II, CI, and IC). Conflict similarity for CC and II conditions is reversed (multiplied by −1), such that for all the four CSE conditions, higher conflict similarity is expected to be associated with worse performance (see ‘Behavioral analysis’). Each dot represents a subject. The thin colored lines in (B, C, E, F) are the fitted lines for each of the four CSE conditions, and the thick black lines are the fitted lines collapsing across all CSE conditions. For panels (C) and (F), some similarity levels are missing because of the limited trial numbers in the experimental design in experiment 2. CSE = congruency sequence effect; RT = reaction time; ER = error rate; CI = congruent (trial n−1)-incongruent (trial n); IC = incongruent–congruent; CC = congruent–congruent; II = incongruent–incongruent.
Figure 3 with 1 supplement
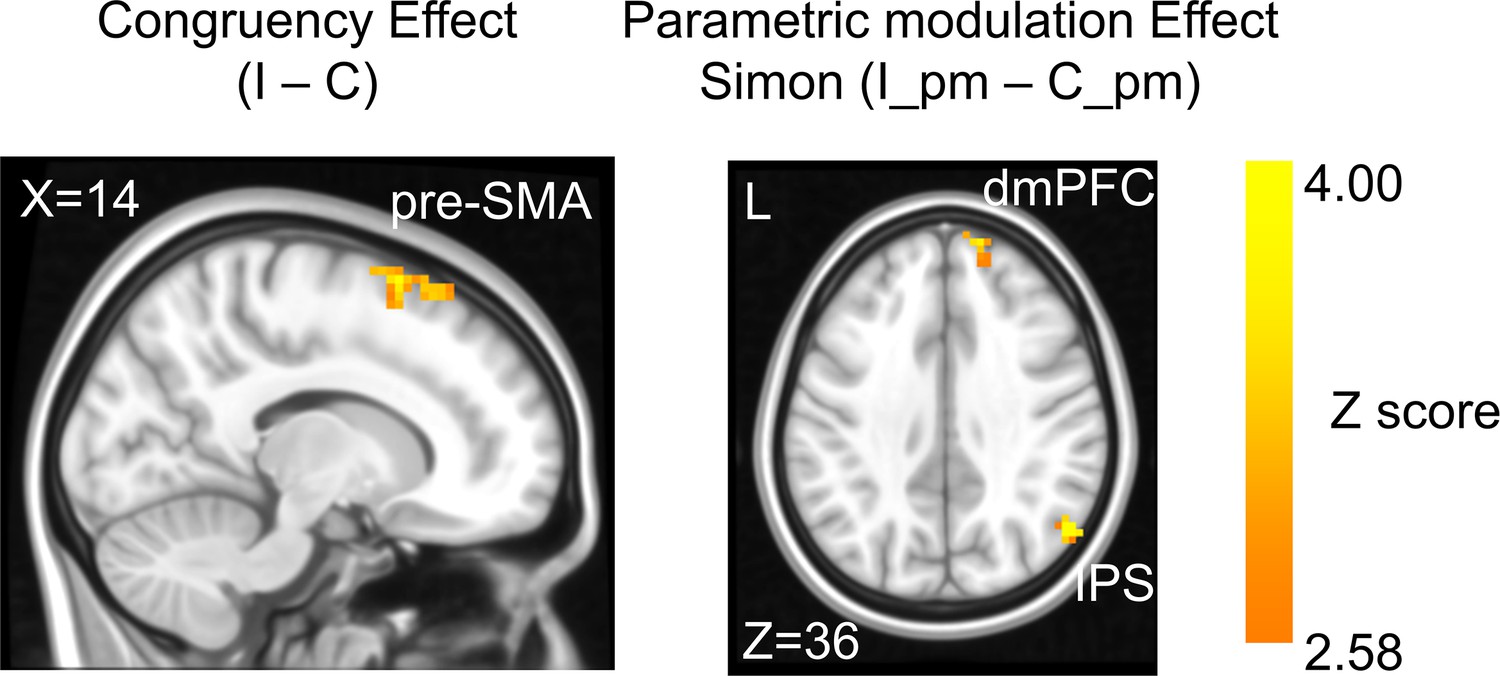
The congruency effect and parametric modulation effect detected by univoxel analyses.
Results displayed are probabilistic threshold-free cluster enhancement (TFCE) enhanced and thresholded with voxel-wise p<0.001 and cluster-wise p<0.05, both one-tailed. The congruency effect denotes the higher activation in incongruent than congruent condition (left panel). The positive parametric modulation effect (I_pm – C_pm) denotes the higher activation when the conflict type contained a higher ratio of Simon conflict component (right panel). I = incongruent; C = congruent; pm = parametric modulator.
Figure 3—figure supplement 1

Neural congruency effect (I−C) by GLM2 (see the ‘Estimation of fMRI activity with univariate general linear model’), plotted as a function of conflict type in different cortical regions of interest (ROIs).
The ROIs were selected because they show a statistically significant congruency effects or parametric modulation effects when analyzed using the univariate GLM1.The pre-SMA showed overall congruency effects regardless of the conflict type (upper panel); the right IPS and right dmPFC were positively modulated by the conflict type (lower panel).
Pre-SMA = pre-supplementary motor area; IPS = inferior parietal sulcus; dmPFC = dorsomedial prefrontal cortex.
Figure 4

Rationale of the cross-subject representational similarity analysis (RSA) model and the schematic of key representational similarity matrix (RSM).
(A) The RSM is calculated as the Pearson’s correlation between each pair of conditions across the 35 subjects. For 17 subjects, the stimuli were displayed on the top-left and bottom-right quadrants, and they were asked to respond with left hand to the upward arrow and right hand to the downward arrow. For the other 18 subjects, the stimuli were displayed on the top-right and bottom-left quadrants, and they were asked to respond with left hand to the downward arrow and right hand to the upward arrow. Within each subject, the conflict type and orientation regressors were perfectly covaried. For instance, the same conflict type will always be on the same orientation. To de-correlate conflict type and orientation effects, we conducted the RSA across subjects from different groups. For example, the bottom-right panel highlights the example conditions that are orthogonal to each other on the orientation, response, and Simon distractor, whereas their conflict type, target, and spatial Stroop distractor are the same. The dashed boxes show the possible target locations for different conditions. (B) and (C) show the orthogonality between conflict similarity and orientation RSMs. The within-subject RSMs (e.g., group 1–group 1) for conflict similarity and orientation are all the same, but the cross-group correlations (e.g., group 2–group 1) are different. Therefore, we can separate the contribution of these two effects when including them as different regressors in the same linear regression model. (D) and (E) show the two alternative models. Like the cosine model (B), within-group trial pairs resemble between-group trial pairs in these two models. The domain-specific model is an identity matrix. The domain-general model is estimated from the absolute difference of behavioral congruency effect, but scaled to 0 (lowest similarity) – 1 (highest similarity) to aid comparison. The plotted matrices in (B–E) include only one subject each from groups 1 and 2. Numbers 1–5 indicate the conflict-type conditions of spatial Stroop, StHSmL, StMSmM, StLSmH, and Simon, respectively. The thin lines separate four different subconditions, that is, target arrow (up, down) × congruency (incongruent, congruent), within each conflict type.
Figure 5

The cortical regions showing different effects in the main representational similarity analysis (RSA).
(A) The target effect reflects the encoding of upward and downward arrow directions and is mainly encoded in the visual and sensorimotor regions. (B) The response effect reflects the encoding of left and right responses and is mainly encoded in motor regions. (C) The spatial Stroop distractor effect reflects the encoding of vertical location of the stimulus and is encoded in bilateral visual regions. (D) The Simon distractor effect reflects the encoding of horizontal locations of the stimulus and is mainly encoded at the bilateral visual regions. Regions in (B–D) are thresholded with Bonferroni-corrected p<0.05 across the 360 cortical ROIs, whereas regions in (A) are thresholded with uncorrected p<0.005. (E) The representational strength of target, Stroop distractor, and Simon distractor in left V4 (left panel) for incongruent and congruent conditions. Compared to the congruent conditions, the incongruent condition shows a stronger representation of target, but lower representation of Stroop and Simon distractors. Results are Bonferroni corrected. *p<0.05, ***p<0.001.
Figure 6 with 1 supplement
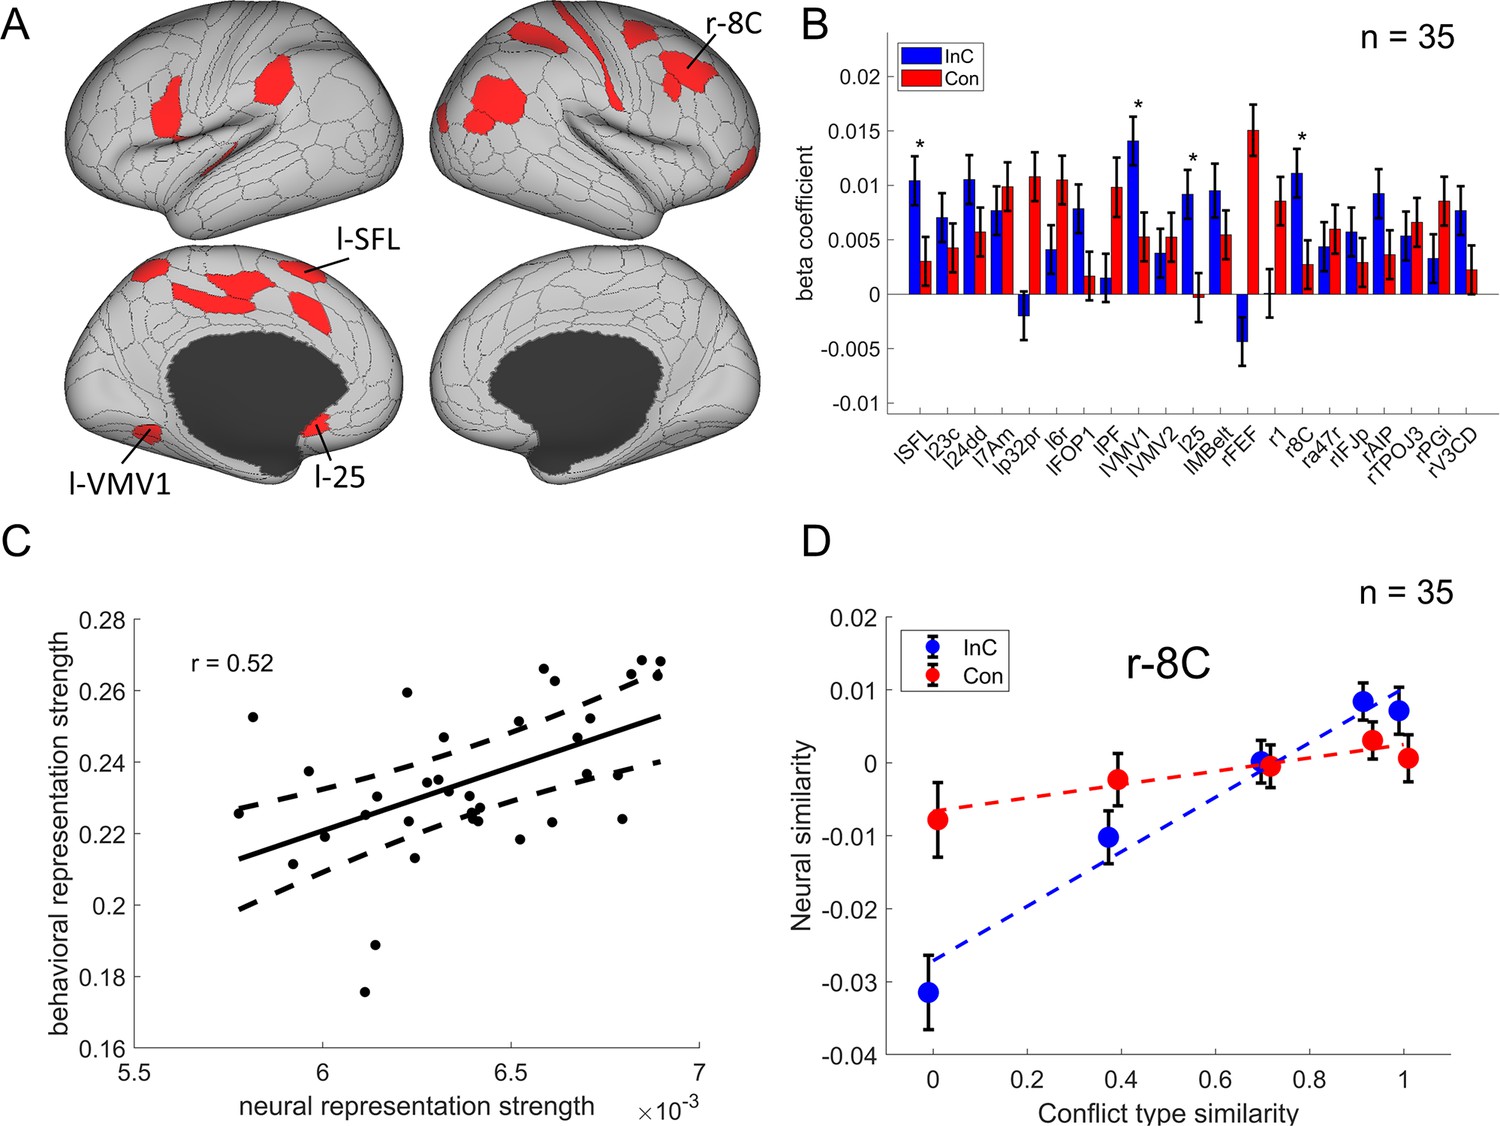
The conflict-type effect.
(A) Brain regions surviving the Bonferroni correction (p<0.05) across the 360 regions (criterion 1). Labeled is the region meeting the three criteria. (B) Different encoding of conflict-type effect in the incongruent with congruent conditions (criterion 2). *False discovery rate (FDR)-corrected p<0.05. (C) The brain–behavior correlation of the right 8C (criterion 3). The x-axis shows the β-coefficient of the conflict-type effect from the representational similarity analysis (RSA), and the y-axis shows the β-coefficient obtained from the behavioral linear model using the conflict similarity to predict the congruency sequence effect (CSE) in experiment 2. (D) Illustration of the different encoding strength of conflict-type similarity in incongruent versus congruent conditions of right 8C. The y-axis is derived from the z-scored Pearson correlation coefficient after regressing out other factors. See Figure 6—figure supplement 1B- for a plot of similarity matrix across different conflict conditions in both incongruent and congruent conditions. l = left; r = right.
Figure 6—figure supplement 1
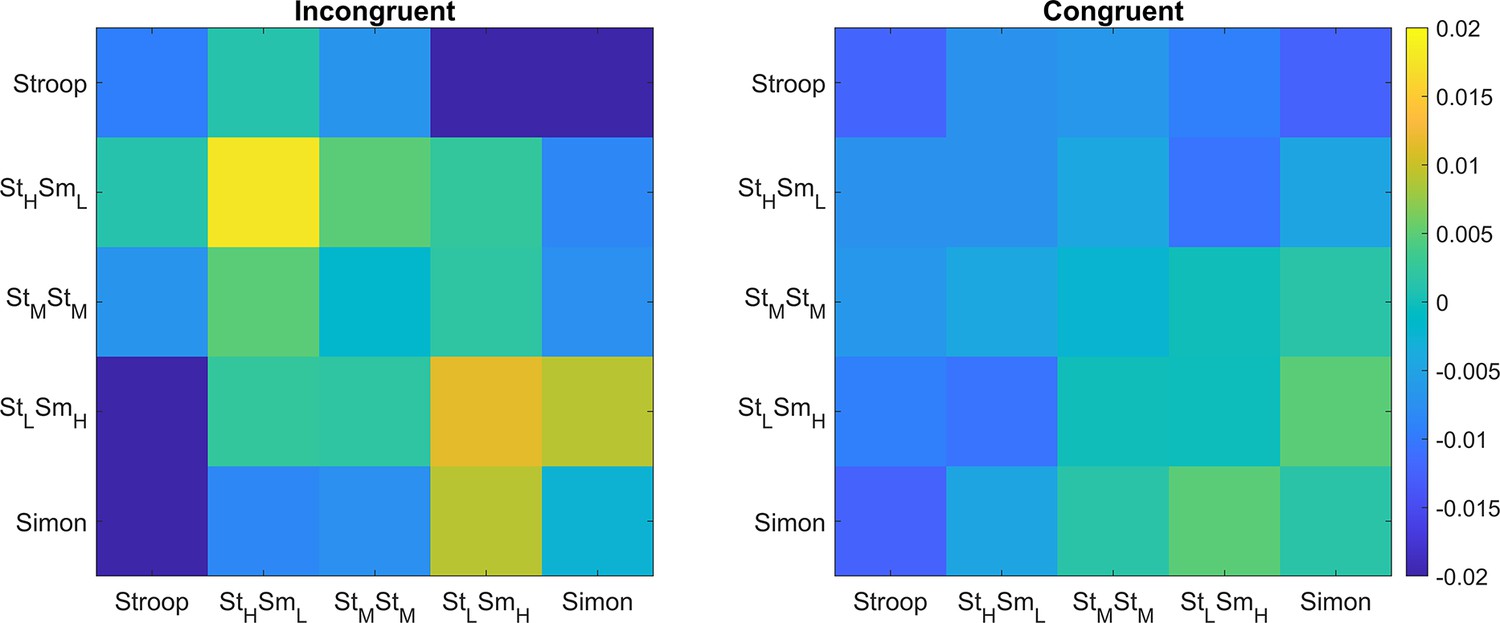
The stronger conflict-type similarity effect in incongruent versus congruent conditions.
Shown are the summary representational similarity matrices for the right 8C region in incongruent (left) and congruent (right) conditions, respectively. Each cell represents the averaged Pearson correlation (after regressing out all factors except the conflict similarity) of cells with the same conflict type and congruency in the 1400 × 1400 matrix. Note that the seemingly disparities in the values of within-conflict cells (i.e., the diagonal) did not reach significance for either incongruent or congruent trials, Fs <1.
Figure 7
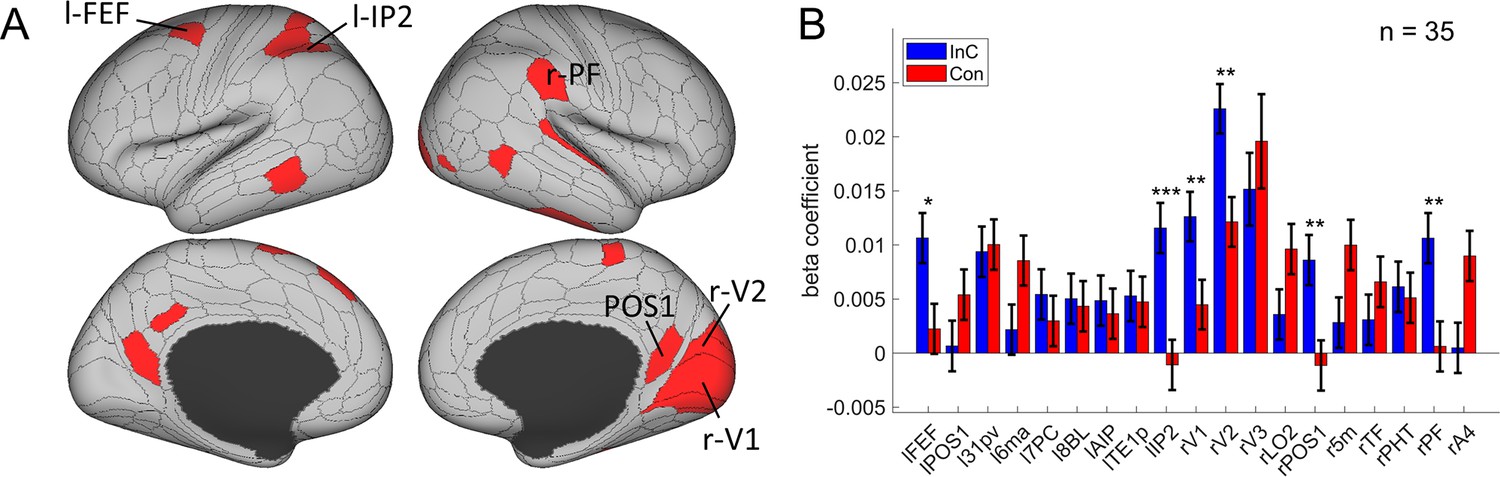
The orientation effect.
(A) Brain regions surviving the Bonferroni correction (p<0.05) across the 360 regions (criterion 1). Labeled regions are those meeting the three criteria. (B) Different encoding of orientation in the incongruent with congruent conditions. *False discovery rate (FDR)-corrected p<0.05; **FDR-corrected p<0.01; ***FDR-corrected p<0.001.
Figure 8
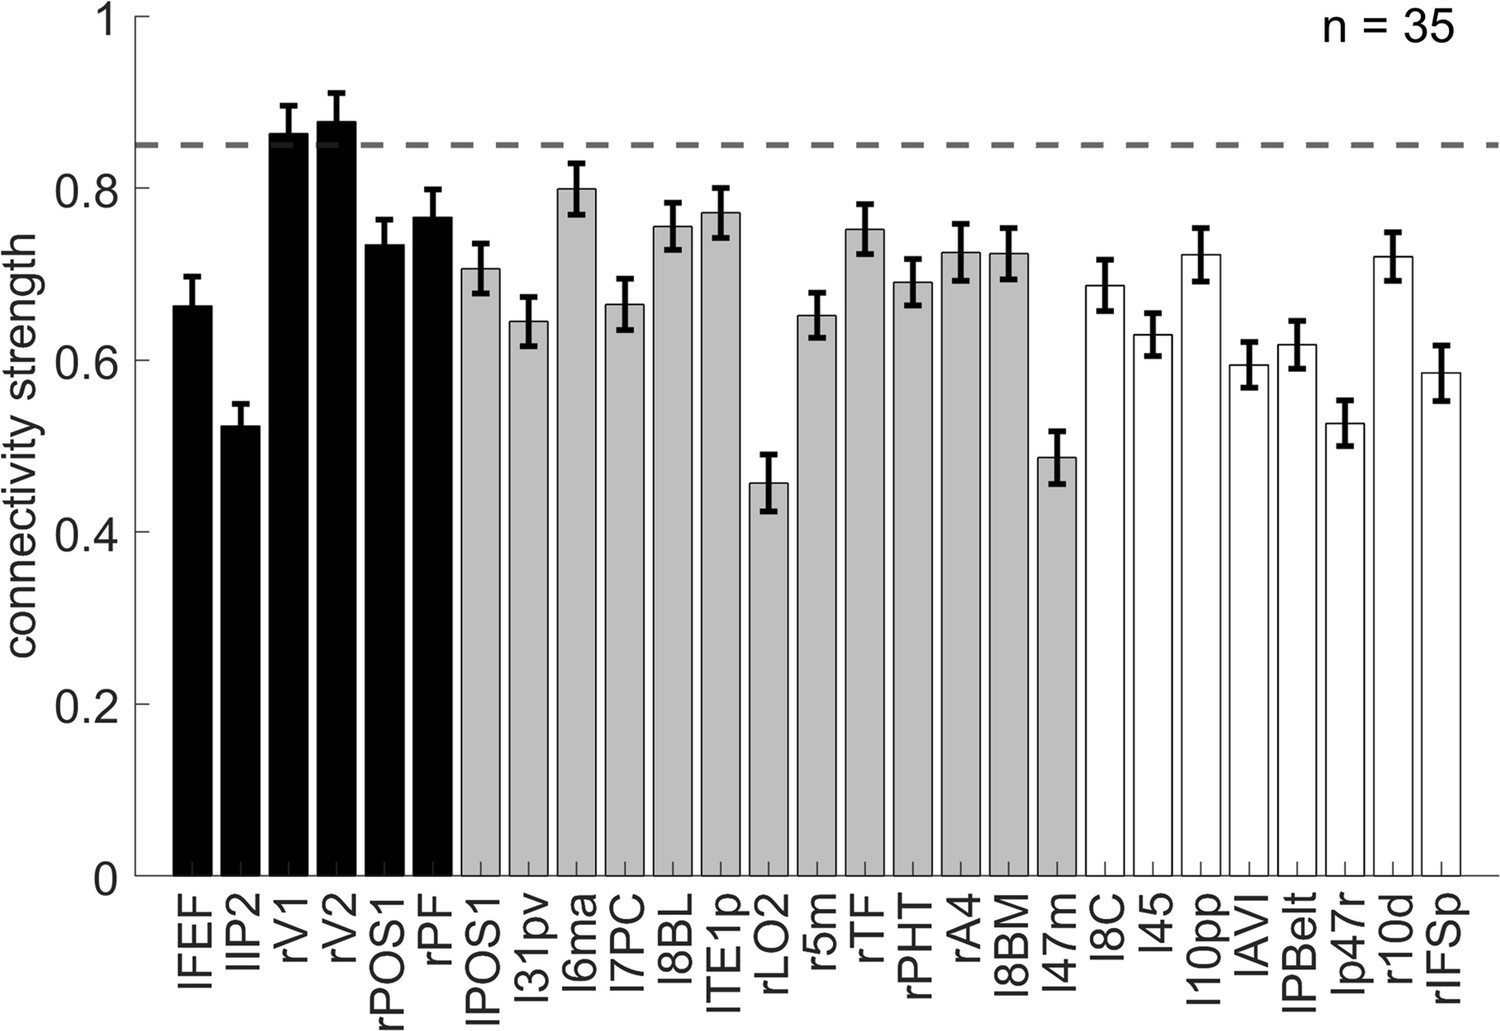
The representational connectivity between the right 8C area and the cortical regions showing significant encoding of orientation.
The black bars represent regions showing both the overall orientation effect and higher encoding strength of orientation in incongruent than congruent conditions; the gray bars are regions showing only the overall orientation effect but not higher encoding strength of orientation in incongruent than congruent conditions; and the white bars are regions not showing any of the effects of interest (i.e., uncorrected p>0.3 for all the conflict type, orientation, congruency, target, response, spatial Stroop distractor, and Simon distractor effects). Regions plotted in gray and white bars serve as controlled baseline. Error bars are the standard error of the mean. The dashed line indicates the upper bound of the 95% confidence interval of the highest connectivity of controlled regions (i.e., left 6ma). l = left, r = right.
Figure 9

Illustration of the hypothesized dimensionalities of different representations.
The shade of the red color indicates the degree of dimensionality (i.e., how many dimensions are needed to represent different states). The dimensionality of domain-general representation is extremely low, with all representations compressed to one dot. The dimensionality of domain-specific representation is extremely high, with each control state encoded in a unique and orthogonal dimension. The dimensionality of the organized representation is modest, enabling distant states to be separated but also allowing close states to share representations. The solid arrows show the axes of different dimensions. The dashed arrows indicate how the representational dimensionality can be reduced by projecting the independent dimensions to a common dimension.
Author response image 1

Author response image 2

The stronger conflict type similarity effect in incongruent versus congruent conditions.
Shown are the summary representational similarity matrices for the right 8C region in incongruent (left) and congruent (right) conditions, respectively. Each cell represents the averaged Pearson correlation (after regressing out all factors except the conflict similarity) of cells with the same conflict type and congruency in the 1400 × 1400 matrix. Note that the seemingly disparities in the values of withinconflict cells (i.e., the diagonal) did not reach significance for either incongruent or congruent trials, Fs < 1.
Author response image 3

Fig 4.
Rationale of the cross-subject RSA model and the schematic of key RSMs. (A) The RSM is calculated as the Pearson’s correlation between each pair of conditions across the 35 subjects. For 17 subjects, the stimuli were displayed on the top-left and bottom-right quadrants, and they were asked to respond with left hand to the upward arrow and right hand to the downward arrow. For the other 18 subjects, the stimuli were displayed on the top-right and bottom-left quadrants, and they were asked to respond with left hand to the downward arrow and right hand to the upward arrow. Within each subject, the conflict type and orientation regressors were perfectly covaried. For instance, the same conflict type will always be on the same orientation. To de-correlate conflict type and orientation effects, we conducted the RSA across subjects from different groups. For example, the bottom-right panel highlights the example conditions that are orthogonal to each other on the orientation, response, and Simon distractor, whereas their conflict type, target and spatial Stroop distractor are the same. The dashed boxes show the possible target locations for different conditions. (B) and (C) show the orthogonality between conflict similarity and orientation RSMs. The within-subject RSMs (e.g., Group1-Group1) for conflict similarity and orientation are all the same, but the cross-group correlations (e.g., Group2-Group1) are different. Therefore, we can separate the contribution of these two effects when including them as different regressors in the same linear regression model. (D) and (E) show the two alternative models. Like the cosine model (B), within-group trial pairs resemble betweengroup trial pairs in these two models. The domain-specific model is an identity matrix. The domaingeneral model is estimated from the absolute difference of behavioral congruency effect, but scaled to 0 (lowest similarity) – 1 (highest similarity) to aid comparison. The plotted matrices in B-E include only one subject each from Group 1 and Group 2. Numbers 1-5 indicate the conflict type conditions, for spatial Stroop, StHSmL, StMSmM, StLSmH, and Simon, respectively. The thin lines separate four different sub-conditions, i.e., target arrow (up, down) × congruency (incongruent, congruent), within each conflict type.
Tables
Table 1
Brain activations for the univoxel parametric analysis in GLM1 (family-wise error [FWE] corrected after probabilistic threshold-free cluster enhancement [TFCE] enhancement, with voxel-wise p<0.001 and cluster-wise p<0.05, both one-tailed).
| Region | L/R | MNI coordinate (mm) | Volume (no. of voxels) | MaxZ (TFCE enhanced) | BA | ||
|---|---|---|---|---|---|---|---|
| x | y | z | |||||
| Incongruent > congruent | |||||||
| Pre-supplementary motor area | R | 12 | 12 | 73 | 71 | 4.18 | 6 |
| Positive parametric modulator (linear Simon effect) | |||||||
| Inferior parietal sulcus | R | 52 | −64 | 33 | 81 | 4.53 | 39 |
| Dorsomedial prefrontal cortex | R | 15 | 57 | 42 | 43 | 3.92 | 9 |
-
L = left; R = right; BA = Brodmann area.
Table 2
Summary statistics of the cross-subject representational similarity analysis (RSA) for regions showing conflict type and orientation effects identified by the three criteria.
| Region name | Criterion 1 | Criterion 2 | Criterion 3 | ||||
|---|---|---|---|---|---|---|---|
| t | β ± SD | p | t | p | r | p | |
| Conflict type effect | |||||||
| Left SFL | 4.77 | 0.0061 ± 0.0013 | 1.9 × 10⁻⁶ | 2.45 | 0.007 | 0.35 | 0.021 |
| Left 23 c | 4.42 | 0.0049 ± 0.0011 | 9.8 × 10⁻⁶ | 1.18 | 0.118 | −0.15 | 0.800 |
| Left 24dd | 6.13 | 0.0079 ± 0.0013 | 8.9 × 10⁻¹⁰ | 1.61 | 0.053 | −0.04 | 0.580 |
| Left 7Am | 6.76 | 0.0090 ± 0.0013 | 1.4 × 10⁻¹¹ | −0.75 | 0.772 | 0.04 | 0.418 |
| Left p32pr | 4.00 | 0.0044 ± 0.0011 | 6.4 × 10⁻⁵ | −3.95 | 1.000 | −0.01 | 0.533 |
| Left 6 r | 5.41 | 0.0071 ± 0.0013 | 6.3 × 10⁻⁸ | −1.94 | 0.973 | −0.11 | 0.737 |
| Left FOP1 | 4.37 | 0.0050 ± 0.0011 | 1.3 × 10⁻⁵ | 1.83 | 0.034 | −0.25 | 0.926 |
| Left PF | 4.04 | 0.0058 ± 0.0014 | 5.3 × 10⁻⁵ | −1.90 | 0.969 | −0.24 | 0.921 |
| Left VMV1 | 7.45 | 0.0091± 0.0012 | 9.6 × 10⁻¹⁴ | 2.83 | 0.002 | −0.27 | 0.940 |
| Left VMV2 | 4.75 | 0.0053 ± 0.0011 | 2.0 × 10⁻⁶ | −0.32 | 0.624 | −0.06 | 0.630 |
| Left 25 | 3.70 | 0.0041 ± 0.0011 | 2.1 × 10⁻⁴ | 3.26 | 0.001 | 0.05 | 0.386 |
| Left Mbelt | 4.25 | 0.0064 ± 0.0015 | 2.1 × 10⁻⁵ | 1.77 | 0.039 | 0.10 | 0.275 |
| Right FEF | 3.98 | 0.0054 ± 0.0014 | 6.8 × 10⁻⁵ | −5.49 | 1.000 | 0.08 | 0.327 |
| Right 1 | 3.90 | 0.0045 ± 0.0012 | 9.7 × 10⁻⁵ | −2.34 | 0.990 | −0.07 | 0.665 |
| Right 8 C* | 5.41 | 0.0064 ± 0.0012 | 6.1 × 10⁻⁸ | 2.46 | 0.007 | 0.52 | 0.001 |
| Right a47r | 5.04 | 0.0056 ± 0.0011 | 4.7 × 10⁻⁷ | −0.68 | 0.753 | 0.05 | 0.393 |
| Right IFJp | 3.78 | 0.0042 ± 0.0011 | 1.6 × 10⁻⁴ | 0.77 | 0.221 | 0.27 | 0.056 |
| Right AIP | 4.64 | 0.0054 ± 0.0012 | 3.5 × 10⁻⁶ | 1.86 | 0.032 | −0.02 | 0.540 |
| Right TPOJ3 | 4.48 | 0.0056 ± 0.0012 | 7.6 × 10⁻⁶ | −0.25 | 0.600 | 0.21 | 0.118 |
| Right PGi | 4.07 | 0.0045 ± 0.0011 | 4.8 × 10⁻⁵ | −1.59 | 0.944 | −0.01 | 0.523 |
| Right V3CD | 3.86 | 0.0043 ± 0.0011 | 1.2 × 10⁻⁴ | 1.94 | 0.026 | 0.02 | 0.451 |
| Orientation effect | |||||||
| Left FEF* | 5.17 | 0.0060 ± 0.0012 | 2.4 × 10⁻⁷ | 2.73 | 0.003 | −0.01 | 0.518 |
| Left POS1 | 4.35 | 0.0051 ± 0.0012 | 1.4 × 10⁻⁵ | −1.52 | 0.936 | 0.00 | 0.500 |
| Left 31pv | 5.60 | 0.0103 ± 0.0018 | 2.1 × 10⁻⁸ | −0.48 | 0.686 | 0.05 | 0.397 |
| Left 6ma | 4.75 | 0.0055 ± 0.0012 | 2.0 × 10⁻⁶ | −1.87 | 0.970 | −0.00 | 0.500 |
| Left 7PC | 3.66 | 0.0042 ± 0.0012 | 2.5 × 10⁻⁴ | 0.76 | 0.223 | −0.20 | 0.876 |
| Left 8BL | 4.55 | 0.0053 ± 0.0012 | 5.3 × 10⁻⁶ | 0.10 | 0.460 | 0.14 | 0.207 |
| Left AIP | 3.83 | 0.0044 ± 0.0012 | 1.3 × 10⁻⁴ | 0.62 | 0.266 | −0.23 | 0.910 |
| Left TE1p | 3.95 | 0.0046 ± 0.0012 | 7.8 × 10⁻⁵ | 0.14 | 0.443 | 0.01 | 0.475 |
| Left IP2* | 4.49 | 0.0052 ± 0.0012 | 7.2 × 10⁻⁶ | 4.02 | 0.000 | 0.19 | 0.139 |
| Right V1* | 4.71 | 0.0083 ± 0.0018 | 2.5 × 10⁻⁶ | 2.91 | 0.002 | −0.08 | 0.672 |
| Right V2* | 3.88 | 0.0172 ± 0.0044 | 1.1 × 10⁻⁴ | 3.19 | 0.001 | 0.02 | 0.462 |
| Right V3 | 3.94 | 0.0175 ± 0.0045 | 8.2 × 10⁻⁵ | −1.45 | 0.927 | 0.39 | 0.010 |
| Right LO2 | 5.95 | 0.0069 ± 0.0012 | 2.8 × 10⁻⁹ | −1.81 | 0.965 | 0.26 | 0.068 |
| Right POS1* | 3.70 | 0.0043 ± 0.0012 | 2.1 × 10⁻⁴ | 2.98 | 0.001 | 0.33 | 0.028 |
| Right 5 m | 5.24 | 0.0061 ± 0.0012 | 1.6 × 10⁻⁷ | −2.12 | 0.983 | 0.00 | 0.500 |
| Right TF | 4.97 | 0.0058 ± 0.0012 | 6.7 × 10⁻⁷ | −1.08 | 0.860 | −0.07 | 0.657 |
| Right PHT | 4.54 | 0.0053 ± 0.0012 | 5.5 × 10⁻⁶ | 0.03 | 0.486 | −0.04 | 0.589 |
| Right PF* | 5.57 | 0.0064 ± 0.0012 | 2.6 × 10⁻⁸ | 3.08 | 0.001 | −0.03 | 0.558 |
| Right A4 | 4.11 | 0.0048 ± 0.0012 | 3.9 × 10⁻⁵ | −2.68 | 0.996 | −0.09 | 0.700 |
-
All p-values listed are one-tailed and uncorrected.
-
*
Denotes the regions meeting all three criteria for each effect.
Table 3
Model comparison results of the right 8C.
RSM_I shows results using incongruent trials only.
| Model name | Full RSM | RSM_I | |||||
|---|---|---|---|---|---|---|---|
| t | p | BIC | t | p | BIC | ||
| Cognitive-space | 5.41 | 6.1 × 10⁻⁸ | 5,377,093 | 4.97 | 3.35 × 10⁻⁷ | 1,345,201 | |
| Domain-general | 0.92 | .179 | 5,377,126 | 1.43 | 0.076 | 1,344,127 | |
| Domain-specific | 0.84 | .200 | 5,377,127 | 0.28 | 0.390 | 1,344,129 | |
Additional files
Download links
A two-part list of links to download the article, or parts of the article, in various formats.
Downloads (link to download the article as PDF)
Open citations (links to open the citations from this article in various online reference manager services)
Cite this article (links to download the citations from this article in formats compatible with various reference manager tools)
Dorsolateral prefrontal activity supports a cognitive space organization of cognitive control
eLife 12:RP87126.
https://doi.org/10.7554/eLife.87126.5


