Dendritic growth and synaptic organization from activity-independent cues and local activity-dependent plasticity
- School of Life Sciences, Technical University of Munich, Germany
- Computation in Neural Circuits Group, Max Planck Institute for Brain Research, Germany
Figures
Figure 1 with 2 supplements
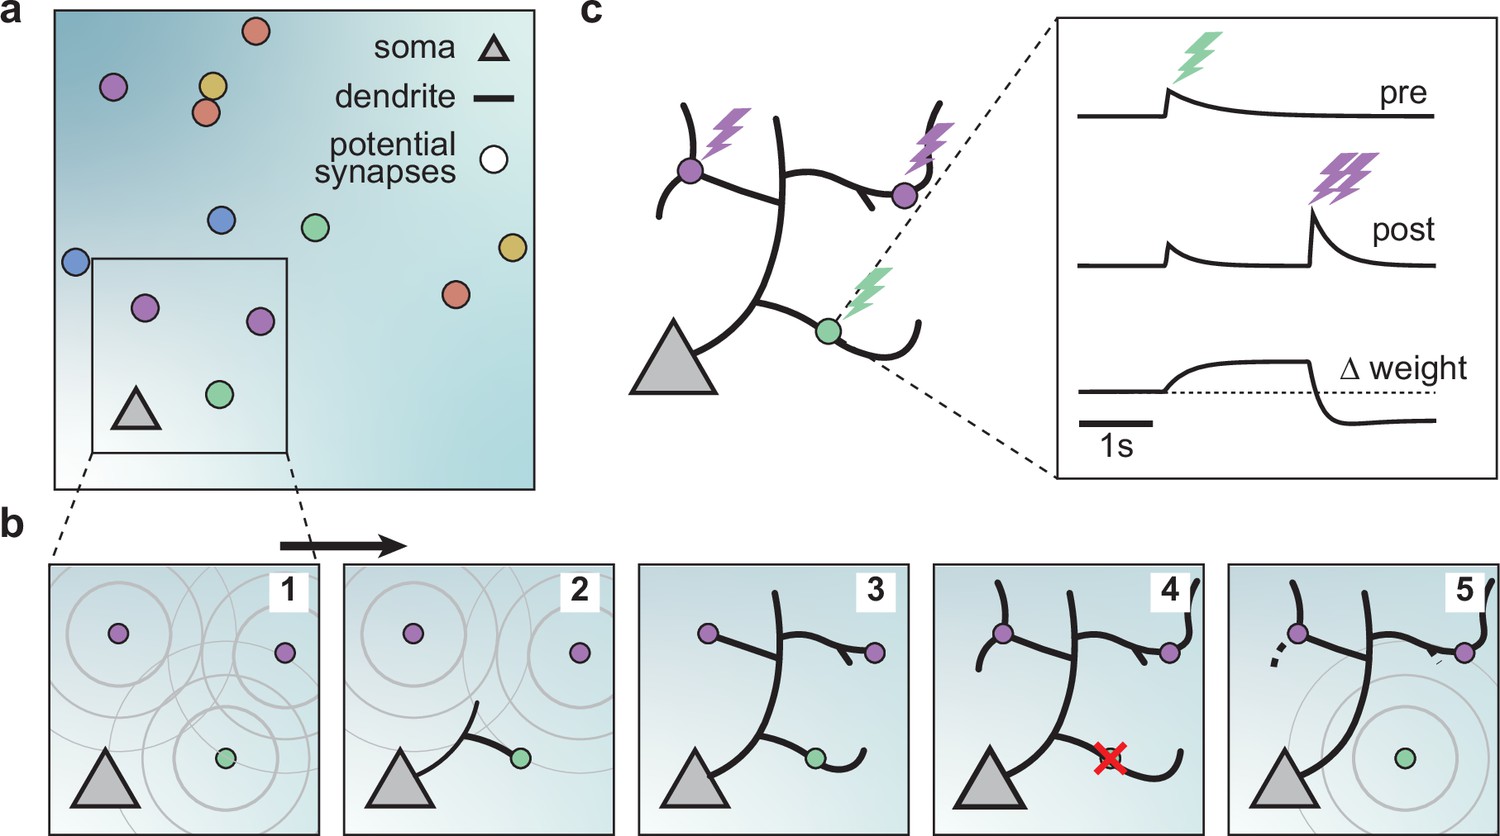
A model of dendritic growth for a cortical pyramidal neuron driven by activity-independent and -dependent mechanisms.
(a) Schematic of the soma of a pyramidal neuron (orange triangle) with 12 randomly distributed potential synapses from presynaptic axons (circles) with correlated activity patterns indicated by color. (b) Schematic of activity-independent and -dependent mechanisms. Soma and synapses correspond to box in a. Signaling molecules diffusing from potential synapses (1) attract dendrite growth and promote synapse formation (2) independent of firing pattern (3). Over time, poorly synchronized synapses depress and are pruned from the dendrite (4), while well-synchronized synapses remain stable (5). After a branch retracts, the dendrite is less sensitive to the growth field at that location (5). (c) Change in weight of one synapse (green) following the stimulation of itself (green bolt) and of two nearby synapses (purple bolts). Left: Schematic of the developing dendrite from b with bolts indicating synaptic activation. Right: Presynaptic accumulator (top), postsynaptic accumulator (middle), and change in synaptic weight (bottom) as a function of time (see Materials and methods, Kirchner and Gjorgjieva, 2021 for details of the plasticity rule). Dashed line (bottom) indicates zero change.
Figure 1—figure supplement 1
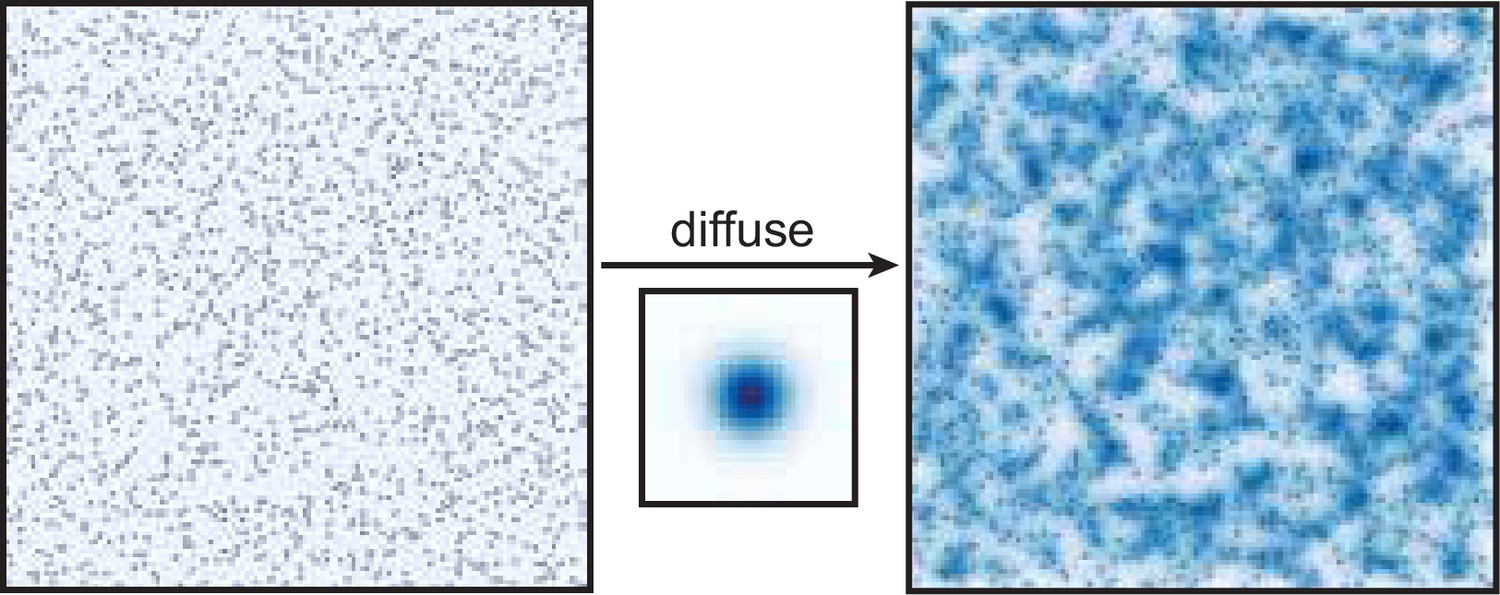
The growth field is similar to two-dimensional heat diffusion.
Figure 1—figure supplement 2
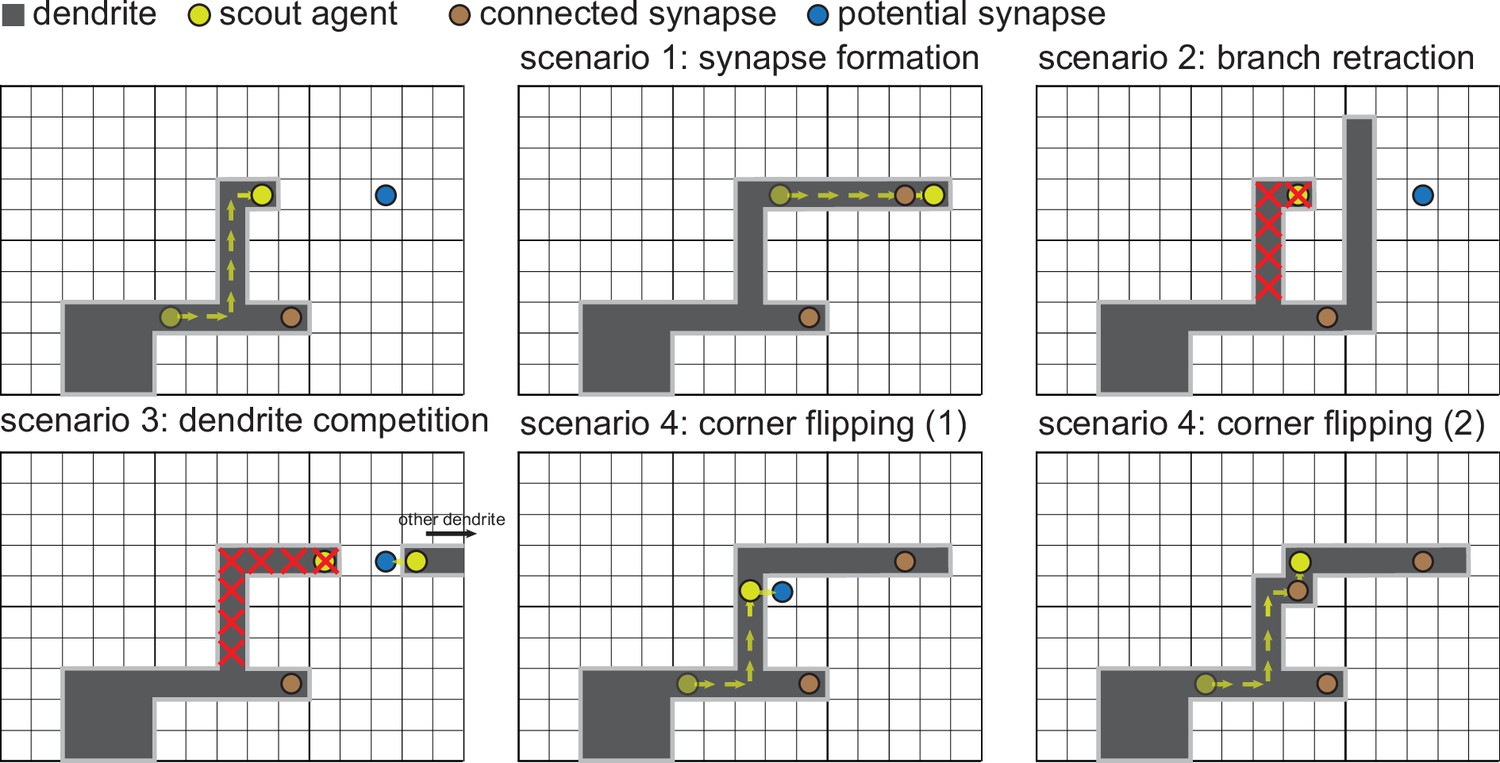
Detailed illustration of the dendritic growth mechanism.
Figure 2 with 1 supplement
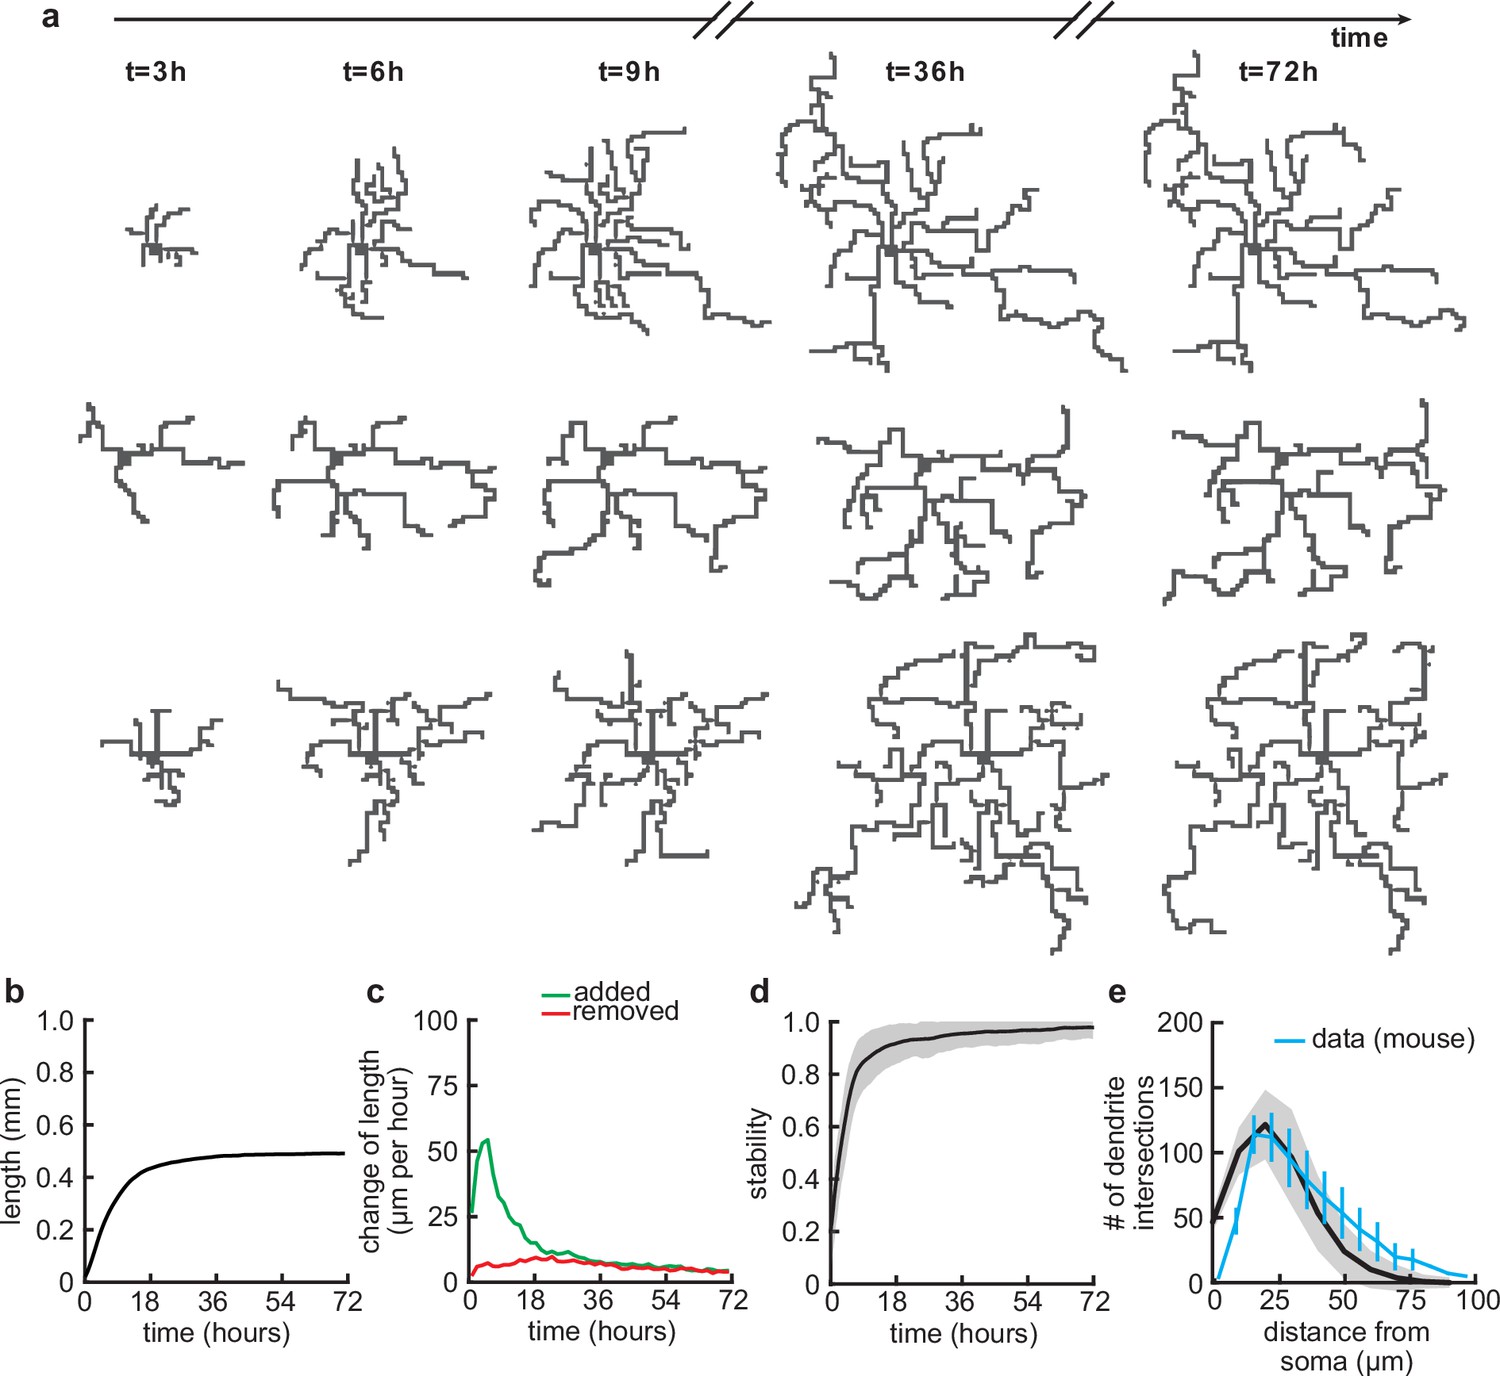
Balanced growth and retraction generate morphologically stable dendrites.
(a) Three example dendrites at five time points from our simulations. For clarity of presentation, connected synapses are not displayed. (b) Total length of dendritic tree as a function of time. (c) Length of dendrite added (green) and removed (red) as a function of time. (d) Morphological stability (correlation between the dendrite shape at time and hr) as a function of time. (e) Average number of dendrite intersections as a function of distance from the soma (the Sholl diagram). Data from basal dendrites in the developing mouse medial prefrontal cortex superimposed, normalized to the maximum (blue; Kroon et al., 2019). All lines represent averages across 32 simulations with nine dendrites each. Shaded area indicates two standard deviations.
Figure 2—video 1
Example of a simulation in which several dendrites develop in parallel.
Figure 3 with 3 supplements
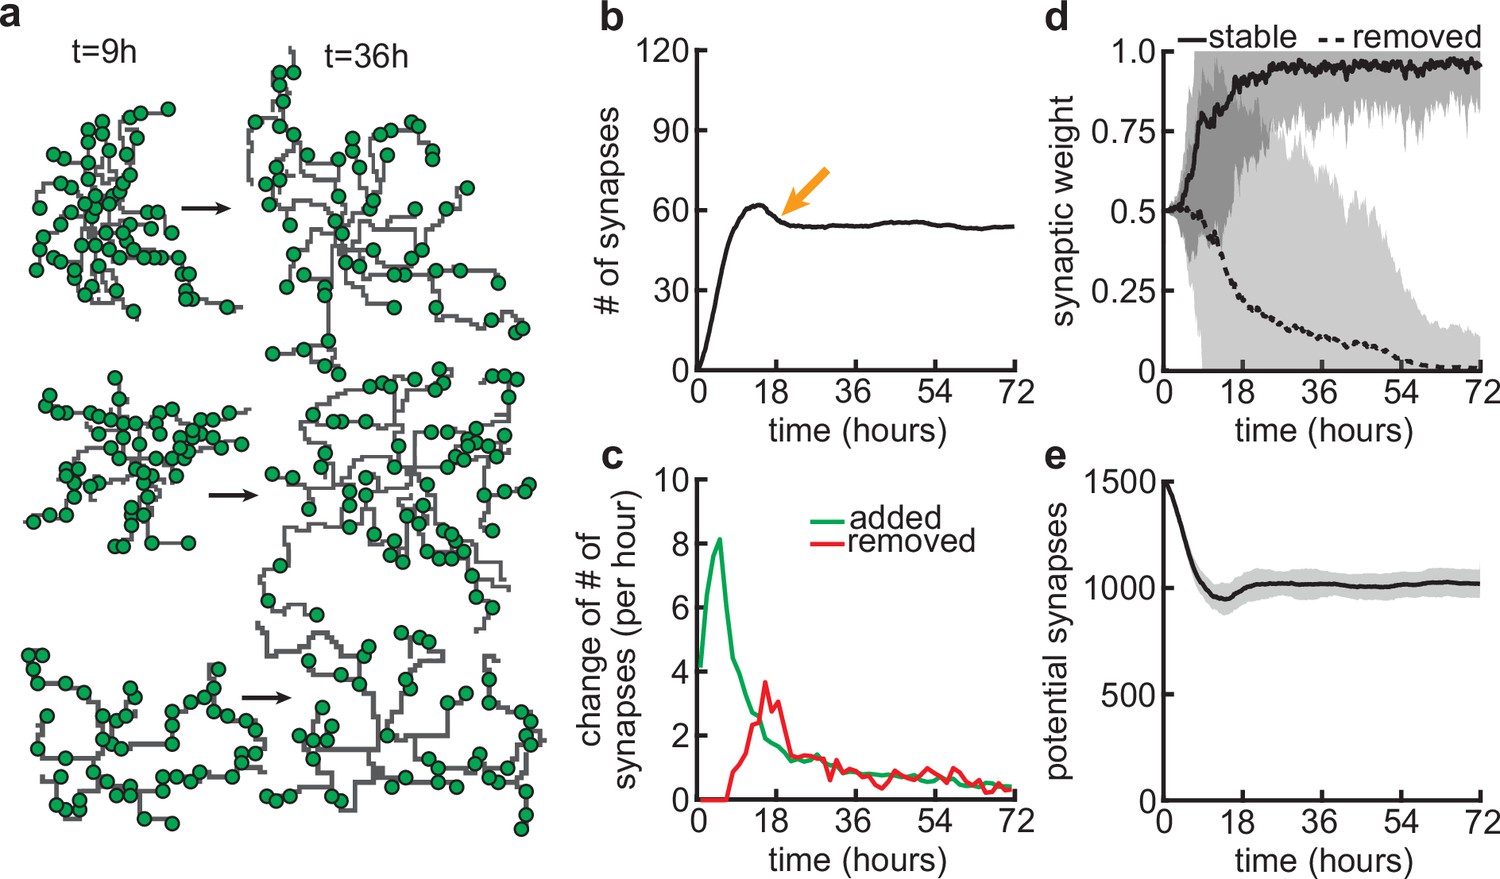
Synapse formation and removal predominate in distinct phases of dendrite development.
(a) Three examples of dendrites at the beginning ( hr) and end ( hr) of the simulation. Green circles indicate formed synapses. (b) Total number of connected synapses as a function of time. Orange arrow highlights overshoot and subsequent pruning. (c) Added (green) and pruned synapses (red) as a function of time. (d) Average synaptic weights of synapses that ultimately stabilize (solid black; final weight more than ) or are removed (dashed black; final weight less than ) as a function of time. (e) Number of available potential synapses as a function of time. All lines represent averages across 32 simulations with nine dendrites each. Shaded area indicates two standard deviations.
Figure 3—figure supplement 1
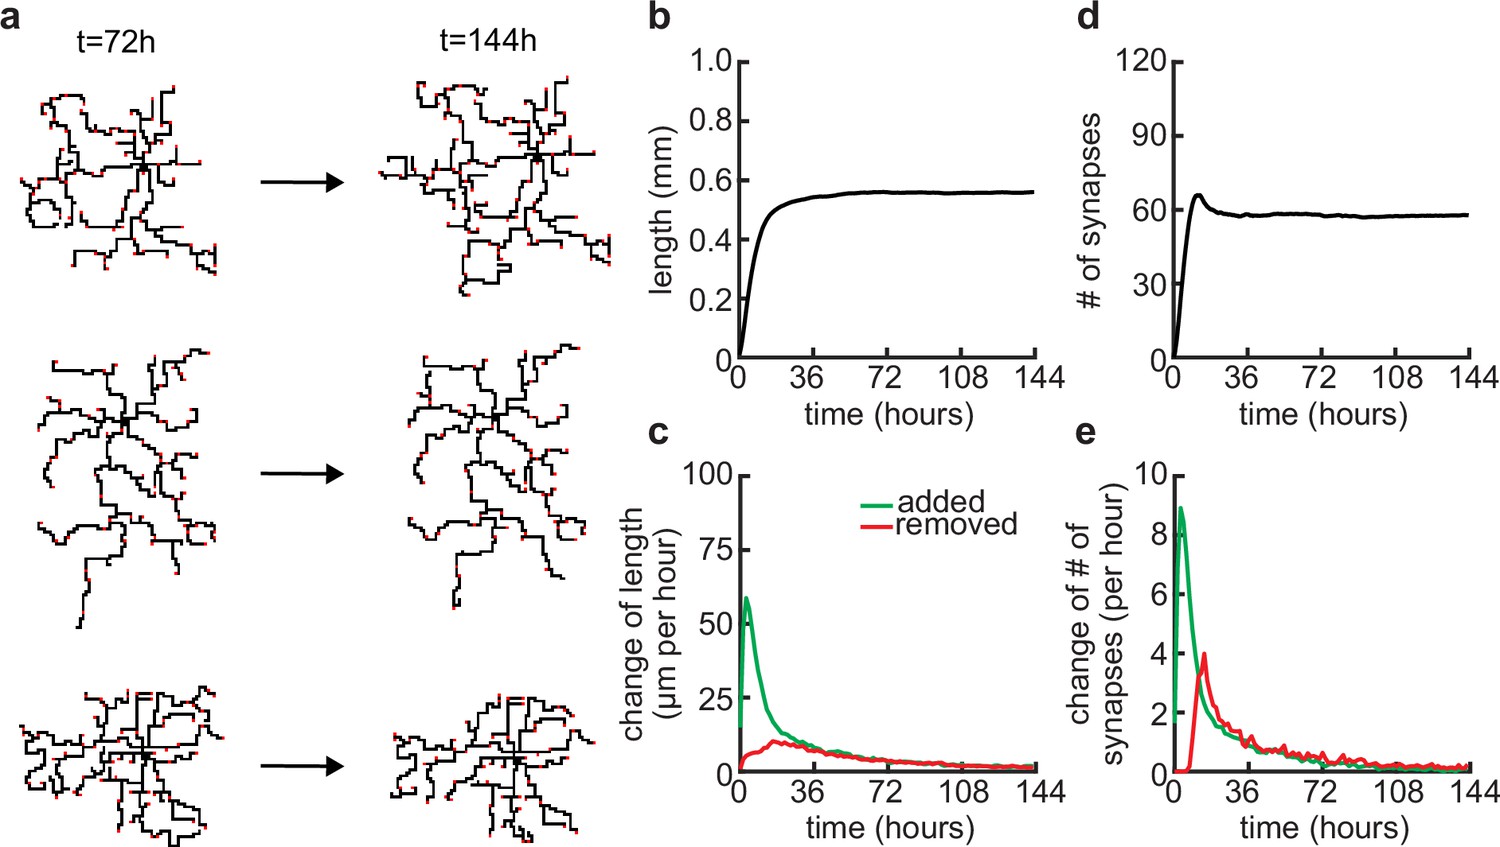
Dendritic arbors stay stable over longer simulations.
(a) Three examples of neurons at the end of the usual simulation time (t = 72 hours) and at double the usual simulation time (t = 144 hours). (b) Total length of dendritic tree as a function of time. (c) Length of dendrite added (green) and removed (red) as a function of time. (d) Total number of connected synapses as a function of time. (e) Added (green) and pruned synapses (red) as a function of time.
Figure 3—figure supplement 2
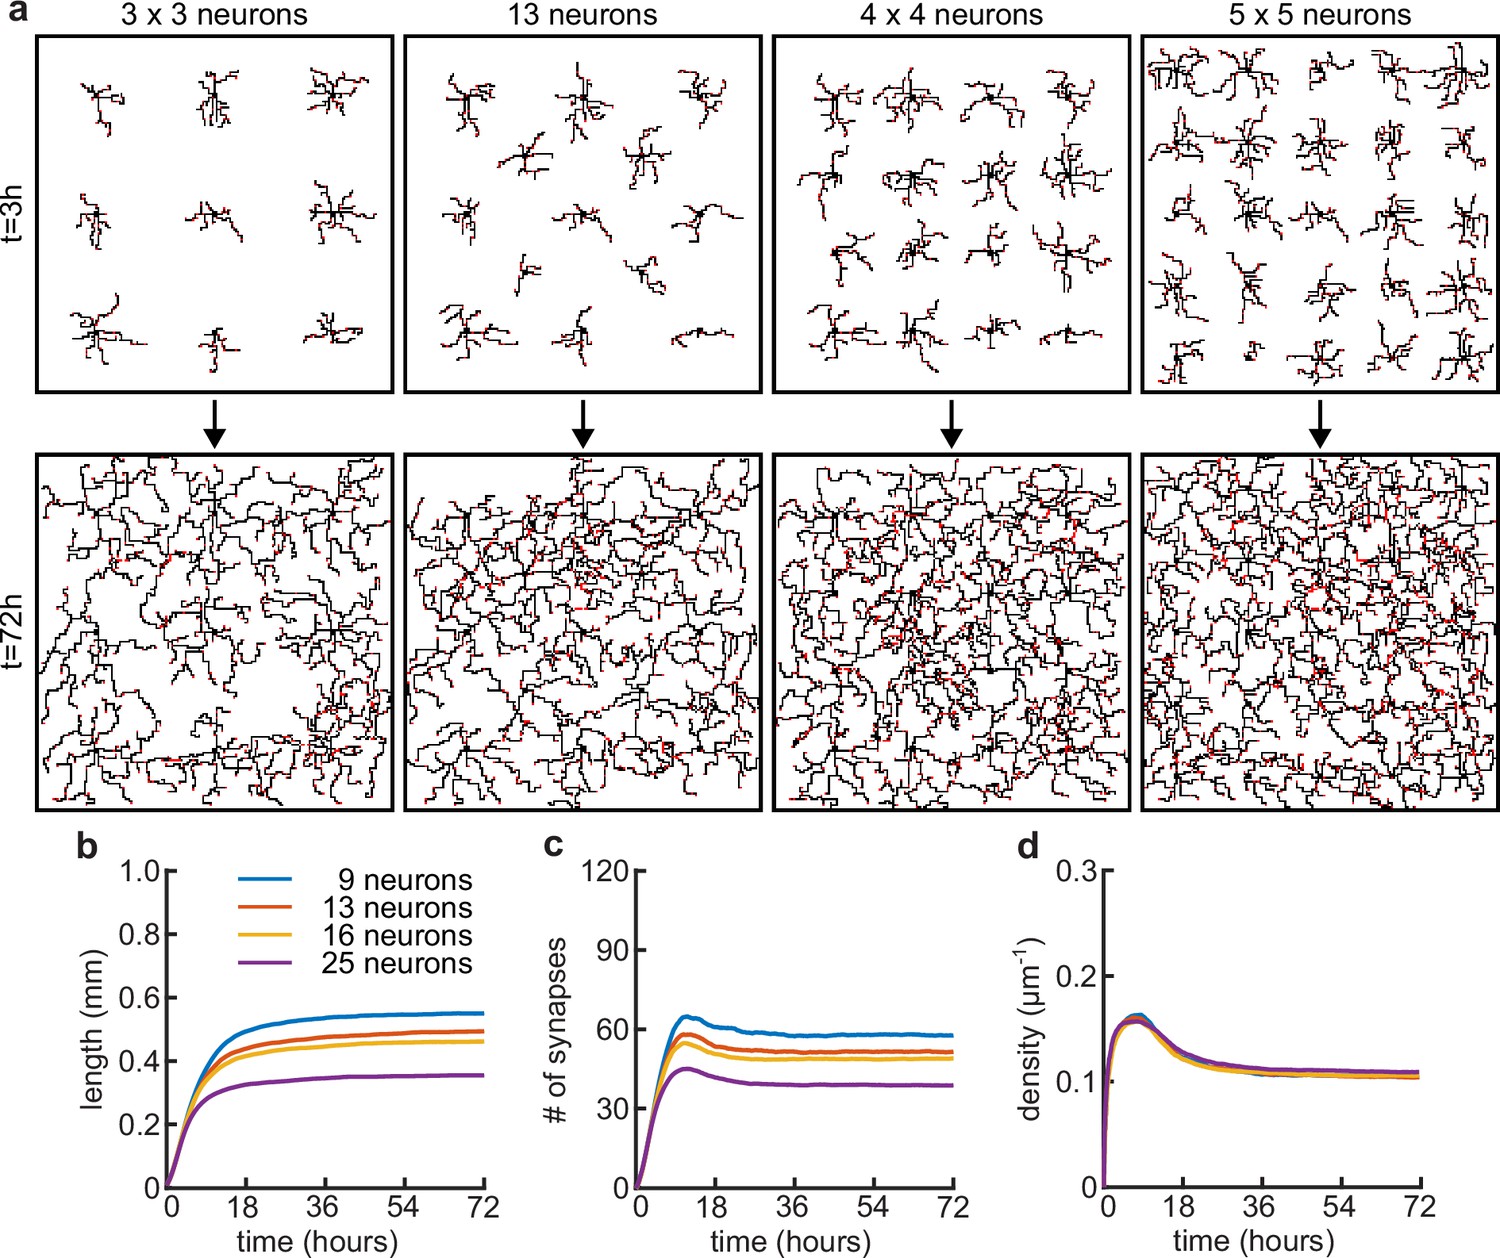
Somata density does not affect the timing of dendritic growth and pruning.
(a) Four examples of simulations with different numbers of somatas (from left to right: 9, 13, 16 and 25 somata) in the same simulated area at the beginning (t = 3 hours) and end (t = 72 hours) of simulation time. (b) Total length of dendritic tree as a function of time. (c) Total number of connected synapses as a function of time. (d) Total density of synapses on the dendrite as a function of time.
Figure 3—figure supplement 3
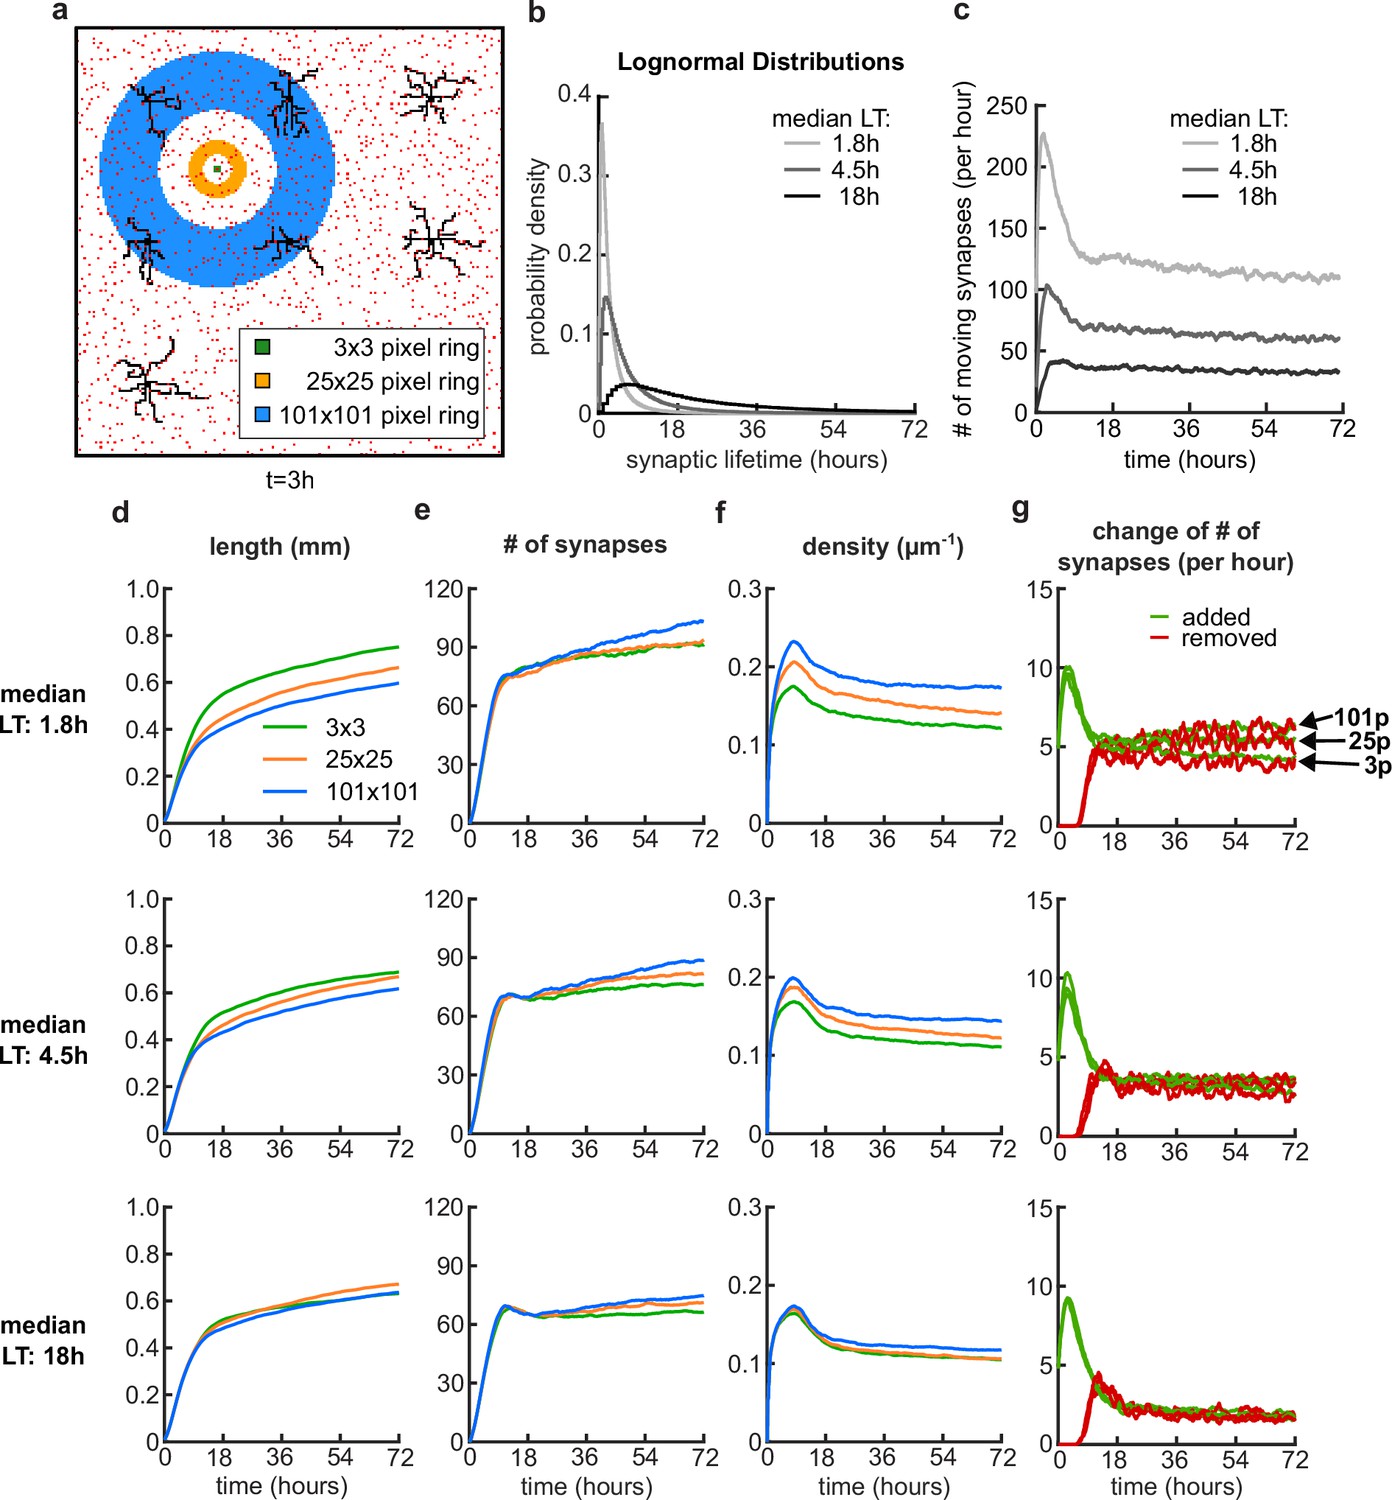
Dynamic potential synapses with log-normally distributed lifetimes.
(a) Nine dendrites (black) and potential synapses (red) after 3 hours of simulation time with a schematic of the pixel distance rings for the movement of an example potential synapse in the background. The synapse is located at the center of the rings and can move to any of the pixel locations of the specified ring, where there is no other synapse or dendrite located. (b) The synaptic lifetimes (LT) for each potential synapse are sampled from lognormal distributions with three different median LT (variance is always 1). (c) Number of moving synapses per hour over time for the three different distributions. (d-g) Dendrite length (d), number of synapses (e), density of connected synapses (f) and change of number of synapses (g) over time, for the median LTs 1.8 hours (top), 4.5 hours (center) and 18 hours (bottom). (g) At the top plot, the arrows highlight where the traces for the added (green) and removed (red) synapses end for different ring distances.
Figure 4
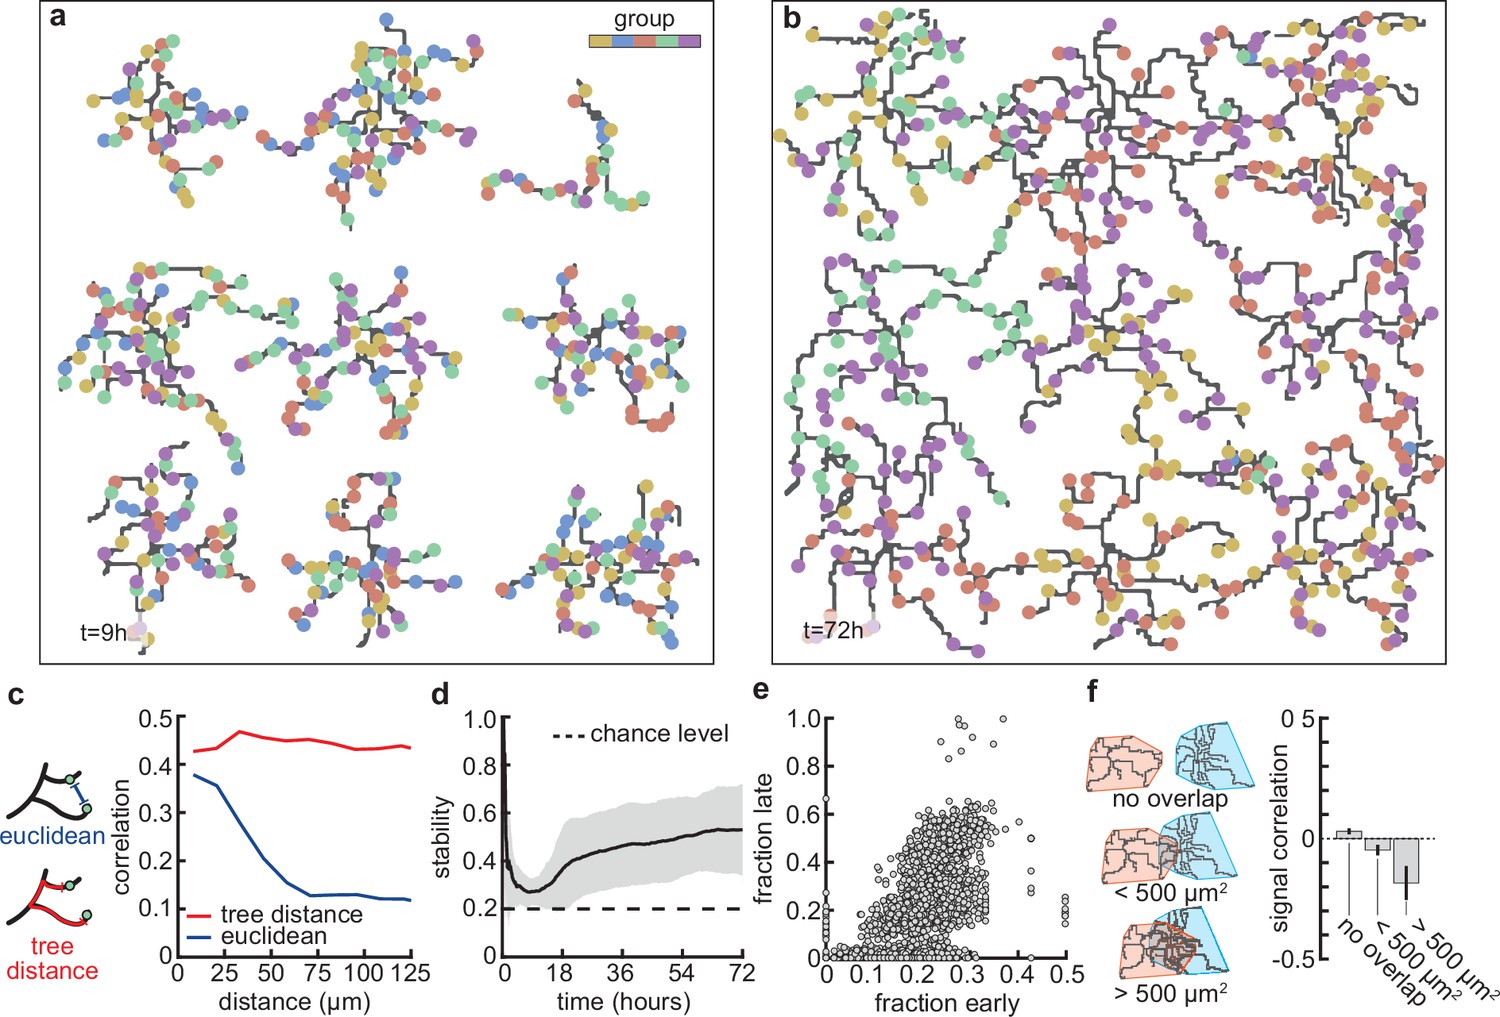
Stable morphology is obtained through selective removal of synapses and dendritic input selectivity.
(a, b) Dendritic trees before (a, 9 hr) and after (b, 72 hr) removal of synapses (Figure 3). Connected synapses colored corresponding to activity group, which represents activity correlations (Figure 1b). (c) Left: Schematic illustrating the difference between Euclidean and tree distance. Note that we compute the Euclidean distance between synapses from different trees. Right: Correlation between pairs of synapses as a function of the Euclidean distance (blue) and tree distance (red). (d) Input selectivity of dendrites (defined as the fraction of the activity group with the highest representation) as a function of time. Dashed line indicates chance level. All lines represent averages across 32 simulations with nine dendrites each. Shaded area indicates two standard deviations. (e) Fraction of connected synapses per activity group early ( hr) and late ( hr) in the simulation. Each dot represents one of the five activity groups on one of the nine dendrites from the 32 simulations, resulting in data points. (f) Left: Schematic of different levels of overlap (rows) between the convex hulls of two dendrites, referring to the smallest convex sets that contain the dendrite. Right: Signal correlation (correlation between fractions of synapses from the same activity groups) for different levels of dendritic overlap. Error bars indicate the standard error of the mean, computed from 1152 pairs of dendrites from 32 simulations.
Figure 5 with 2 supplements
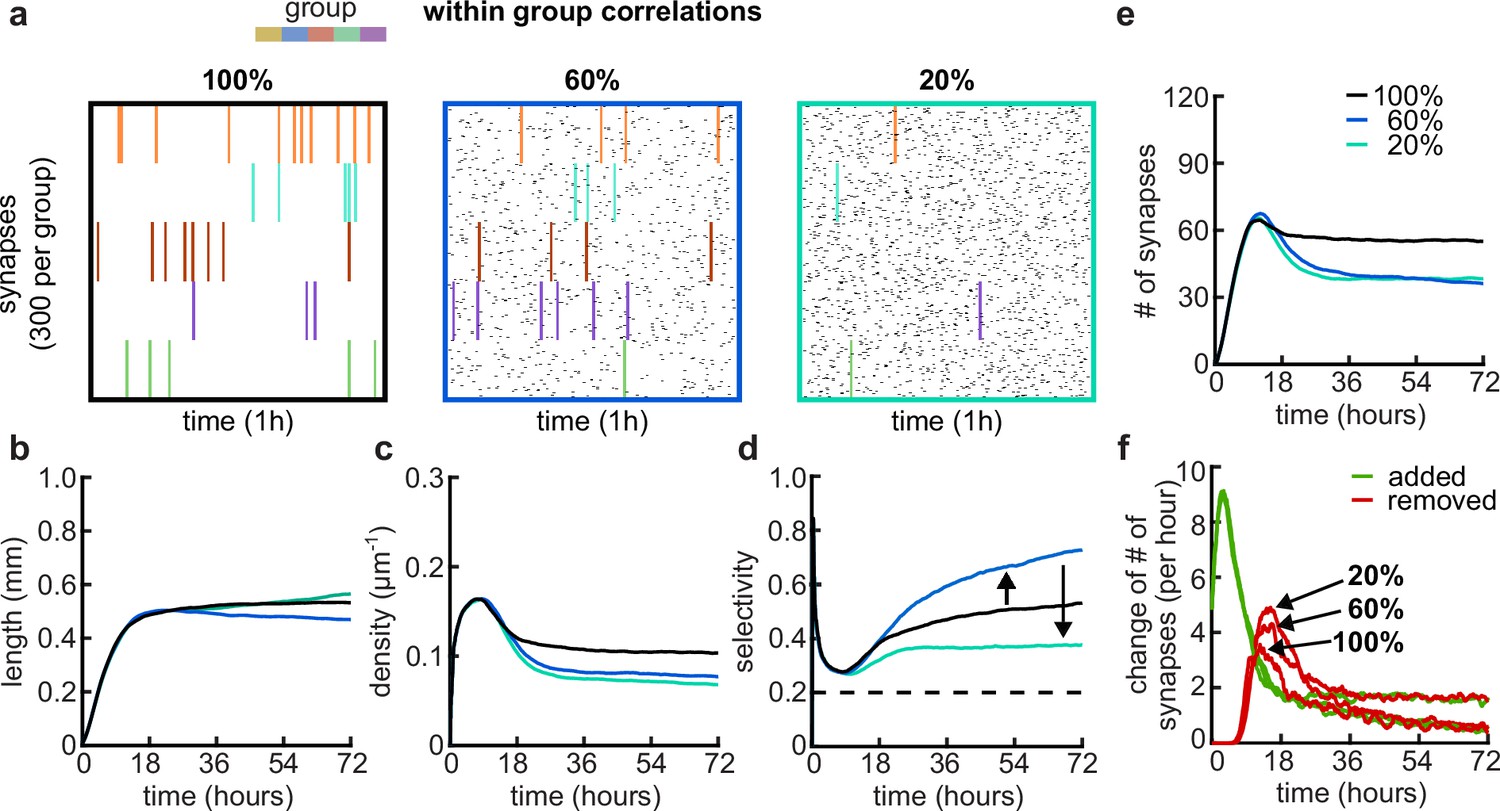
Effects of within-group correlations on group selectivity and synaptic pruning dynamics.
(a) Correlated spike train examples of all the activity groups with different within-group correlation statistics (from left to right, 100%, 80%, and 20% within-group correlations). Spike trains are sorted by synapses that correspond to each of the activity groups. Correlated spikes that are shared across all the synapses of one group are highlighted by the group’s color. (b) Total dendritic length as a function of time. (c) Total density of synapses on the dendrite. (d) Input selectivity of dendrites (defined as the fraction of the activity group with the highest representation) as a function of time. Dashed line indicates chance level. (e) Total number of connected synapses as a function of time. (f) Added (green) and pruned synapses (red) as a function of time. Arrows indicate the peaks of the simulations with different correlations. All lines represent averages across 32 simulations with nine dendrites each.
Figure 5—figure supplement 1
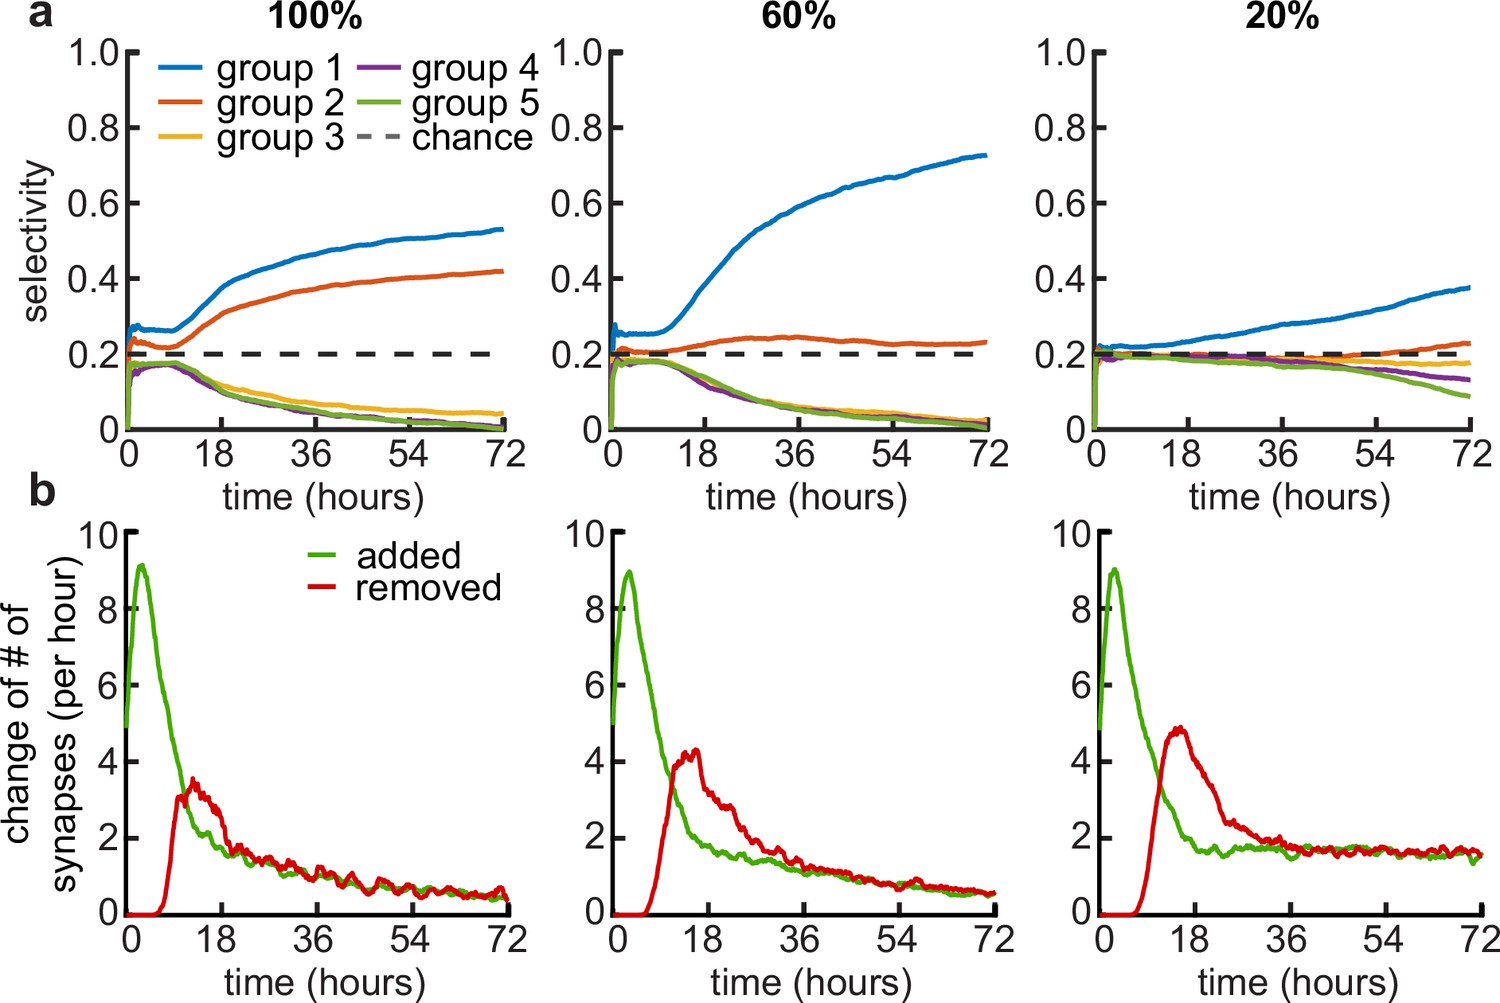
Examples of coexisting activity groups and synaptic pruning with low within-group correlations.
(a) Average selectivity of the simulated dendrites for the five activity groups (groups are sorted by their contribution to the dendrites synapses, where group 1 always has the most synapses contributing and group 5 the least) for three within-group correlations 100% (left), 60% (middle) and 20% (right). Dashed line indicates chance level. (b) Change in the number of synapses for three within-group correlations 100% (left), 60% (middle) and 20% (right).
Figure 5—figure supplement 2
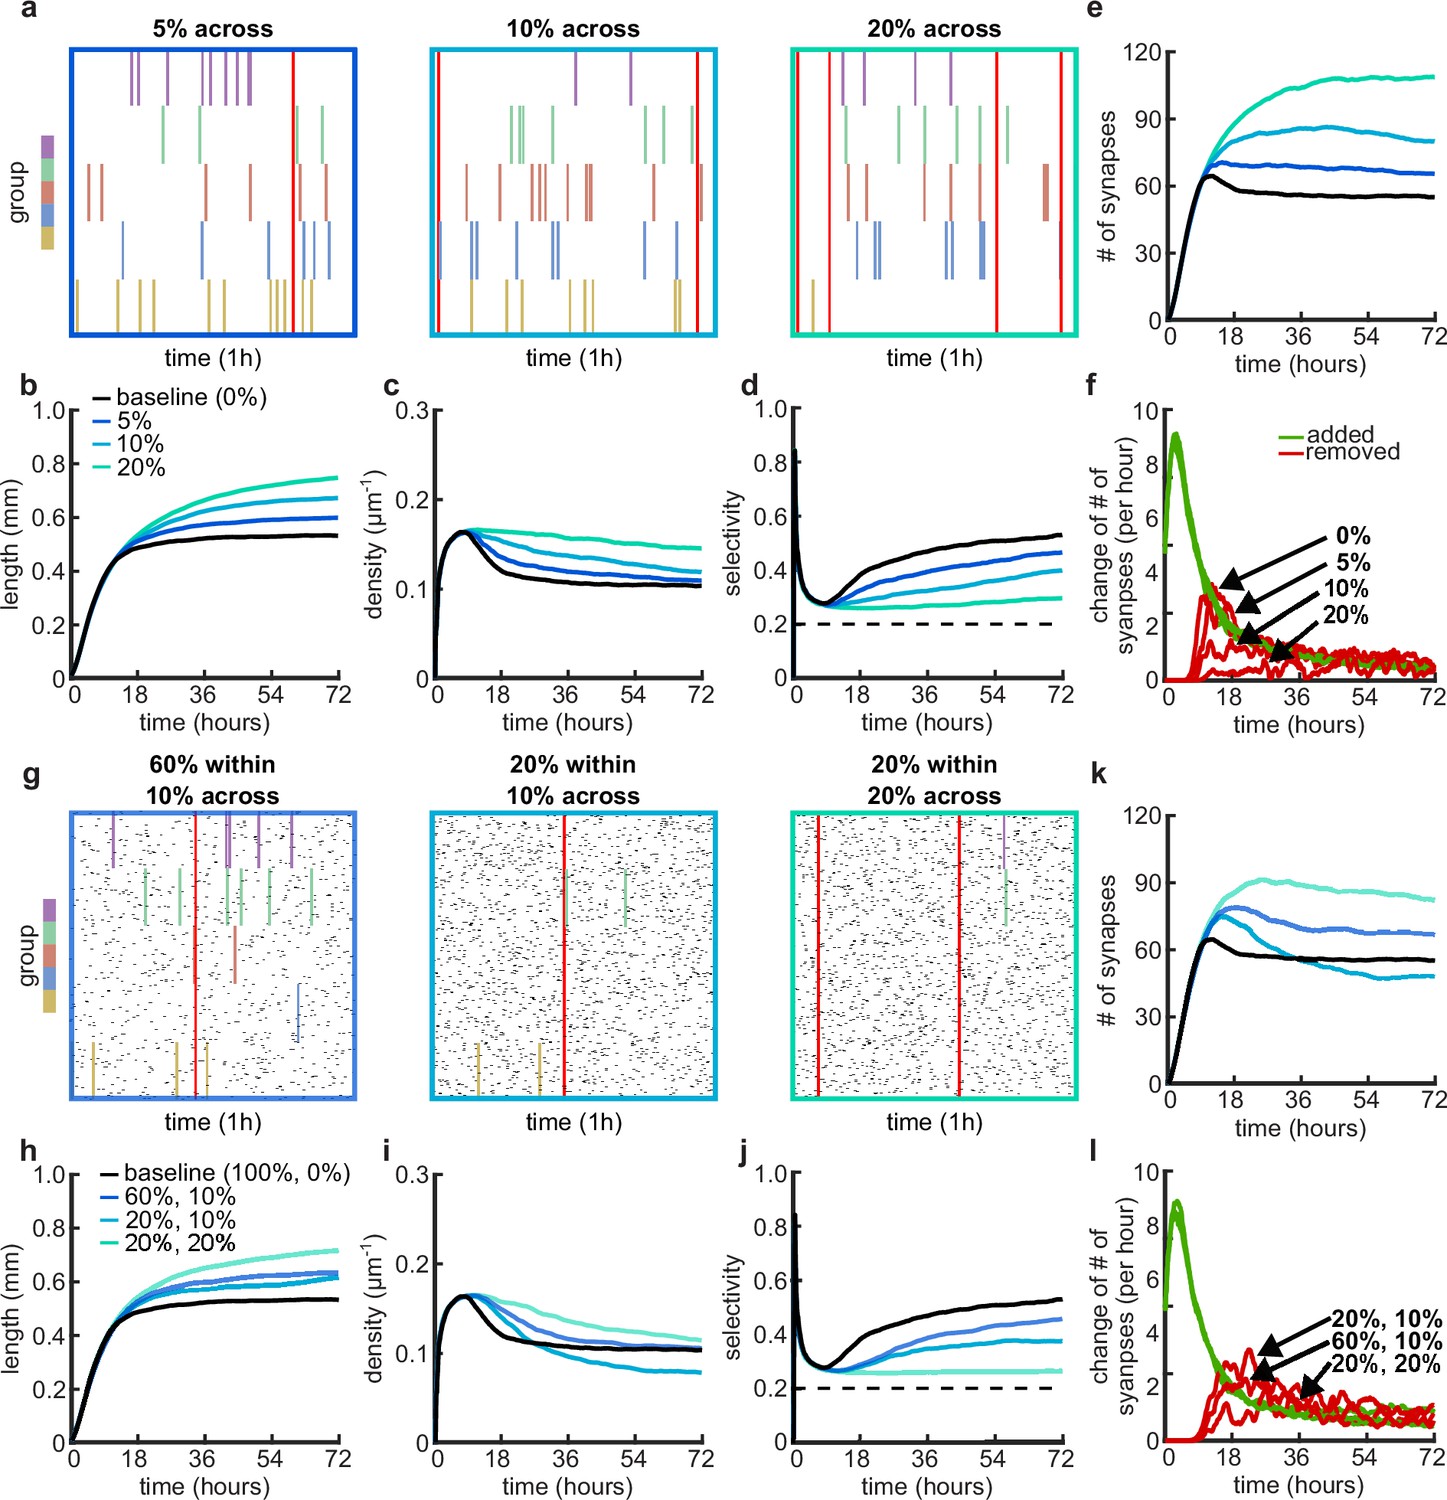
Effects of across-group correlations and combinations of within- and across-group correlations on group selectivity and synaptic pruning dynamics.
(a, g) Correlated spike train examples of all the activity groups with different across-group correlations (a) or combinations of within- and across-group correlations (g). Spike trains are sorted by synapses that correspond to each of the activity groups. Correlated spikes that are shared across all the synapses of one group are highlighted by the group’s color, and global spike events that are shared across all synapses of all groups are shown in red. (b, h) Total dendritic length as a function of time. (c, i) Total density of synapses on the dendrite as a function of time. (d, j) Input selectivity of dendrites (defined as the fraction of the activity group with the highest representation) as a function of time. Dashed line indicates chance level. (e, k) Total number of connected synapses as a function of time. (f, l) Added (green) and pruned synapses (red) as a function of time. Arrows indicate the peaks of the simulations with different correlations. All lines represent averages across 32 simulations with nine dendrites each.
Figure 6
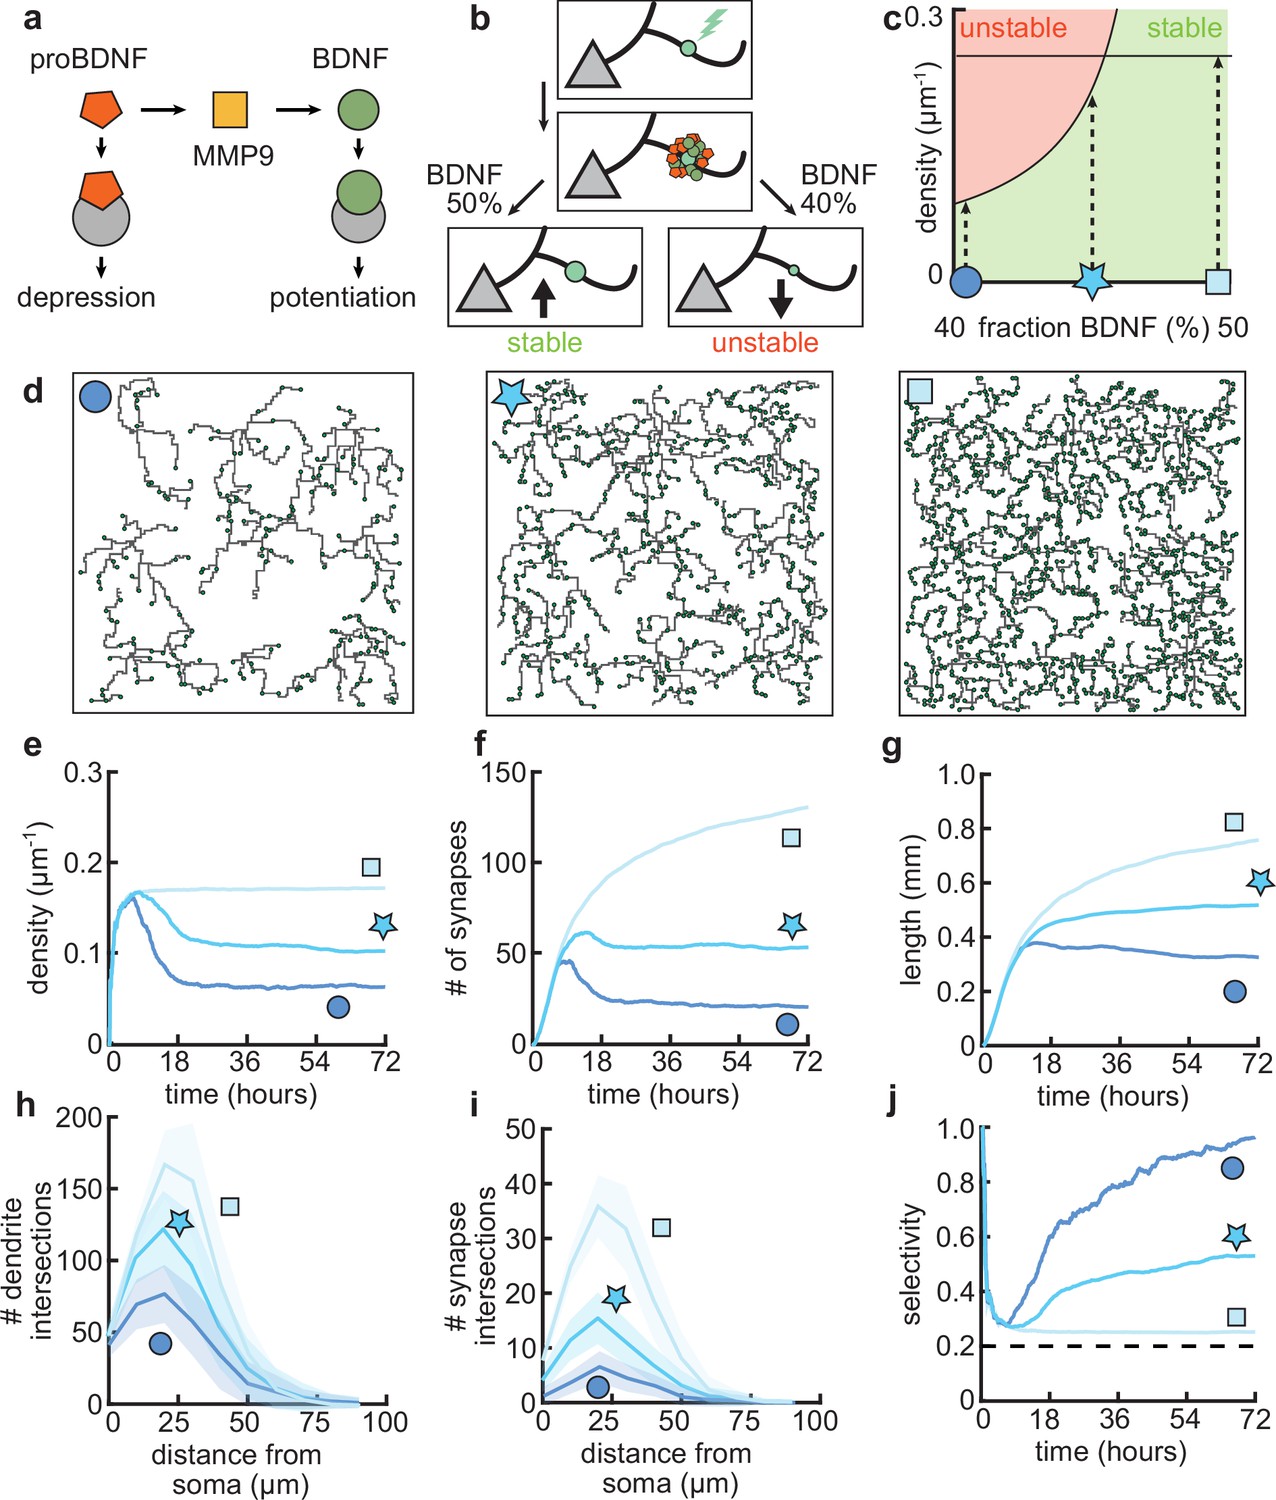
Dendritic arborization is controlled by the ratio of neurotrophic factors.
(a) Interactions between molecular factors underlie a local activity-dependent plasticity rule for synaptic change (Equation 1, Kirchner and Gjorgjieva, 2021). Neurotrophins (brain-derived neurotrophic factor [BDNF] and proBDNF) bind to different neurotrophin receptors, and a cleaving protease (MMP9) converts proBDNF to BDNF in an activity-dependent manner. (b) Schematic illustrating the impact of different concentrations of BDNF on synaptic change. Upon stimulation of a synapse (top), proBDNF and BDNF is released into extracellular space (middle), where proBDNF can be cleaved into BDNF by MMP9. Depending on the neurotrophin ratio, computed as BDNF/(BDNF+proBDNF), the synapse is stabilized (left) or depressed and hence eventually removed (right). (c) Maximally possible stable density of synapses as a function of the initial concentration of BDNF. Stable (no pruning; green) and unstable (pruning occurs; red) areas are indicated. (d) Three examples of dendrites with superimposed synapses (green) with high initial BDNF concentration (49%), the baseline concentration (46.5%, same as Figure 1–Figure 3), and low initial BDNF (43%). Symbols correspond to locations marked in panel c. (e–g) Averages for density of synapses on the dendrite (e), number of connected synapses (f) and total length of dendrite (g) as a function of time for dendrites from the three conditions shown in d. (h–i) Average number of dendrite intersections (h) and synapses (i) as a function of distance from the soma for dendrites from the three conditions shown in d. (j) Global selectivity as a function of time for dendrites from the three conditions shown in d. Dashed line indicates chance level. All lines represent averages across 32 simulations with nine dendrites each. Shaded area indicates two standard deviations.
Figure 7 with 1 supplement
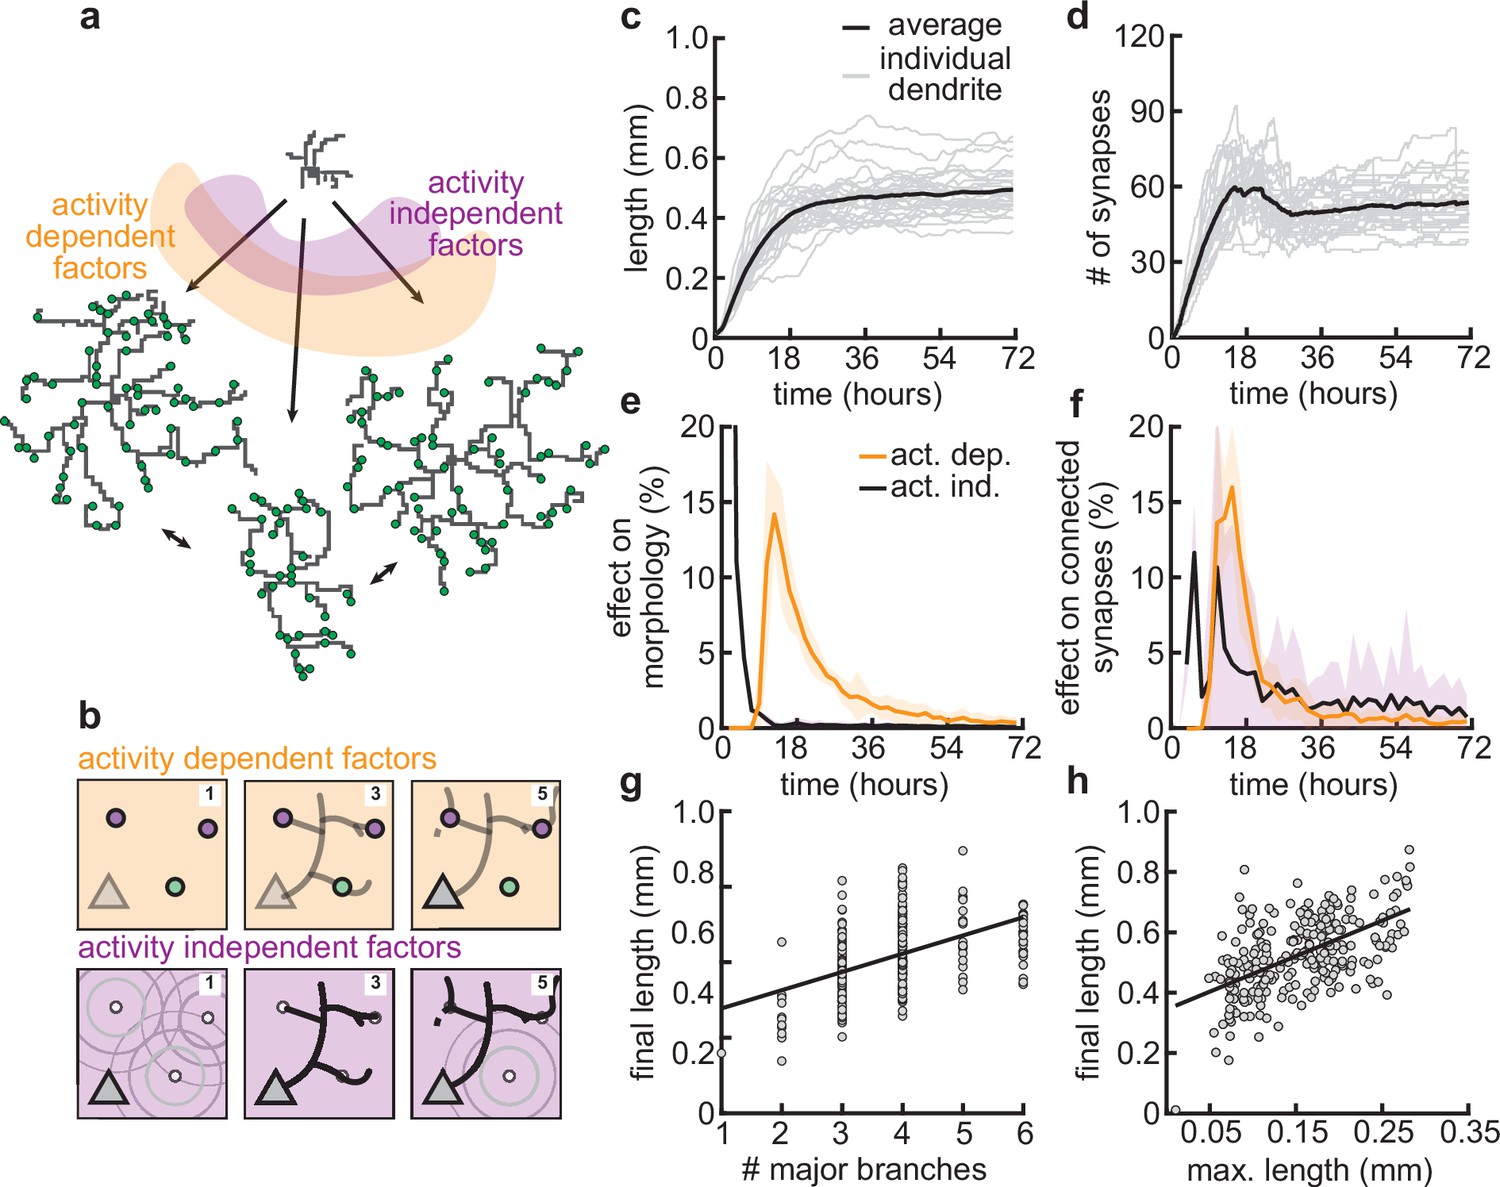
Morphological variability emerges from the interaction of activity-dependent and -independent factors.
(a) Example of three dendrites with identical initial conditions but different random seeds. The colors illustrate that initial growth is governed by activity-independent factors, while later growth is governed by activity-dependent factors. (b) Schematic illustrating how variability is introduced into model: activity-dependent via the patterns of spontaneous activity (orange), and activity-independent via fluctuations in both the extrinsic growth stimulating field (purple 1) and the intrinsic mechanisms underlying dendrite growth (purple 2; see Materials and methods). (c, d) Total length (c) and number of synapses (d) as a function of time for dendrites with identical initial conditions but different random seeds. Each gray line corresponds to one dendrite from 1 of 32 simulations. Bold line represents average. (e, f) Percentage in change of morphological similarity (e) and similarity of connected synapses (f) as a function of time for simulations where activity-dependent (orange) or -independent (purple) factors vary. Lines represent averages across 32 simulations with nine dendrites each. Shaded area indicates two standard deviations. (g, h) Final length as a function of number of major branches (g) and maximal length in the first 18 hr of the simulation (h). Lines indicate linear regression.
Figure 7—figure supplement 1

Total tree length increases with the number of stems.
Figure 8
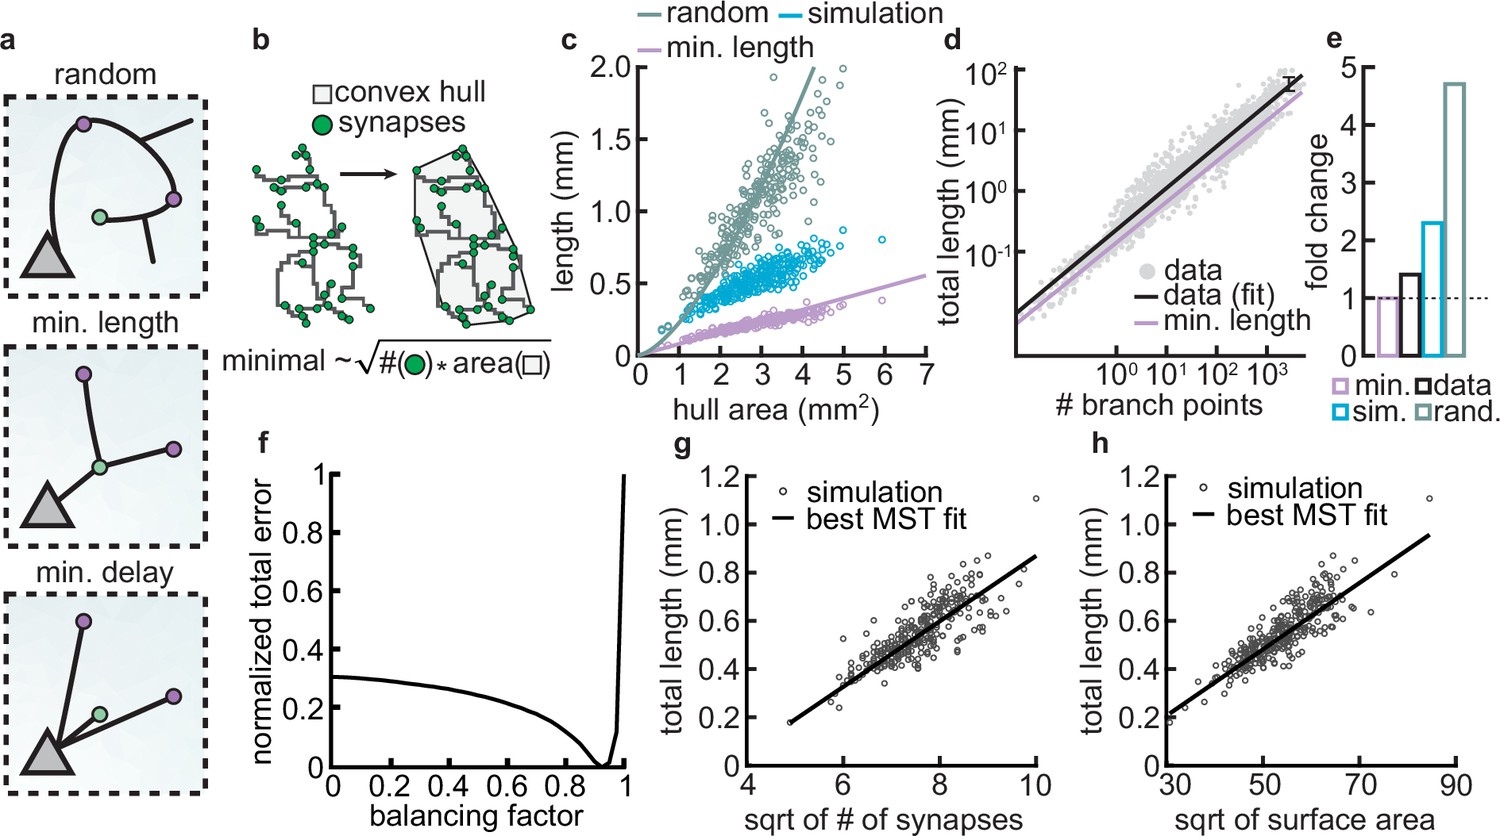
Synthetic dendritic morphologies: analysis of optimal wiring principles.
(a) Schematic of synaptic wiring principles: random (top), minimal length (middle), and minimal delay (bottom) for a set of synapses. (b) The convex hull of all synapses connected to a dendrite with the proportionality of minimal wiring length (bottom). (c) Total tree length as a function of convex hull area in the minimal wiring length, simulated and random scenario. Each dot corresponds to one of 288 dendrites from 32 simulations. Lines correspond to analytic predictions for the average density across all simulations. (d) Total tree length against the number of branch points in log scale, both for data and theoretical minimum. Data extracted from Cuntz et al., 2012. (e) Total tree length in the data (black, average of n=13,112), our simulations (blue, average of 288 dendrites from 32 simulations), and the random baseline (green, analytically computed) relative to the theoretical minimum (pink, analytically computed). (f) Model parameter vs. error (comparing simulated total length, number of terminals, and surface area, with corresponding synthetic trees; straight black line; optimal ). (g–h) Scaling behavior of the square root of number of synapses against total length (g, ) and square root of surface area against total length (h, ) showing the relationships expected from the optimal wire equations. The black line shows the best minimum spanning tree (MST) fit scaling behavior (see Materials and methods). In both panels, each dot represents one synthetic tree (n=288). Lines were fit using linear regression.
Tables
Table 1
Parameters of the minimal plasticity model (Kirchner and Gjorgjieva, 2021) and the synaptotrophic growth model.
| Parameter | Variable | Value |
|---|---|---|
| Synaptic efficacy time constant | 3000 time steps | |
| Postsynaptic accumulator time constant | 300 time steps | |
| Presynaptic accumulator time constant | 600 time steps | |
| Constitutive percent of BDNF of total neurotrophins | 46.5% | |
| MMP9 efficiency constant | 3/50 per time step | |
| Heterosynaptic offset | ||
| Minimal model synaptic efficacy time constant | ||
| Standard deviation of calcium spread | 200 μm | |
| Turnover threshold below which a synapse is replaced | 0.02 | |
| Firing rate of synapses | 0.116 μm min–1 | |
| Scout intervals and speed | 10 min, 0.18 μm min–1 |
Additional files
Download links
A two-part list of links to download the article, or parts of the article, in various formats.
Downloads (link to download the article as PDF)
Open citations (links to open the citations from this article in various online reference manager services)
Cite this article (links to download the citations from this article in formats compatible with various reference manager tools)
Dendritic growth and synaptic organization from activity-independent cues and local activity-dependent plasticity
eLife 12:RP87527.
https://doi.org/10.7554/eLife.87527.3


