Context-dependent modification of PFKFB3 in hematopoietic stem cells promotes anaerobic glycolysis and ensures stress hematopoiesis
- Department of Stem Cell Biology, Research Institute, National Center for Global Health and Medicine, Japan
- Division of Hematology, Department of Medicine, Keio University School of Medicine, Japan
- Department of Cell Fate Biology and Stem Cell Medicine, Tohoku University Graduate School of Medicine, Japan
- Department of Biochemistry, Keio University School of Medicine, Japan
- Center for Cancer Immunotherapy and Immunobiology, Kyoto University Graduate School of Medicine, Japan
- Department of Research Promotion and Management, National Cerebral and Cardiovascular Center, Japan
- Department of Life Sciences and Medical BioScience, Waseda University School of Advanced Science and Engineering, Japan
- Division of Stem Cell and Molecular Medicine, Center for Stem Cell Biology and Regenerative Medicine, The Institute of Medical Science, University of Tokyo, Japan
- Department of Immunology, Yokohama City University Graduate School of Medicine, Japan
- Advanced Medical Research Center, Yokohama City University, Japan
- Division of Cellular Therapy, The Institute of Medical Science, The University of Tokyo, Japan
- International Research Center for Medical Sciences, Kumamoto University, Japan
- Center for Advanced Assisted Reproductive Technologies, University of Yamanashi, Japan
- Precursory Research for Embryonic Science and Technology, Japan Science and Technology Agency, Japan
- Field of Human Disease Models, Major in Advanced Life Sciences and Medicine, Institute of Laboratory Animals, Tokyo Women's Medical University, Japan
- Department of Microscopic and Developmental Anatomy, Tokyo Women's Medical University, Japan
- Live Imaging Center, Central Institute for Experimental Animals, Japan
- Cancer Science Institute of Singapore, National University of Singapore, Singapore
Figures
Figure 1 with 3 supplements
HSC cell cycling increases overall glycolytic flux, but not flux into mitochondria.
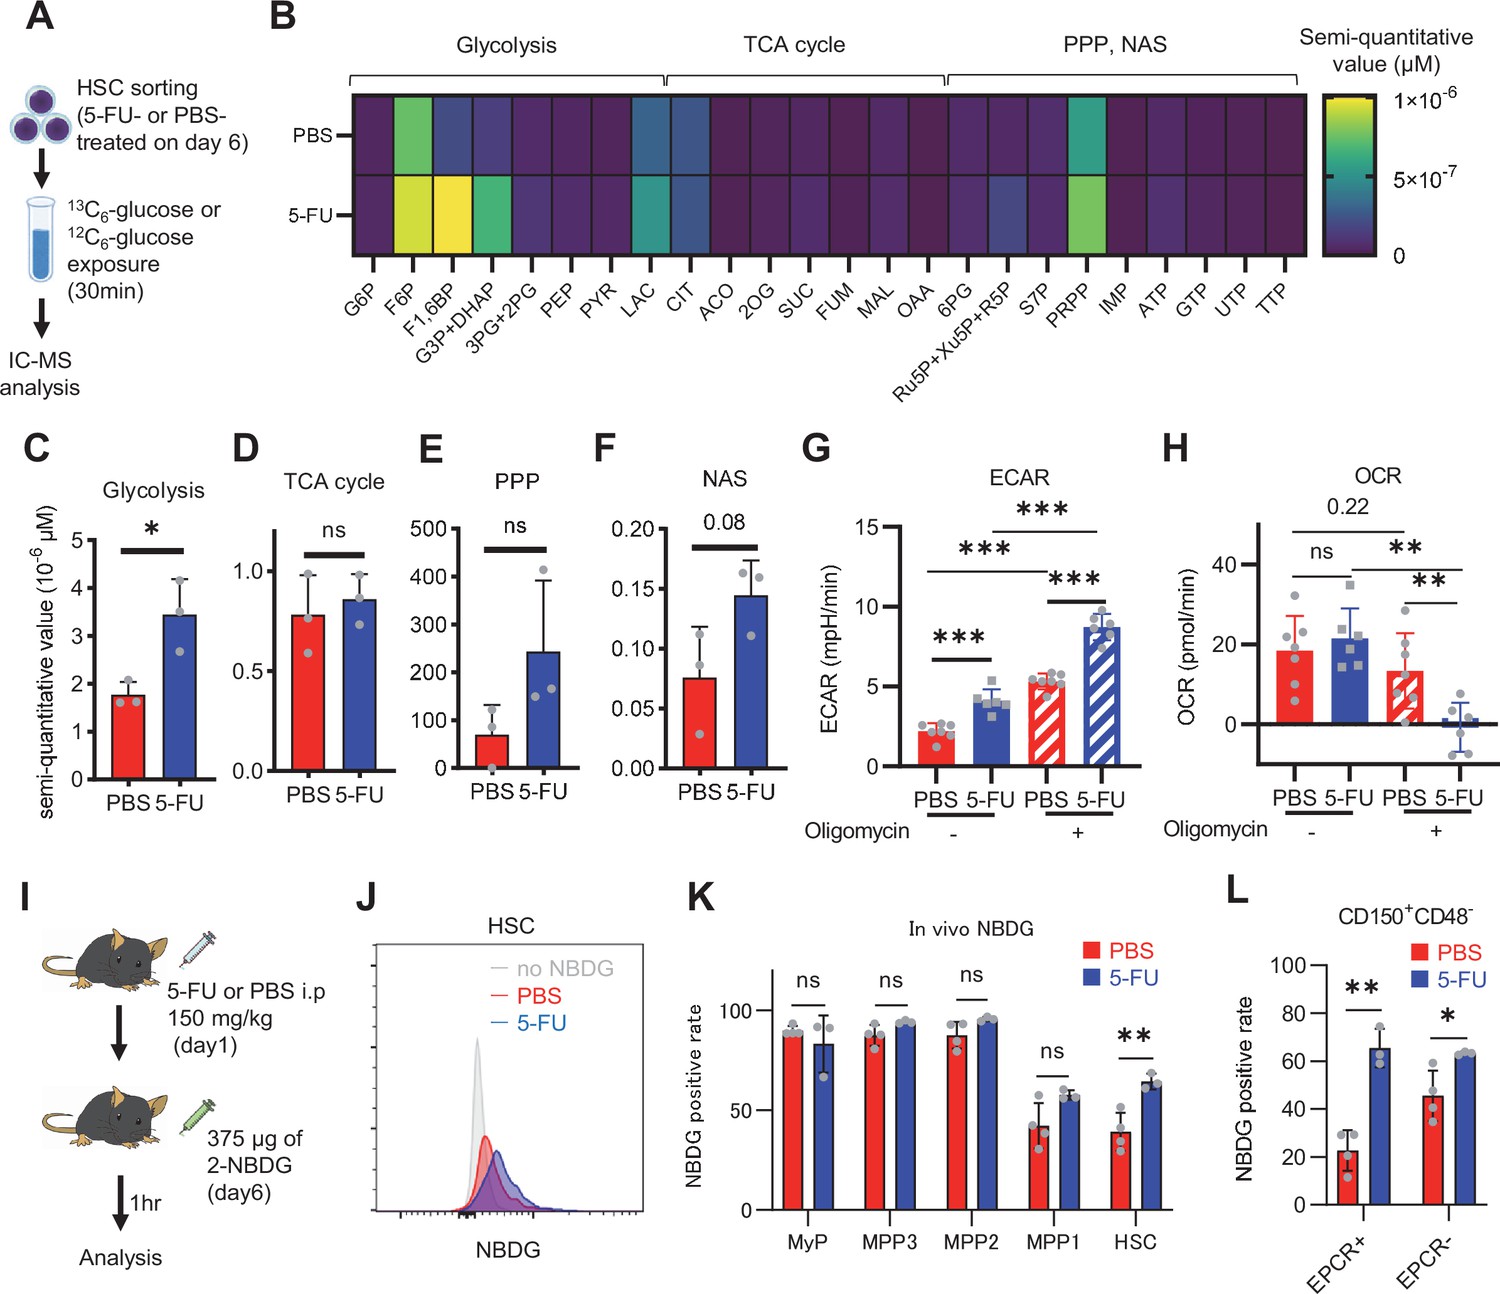
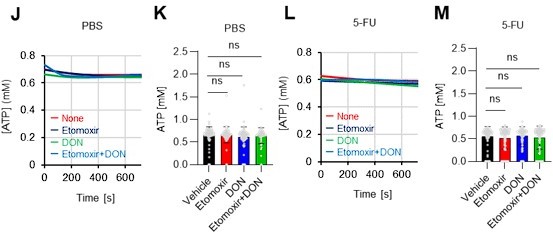
(A) Experimental design used for glucose isotope tracer analysis in HSCs from 5-FU- or PBS-treated mice. (B) Heat map of metabolite levels in HSCs derived from mice treated with PBS or 5-FU. (C–F) The semi-quantitative value (10–6 µM) of U-13C6-glucose-derived metabolites in glycolysis (C), the first round of TCA cycle (D), the PPP, and nucleotide synthesis (F) in HSCs from 5-FU- or PBS-treated mice (PBS group = 1.0); In (B-F), biological replicates from the PBS and 5-FU groups, obtained on three separate days, were pooled, analyzed by IC-MS, quantified based on calibration curve data for each metabolite (see ‘Ion chromatography mass spectrometry (IC-MS) analysis’ section in ‘Materials and methods’ for details). (G–H) A Mito Stress test with the Seahorse flux analyzer on HSCs derived from mice treated with PBS or 5-FU; ECAR (G) and OCR (H) before and after oligomycin treatment. (Data were obtained from n=7 technical replicates for PBS-treated HSCs and n=6 for 5-FU-treated HSCs.) (I) Experimental schema of in vivo 2-NBDG analysis. (J) Representative histograms of 2-NBDG analysis (gray: no 2-NBDG, red: PBS group, blue: 5-FU group). (K) 2-NBDG positivity in each fraction; data represent four pooled biological replicates for the PBS group and three for the 5-FU group; MyP: myeloid progenitor. (L) EPCR expression and 2-NBDG positivity within HSC fractions. Data were extracted from each individual in (K). Data are presented as mean ± SD. * p≤0.05, ** p≤0.01, *** p≤0.001 as determined by Student’s t-test (C–F, G–H when comparing the PBS and 5-FU groups, and K–L) or paired-samples t-test (G–H when comparing the conditions before and after exposure to oligomycin within the PBS/5-FU group). Abbreviations: G6P, glucose-6-phosphate; F6P, fructose-6-phosphate; F1,6BP, fructose-1,6-bisphosphate; G3P, glycerol-3-phosphate; DHAP, dihydroxyacetone phosphate; 3 PG, 3-phosphoglycerate; 2 PG, 2-phosphoglycerate; PEP, phosphoenolpyruvate; PYR, pyruvate; LAC, lactate; Ac-CoA; acetyl-CoA; CIT, citrate; ACO, cis-aconitic acid, isocitrate; 2OG, 2-oxoglutarate; SUC, succinate; FUM, fumarate; MAL, malate; OAA, oxaloacetate; 6 PG, 6-phosphogluconate; Ru5P, ribulose-5-phosphate; Xu5P, xylulose-5-phosphate; R5P, ribose-5-phosphate; S7P, sedoheptulose-7-phosphate; E4P, erythrose-4-phosphate; PRPP, phosphoribosyl pyrophosphate; IMP, inosine monophosphate; ATP, adenosine triphosphate; GTP, guanine triphosphate; UMP, uridine monophosphate; UTP, uridine triphosphate; TTP, thymidine triphosphate. See also Figure 1—figure supplements 1–3.
-
Figure 1—source data 1
Raw data for Figure 1B–H, K and L.
- https://cdn.elifesciences.org/articles/87674/elife-87674-fig1-data1-v2.xlsx
Figure 1—figure supplement 1
Dependence on glycolysis increases with cell cycle progression of HSCs.
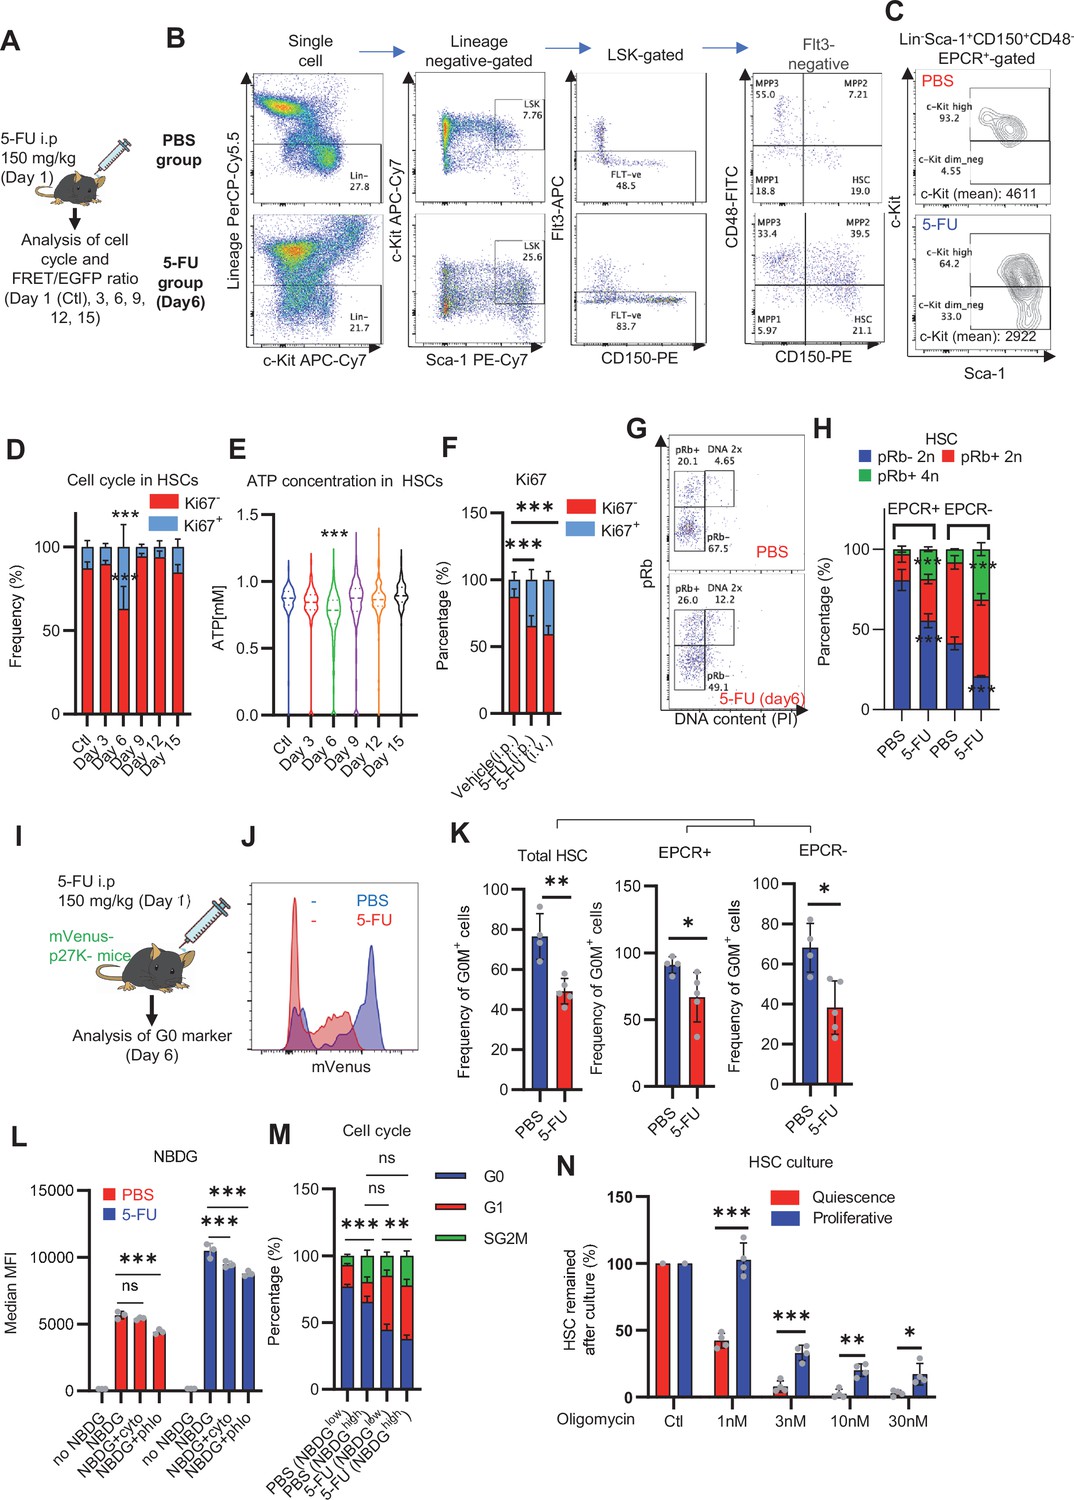
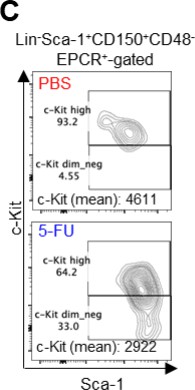
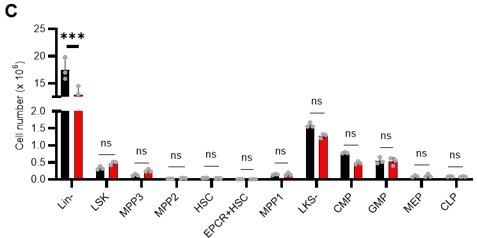
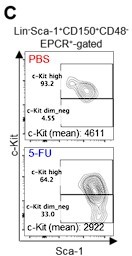
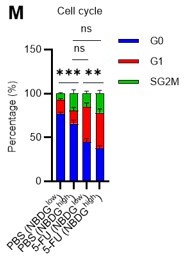
(A) Schematic illustration of 5-FU administration and analysis. (B) Representative staining plot of BM cells derived from mice 5 d (day 6) after treatment with PBS or 5-FU (day 1); note the gating of c-Kit high-dim cells in the LSK staining. Because the same BMMNC counts were obtained for each group, the Flt3-negative gated dot plot (bottom-right) for the 5-FU group appears to show an increase in the HSC fraction. (C) Contour plot of c-Kit expression in Lin-Sca-1+EPCR+CD150+CD48- cells from mice five days after PBS or 5-FU administration. (D) Frequency of Ki67-positive and -negative HSCs after 5-FU administration. n=5 biological replicates for each group. (E) Changes in ATP concentration in HSCs after 5-FU administration (n>70 single HSCs for each group). Data are representative results of pooled samples of two biological replicates. (F) Ki-67 positivity in HSCs by route of 5-FU administration (i.p. or i.v.). n=4 biological replicates for each group. (G–H) Intracellular staining of pRb in EPCR+ or EPCR- HSCs derived from PBS- or 5-FU-treated mice. Representative plot of pRb and DNA content in EPCR+ HSCs from both groups (G). Summary of results (H). n=3 biological replicates for each group. (I–K) Analysis of mVenus-p27K- mice treated with PBS or 5-FU. Experimental schema (I). Representative G0 marker distribution in HSC in PBS (blue) or 5-FU (red) groups (J). Percentage of G0 marker-positive cells in total HSCs and EPCR+ or EPCR- HSCs in PBS (blue bars) or 5-FU group (red bars) (K). n=4–5 biological replicates for each group. The data for each panel is extracted from the same individual. (L) In vitro 2-NBDG assay. cyto: cytochalasin, phlo: phloretin. n=3 biological replicates for each group. (M) In vivo administration of 2-NBDG followed by the Ki67/Hoechst 33432 staining of HSCs. n=6 biological replicates for each group. (N) Relative percentage of HSCs remaining after culture under quiescence-maintaining or proliferative conditions in the presence of oligomycin. HSC number for the control (Ctl) vehicle (DMSO)-treated group was set to 100%; n=4 technical replicates for each group. The data are representative results from three independent experiments. (See ‘MACSQuant analysis of cell number’ under ‘Materials and methods’ for more information.). Data are presented as mean ± SD. * p≤0.05, ** p≤0.01, *** p≤0.001 as determined using Student’s t-test (H, K, N) or one-way ANOVA followed by Tukey’s test (D–F, and L–M).
-
Figure 1—figure supplement 1—source data 1
Raw data for Figure 1—figure supplement 1D–F, H, K-N.
- https://cdn.elifesciences.org/articles/87674/elife-87674-fig1-figsupp1-data1-v2.xlsx
Figure 1—figure supplement 2
Quantified metabolite pool in HSCs under quiescence, proliferation, or OXPHOS-inhibition.
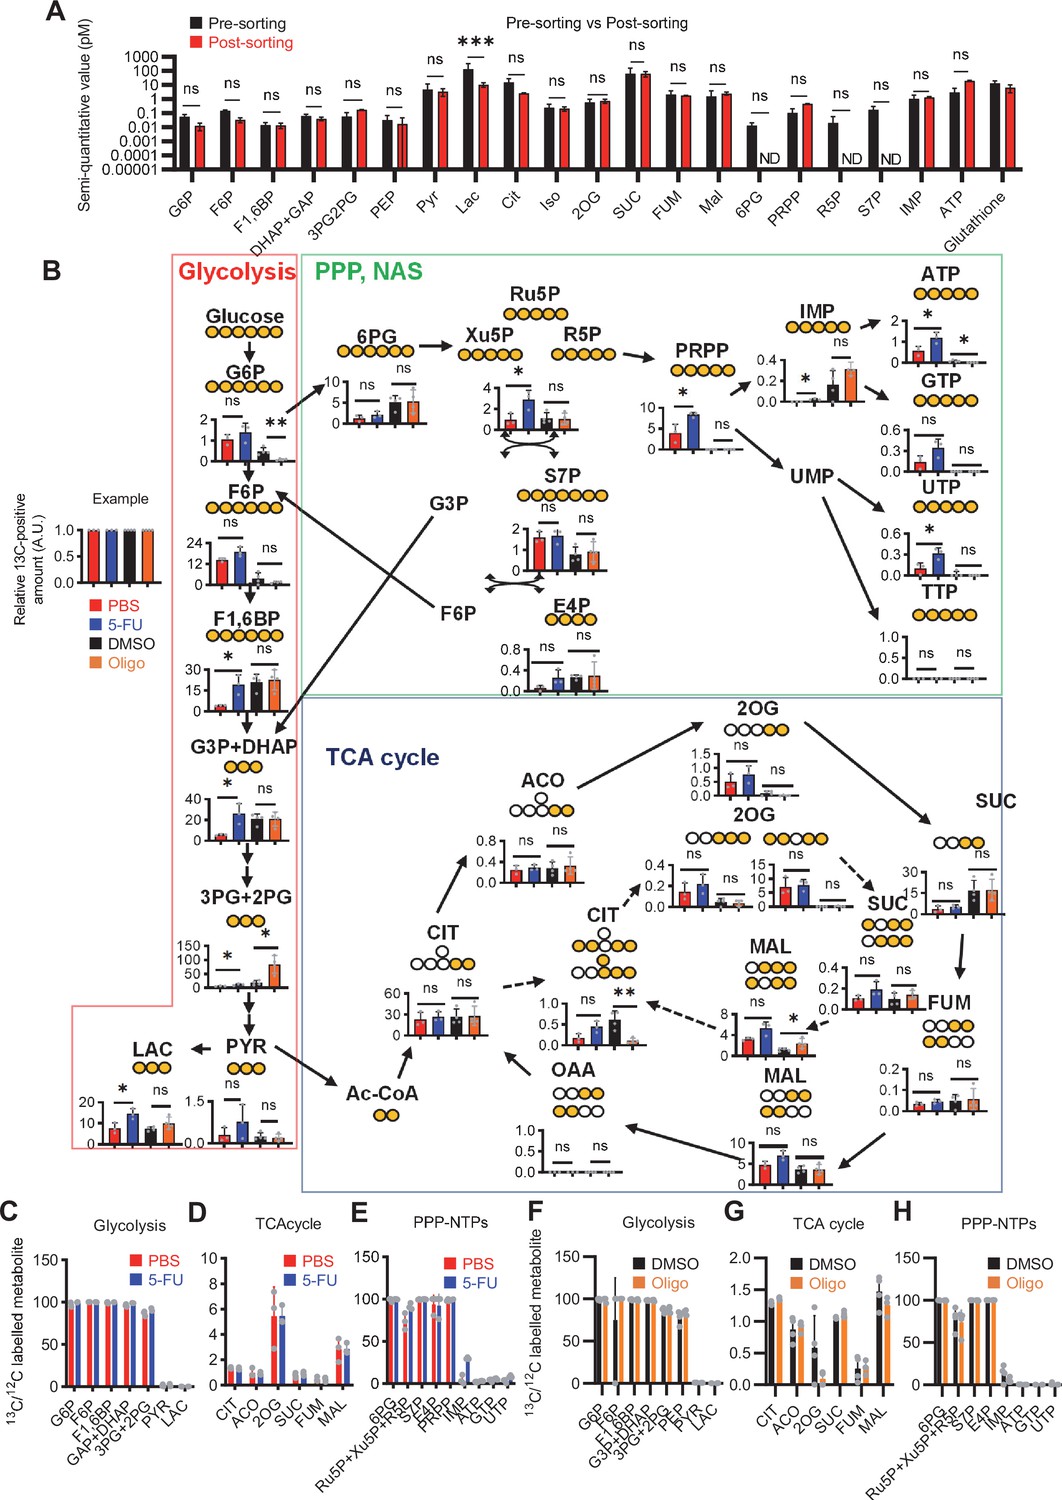
(A) Comparison of metabolite levels in c-Kit enriched cells pre- and post-sorting. n=3 biological replicates for each group. ND: not detected. (B) Metabolic overview of U-13C6-glucose tracing among pathways related to glycolysis, PPP, NAS, and the TCA cycle in HSCs from 5-FU- (blue) or PBS-treated (red) mice, and DMSO- (black) or oligomycin (Oligo)-treated (orange) HSCs. Fates of carbons derived from U-13C6-glucose in each metabolite are shown as yellow circles. Each graph indicates relative amounts of U-13C6-glucose-derived metabolites. (C–E) Ratio of U-13C6-glucose-labelled to non-labelled metabolites in glycolysis (C), the first round of the TCA cycle (D), and the PPP plus nucleic acid synthesis (E) in PBS- (red bars) and 5-FU-treated (blue bars) HSCs. (F–H) Ratio of U-13C6-glucose-labelled to non-labelled metabolites in glycolysis (F), the first round of the TCA cycle (G), and the PPP plus nucleic acid synthesis (H) in HSCs treated with vehicle (black bars) or oligomycin (orange bars). In (B–H), data are extracted from three biological replicates for HSCs derived from PBS- or 5-FU-treated mice and from four for HSCs after DMSO or oligomycin treatment. Data are presented as mean ± SD. * p≤0.05, ** p≤0.01, *** p≤0.001 as determined using two-way ANOVA with Sidak’s test (A) and Student’s t-test (B) by comparing PBS and 5-FU groups or DMSO and oligomycin groups. Abbreviations: G6P, glucose-6-phosphate; F6P, fructose-6-phosphate; F1,6BP, fructose-1,6-bisphosphate; G3P, glycerol-3-phosphate; DHAP, dihydroxyacetone phosphate; 3 PG, 3-phosphoglycerate; 2 PG, 2-phosphoglycerate; PEP, phosphoenolpyruvate; PYR, pyruvate; LAC, lactate; Ac-CoA; acetyl-CoA; CIT, citrate; ACO, cis-aconitic acid, isocitrate; 2OG, 2-oxoglutarate; SUC, succinate; FUM, fumarate; MAL, malate; OAA, oxaloacetate; 6 PG, 6-phosphogluconate; Ru5P, ribulose-5-phosphate; Xu5P, xylulose-5-phosphate; R5P, ribose-5-phosphate; S7P, sedoheptulose-7-phosphate; E4P, erythrose-4-phosphate; PRPP, phosphoribosyl pyrophosphate; IMP, inosine monophosphate; ATP, adenosine triphosphate; GTP, guanine triphosphate; UMP, uridine monophosphate; UTP, uridine triphosphate; TTP, thymidine triphosphate.
-
Figure 1—figure supplement 2—source data 1
Raw data for Figure 1—figure supplement 2A–H.
- https://cdn.elifesciences.org/articles/87674/elife-87674-fig1-figsupp2-data1-v2.xlsx
Figure 1—figure supplement 3

Mito Stress test results using the Seahorse flux analyzer.
(A–D) Overview of the Mito Stress test on the Seahorse flux analyzer for PBS- or 5-FU-treated HSCs (A) ECAR, (B) OCR and HSCs or MyPs (C) ECAR, (D) OCR.
-
Figure 1—figure supplement 3—source data 1
Raw data for Figure 1—figure supplement 3A–D.
- https://cdn.elifesciences.org/articles/87674/elife-87674-fig1-figsupp3-data1-v2.xlsx
Figure 2
OXPHOS inhibition activates compensatory glycolysis in HSCs.
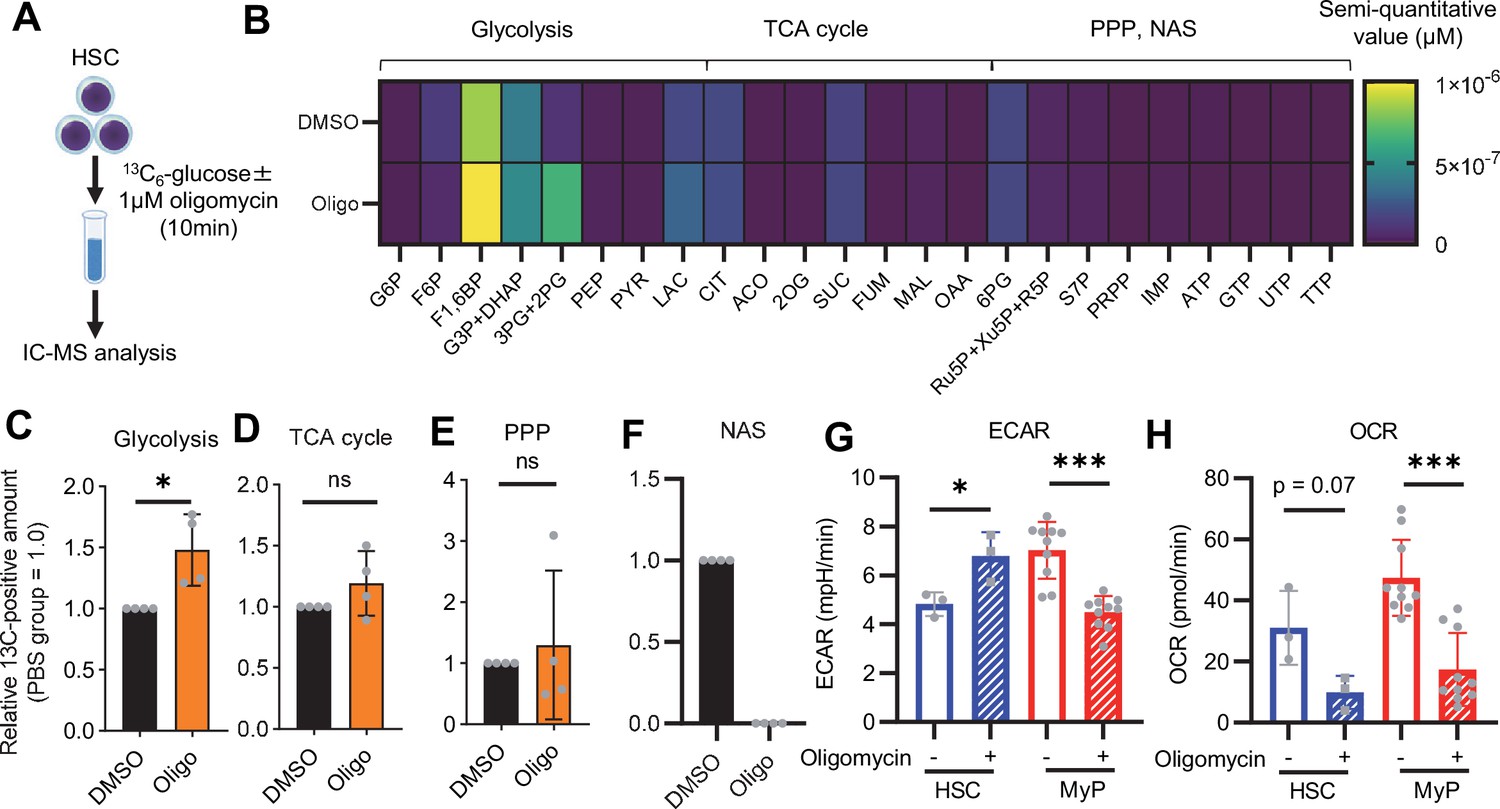
(A) Experimental design used for glucose isotope tracer analysis in HSCs treated with the OXPHOS inhibitor oligomycin. (B) Heat map of metabolite levels detected by in vitro tracer analysis of U-13C6-glucose in HSCs treated with DMSO or oligomycin (Oligo). (C–F) Relative amounts of U-13C6-glucose-derived metabolites in glycolysis (C), the first round of TCA cycle (D), the PPP(E), and nucleotide synthesis (F) in DMSO- (black) or oligomycin-treated (orange) HSCs; In (B-F), biological replicates of the DMSO and oligomycin groups obtained on four separate days were pooled, analyzed by IC-MS, and quantified based on calibration curve data for each metabolite (see ‘Ion chromatography mass spectrometry (IC-MS) analysis’ section in ‘Materials and methods’ for details). (G–H) Mito Stress test on the Seahorse flux analyzer for HSC and MyPs; ECAR (G) and OCR (H) before and after oligomycin treatment. (Data were obtained from n=3 technical replicates for HSCs and n=10 technical replicates for MyPs.). Data are shown as mean ± SD. * p≤0.05, ** p≤0.01, *** p≤0.001 as determined by paired-samples t-test (C-E and G–H). Abbreviations: G6P, glucose-6-phosphate; F6P, fructose-6-phosphate; F1,6BP, fructose-1,6-bisphosphate; G3P, glycerol-3-phosphate; DHAP, dihydroxyacetone phosphate; 3 PG, 3-phosphoglycerate; 2 PG, 2-phosphoglycerate; PEP, phosphoenolpyruvate; PYR, pyruvate; LAC, lactate; Ac-CoA; acetyl-CoA; CIT, citrate; ACO, cis-aconitic acid, isocitrate; 2OG, 2-oxoglutarate; SUC, succinate; FUM, fumarate; MAL, malate; OAA, oxaloacetate; 6 PG, 6-phosphogluconate; Ru5P, ribulose-5-phosphate; Xu5P, xylulose-5-phosphate; R5P, ribose-5-phosphate; S7P, sedoheptulose-7-phosphate; E4P, erythrose-4-phosphate; PRPP, phosphoribosyl pyrophosphate; IMP, inosine monophosphate; ATP, adenosine triphosphate; GTP, guanine triphosphate; UMP, uridine monophosphate; UTP, uridine triphosphate; TTP, thymidine triphosphate. See also Figure 1—figure supplements 1–3.
-
Figure 2—source data 1
Raw data for Figure 2B–H.
- https://cdn.elifesciences.org/articles/87674/elife-87674-fig2-data1-v2.xlsx
Figure 3 with 2 supplements
Quantitative 13C-MFA of quiescent, proliferative, and stressed HSCs.
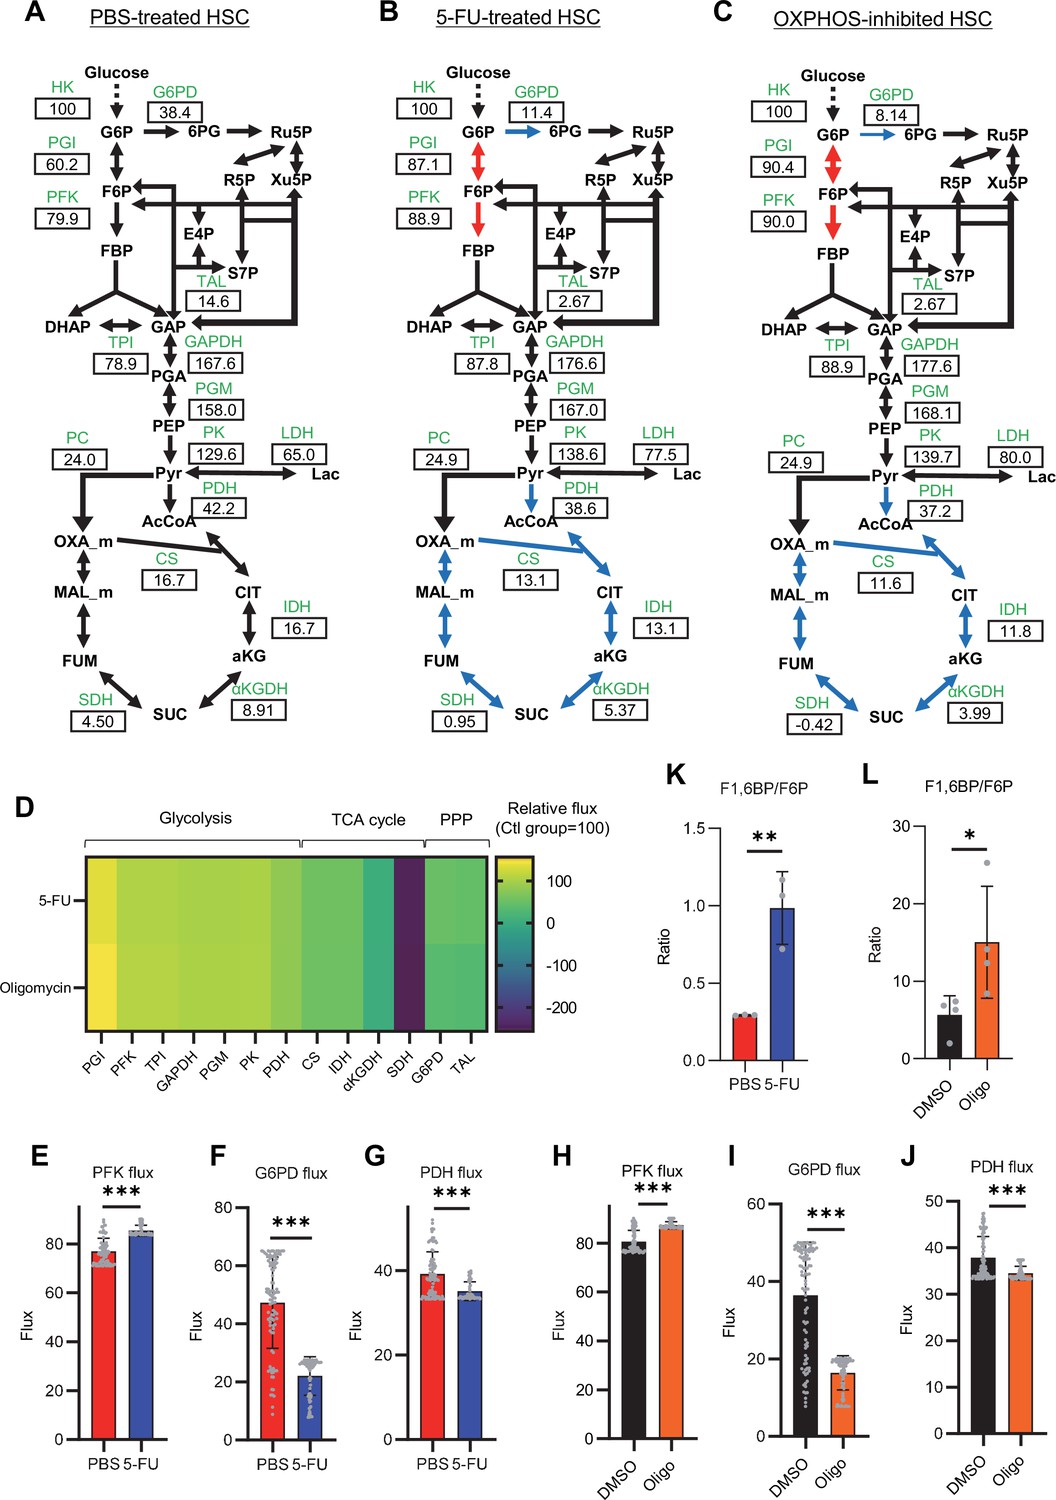
(A–C) Overview of quantitative 13C-MFA of PBS-treated HSCs (A), 5-FU-treated HSCs (B), and OXPHOS-inhibited HSCs (C). The representative net flux for each reaction with glucose uptake as 100 is shown in the squares below the catalytic enzymes for each reaction listed in green letters. Red arrows indicate reactions with particularly elevated fluxes and blue arrows indicate reactions with particularly decreased fluxes. (D) Heatmap of the relative flux of each enzyme in the 5-FU or oligomycin groups compared to that in the quiescent (Ctl) HSC (The metabolic flux of each enzyme in the Ctl group was standardized as 100.). (E–J) Fluxes due to reactions with PFK (E, H), G6PD (F, I), and PDH (G, J). Fluxes of HSCs derived from mice treated with 5-FU (blue bars) or PBS (red bars) (D–F) and of HSCs treated with DMSO (black bars) or oligomycin (orange bars) (G–I) are shown. Data is obtained from 100 simulations in OpenMebius, and flux data for each enzyme is displayed (Supplementary file 4). (K–L) Ratio of fructose 1,6-bisphosphate (F1,6BP) to fructose-6-phosphate (F6P) calculated from tracer experiments shown in Figure 1B and Figure 2B. Effects of 5-FU administration (K) or mitochondrial inhibition by oligomycin (L) are summarized. Data are shown as mean ± SD. * p≤0.05, ** p≤0.01, *** p≤0.001 as determined by Student’s t-test (E–L). Abbreviations: HK, hexokinase; PGI, glucose-6-phosphate isomerase; PFK, phosphofructokinase; TPI, triose phosphate isomerase; GAPDH, glyceraldehyde-3-phosphate dehydrogenase; PGM, phosphoglycerate mutase; PK, pyruvate kinase; LDH, lactate dehydrogenase; PC, pyruvate carboxylase; PDH, pyruvate dehydrogenase; CS; citrate synthase; IDH, isocitrate dehydrogenase; αKGDH, α-ketoglutaric acid dehydrogenase; SDH, succinate dehydrogenase; G6PD, glucose-6-phosphate dehydrogenase; TAL, transaldolase. See also Figure 3—figure supplements 1–2.
-
Figure 3—source data 1
Raw data for Figure 3D–L.
- https://cdn.elifesciences.org/articles/87674/elife-87674-fig3-data1-v2.xlsx
Figure 3—figure supplement 1
Quantitative 13C-MFA of HSCs under quiescence, proliferation, and OXPHOS inhibition.
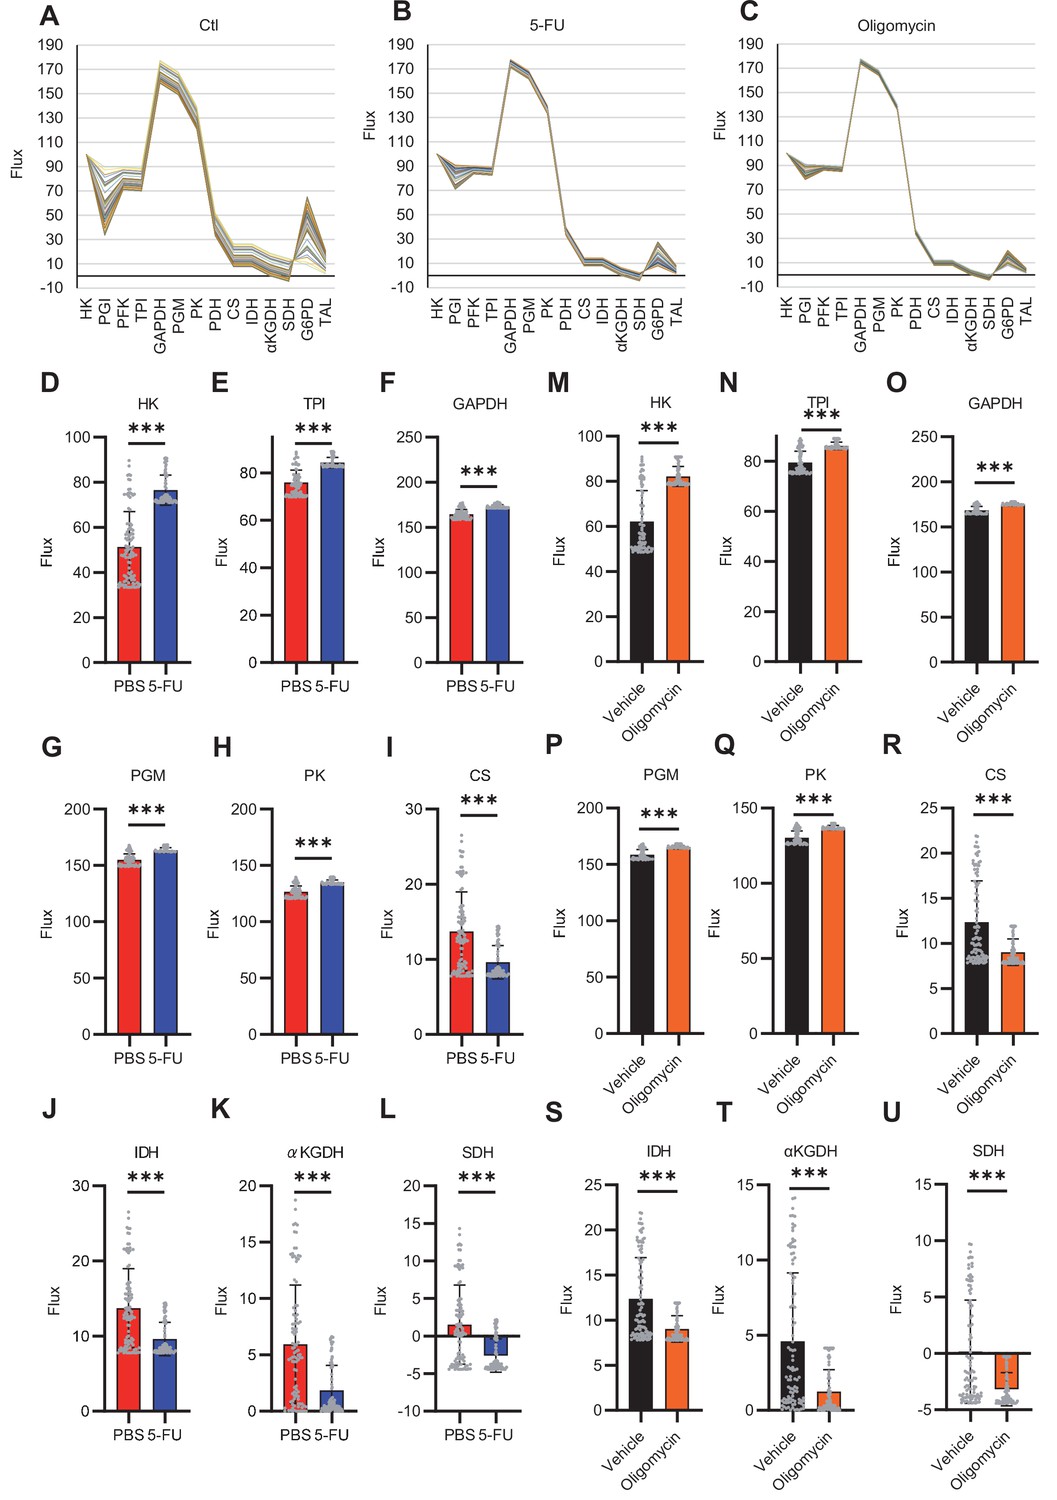
(A–C) Enzyme reaction flux values for each simulation (100 times in total) in PBS-treated (A), 5-FU-treated (B), and OXPHOS-inhibited HSCs (C). Flux values calculated in the same simulation are connected by lines; note the small variation in flux values calculated in different simulations in 5-FU-treated (B) or OXPHOS-inhibited HSCs (C) compared to that in PBS-treated HSCs (A). (D–U) Fluxes of each reaction determined using quantitative 13C-MFA in HSCs from mice treated with 5-FU (blue bars) or PBS (red bars) (D–L), or in HSCs after treatment with vehicle (black bars) or oligomycin (orange bars) (M–U). The net flux was calculated when the glucose uptake was set at 100. The name of the enzyme catalyzing each reaction is listed above the graph. Each gray dot represents the estimated flux obtained from 100 mathematical simulations. (See ‘Quantitative 13C-MFA with OpenMebius’ under ‘Materials and methods’ for more information.). Data are presented as mean ± SD. * p≤0.05, ** p≤0.01, *** p≤0.001 as determined using Student’s t-test (D–U). Abbreviations: HK, hexokinase; PGI, glucose-6-phosphate isomerase; PFK, phosphofructokinase; TPI, triose phosphate isomerase; GAPDH, glyceraldehyde-3-phosphate dehydrogenase; PGM, phosphoglycerate mutase; PK, pyruvate kinase; LDH, lactate dehydrogenase; PC, pyruvate carboxylase; PDH, pyruvate dehydrogenase; CS; citrate synthase; IDH, isocitrate dehydrogenase; αKGDH, α-ketoglutaric acid dehydrogenase; SDH, succinate dehydrogenase; G6PD, glucose-6-phosphate dehydrogenase; TAL, transaldolase.
-
Figure 3—figure supplement 1—source data 1
Raw data for Figure 3—figure supplement 1D–U.
- https://cdn.elifesciences.org/articles/87674/elife-87674-fig3-figsupp1-data1-v2.xlsx
Figure 3—figure supplement 2
Quantified metabolite pool in HSCs from PBS- or 5-FU-treated mice.
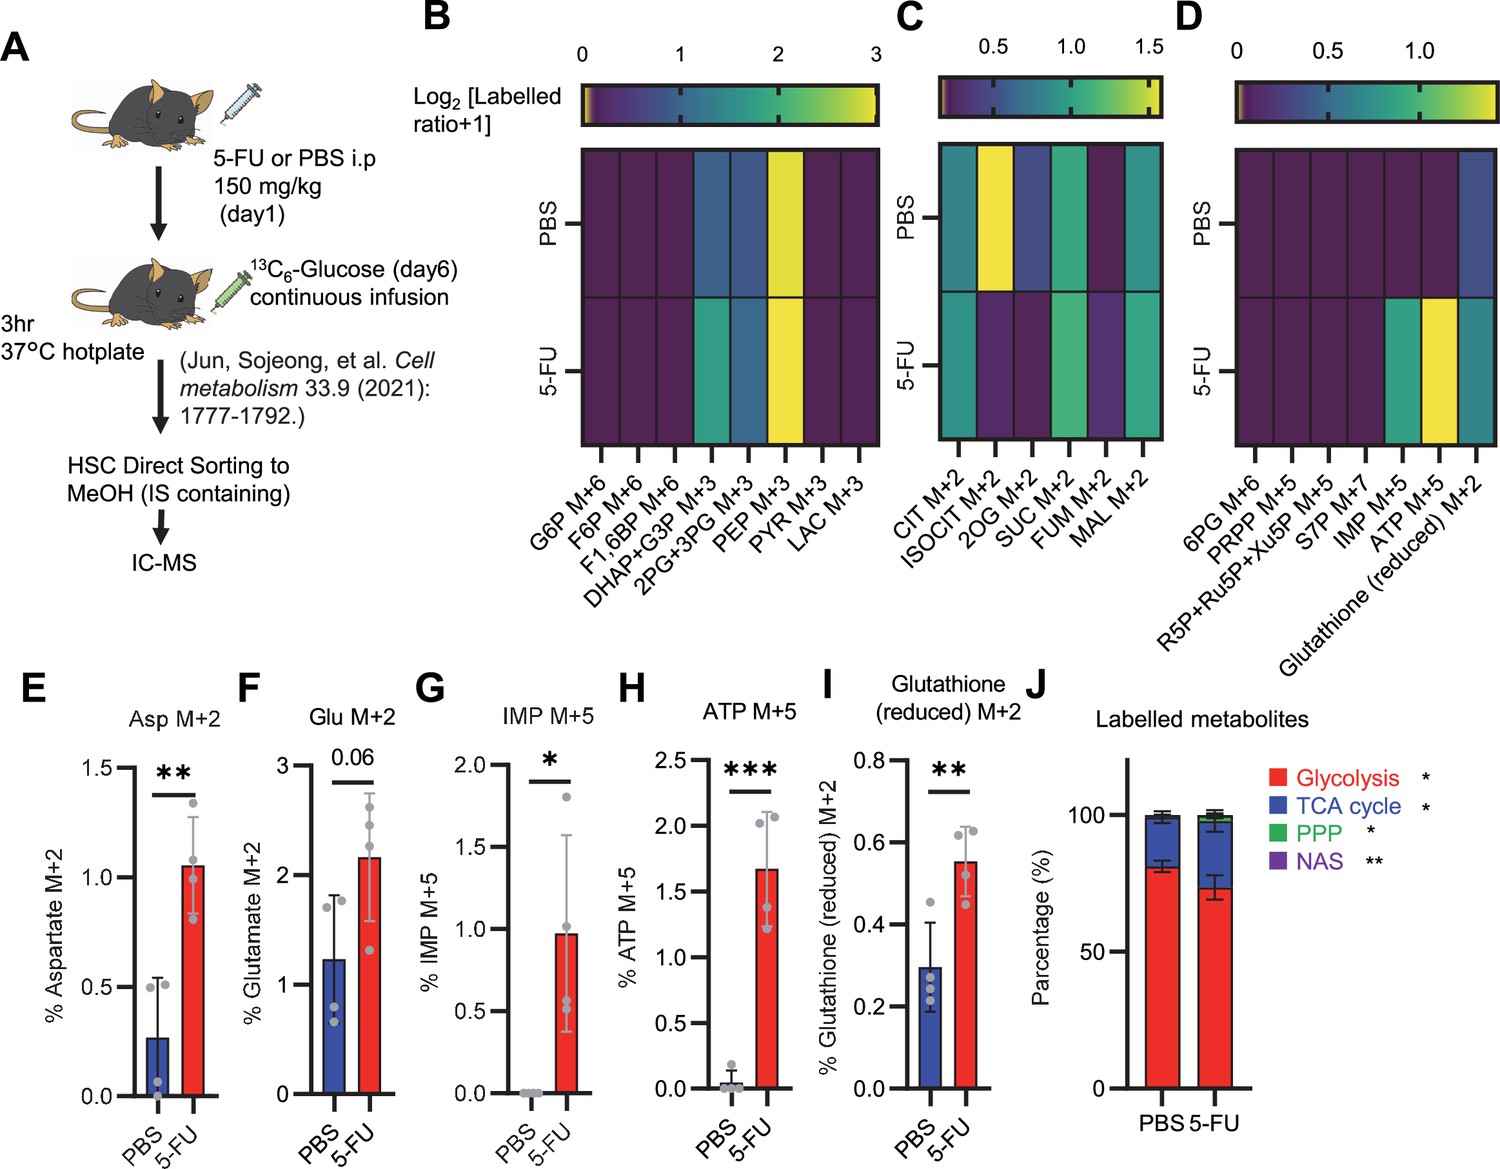
(A) Experimental schema. (B–D) Heat maps of the glycolytic system (B), TCA cycle (C), PPP and NAS and glutathione labeling rates (D). (E–I) Labeling rates of Asp M+2 (E), Glu M+2 (F), IMP M+5 (G), ATP M+5 (H), and reduced glutathione M+2 (I) in PBS- (blue bars) or 5-FU-treated HSCs (red bars). (J) Percentage of total 13C-labeled metabolite mass of glycolysis, TCA cycle, PPP, and NAS detected in PBS-treated or 5-FU-treated HSCs. HSCs derived from one or two mice in the PBS group and two or three mice in the 5-FU group were pooled. n=4 biological replicates for each group. (See ‘Preparation and storage of in vivo U-13C6-glucose tracer samples’ in ‘Materials and methods’ for details.) Data are presented as mean ± SD. * p≤0.05, ** p≤0.01, *** p≤0.001 as determined using Student’s t-test (E–J). Abbreviations: G6P, glucose-6-phosphate; F6P, fructose-6-phosphate; F1,6BP, fructose-1,6-bisphosphate; G3P, glycerol-3-phosphate; DHAP, dihydroxyacetone phosphate; 3 PG, 3-phosphoglycerate; 2 PG, 2-phosphoglycerate; PEP, phosphoenolpyruvate; PYR, pyruvate; LAC, lactate; CIT, citrate; ISOCIT, isocitrate; 2OG, 2-oxoglutarate; SUC, succinate; FUM, fumarate; MAL, malate; 6 PG, 6-phosphogluconate; Ru5P, ribulose-5-phosphate; Xu5P, xylulose-5-phosphate; R5P, ribose-5-phosphate; S7P, sedoheptulose-7-phosphate; PRPP, phosphoribosyl pyrophosphate; IMP, inosine monophosphate; ATP, adenosine triphosphate; Asp, Aspartic acid; Glu, Glutamate.
-
Figure 3—figure supplement 2—source data 1
Raw data for Figure 3—figure supplement 2B–J.
- https://cdn.elifesciences.org/articles/87674/elife-87674-fig3-figsupp2-data1-v2.xlsx
Figure 4 with 2 supplements
PFKFB3 activates the glycolytic system in proliferating HSCs.
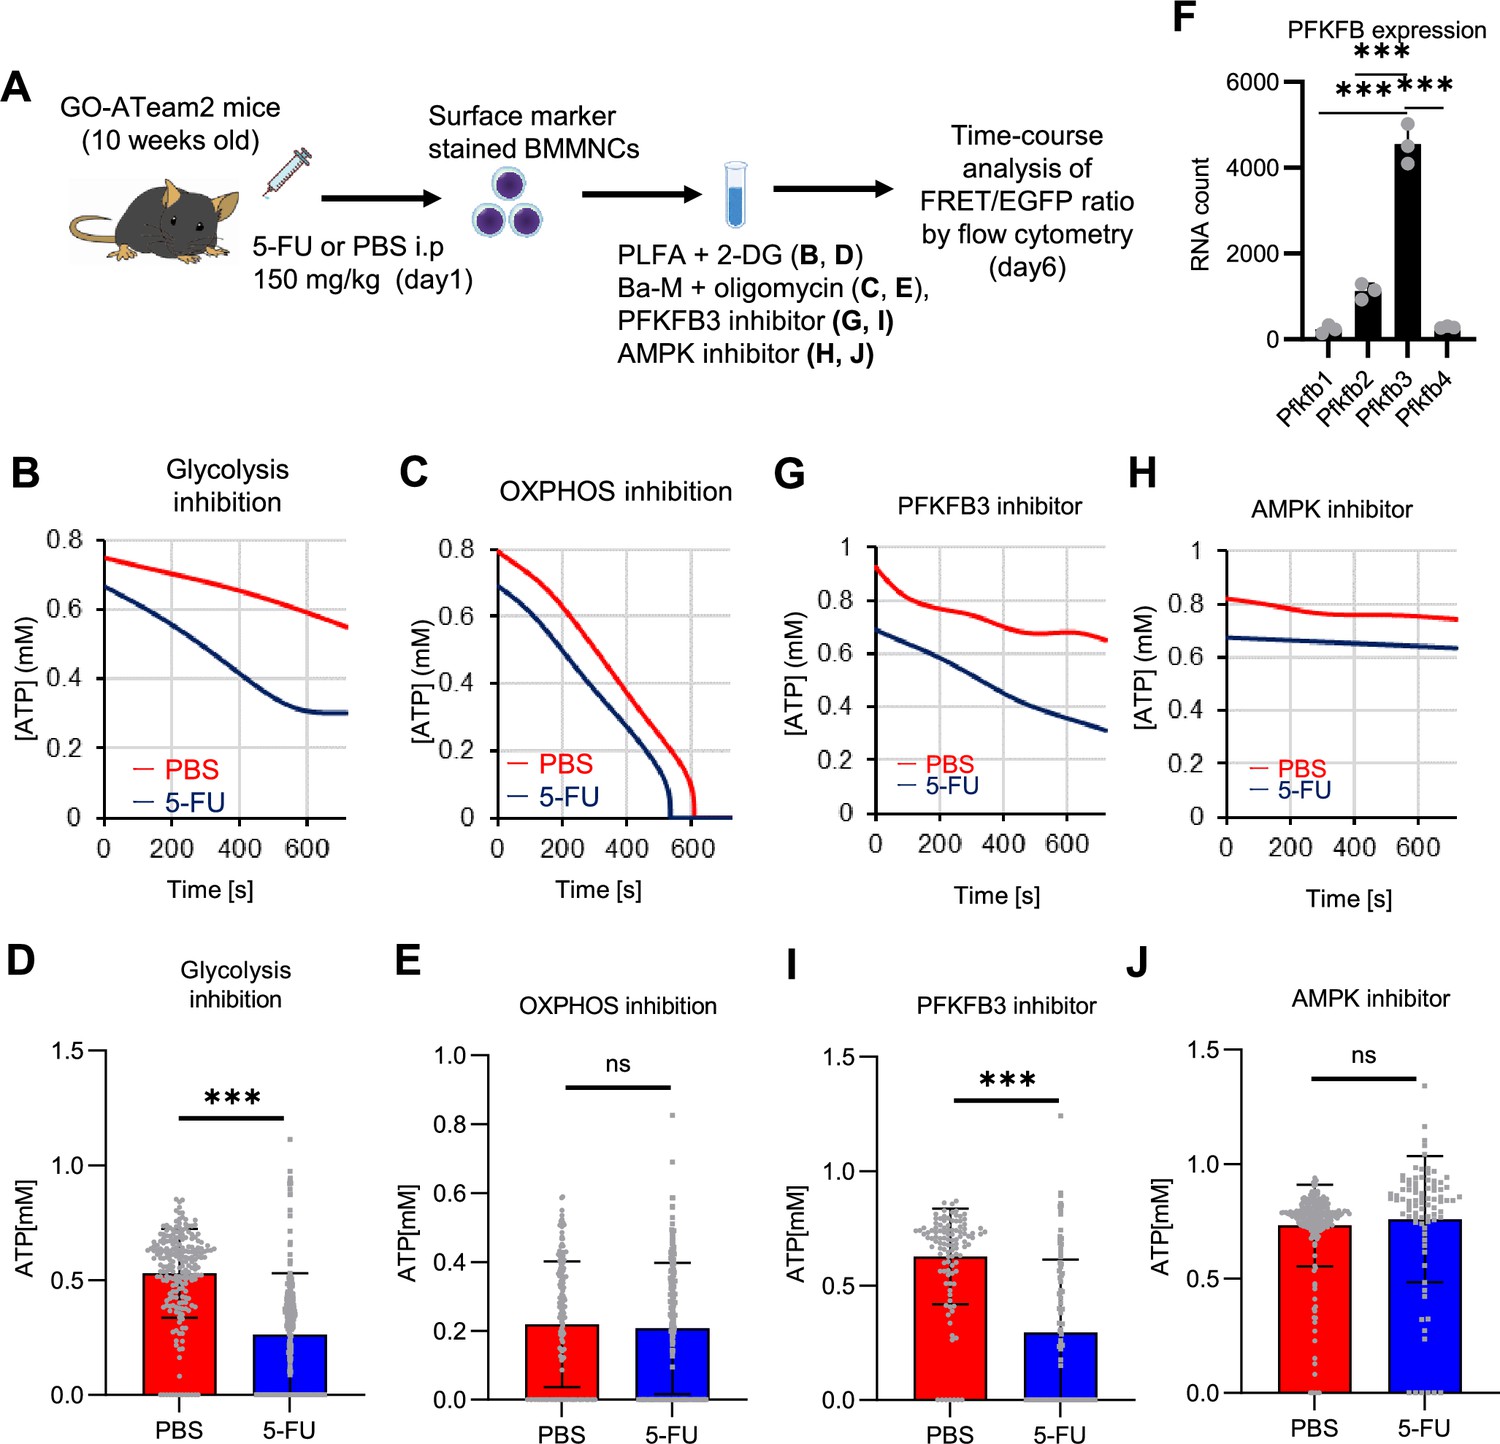
(A) Experimental design used to conduct real-time ATP analysis of HSCs treated with 5-FU or PBS. PLFA medium containing mitochondrial substrates (pyruvate, lactate, fatty acids, and amino acids) but no glucose, was used for experiments with 2-DG; Ba-M containing neither mitochondrial substrates nor glucose was used for experiments with oligomycin, PFKFB3 inhibitor, or AMPK inhibitor. (B–E) Results of real-time ATP analysis of PBS- (red) or 5-FU-treated (blue) HSCs after treatment with 2-DG (B, D), oligomycin (C, E). (F) Normalized mRNA counts of PFKFB isozymes based on the RNA sequencing of HSCs. (G-J) Results of real-time ATP analysis of PBS- (red) or 5-FU-treated (blue) HSCs after treatment with PFKFB3 inhibitor (G, I), or AMPK inhibitor (H, J). Bar graphs show corrected ATP concentrations for the last 2 min (D) of (B), 6–7 min (E) of (C), or the last 1 min (I, J) of (G, H) for PFKFB3 and AMPK inhibitors, respectively. Each group represents at least 60 cells. Data are representative results of pooled samples from three biological replicates. (see ‘Time-course analysis of FRET values’ in ‘Materials and methods’ for details of the correction method used to calculate ATP concentration.) Data are presented as mean ± SD. * p≤0.05, ** p≤0.01, *** p≤0.001 as determined by Student’s t-test (D, E, I, and J) or a one-way ANOVA followed by Tukey’s test (F). See also Figure 4—figure supplements 1–2.
-
Figure 4—source data 1
Raw data for Figure 4D–F, I and J.
- https://cdn.elifesciences.org/articles/87674/elife-87674-fig4-data1-v2.xlsx
Figure 4—figure supplement 1
Establishment of a real-time ATP concentration analysis system using GO-ATeam2.
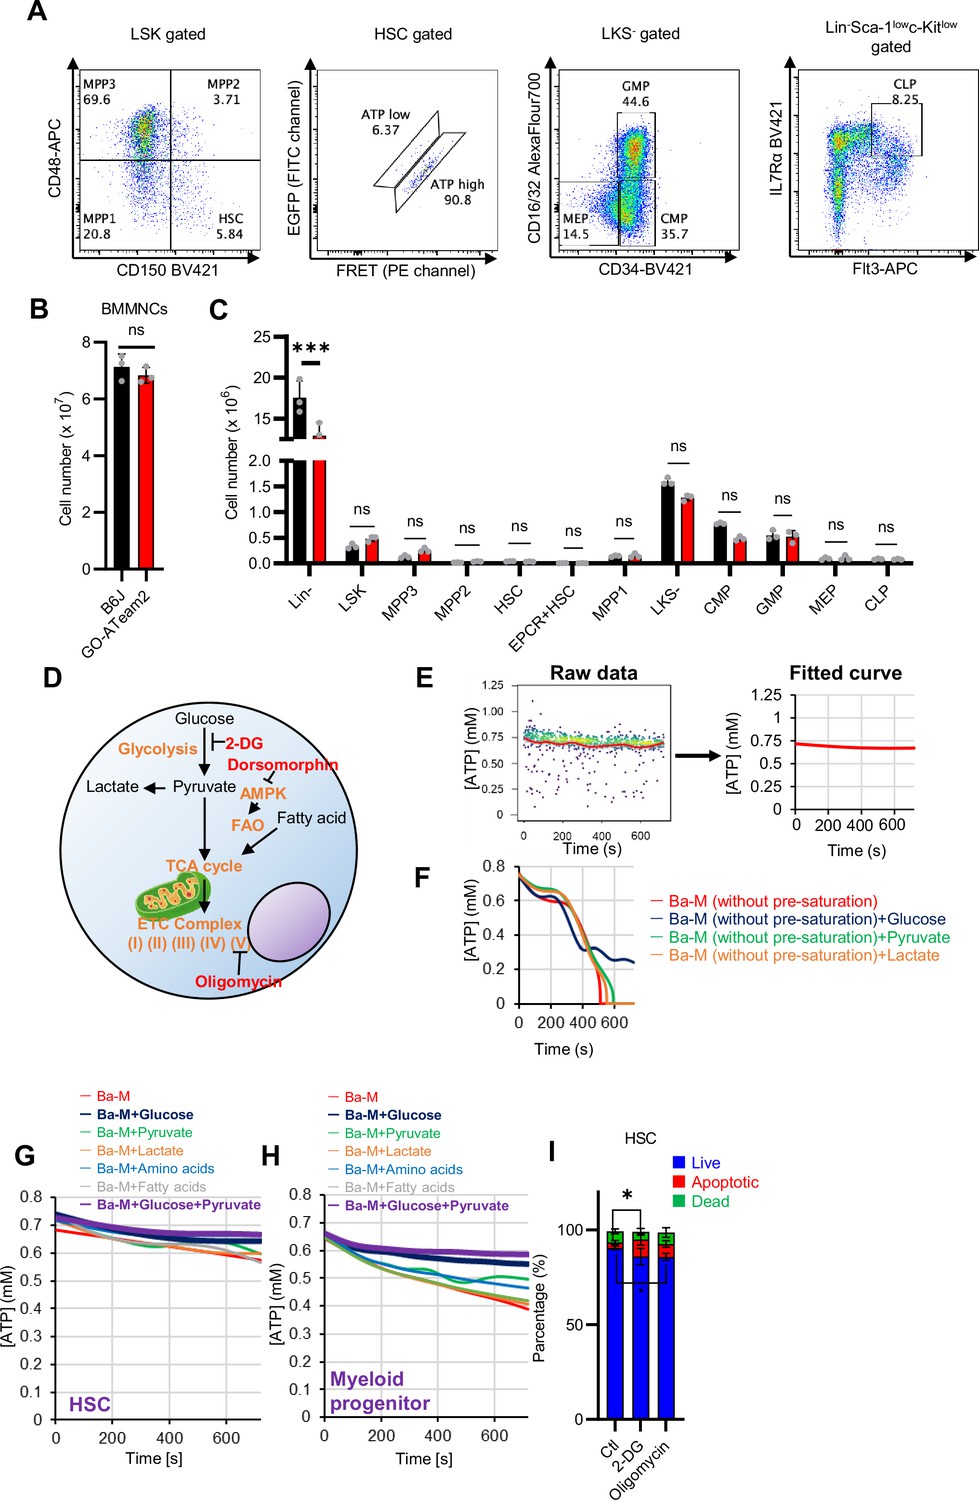
(A) Representative plot of HSPC fractions from GO-ATeam2 +mice. The identified fractions are shown at the top of the graph and the upper gating of that fraction is shown in parentheses. (B–C) Number of BMMNCs derived from C57BL/6J and GO-ATeam2 mice (B) and percentage of each fraction present (C). (D) Schematic diagram showing effects of key metabolic pathways and regulators (orange) and their inhibitors (red). (E) Transformation of time-course plot of ATP concentration in individual HSCs from GO-ATeam2 mice (left) to a planar curve after fitting (right). (F) Time-course analysis of ATP concentration in HSCs from GO-ATeam2 mice in basal medium (Ba-M) without pre-saturation plus various indicated additives. (G–H) Effects of indicated metabolites on ATP concentration of HSCs (G) or MyPs (H) in Ba-M. (I) Apoptosis assay results for HSCs exposed to 2-DG (50 mM) or oligomycin (1 µM) for 10 min. n=3 biological replicates. Data are presented as mean ± SD. * p≤0.05, ** p≤0.01, *** p≤0.001 as determined using Student’s t-test (B), two-way ANOVA with Sidak’s test (C), or one-way ANOVA followed by Tukey’s test (I).
-
Figure 4—figure supplement 1—source data 1
Raw data for Figure 4—figure supplement 1B, C and I.
- https://cdn.elifesciences.org/articles/87674/elife-87674-fig4-figsupp1-data1-v2.xlsx
Figure 4—figure supplement 2
FAO is not active in proliferating HSCs.
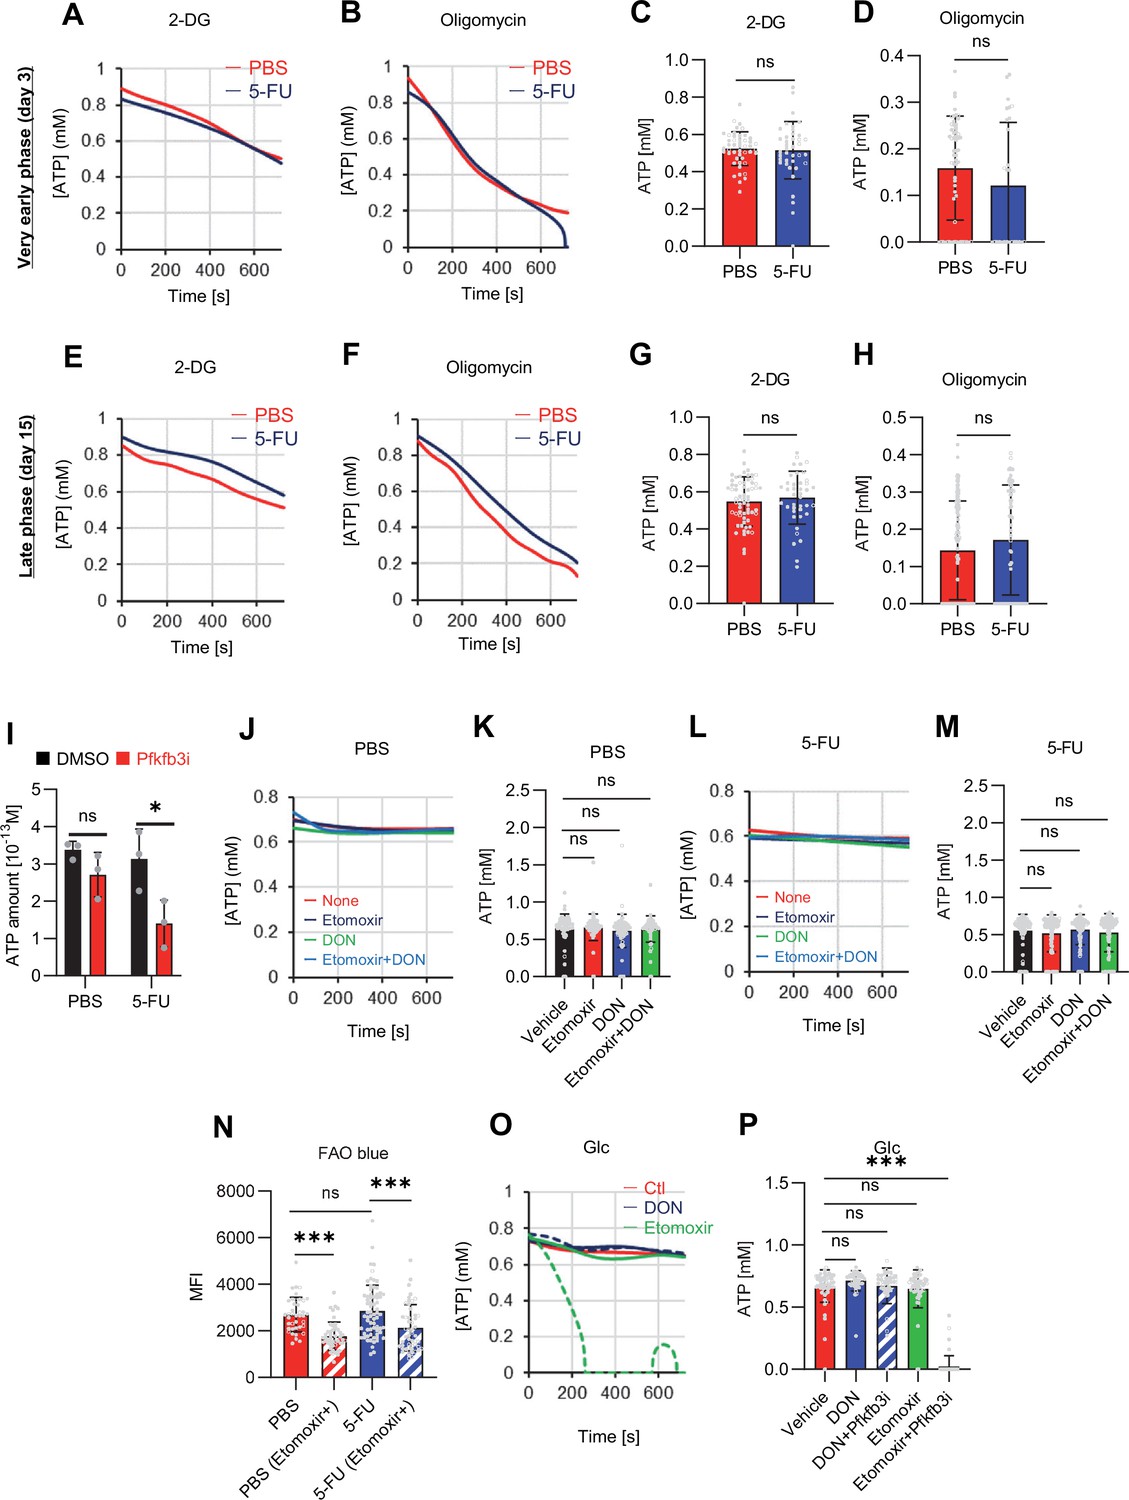
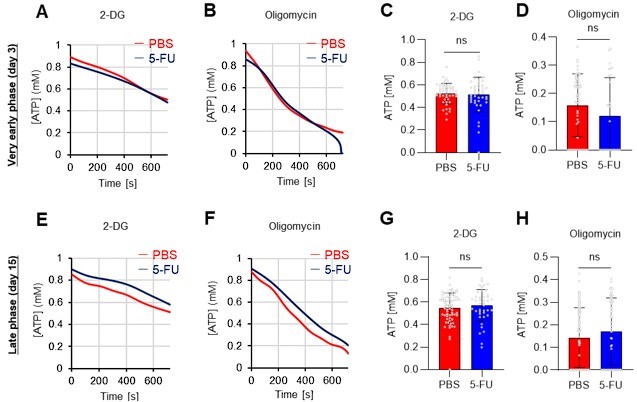
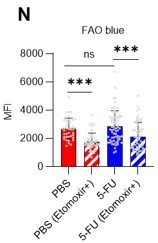
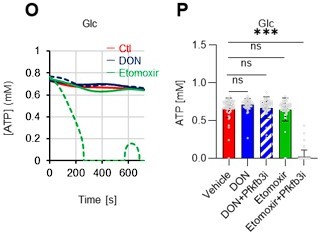
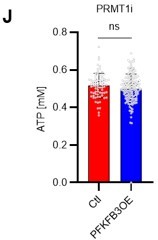
(A–H) Results of real-time ATP analysis of PBS- (red) or 5-FU-treated (blue) HSCs (two-days (A–D) or 14 days (E–H) after PBS/5-FU administration) after treatment with 2-DG (A, C, E, G) or oligomycin (B, D, F, H). Bar graphs show corrected ATP concentrations for the last 30 s of the analysis. Each group represents at least 28 cells. Data are representative results of pooled samples from two biological replicates. (see ‘Time-course analysis of FRET values’ in ‘Materials and methods’ for details on the correction method used to calculate the ATP concentration.) (I) Average amount of ATP per cell. The amount of ATP detected in the luciferase assay was divided by the number of HSCs used in the analysis. n=3 biological replicates for each group. (J–M) Results of the real-time ATP analysis of PBS- (J, K) or 5-FU-treated (L, M) HSCs after treatment with etomoxir (100 µM) and/or DON (2 mM). Bar graphs show corrected ATP concentrations for the last 1 min of the analysis. Each group represents at least 60 cells. Data are representative results of pooled samples from two biological replicates. (N) MFI of FAOBlue. As a negative control, HSCs were exposed to etomoxir (100 µM). (O–P) Effects of DMSO (Ctl, red line), DON (2 mM, blue lines), etomoxir (100 µM, green lines) on ATP in HSCs in the presence of 200 mg/dL glucose. Dashed lines are ATP concentrations with additional AZ PFKFB3 26. Data are presented as the mean ± SD. * p≤0.05, ** p≤0.01, *** p≤0.001 as determined using a Student’s t-test (C, D, G, H, and I), or one-way ANOVA followed by Tukey’s test (K, M, N, and P).
-
Figure 4—figure supplement 2—source data 1
Raw data for Figure 4—figure supplement 2C, D, G-I, K, M, N and P.
- https://cdn.elifesciences.org/articles/87674/elife-87674-fig4-figsupp2-data1-v2.xlsx
Figure 5 with 1 supplement
PFKFB3 accelerates glycolysis in HSCs under OXPHOS inhibition in an AMPK-dependent manner.
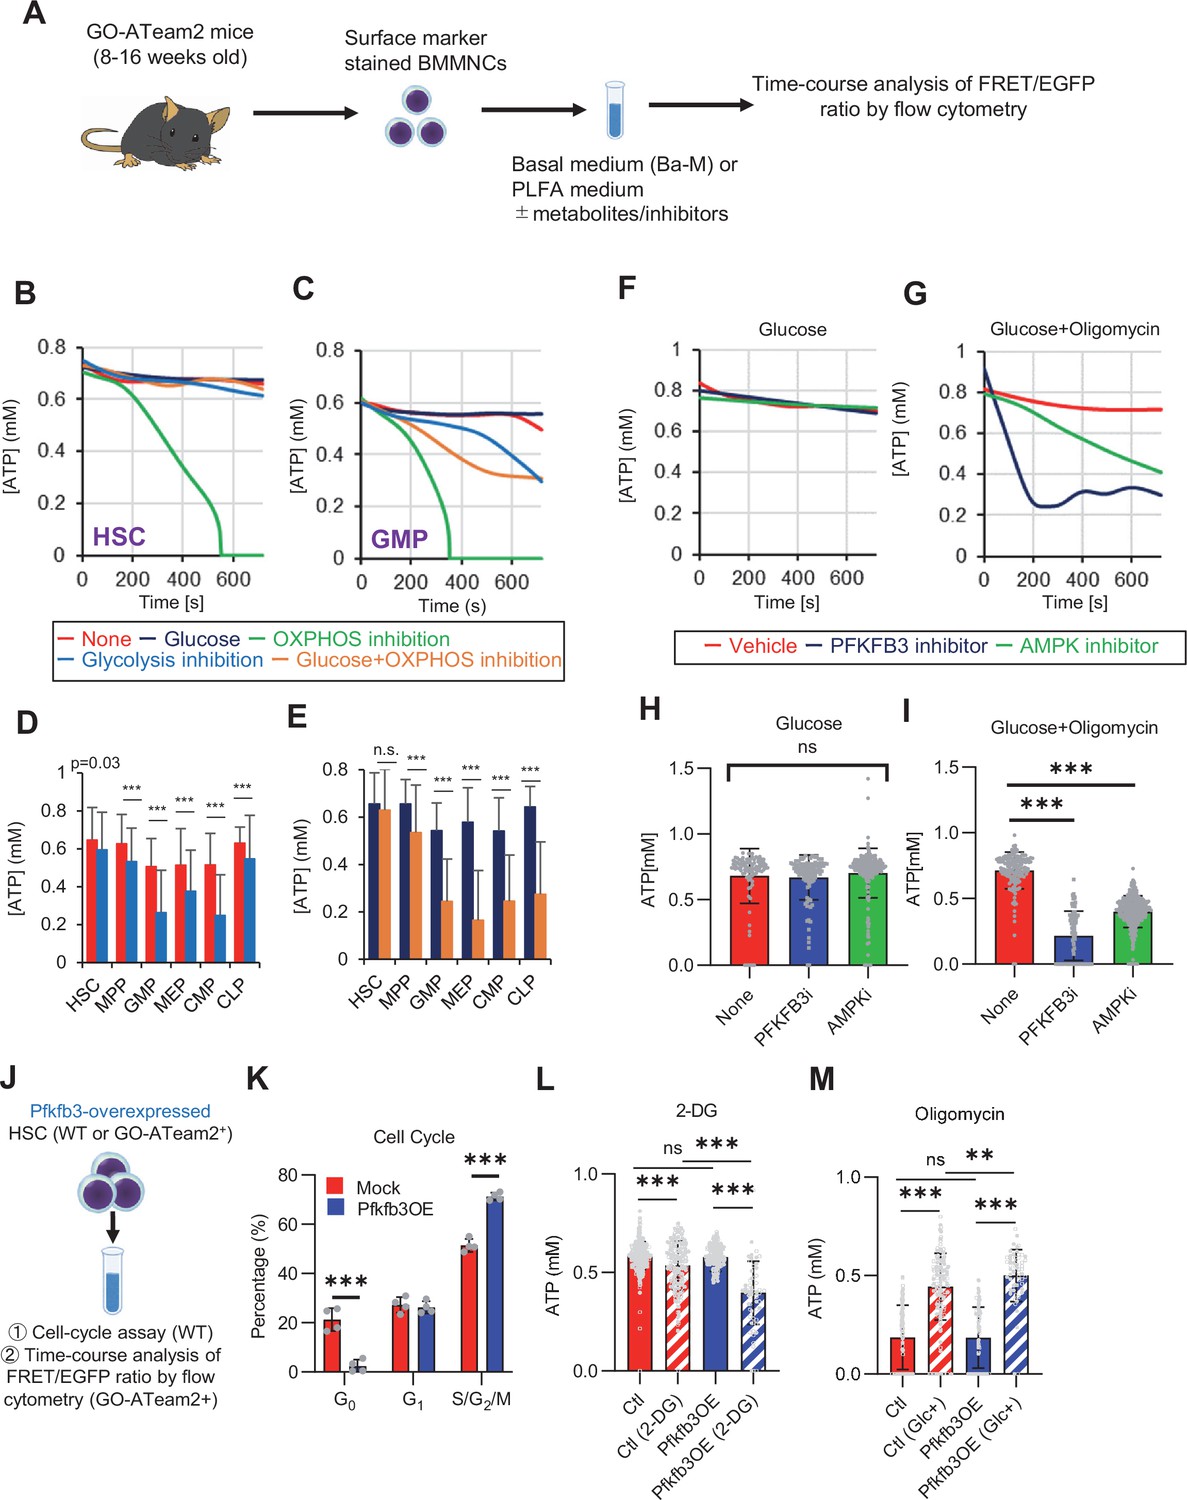
(A) Experimental design of real-time ATP analysis using GO-ATeam2 knock-in BMMNCs. Ba-M was used in experiments with oligomycin. For other experiments, PLFA medium was used. (B–C) Evaluation of factors affecting ATP concentration in HSCs (B) and GMPs (C) based on the GO-ATeam2 system. GO-ATeam2 knock-in BMMNCs were incubated with glucose, oligomycin, 2-DG, or glucose plus oligomycin, and the FRET/EGFP ratio was calculated. (D) ATP concentration in indicated stem/progenitor fractions in PLFA medium (red bars) alone or PLFA medium plus 2-DG (blue bars). ATP concentration for the last 2 min of the analysis time is shown. Data is summarized from (B, C) and Figure 5—figure supplement 1. Each group represents at least 110 cells. Data are representative results of pooled samples from three biological replicates. (E) ATP concentration in indicated stem/progenitor fractions in Ba-M plus glucose (dark blue bars) or Ba-M plus glucose and oligomycin (orange bars). ATP concentration for the last 1 min of the analysis period is shown. Data is summarized from (B, C) and Figure 5—figure supplement 1. Each group represents at least 43 cells. Data are representative results of pooled samples from three biological replicates. (F–I) Effects of PFKFB3 or AMPK inhibitors (PFKFB3i or AMPKi, respectively) on ATP concentration in HSCs from GO-ATeam2 mice in Ba-M plus glucose only (F) or Ba-M plus glucose and oligomycin (G). ATP concentrations for the last 1 min of the analysis period are shown in (H) and (I) for glucose only and glucose with oligomycin groups, respectively. Each group represents at least 90 cells. Data are representative results of pooled samples from three biological replicates. (J) Experimental schema for cell cycle assay and real-time ATP concentration analysis after overexpression of Pfkfb3. (K) Cell cycle status of Pfkfb3-overexpressing (Pfkfb3OE) and mock-transduced HSCs. (L–M) Effects of inhibitors on ATP concentration in Pfkfb3-overexpressing GO-ATeam2+ HSCs. Cells were exposed to vehicle or 2-DG (L), oligomycin in the presence or absence of glucose 12.5 mg/dL (M), and ATP concentrations for the last 2 min (L) or 1 min (M) of the analysis period were calculated. Data are representative results of pooled samples from three biological replicates. Data are presented as mean ± SD. * p≤0.05, ** p≤0.01, *** p≤0.001 as determined by Student’s t-test (D, E, and K) or one-way ANOVA followed by Tukey’s test (H, I, L, and M). See also Figure 5—figure supplement 1.
-
Figure 5—source data 1
Raw data for Figure 5D, E, H, I, K, L and M.
- https://cdn.elifesciences.org/articles/87674/elife-87674-fig5-data1-v2.xlsx
Figure 5—figure supplement 1

Steady-state PFKFB3 activity defines HSC and HPC metabolic kinetics and cell cycle.
(A–D) Evaluation of factors affecting ATP concentration in MPPs (A), MEPs (B), CMPs (C), and CLPs (D) based on the GO-ATeam2 system. GO-ATeam2-knock-in BMMNCs were incubated with glucose, oligomycin, 2-DG, or glucose plus oligomycin, and the FRET/EGFP ratio was calculated. (E) Effects of DMSO (Ctl, red line), oligomycin (1 µM, blue lines), FCCP (2 µM, green lines), and rotenone (1 µM, orange lines) on ATP in HSCs. Dashed lines are ATP concentrations with additional ddH2O and solid lines are ATP concentrations when 200 mg/dL glucose is added. (F) ATP concentration during the last 1 min in (E). Data are representative results for pooled samples of two biological replicates. (G) Effects of indicated concentrations of glucose (mg/dL) on ATP concentration in oligomycin-treated or control HSCs (left panel), or in MyPs (right panel) in PLFA medium. (H–K) Effects of inhibitors of PKM2 or LKB1 (PKM2i or LKB1i, respectively) on ATP concentration of HSCs from GO-ATeam2 mice in Ba-M with either glucose (Glc) or glucose plus oligomycin. ATP concentrations for the last 2 min of analysis time are summarized in (J) and (K), respectively. Each group represents at least 50 cells. Data are the result of one experiment. (L) Composition of adenine phosphates (AMP, ADP, and ATP) in HSCs treated with oligomycin (Oligo), or HSCs from 5-FU-treated mice (5-FU) and control HSCs (Ctl; no treatment or DMSO-treated). Data show results of tracer experiments shown in Figure 1 and Figure 2. (M–P) Effects of a PFKFB3 inhibitor (PFKFB3i) on ATP concentration in GMPs (M), MEPs (N), CMPs (O), or CLPs (P) from GO-ATeam2 mice in Ba-M treated with glucose (Glc) plus vehicle (red lines), glucose plus PFKFB3i (blue lines), or glucose plus oligomycin plus PFKFB3i (green lines). (Q) ATP concentration in indicated progenitor fractions in Ba-M with vehicle (red bars) or PFKFB3 inhibitor (dark blue bars). ATP concentrations for the last 1 min of the analysis period are shown. Data is summarized from (M–P) . Each group represents at least 350 cells. Data are representative results of pooled samples from two biological replicates. (R–U) Effects of inhibitors on ATP concentration in Pfkfb3-overexpressing GO-ATeam2+ HSCs. Cells were exposed to vehicle (Ctl) (R), 2-DG (S), oligomycin (T), or glucose 12.5 mg/dL and oligomycin (U). Data are representative results of pooled samples from two biological replicates. Data are presented as mean ± SD. * p≤0.05, ** p≤0.01, *** p≤0.001 as determined using Student’s t-test (F, Q) or one-way ANOVA followed by Tukey’s test (J–L).
-
Figure 5—figure supplement 1—source data 1
Raw data for Figure 5—figure supplement 1F,J-L, Q.
- https://cdn.elifesciences.org/articles/87674/elife-87674-fig5-figsupp1-data1-v2.xlsx
Figure 6 with 1 supplement
PFKFB3 methylation by PRMT1 enables ATP production by cell-cycling HSCs.
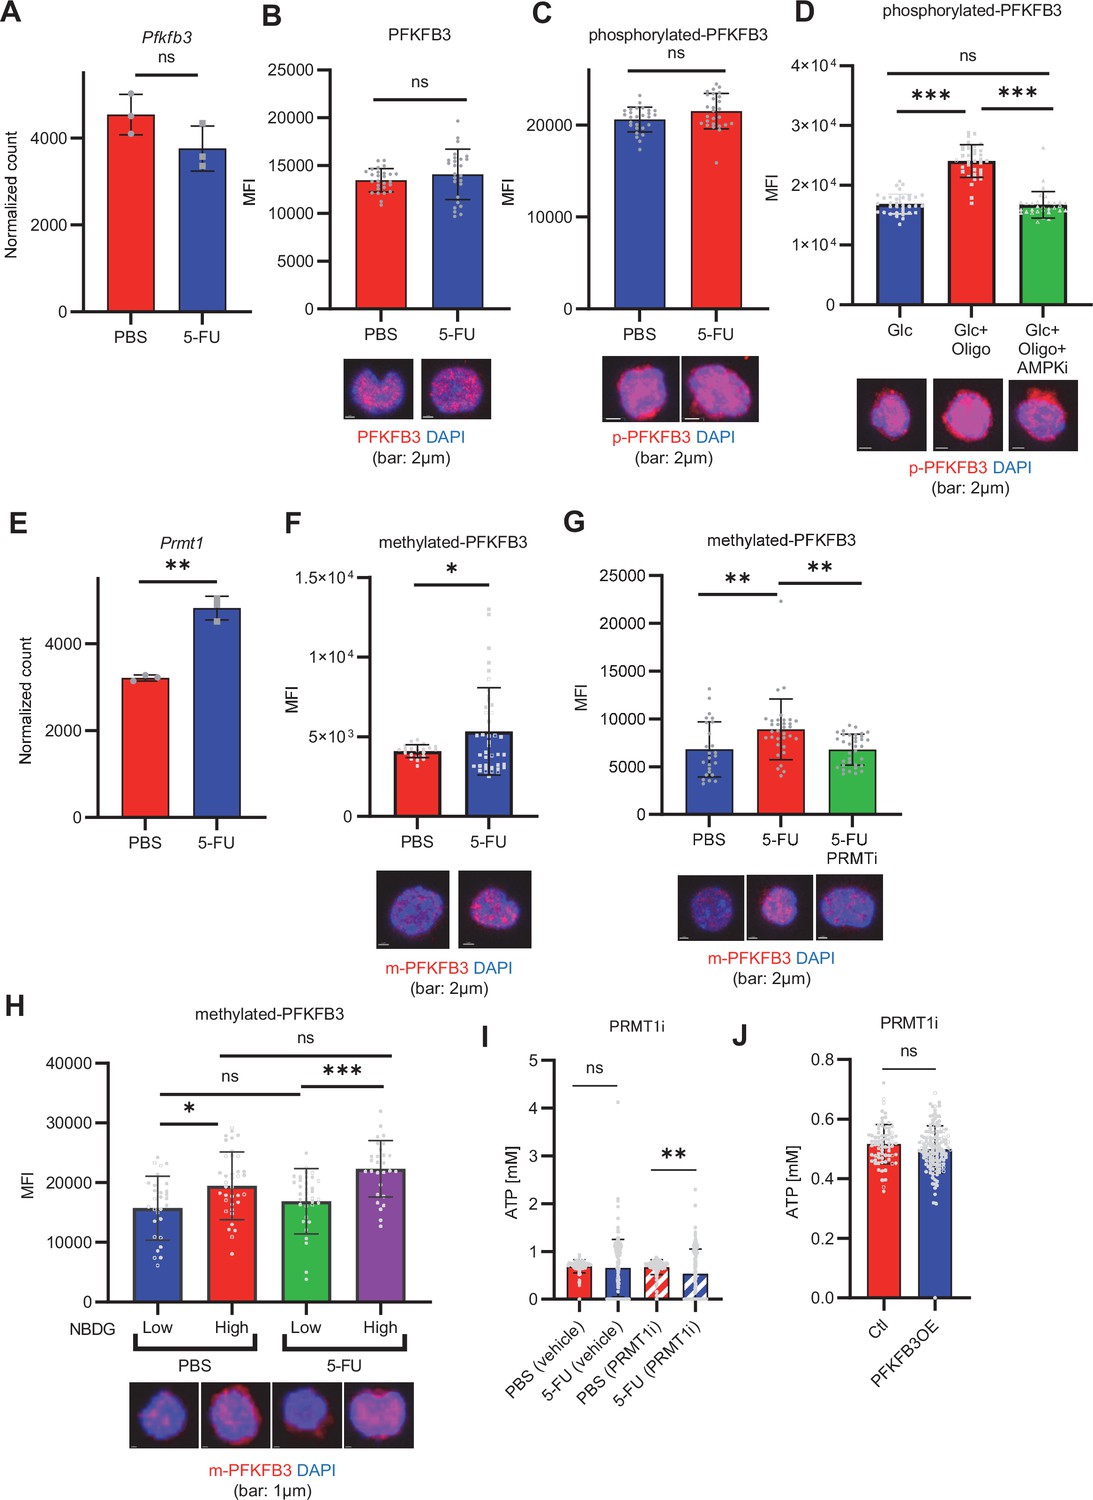
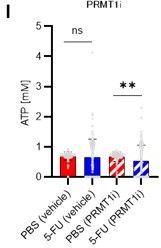
(A) Normalized Pfkfb3 mRNA counts based on RNA sequencing of PBS-treated (red) or 5-FU-treated (blue) HSCs. Data are representative results of pooled samples from three biological replicates. Data were extracted from the same pooled samples as in Figure 4J and Figure 6—figure supplement 1. (B) Quantification of mean fluorescence intensity (MFI) of PFKFB3 protein in PBS- or 5-FU-treated HSCs. The lower part of the graph shows representative images of immunocytochemistry of PFKFB3 in each group. n=26–27 single HSCs for each group. The data are representative results from two independent experiments. (C) Quantification of MFI of phosphorylated-PFKFB3 (p-PFKFB3) protein in PBS- or 5-FU-treated HSCs. The lower part of the graph shows representative images of immunocytochemistry of p-PFKFB3 in each group. n=27 single HSCs for each group. The data are representative results from two independent experiments. (D) Quantification of MFI of p-PFKFB3 in HSCs treated with glucose (200 mg/dL); glucose plus oligomycin (1 µM); and glucose, oligomycin, and dorsomorphin (100 µM) for 5 min. The lower part of the graph shows representative images of immunocytochemistry of p-PFKFB3 in each group. n=32–36 for each group. The data are representative results from two independent experiments. (E) Normalized Prmt1 mRNA counts based on RNA sequencing of PBS-treated (red) or 5-FU-treated (blue) HSCs. Data are representative results of pooled samples from three biological replicates. (F) MFI quantification of methylated-PFKFB3 (m-PFKFB3) in PBS- or 5-FU-treated HSCs. The lower part of the graph shows representative images of immunocytochemistry of m-PFKFB3 in each group. n=23–41 for each group. The data are representative results from three independent experiments. (G) Quantification of MFI of m-PFKFB3 in PBS- or 5-FU-treated HSCs or 5-FU-treated HSCs after 15 min treatment with a PRMT1 inhibitor (90 μg/mL GSK3368715); n=25–35 single HSCs for each group. The lower part of the graph shows representative images showing immunocytochemistry of m-PFKFB3. Data represent a single experiment. (H) Quantitation of m-PFKFB3 in NBDG-positive or -negative HSCs in mice treated with PBS or 5-FU. The lower part of the graph shows representative images of immunocytochemistry of m-PFKFB3 in each group. n=28–41 for each group. The data are representative results from two independent experiments. (I) Corrected ATP levels in PBS- (red) or 5-FU-treated (blue) HSCs 15 min after treatment with vehicle or a PRMT1 inhibitor (90 µg/mL GSK3368715). Each group represents at least 101 cells. Data are representative results of pooled samples of two biological replicates. (see ‘Time-course analysis of FRET values’ in ‘Materials and methods’ for details of the correction method used to calculate ATP concentration.) (J) ATP concentration in mock-transduced (Ctl) or Pfkfb3-overexpressed (OE) HSCs after treatment with the PRMT1 inhibitor (90 µg/mL GSK3368715). ATP concentration for the last 1 min of the analysis period is shown. Data are presented as mean ± SD. * p≤0.05, ** p≤0.01, *** p≤0.001 as determined by Student’s t-test (A-C, E-F, and I-J) or one-way ANOVA followed by Tukey’s test (D, G, and H). See also Figure 6—figure supplement 1.
-
Figure 6—source data 1
Raw data for Figure 6A–J.
- https://cdn.elifesciences.org/articles/87674/elife-87674-fig6-data1-v2.xlsx
Figure 6—figure supplement 1

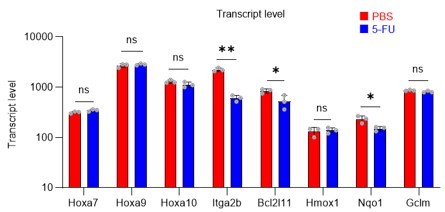
Gene expression related to Prmt1 in proliferating HSCs.
Data are presented as the mean ± SD. * p≤0.05, ** p≤0.01, *** p≤0.001 as determined using a Student’s t-test.
-
Figure 6—figure supplement 1—source data 1
Raw data for Figure 6—figure supplement 1.
- https://cdn.elifesciences.org/articles/87674/elife-87674-fig6-figsupp1-data1-v2.xlsx
Figure 7 with 1 supplement
PFKFB3 maintains HSC function under proliferative stress.
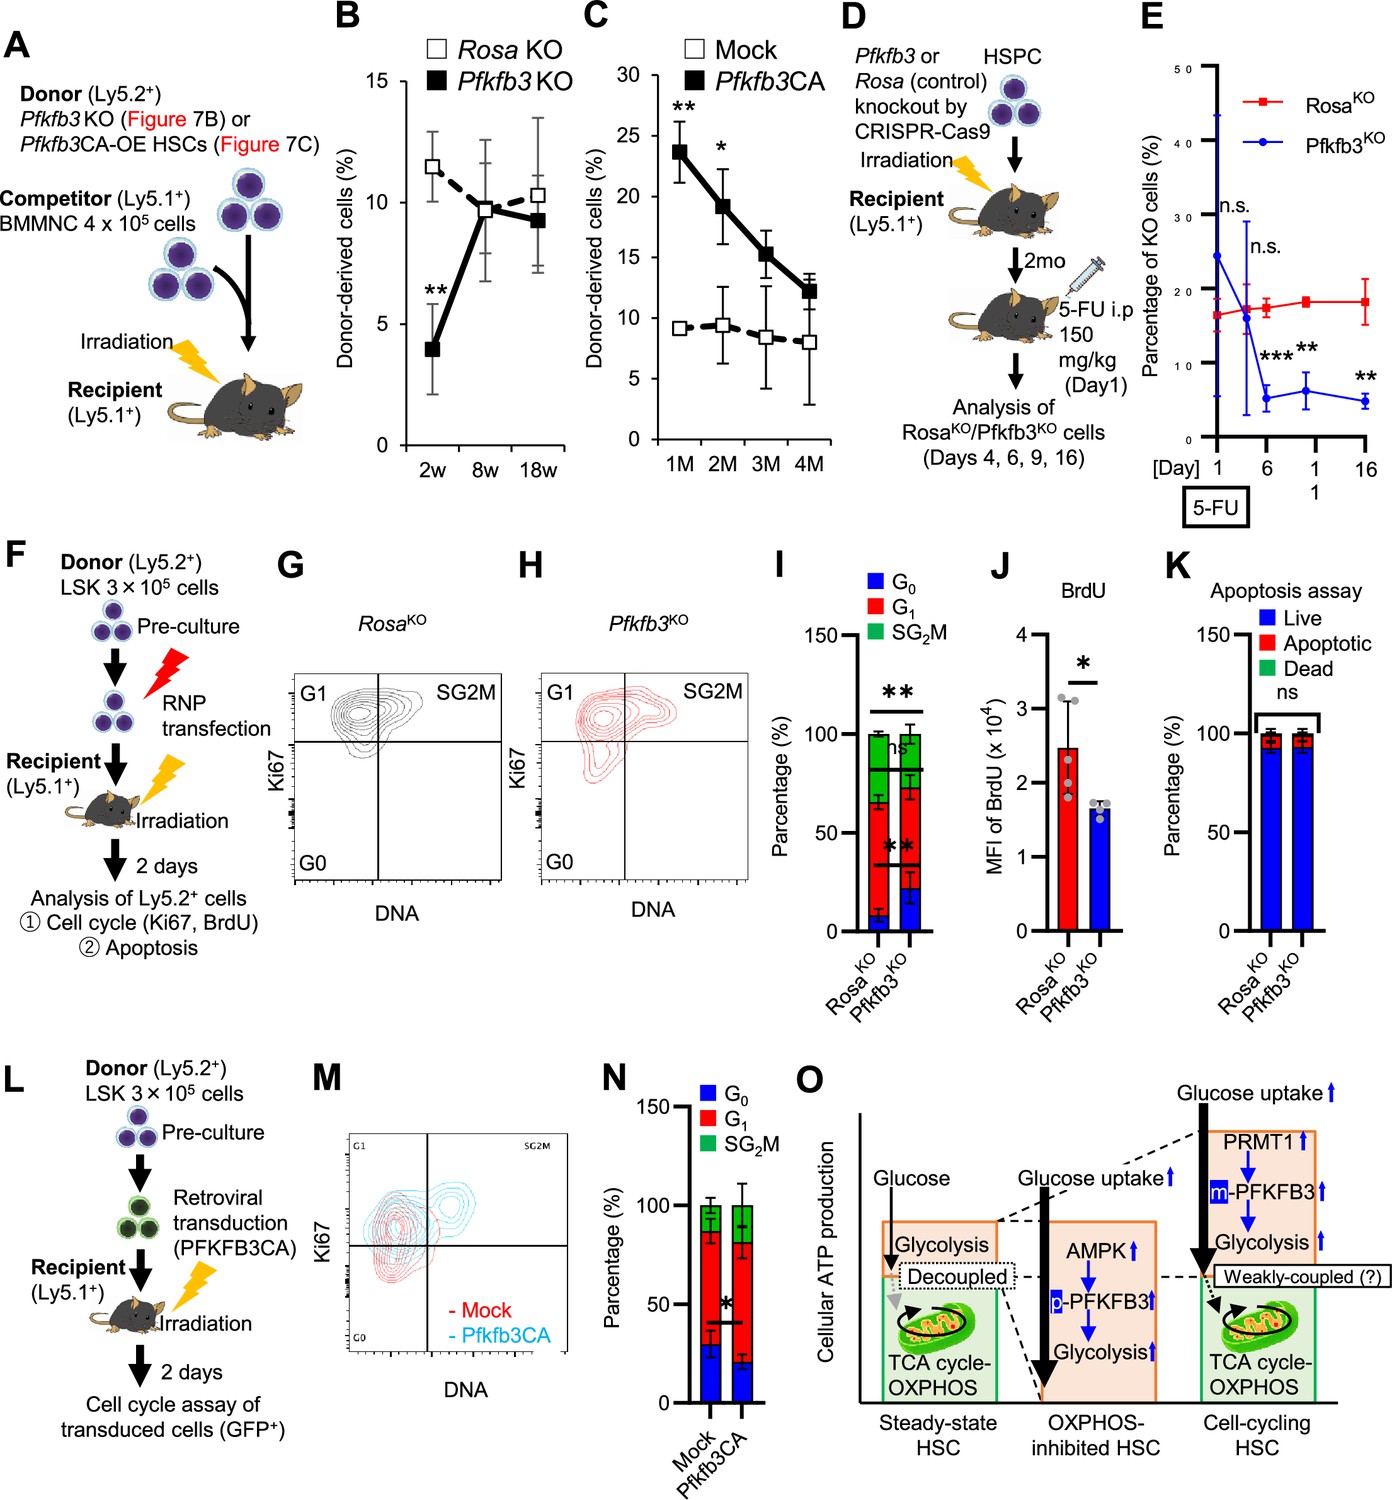
(A–C) Transplant analysis of Pfkfb3-KO or Pfkfb3CA-overexpressing HSCs. Experimental design (A). PB chimerism of donor-derived cells at 4 months post-transplant. Pfkfb3-KO group, n=6; Rosa26-KO group, n=4; (B) Pfkfb3 group, n=5; pMY-IRES-GFP group, n=4. (C) The data are representative results from two independent experiments. (D–E) 5-FU administration after bone marrow reconstruction with Pfkfb3- or Rosa26-KO HSPCs. Experimental schema (D). Behavior of the Pfkfb3- or Rosa26-KO cells in PB after 5-FU administration (E). n=5 for each group. (F–K) Cell cycle analysis and apoptosis assay of Pfkfb3- or Rosa26-KO HSPCs on day 2 post-BMT. Experimental schema (F). Representative plots of Ki67/Hoechst33432 staining of Rosa26-KO (G) or Pfkfb3-KO (H) HSPCs and summary of analysis (I); summary of in vivo BrdU labeling assay (J). Apoptosis assay results (K). n=4–5 biological replicates for each group. (L–N) Cell cycle analysis of Pfkfb3CA or Mock-overexpressing HSPCs on day 2 after BMT. Experimental Schema (L). Representative plot of Ki67/Hoechst33432 staining for both groups (M) and summary of analysis (N). n=5 biological replicates for each group. (O) Models showing ATP production and regulation in quiescent, OXPHOS-inhibited, and cell-cycling HSCs. Note that the GO-ATeam2 system identified plastic acceleration of glycolysis by PFKFB3 in response to different types of stress maintains ATP levels. Data are presented as mean ± SD. * p≤0.05, ** p≤0.01, *** p≤0.001 as determined by Student’s t-test (B, C, E, I-K, and N). See also Figure 7—figure supplement 1.
-
Figure 7—source data 1
Raw data for Figure 7B, C, E, I–K and N.
- https://cdn.elifesciences.org/articles/87674/elife-87674-fig7-data1-v2.xlsx
Figure 7—figure supplement 1
PFKFB3 contributes to HSC proliferation and differentiation in vitro.
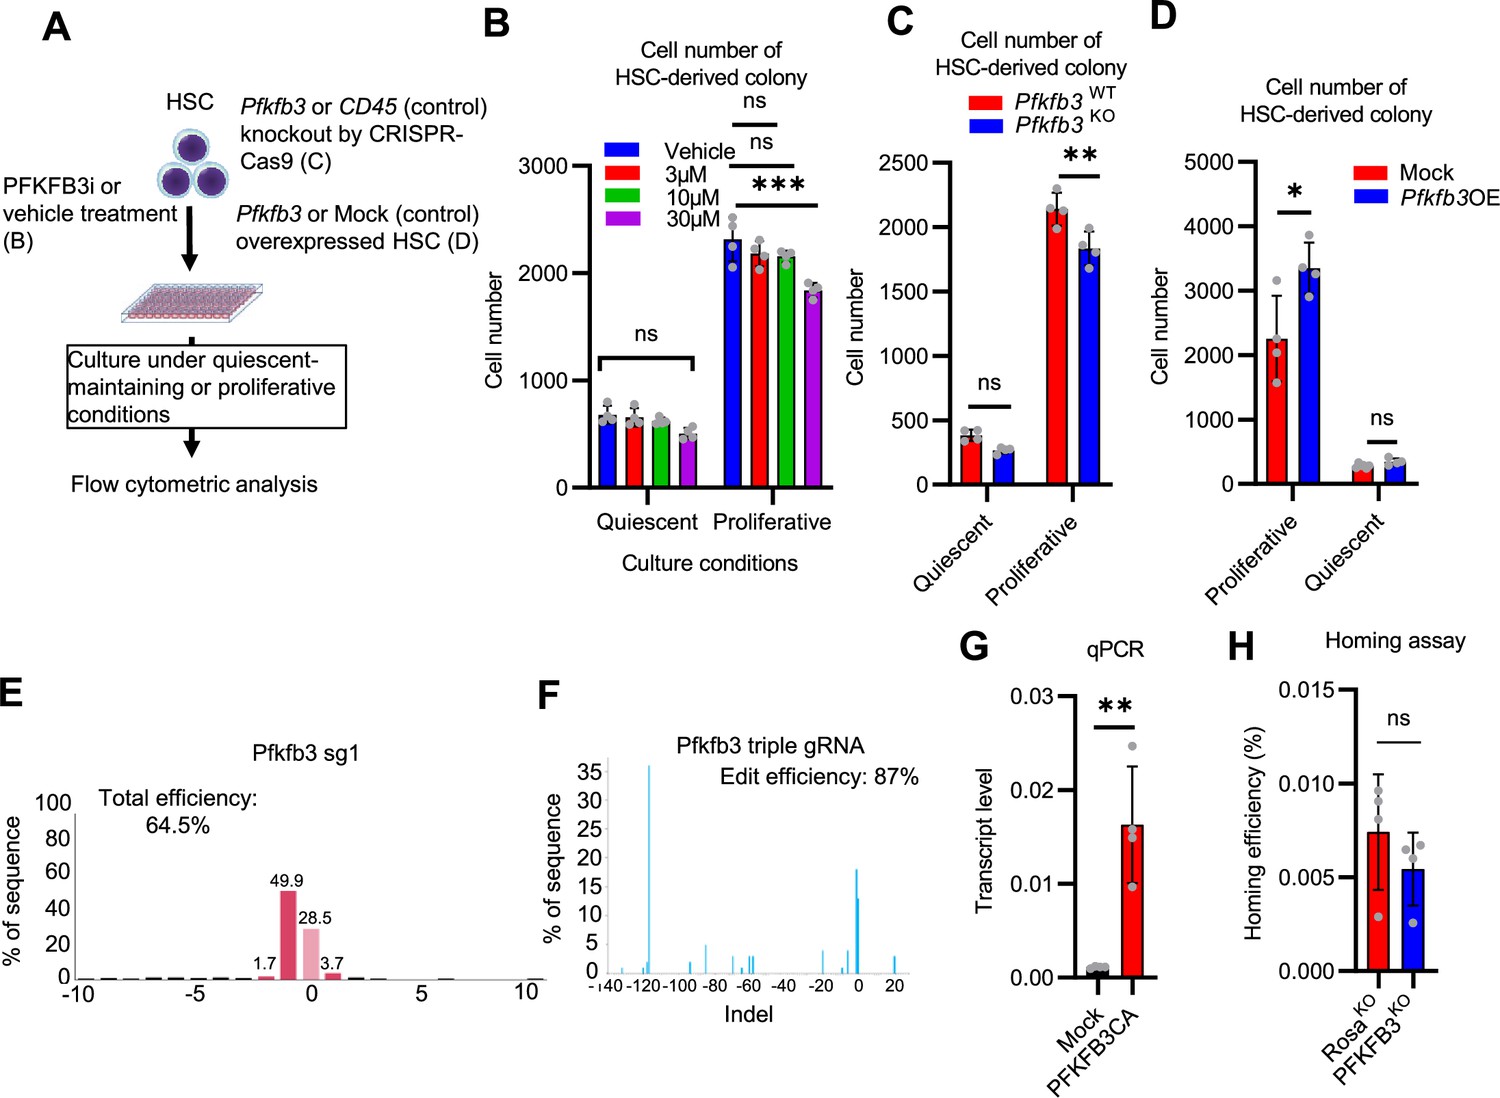
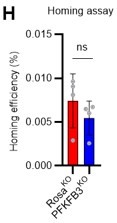
(A–D) Effects of in vitro PFKFB3 inhibition, KO, or overexpression on HSCs. Experimental design (A). Number of cells in an HSC-derived colony following exposure to a PFKFB3 inhibitor (PFKFB3i) at indicated concentrations (B) or after Pfkfb3 KO by CRISPR-Cas9 (C); n=4 technical replicates for each group. Control groups were vehicle (DMSO)-treated (B) or CD45 KO (C). (D) In vitro effect of Pfkfb3-overexpression on HSCs. Number of cells in Pfkfb3-overexpressing or mock (pMY-IRES-GFP)-transduced HSC-derived colonies; n=4 technical replicates for each group. (B–D) are representative results of two or three independent experiments. (E–F) KO efficiency evaluated by sgRNA (E) or triple gRNA (F). The indel spectrum (horizontal axis) and the percentage of each indel (vertical axis) are shown. (G) qPCR results for Pfkfb3 expression in validation experiments of mock- (black bar) or Pfkfb3CA- (red bar) overexpression. n=4 technical replicates for each group. (H) Analysis of the homing efficiency and GFP+ blood cells in recipient BM 16 hr after the transplantation of Rosa26- or Pfkfb3-KO GFP+ HSPCs. Data are presented as mean ± SD. * p≤0.05, ** p≤0.01, *** p≤0.001 as determined using Student’s t-test (C, D, G, and H) or one-way ANOVA followed by Tukey’s test (B).
-
Figure 7—figure supplement 1—source data 1
Raw data for Figure 7—figure supplement 1B–D, G, H.
- https://cdn.elifesciences.org/articles/87674/elife-87674-fig7-figsupp1-data1-v2.xlsx
Author response image 1

Author response image 2
Author response image 3
Author response image 4

Author response image 5
Author response image 6
Author response image 7

Author response image 8

Author response image 9
Author response image 10
Author response image 11
Author response image 12
Author response image 13

Author response image 14
Author response image 15

Author response image 16
Author response image 17

Author response image 18

Author response image 19

Author response image 20
Author response image 21
Author response image 22

Author response image 23

Author response image 24

Author response image 25
Author response image 26

Author response image 27

Author response image 28
Tables
Appendix 1—key resources table
| Reagent type (species) or resource | Designation | Source or reference | Identifiers | Additional information |
|---|---|---|---|---|
| Strain, strain background (Mus musculus, male and female) | C57BL/6JJmsSlc Ly5.2+ | Japan SLC (Shizuoka, Japan) | N/A | |
| Strain, strain background (Mus musculus, male and female) | C57BL/6J-Ly5.1 | CLEA Japan (Shizuoka, Japan) | N/A | Utilized for hematopoietic cell transplantation studies to distinguish donor and recipient cells. |
| Strain, strain background (Mus musculus, male and female) | GO-ATeam2 mice | Generated in Yamamoto laboratory | N/A | Used for ATP analysis |
| Strain, strain background (Mus musculus, male and female) | Ubc-GFP mice | The Jackson Laboratory | Stock No: 007076 | |
| Strain, strain background (Mus musculus, male and female) | mVenus-p27K- mice | Provided by Kitamura Laboratory | N/A | Used for cell cycle analysis |
| Antibody | Anti-mouse CD4-PerCP-Cy5.5 (clone: RM4-5, rat monoclonal) | TONBO biosciences | Cat# 65–0042 U100; RRID:AB_2621876 | (0.5 µL, 1 µL, or 2 µL/mouse) |
| Antibody | Anti-mouse CD8a-PerCP-Cy5.5 (clone: 53–6.7, rat monoclonal) | TONBO biosciences | Cat# 65–0081 U100; RRID:AB_2621882 | (0.5 µL, 1 µL, or 2 µL/mouse) |
| Antibody | Anti-mouse B220-PerCP-Cy5.5 (clone: RA3-6B2, rat monoclonal) | TONBO biosciences | Cat# 65–0452 U100; RRID:AB_2621892 | (0.5 µL, 1 µL, or 2 µL/mouse) |
| Antibody | Anti-mouse B220-APC (clone: RA3-6B2, rat monoclonal) | BioLegend | Cat# 103212; RRID:AB_312997 | (0.5 µL, 1 µL, or 2 µL/mouse) |
| Antibody | Anti-mouse Ter-119-PerCP-Cy5.5 (clone: TER-119, rat monoclonal) | TONBO biosciences | Cat# 65–5921 U100 | (0.5 µL, 1 µL, or 2 µL/mouse) |
| Antibody | Anti-mouse Gr1 (Ly-6G/6 C)-PerCP-Cy5.5 (clone: RB6-8C5, rat monoclonal) | BioLegend | Cat# 108428; RRID:AB_893558 | (0.5 µL, 1 µL, or 2 µL/mouse) |
| Antibody | Anti-mouse Gr1-PE-Cy7 (clone: RB6-8C5, rat monoclonal) | TONBO biosciences | Cat# 60–5931 U100; RRID:AB_2621870 | (0.5 µL, 1 µL, or 2 µL/mouse) |
| Antibody | Anti-mouse Mac1 (CD11b)-PerCP-Cy5.5 (clone: M1/70, rat monoclonal) | TONBO biosciences | Cat# 65–0112 U100; RRID:AB_2621885 | (0.5 µL, 1 µL, or 2 µL/mouse) |
| Antibody | Anti-mouse Mac1-PE-Cy7 (clone: M1/70, rat monoclonal) | TONBO biosciences | Cat# 60–0112 U100; RRID:AB_2621836 | (0.5 µL, 1 µL, or 2 µL/mouse) |
| Antibody | Anti-mouse CD45.1-PE (clone: A20, mouse monoclonal) | BD biosciences | Cat# 553776; RRID:AB_395044 | (1 µL/mouse) |
| Antibody | Anti-mouse CD45.1-Alexa Fluor700 (clone: A20, mouse monoclonal) | BioLegend | Cat# 110724; RRID:AB_493733 | (1 µL/mouse) |
| Antibody | Anti-mouse CD45.2-FITC (clone: 104, mouse monoclonal) | BD biosciences | Cat# 553772; RRID:AB_395041 | (1 µL/mouse) |
| Antibody | Anti-mouse Sca-1 (Ly-6A/E)-PE-Cy7 (clone: E13-161.7, rat monoclonal) | BioLegend | Cat# 122514; RRID:AB_756199 | (0.5 µL, 1 µL, or 2 µL/mouse) |
| Antibody | Anti-mouse c-Kit (CD117)-APC-Cy7 (clone: 2B8, rat monoclonal) | BioLegend | Cat# 105826; RRID:AB_1626278 | (0.5 µL, 1 µL, or 2 µL/mouse) |
| Antibody | CD117 MicroBeads Mouse | Miltenyi Biotec | Cat# 130-091-224 | (1:5) |
| Antibody | Anti-mouse CD150-PE (clone: TC15-12F12.2, rat monoclonal) | BioLegend | Cat# 115904; RRID:AB_313683 | (0.5 µL, 1 µL, or 2 µL/mouse) |
| Antibody | Anti-mouse CD150-BV421 (clone: TC15-12F12.2, rat monoclonal) | BioLegend | Cat# 115926; RRID:AB_2562190 | (0.5 µL, 1 µL, or 2 µL/mouse) |
| Antibody | Anti-mouse CD150-APC (clone: TC15-12F12.2, armenian hamster monoclonal) | BioLegend | Cat# 115910; RRID:AB_493460 | (0.5 µL, 1 µL, or 2 µL/mouse) |
| Antibody | Anti-mouse CD48-FITC (clone: HM48-1, armenian hamster monoclonal) | BioLegend | Cat# 103404; RRID:AB_313019 | (0.5 µL, 1 µL, or 2 µL/mouse) |
| Antibody | Anti-mouse CD48-APC (clone: HM48-1, qrmenian hamster monoclonal) | BioLegend | Cat# 103411; RRID:AB_571996 | (0.5 µL, 1 µL, or 2 µL/mouse) |
| Antibody | Anti-mouse CD48-BV510 (clone: HM48-1, armenian hamster monoclonal) | BD biosciences | Cat# 563536 | (0.5 µL, 1 µL, or 2 µL/mouse) |
| Antibody | Anti-mouse CD48-Alexa Fluor700 (clone: HM48-1, armenian hamster monoclonal) | BioLegend | Cat# 103426; RRID:AB_10612754 | (0.5 µL, 1 µL, or 2 µL/mouse) |
| Antibody | Anti-mouse CD41-APC (clone: MWReg30, rat monoclonal) | BioLegend | Cat# 133914; RRID:AB_11125581 | (0.5 µL, 1 µL, or 2 µL/mouse) |
| Antibody | Anti-CD34-BV421 (clone: RAM34, rat monoclonal) | BD biosciences | Cat# 562608; RRID:AB_11154576 | (0.5 µL, 1 µL, or 2 µL/mouse) |
| Antibody | Anti-CD34-FITC (clone: RAM34, rat monoclonal) | Invitrogen | Cat# 11-0341-82; RRID:AB_465021 | (0.5 µL, 1 µL, or 2 µL/mouse) |
| Antibody | Anti-Flt3 (CD135)-APC (clone: A2F10, rat monoclonal) | BioLegend | Cat# 135310; RRID:AB_2107050 | (0.5 µL, 1 µL, or 2 µL/mouse) |
| Antibody | Anti-CD127 (IL-7Rα) (clone: A7R34, rat monoclonal) | BioLegend | Cat# 135023; RRID:AB_10897948 | (0.5 µL, 1 µL, or 2 µL/mouse) |
| Antibody | Anti-CD201 (EPCR)-PE (clone: RCR-16, rat monoclonal) | BioLegend | Cat# 141504; RRID:AB_10899579 | (0.5 µL, 1 µL, or 2 µL/mouse) |
| Antibody | Anti-Ki67-Alexa Fluor555 (clone: B56, mouse monoclonal) | BD biosciences | Cat# 558617 | (10 µL/sample) |
| Antibody | Anti-Ki67 Monoclonal Antibody (SolA15), eFluor 660, eBioscience (Clone: SolA15, mouse monoclonal) | Invitrogen | Cat# 50-5698-82; RRID:AB_2574235 | (10 µL/sample) |
| Antibody | Fc-block (anti-mouse CD16/32) (clone: 2.4-G2, rat monoclonal) | BD biosciences | Cat# 553142; RRID:AB_394657 | (2 µL/mouse) |
| Antibody | Anti-CD16/CD32 Monoclonal Antibody (93), Alexa Fluor 700 (clone: 93, rat monoclonal) | Invitrogen | Cat# 56-0161-82; RRID:AB_493994 | (2 µL/mouse) |
| Antibody | Phospho-Rb (Ser807/811) (D20B12) XP (rabbit monoclonal) | Cell Signaling Technology | Cat# 8516 | (1:200) |
| Antibody | Anti-human CD8-APC (clone: SK1, mouse monoclonal) | Biolegend | Cat# 344721; RRID:AB_2075390 | (1 µL/sample) |
| Antibody | Recombinant anti-PFKFB3 antibody (rabbit monoclonal) | Abcam | Cat# ab181861 | (1:100) |
| Antibody | Anti-PFK2 (Ser467) antibody (rabbit polyclonal) | Bioss | Cat# bs-3331R | (1:100) |
| Antibody | Recombinant anti-methyl-PFKFB3 antibody (rabbit polyclonal) | Obtained from Takehiro Yamamoto at Keio University DOI: 10.1038/ncomms4480 | N/A | (1:100) |
| Gene (Mus musculus) | Pfkfb3 | This paper | N/A | Details are as described in Methods |
| Gene (Mus musculus) | Pfkfb3CA | This paper | N/A | Details are as described in Methods |
| Recombinant DNA reagent | pMYs-IRES-GFP | Obtained from Toshio Kitamura at IMUST | N/A | Used as backbone vector for gene overexpression |
| Recombinant DNA reagent | pMYs-IRES-human CD8 | Obtained from Go Nagamatsu at Kyushu University | N/A | Used as backbone vector for gene overexpression |
| Recombinant DNA reagent | Pfkfb3-knockout gRNA (s) | Custom made in lab or purchased from Synthego, Inc. | N/A | Details are as described in Methods |
| Recombinant DNA reagent | Rosa-knockout gRNA | Custom made in lab | N/A | Details are as described in Methods |
| Recombinant DNA reagent | CD45-knockout gRNA | Custom made in lab | N/A | Details are as described in Methods |
| Chemical compound, drug | IST | Thermo Fisher Scientific | Cat# 41400–045 | |
| Chemical compound, drug | Penicilin | Meiji Seika | PGLD755 | |
| Chemical compound, drug | Streptomycin sulfate | Meiji Seika | SSDN1013 | |
| Chemical compound, drug | Sodium selenite | Nacalai Tesque | Cat# 11707–04 | |
| Chemical compound, drug | Fetal bovine serum | Biowest | Cat# S1820-500 | |
| Chemical compound, drug | Fetal bovine serum | Thermo Fisher Scientific | Cat# 10270–106 | |
| Chemical compound, drug | Bovine serum albumin | Sigma Aldrich | Cat# A4503-50G/100 G | |
| Chemical compound, drug | 2-mercapto ethanol (2-ME) 1000 x | Life Technologies | Cat# 21985–023 | |
| Chemical compound, drug | Thymidine | Tokyo Chemical Industry Co., Ltd. | Cat# T0233 | |
| Chemical compound, drug | RPMI 1640 Amino Acids Solution (50×) | Sigma Aldrich | Cat# R7131 | |
| Chemical compound, drug | MEM Vitamin Solution (100×) | Sigma Aldrich | Cat# M6895 | |
| Chemical compound, drug | L-glutamine | Sigma Aldrich | Cat# G8540 | |
| Chemical compound, drug | L-alanine | Sigma Aldrich | Cat# A7469 | |
| Chemical compound, drug | L-Serine | Sigma Aldrich | Cat# S4311 | |
| Chemical compound, drug | D(+)-Glucose | Wako | Cat# 049–31165 | |
| Chemical compound, drug | 13C-glucose | Sigma Aldrich | Cat# 389374 | |
| Chemical compound, drug | 2-NBDG | Cayman Chemical | Cat# 11046 | |
| Chemical compound, drug | Cytochalasin B | Wako | Cat# 030–17551 | |
| Chemical compound, drug | Phloretin | TCI chemicals | Cat# P1966 | |
| Chemical compound, drug | 2-morpholinoethanesulfonic acid | Wako | Cat# 341–01622 | |
| Chemical compound, drug | methionine sulfone | Alfa Aesar | Cat# A17027 | |
| Chemical compound, drug | Sodium L-lactate | Sigma Aldrich | Cat# L7022 | |
| Chemical compound, drug | Cholesterol Lipid Concentrate (250 X) | Gibco | Cat# 12531018 | |
| Chemical compound, drug | 100mM-Sodium Pyruvate Solution | Nacalai tesque | Cat# 06977–34 | |
| Chemical compound, drug | Sodium Hydroxide | Wako | Cat# 194–18865 | |
| Chemical compound, drug | 5-fluorouracil | Kyowa Hakko Kirin | N/A | |
| Chemical compound, drug | 2-Deoxy-D-Glucose | Tokyo Chemical Industry Co., Ltd. | Cat# D0051 | |
| Chemical compound, drug | Oligomycin | Cell Signaling Technology | Cat# 9996 L | |
| Chemical compound, drug | FCCP | Sigma Aldrich | Cat# C2920 | |
| Chemical compound, drug | Rotenone | Sigma Aldrich | Cat# R8875 | |
| Chemical compound, drug | Etomoxir (sodium salt) | Cayman chemical | Cat# 11969 | |
| Chemical compound, drug | 6-diazo-5-oxo-L-nor-Leucine | Cayman chemical | Cat# 17580 | |
| Chemical compound, drug | Verapamil | Sigma Aldrich | Cat# V4629 | |
| Chemical compound, drug | N-acetyl-cysteine | Tokyo Chemical Industry Co., Ltd. | Cat# A0905 | |
| Chemical compound, drug | AZ PFKFB3 26 | R&D systems | Cat# 5675 | |
| Chemical compound, drug | Dorsomorphin dihydrochloride | Santa Cruz Biotechnology | Cat# sc-361173 | |
| Chemical compound, drug | LKB1/AAK1 dual inhibitor | Chem Scene | Cat# CS-0342 | |
| Chemical compound, drug | PKM2 inhibitor(compound 3 k) | Selleck | Cat# S8616 | |
| Chemical compound, drug | Recombinant Murine SCF | PeproTech | Cat# 250–03 | |
| Chemical compound, drug | Recombinant Human TPO | PeproTech | Cat# 300–18 | |
| Chemical compound, drug | α-hemolysin | Sigma Aldrich | Cat# H9395 | |
| Chemical compound, drug | Potassium Chloride | Wako | Cat# 7447-40-7 | |
| Chemical compound, drug | Sodium Chloride | Wako | Cat# 7647-14-5 | |
| Chemical compound, drug | Calcium Nitrate Tetrahydrate | Wako | Cat# 13477-34-4 | |
| Chemical compound, drug | Magnesium Sulfate (Anhydrous) | Wako | Cat# 7487-88-9 | |
| Chemical compound, drug | Sodium Hydrogen Carbonate | Wako | Cat# 144-55-8 | |
| Chemical compound, drug | Disodium Hydrogenphosphate 12-Water | Wako | Cat# 10039-32-4 | |
| Chemical compound, drug | Glutathione reduced form | Tokyo Chemical Industry Co., Ltd. | Cat# G0074 | |
| Chemical compound, drug | Ethylene Glycol Bis(β-aminoethylether)-N,N,N',N'-tetraacetic Acid | Nacalai tesque | Cat# 15214–21 | |
| Chemical compound, drug | HEPES | Wako | Cat# 7365-45-9 | |
| Chemical compound, drug | Magnesium Chloride | Wako | Cat# 7786-30-3 | |
| Chemical compound, drug | Adenosine 5’-triphosphate magnesium salt | Sigma Aldrich | Cat# A9187 | |
| Chemical compound, drug | DMSO | Sigma Aldrich | Cat# D8418 | |
| Chemical compound, drug | Ethanol | Nacalai tesque | Cat# 14712–63 | |
| Chemical compound, drug | Methanol | Nacalai tesque | Cat# 21914–03 | |
| Chemical compound, drug | Chloroform | Nacalai tesque | Cat# 08401–65 | |
| Chemical compound, drug | Hoechst 33432 | Thermo Fisher Scientific | Cat# H3570 | (10 µg/mL) |
| Chemical compound, drug | Propidium iodide | Thermo Fisher Scientific | Cat# P3566 | (1:1000) |
| Chemical compound, drug | Flow-Check Fluorspheres | Beckman Coulter | Cat# 7547053 | |
| Chemical compound, drug | TrueCut Cas9 Protein v2 | Thermo Fisher Scientific | Cat# A36498 | |
| Chemical compound, drug | ExTaq | Takara bio | Cat# RR001 | |
| Chemical compound, drug | NotI | Nippon Gene | Cat# 312–01453 | |
| Chemical compound, drug | EcoRI | Nippon Gene | Cat# 314–00112 | |
| Chemical compound, drug | RetroNectin (Recombinant Human Fibronectin Fragment) | Takara | Cat# T100A | |
| Chemical compound, drug | UltraPure DNase_RNase-Free Distilled Water | Invitrogen | Cat# 10977015 | |
| Chemical compound, drug | GSK3368715 | MedChemExpress | Cat# HY-128717A | |
| Commercial assay or kit | RNeasy Mini Kit | QIAGEN | Cat# 74104 | |
| Commercial assay or kit | SuperScript VILO | Thermo Fisher Scientific | Cat# 11754–050 | |
| Commercial assay or kit | 2-mercapto ethanol | Sigma Aldrich | Cat# M6250 | |
| Commercial assay or kit | Flow Cytometry Size Calibration Kit (nonfluorescent microspheres) | Invitrogen | Cat# F13838 | |
| Commercial assay or kit | ‘’Cellno’’ ATP assay reagent Ver.2 | Toyo B-Net Corporation | CA2-50 | |
| Commercial assay or kit | Fixation and Permeabilization Solution | BD Biosciences | Cat# 554722 | |
| Commercial assay or kit | Perm/Wash Buffer | BD Biosciences | Cat# 554723 | |
| Commercial assay or kit | CellROX Deep Red Reagent | Invitrogen | Cat# C10422 | |
| Commercial assay or kit | SMART-Seq v4 Ultra Low Input RNA Kit for Sequencing | Clontech | Cat# Z4888N | |
| Commercial assay or kit | NEBNext Ultra DNA Library Prep Kit for Illumina | New England BioLabs | Cat# E7370S | |
| Commercial assay or kit | CUGA7 gRNA Synthesis Kit | Nippon Gene | Cat# 314–08691 | |
| Commercial assay or kit | Extract-N-Amp Blood PCR Kit | Merck | Cat# XNAB2-1KT | |
| Commercial assay or kit | Wizard SV Gel and PCR Clean-Up System | Promega | Cat# A9281 | |
| Commercial assay or kit | BD Pharmingen FITC BrdU Flow Kit | BD Biosciences | Cat# 559619 | |
| Commercial assay or kit | BD Pharmingen PE Annexin V Apoptosis Detection Kit I | BD Biosciences | Cat# 559763 | |
| Commercial assay or kit | FAOBlue | Funakoshi | Cat# FDV-0033 | |
| Software, algorithm | R v3.5.2 | R Development Core Team, 2018 | http://www.r-project.org | |
| Software, algorithm | TopHat v2.0.13 | 10.1186/gb-2013-14-4-r36; Kim et al., 2013 | https://ccb.jhu.edu/software/tophat/index.shtml | |
| Software, algorithm | Cufflinks v2.2.1 | 10.1038/nbt.1621; Trapnell et al., 2012 | http://cole-trapnell-lab.github.io/cufflinks/ | |
| Software, algorithm | GSEA software v4.3.0 | Broad Institute; Subramanian et al., 2005 | https://www.gsea-msigdb.org/gsea/index.jsp | |
| Software, algorithm | FlowJo version 9 | BD Biosciences | https://www.flowjo.com/ | |
| Software, algorithm | TIDE v3.3.0 | 10.1093/nar/gku93; Brinkman et al., 2014 | https://tide.nki.nl/ | |
| Software, algorithm | OpenMebius | 10.1155/2014/627014; Kajihata et al., 2014 | http://www-shimizu.ist.osaka-u.ac.jp/hp/en/software/OpenMebius.html |
Additional files
-
Supplementary file 1
Custom RPMI medium for culture and ATP analysis.
Composition of custom RPMI medium for culture (upper) and ATP analysis (lower). “-“ means 0 mg/L.
- https://cdn.elifesciences.org/articles/87674/elife-87674-supp1-v2.xlsx
-
Supplementary file 2
In vitro tracer analysis for 5-FU-treated HSCs.
Results of tracer analysis using U-13C6-glucose with HSCs from mice treated with PBS or 5-FU. Each section contains raw data from the glycolytic system, TCA cycle, and P~NAS from top to bottom. Data from three individual experiments are described for each. All values represent average metabolite levels in single HSCs obtained by dividing the metabolite levels detected in HSCs (compared to internal standards) by the number of HSCs used in the analysis.
- https://cdn.elifesciences.org/articles/87674/elife-87674-supp2-v2.xlsx
-
Supplementary file 3
In vitro tracer analysis for oligomycin-treated HSCs.
Results of tracer analysis using U-13C6-glucose with HSCs treated with DMSO (Oligomycin-) or oligomycin (Oligomycin+). Each section contains raw data from the glycolytic system, TCA cycle, and P~NAS from top to bottom. Data from four individual experiments are described for each. All values represent average metabolite levels in single HSCs, obtained by dividing the metabolite levels detected in HSCs (compared to internal standards) by the number of HSCs used in the analysis.
- https://cdn.elifesciences.org/articles/87674/elife-87674-supp3-v2.xlsx
-
Supplementary file 4
13C quantitative metabolic flux analysis.
Metabolic flux values of each enzyme obtained from 100 trials of 13C quantitative metabolic flux analysis for PBS-treated (left), 5-FU-treated (middle), and OXPHOS-inhibited HSCs (right).
- https://cdn.elifesciences.org/articles/87674/elife-87674-supp4-v2.xlsx
-
Supplementary file 5
In vivo tracer analysis for 5-FU treated mice.
Results of tracer analysis during continuous in vivo administration of U-13C6-glucose to mice treated with 5-FU or PBS. A sheet is prepared for each metabolite and each contains two tables. The A.U. table (left) shows the metabolite levels detected in the four biological replicates in the 5-FU and PBS groups, obtained by dividing the metabolite levels detected in HSCs (compared to internal standards) by the number of HSCs used in the analysis. The ratio table (right) shows the calculated percentage of labeled metabolites among detected metabolites, where 12 C indicates unlabeled metabolites and 13Cn indicates n-carbon labeled metabolites by U-13C6-glucose.
- https://cdn.elifesciences.org/articles/87674/elife-87674-supp5-v2.xlsx
-
Supplementary file 6
Primer list for genotyping PCR.
- https://cdn.elifesciences.org/articles/87674/elife-87674-supp6-v2.xlsx
-
MDAR checklist
- https://cdn.elifesciences.org/articles/87674/elife-87674-mdarchecklist1-v2.docx
Download links
A two-part list of links to download the article, or parts of the article, in various formats.
Downloads (link to download the article as PDF)
Open citations (links to open the citations from this article in various online reference manager services)
Cite this article (links to download the citations from this article in formats compatible with various reference manager tools)
Context-dependent modification of PFKFB3 in hematopoietic stem cells promotes anaerobic glycolysis and ensures stress hematopoiesis
eLife 12:RP87674.
https://doi.org/10.7554/eLife.87674.3


