scMultiome analysis identifies embryonic hindbrain progenitors with mixed rhombomere identities
- Section of Developmental Biology, Department of Pediatrics, University of Colorado Medical School, United States
Figures
Figure 1 with 1 supplement
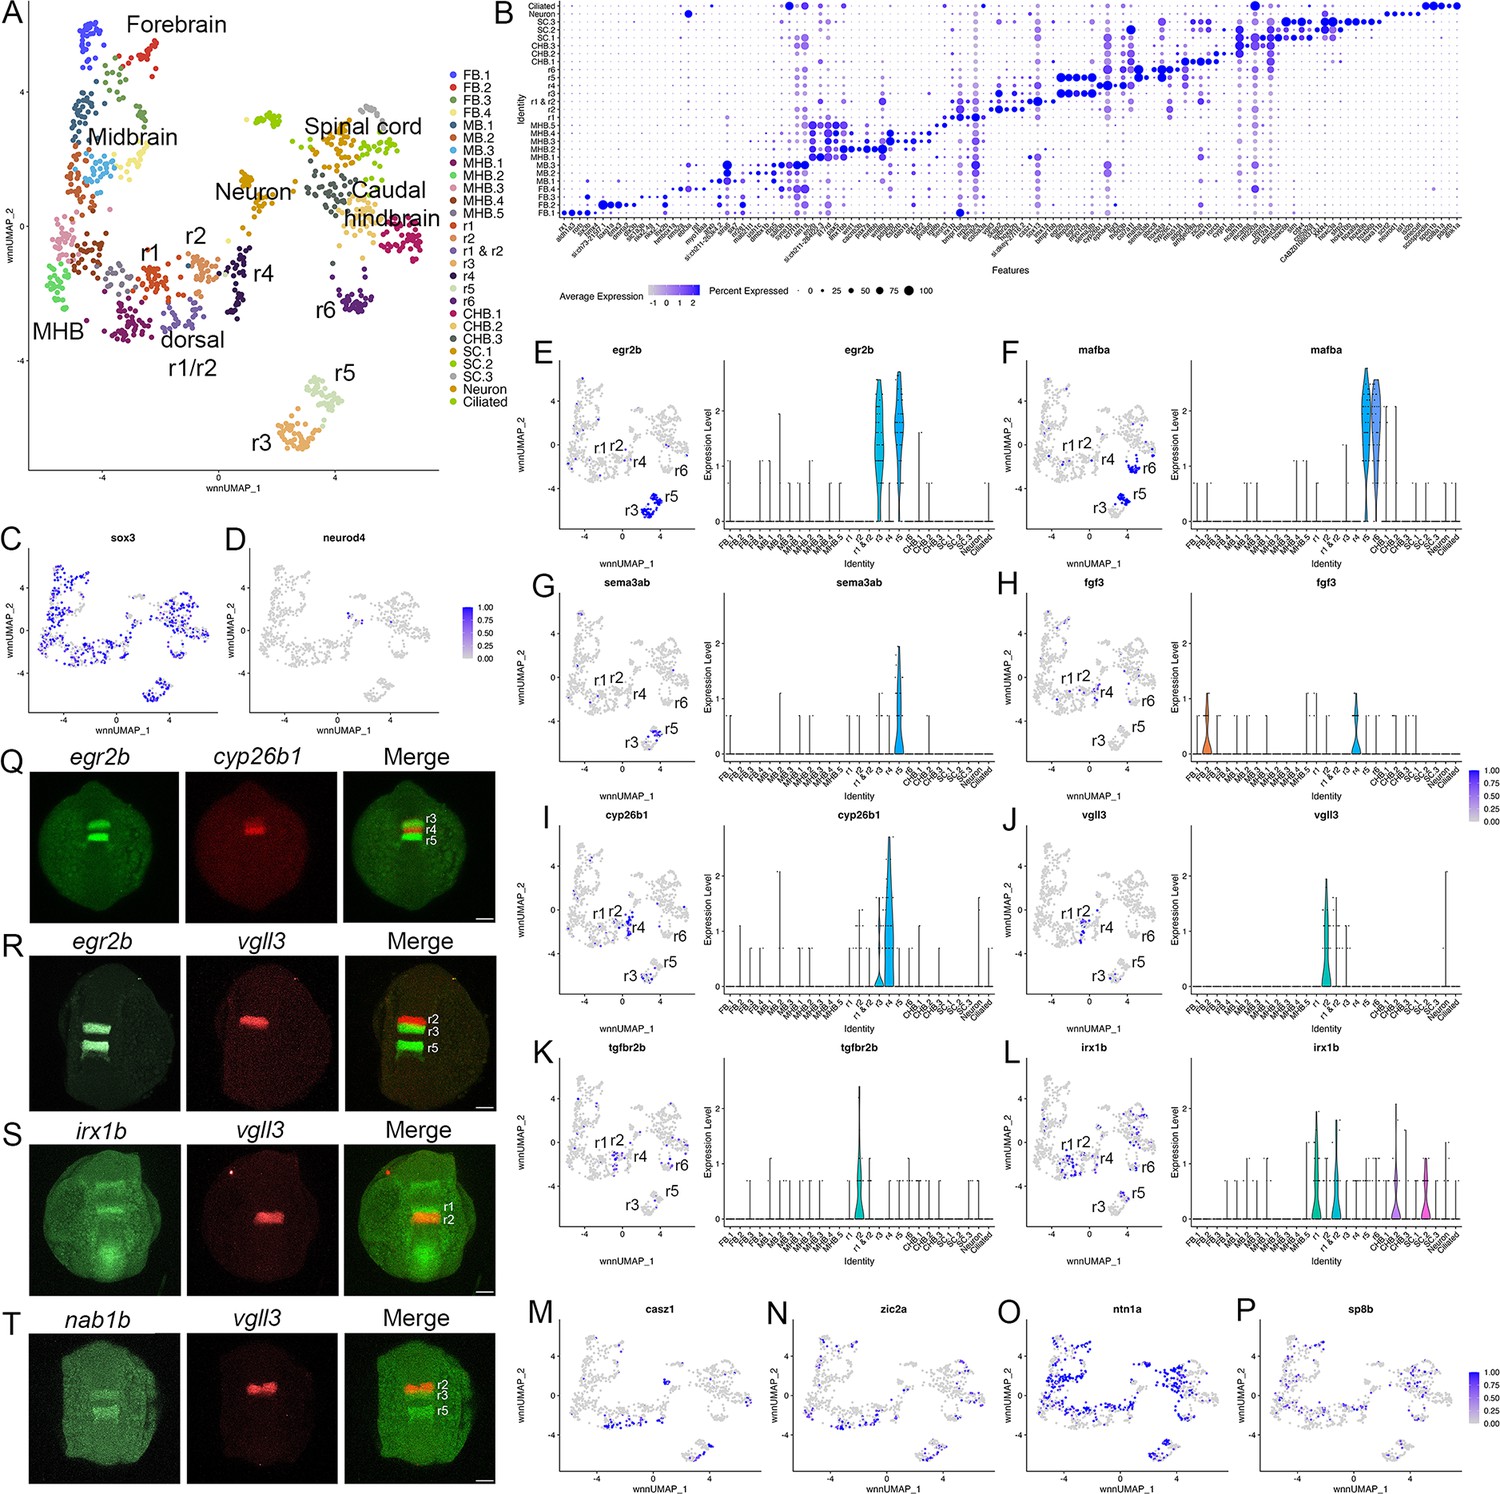
Individual rhombomeres are resolved in the 13hpf zebrafish hindbrain.
See also Figure 1—figure supplement 1, Figure 1—source data 1 and Figure 1—source data 2. (A). UMAP of 13hpf neural clusters. (B). Dot plot showing the expression of the top five enriched genes in each cluster. (C, D). Feature plots showing the expressing of sox3 (C) and neurod4 (D). (E-L). Expression of rhombomere-specific genes are shown as feature plots (left panels) and violin plots (right panels). (M-P). Feature plots showing the expression of dorsoventral marker genes. (Q-T). Hybridization chain reaction (HCR) analysis of rhombomere-restricted gene expression in 13hpf wild-type zebrafish embryos. Embryos are shown in dorsal view with anterior to the top. FB = forebrain, MB = midbrain, MHB = midbrain-hindbrain boundary, r=rhombomere, CHB = caudal hindbrain, SC = spinal cord. Scale bar in (Q-T) = 100 um.
-
Figure 1—source data 1
Quality Control data for scMultiome analyses.
- https://cdn.elifesciences.org/articles/87772/elife-87772-fig1-data1-v2.xlsx
-
Figure 1—source data 2
Differential gene expression data for each cluster at each time point.
- https://cdn.elifesciences.org/articles/87772/elife-87772-fig1-data2-v2.xlsx
Figure 1—figure supplement 1
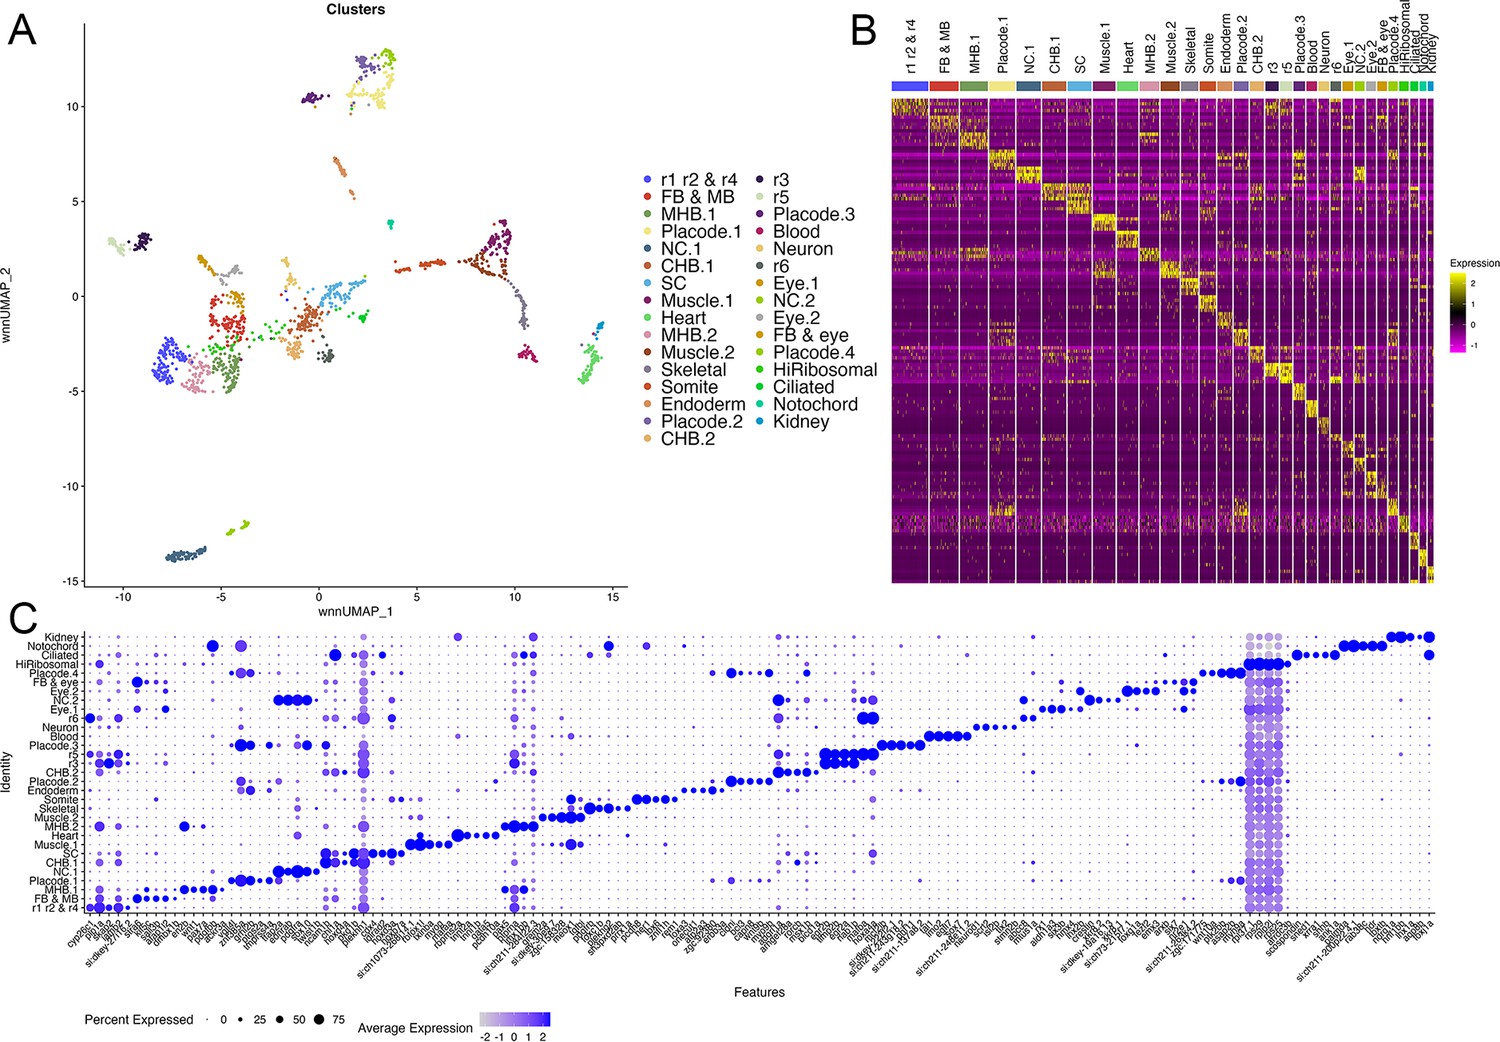
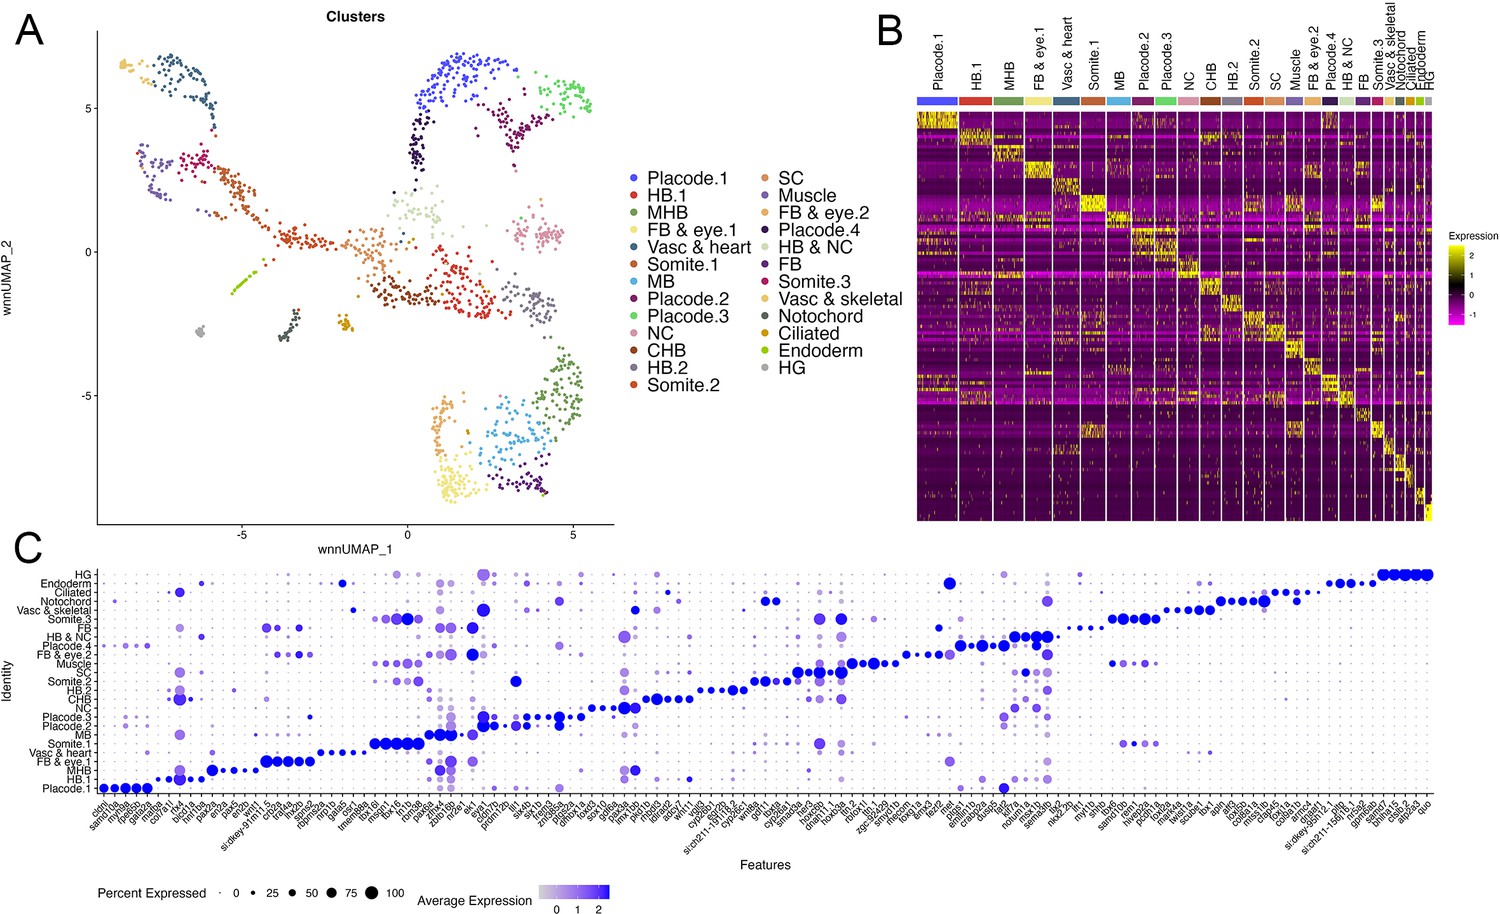
scMultiome analysis of 13hpf zebrafish.
(A). UMAP showing all clusters obtained from 13hpf dissected zebrafish hindbrain regions. (B). Heatmap showing the expression of the top five enriched genes in each cluster. (C). Dot plot showing the expression of the top five enriched genes in each cluster.
Figure 2 with 1 supplement
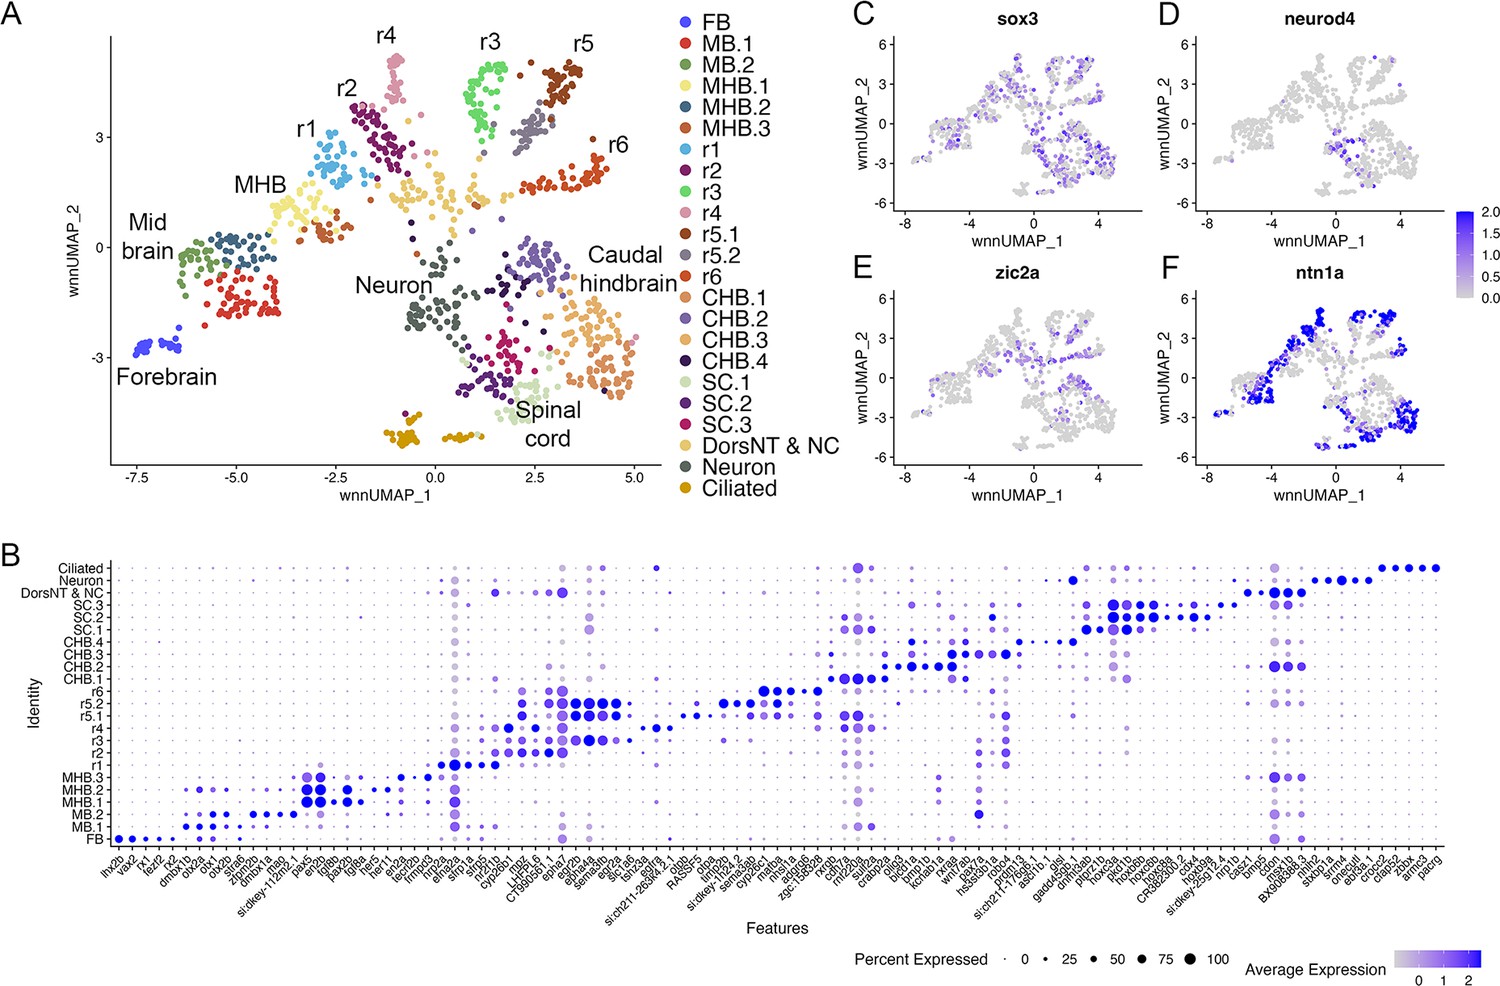
Individual rhombomeres are resolved in the 16hpf zebrafish hindbrain.
See also Figure 2—figure supplement 1. (A) UMAP of 16hpf neural clusters. (B) Dot plot showing the expression of the top five enriched genes in each cluster. (C, D) Feature plots showing the expressing of sox3 (C) and neurod4 (D). (E, F) Feature plots showing the expression of dorsoventral marker genes. dorsNT = dorsal neural tube, NC = neural crest. See legend to Figure 1 for additional abbreviations.
Figure 2—figure supplement 1

scMultiome analysis of 16hpf zebrafish.
(A). UMAP showing all clusters obtained from 16hpf dissected zebrafish hindbrain regions. (B). Heatmap showing the expression of the top five enriched genes in each cluster. (C). Dot plot showing the expression of the top five enriched genes in each cluster.
Figure 3 with 1 supplement
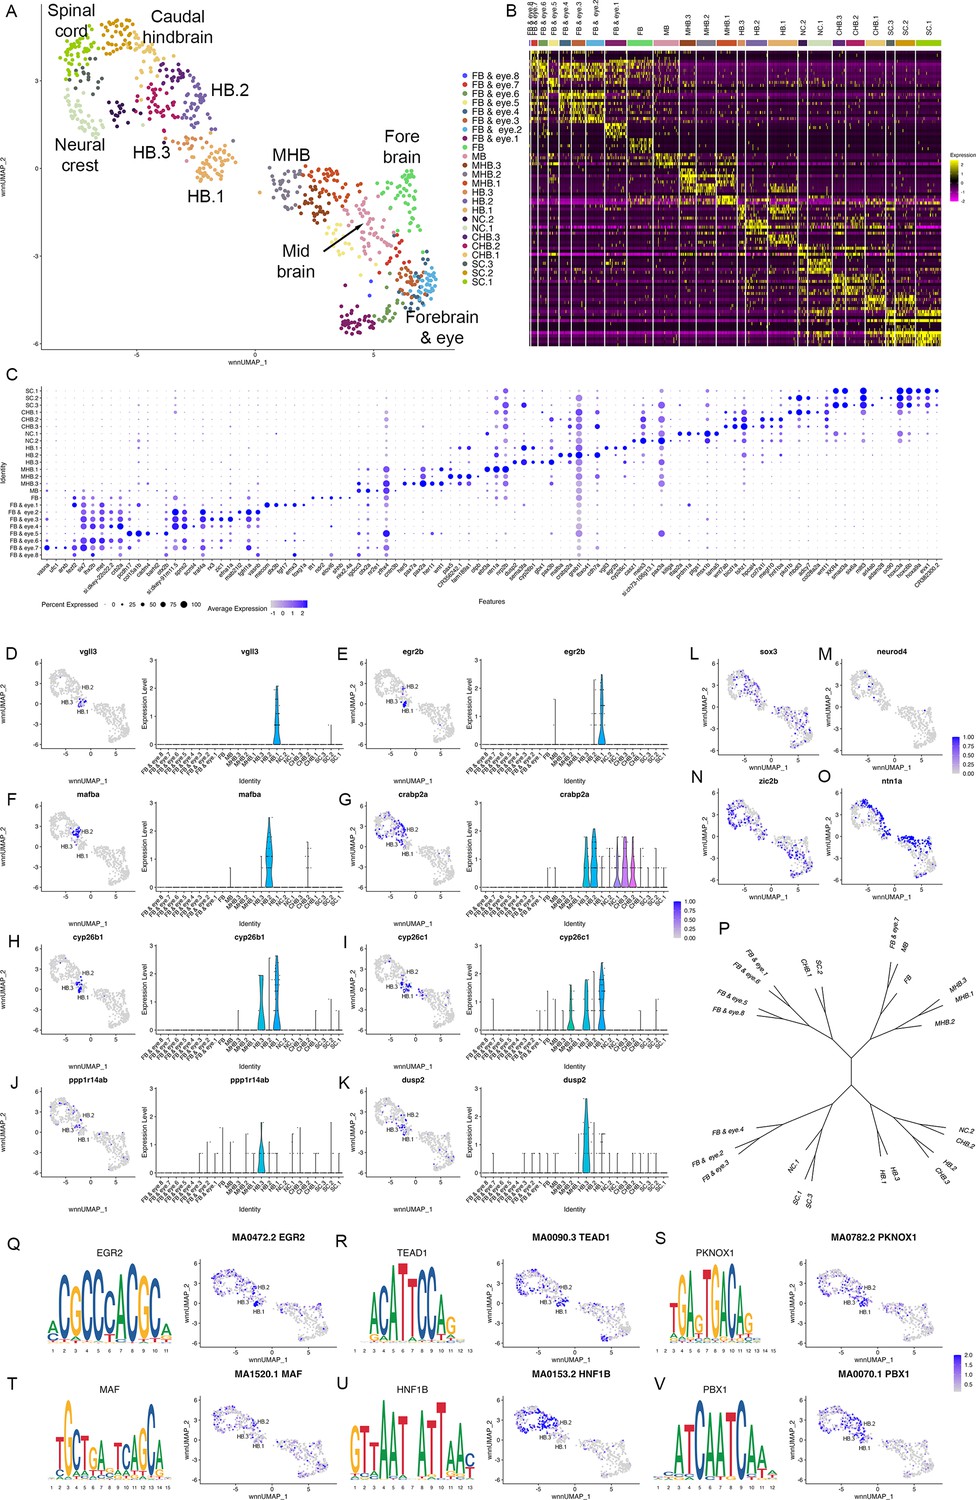
Individual rhombomeres are not resolved at 10hpf in zebrafish.
See also Figure 3—figure supplement 1. (A) UMAP of 10hpf neural clusters. (B, C) Heat map (B) and dot plot (C) showing the expression of the top five enriched genes in each cluster. (D-K) Expression of rhombomere-specific genes are shown as feature plots (left panels) and violin plots (right panels). (L-M) Feature plots showing the expressing of sox3 (L) and neurod4 (M). (N, O) Feature plots showing the expression of dorsoventral marker genes. (P) Dendrogram showing the relationship between the 10hpf neural clusters. (Q-V) Rhombomere-enriched accessible transcription factor binding motifs are shown as a motif logo (left panels) and as a feature plot of chromVar activity (right panel). HB = hindbrain, NC = neural crest. See legend to Figure 1 for additional abbreviations.
Figure 3—figure supplement 1
scMultiome analysis of 10hpf zebrafish.
(A) UMAP showing all clusters obtained from 10hpf whole zebrafish embryos. (B) Heatmap showing the expression of the top five enriched genes in each cluster. (C) Dot plot showing the expression of the top five enriched genes in each cluster.
Figure 4
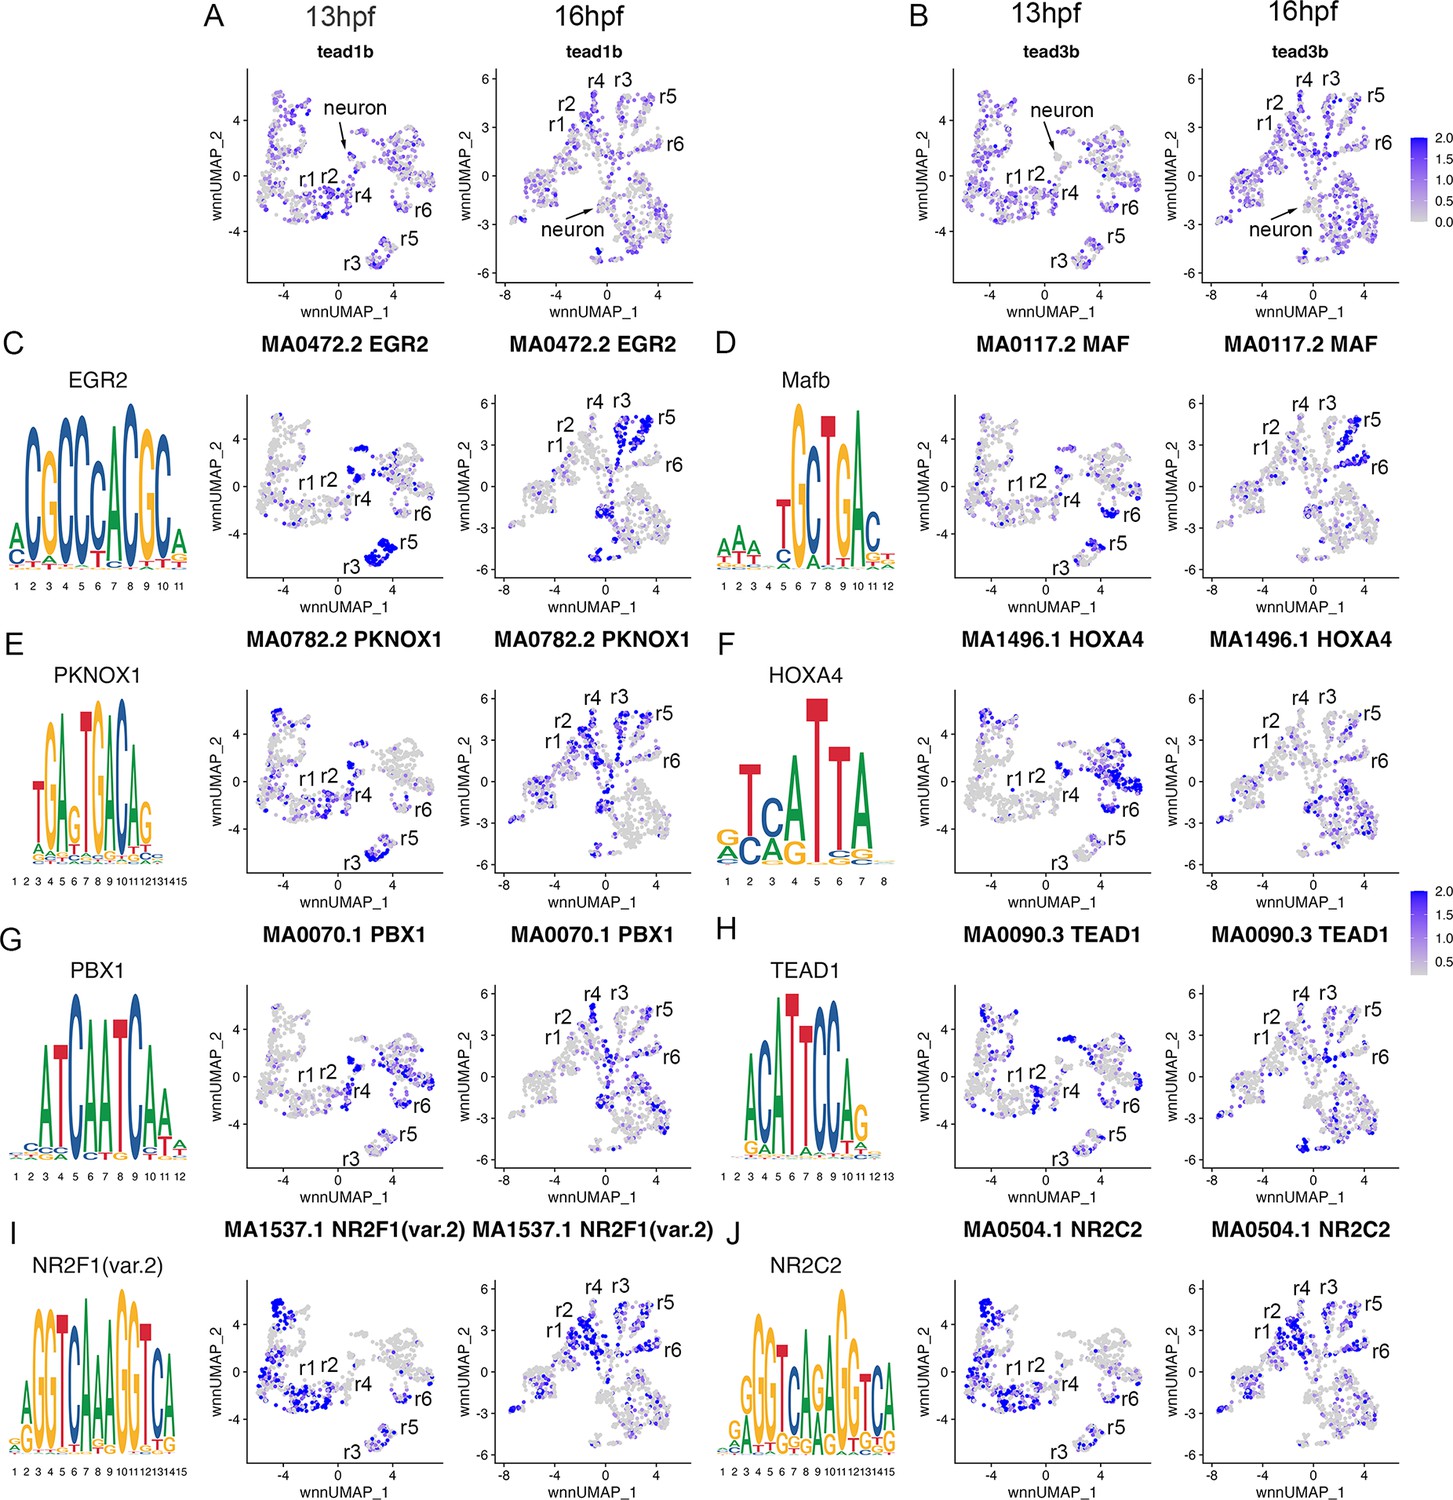
Transcription factor binding motifs show rhombomere-restricted accessibility.
See also Figure 4—source data 1. (A, B). Feature plots showing the expression of TEAD transcription factors at 13hpf and 16hpf. (C-J). Rhombomere-enriched accessible transcription factor motifs are shown as a motif logo (left panels) and as a feature plot of chromVar activity at 13hpf (middle panels), or 16hpf (right panels).
-
Figure 4—source data 1
Differentially accessible transcription factor motifs for each cluster at each time point.
- https://cdn.elifesciences.org/articles/87772/elife-87772-fig4-data1-v2.xlsx
Figure 5 with 7 supplements
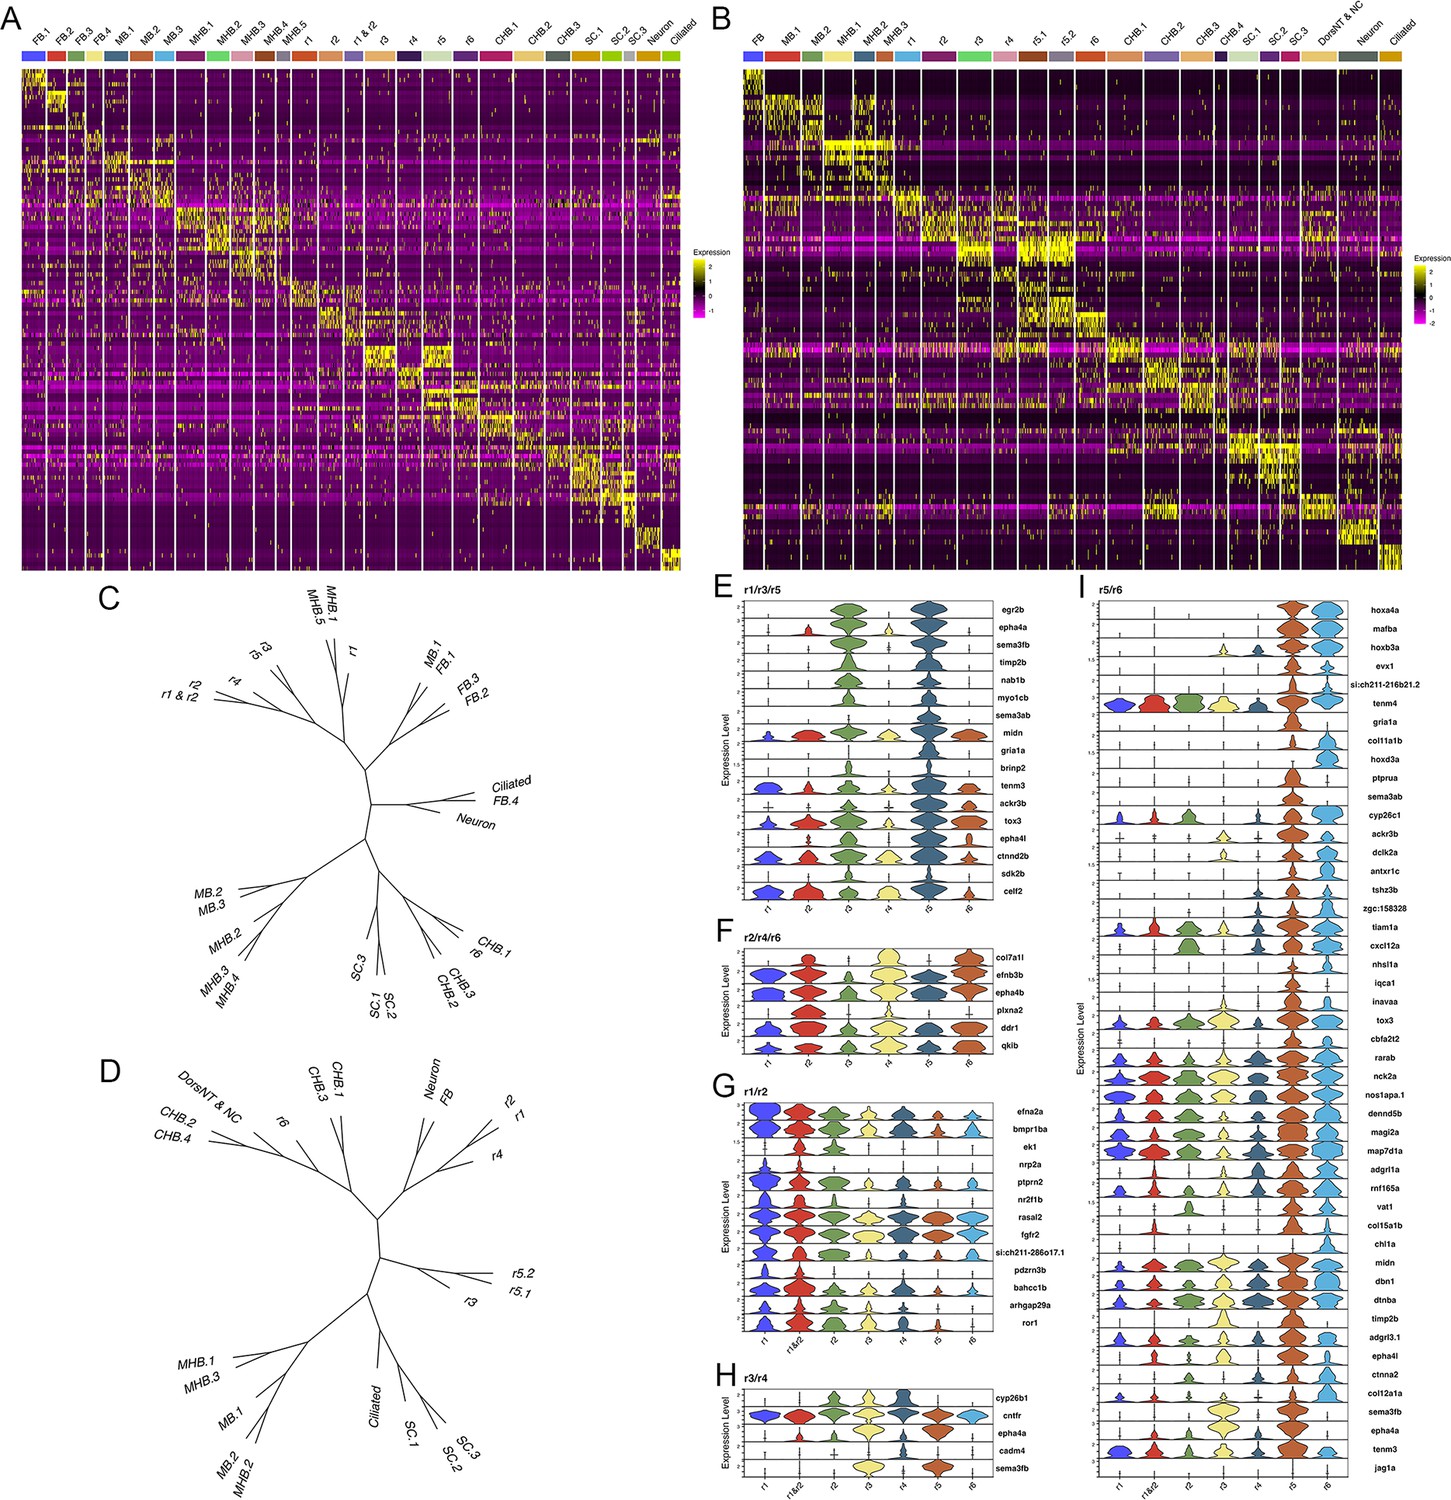
Each rhombomere displays a unique molecular profile.
See also Figure 5—figure supplements 1–7. (A, B) Heat maps showing the expression of the top five enriched genes in each cluster at 13hpf (A) and 16hpf (B). Gene order in A and B is the same as in Figures 1B and 2B, respectively. (C, D). Dendrograms showing the relationship between each neural cluster at 13hpf (C) and 16hpf (D). ( E-I). Violin plots showing expression levels of genes enriched in odd (E) or even (F) rhombomeres, as well as genes enriched in adjacent pairs of rhombomeres (G–I), at 13hpf.
Figure 5—figure supplement 1
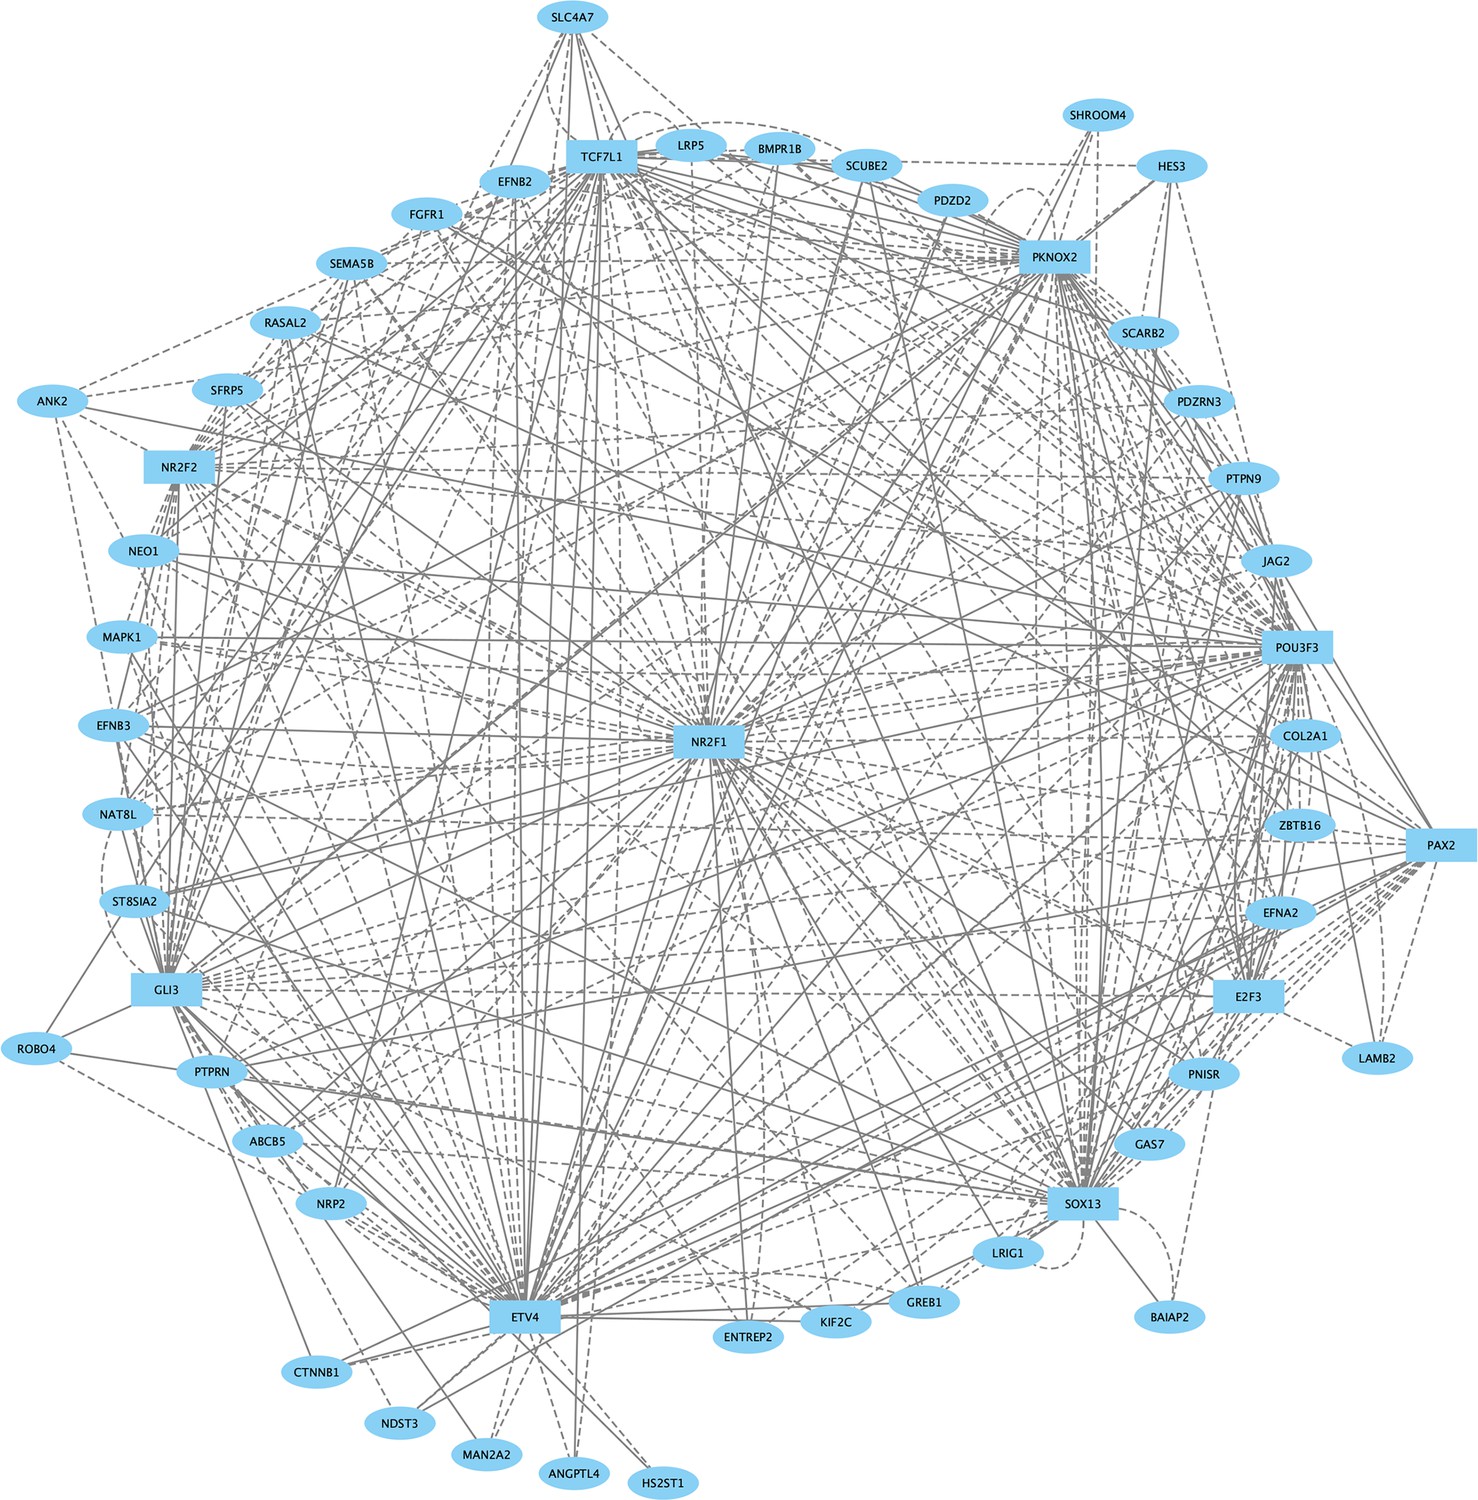
Direct-Net derived gene regulatory network for rhombomere 1 at 13hpf.
TFs (squares) and non-TFs (ovals) are linked by the presence of accessible TF motifs within 500 bp (solid lines) or 250 kb (dashed lines) of a gene’s transcription start site.
Figure 5—figure supplement 2

Direct-Net derived gene regulatory network for rhombomere 2 at 13hpf.
TFs (squares) and non-TFs (ovals) are linked by the presence of accessible TF motifs within 500 bp (solid lines) or 250 kb (dashed lines) of a gene’s transcription start site.
Figure 5—figure supplement 3
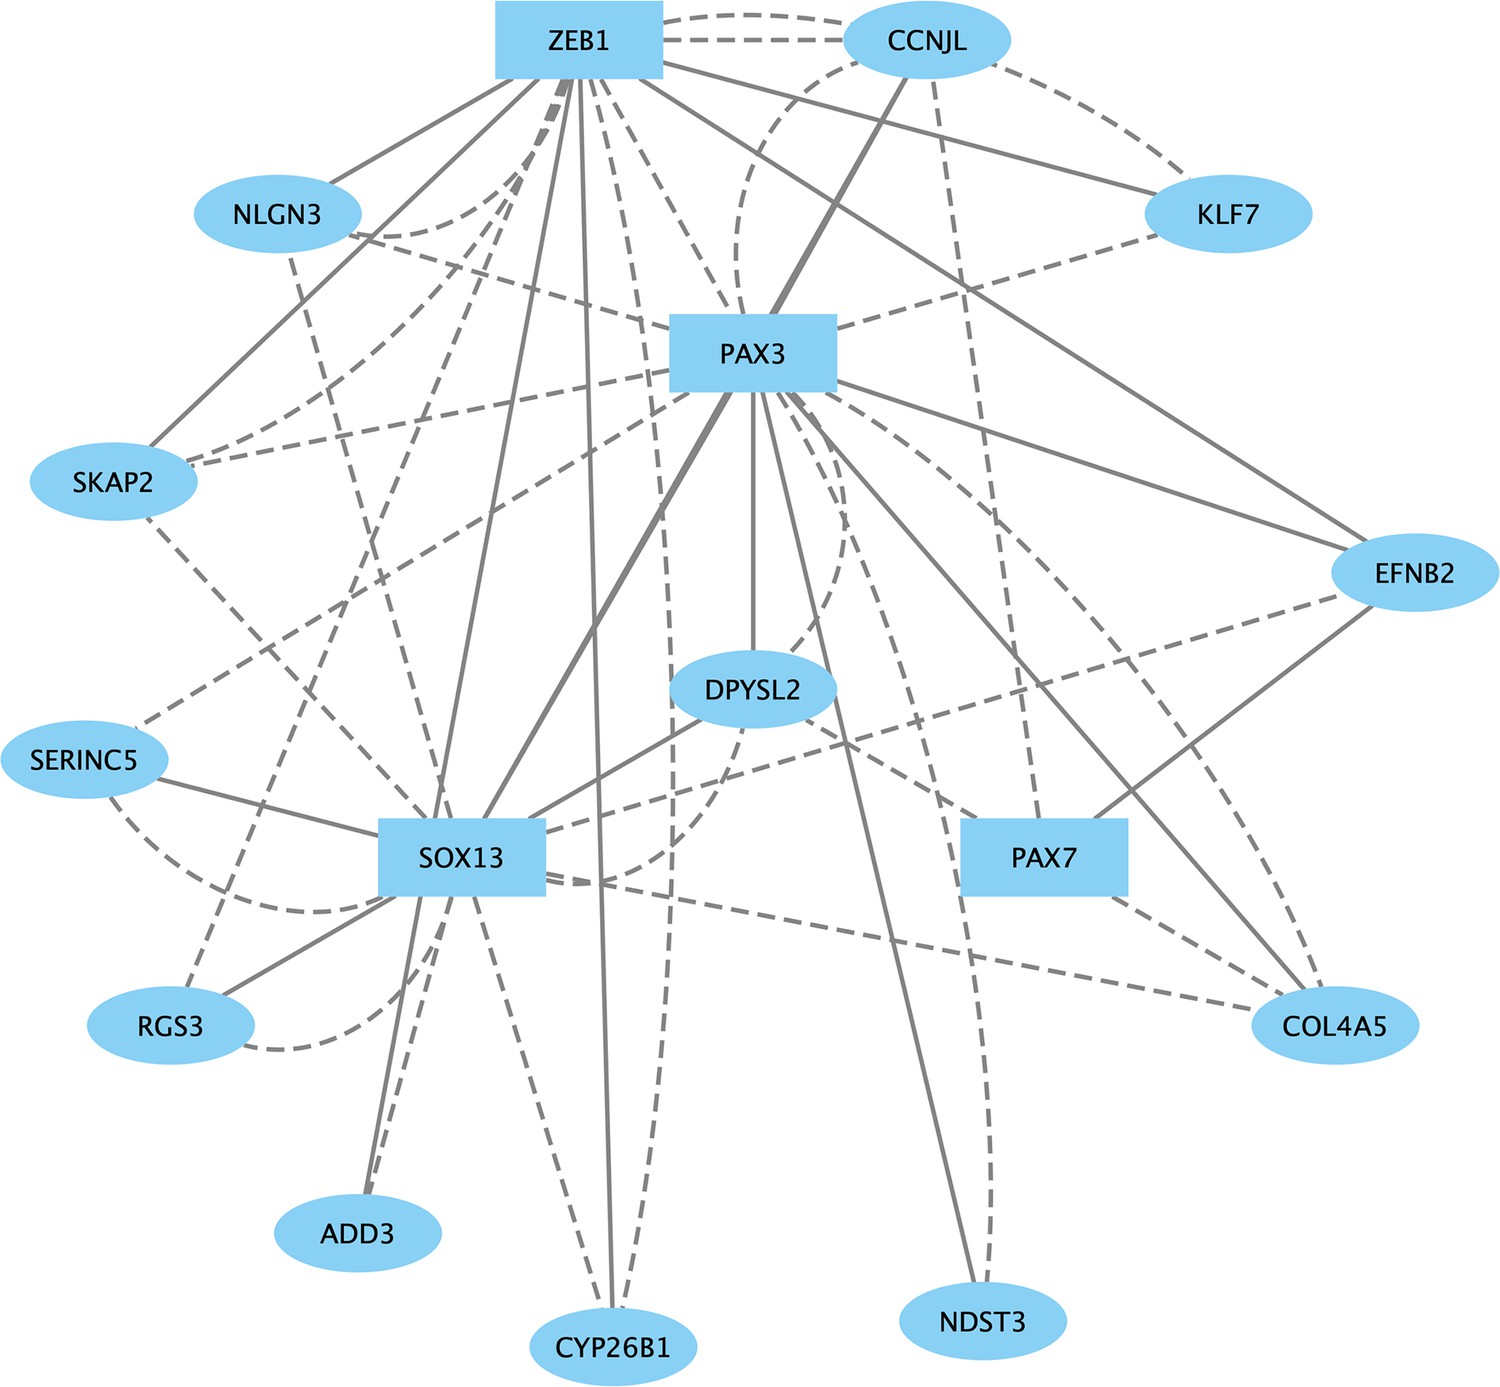
Direct-Net derived gene regulatory network for rhombomere 3 at 13hpf.
TFs (squares) and non-TFs (ovals) are linked by the presence of accessible TF motifs within 500 bp (solid lines) or 250 kb (dashed lines) of a gene’s transcription start site.
Figure 5—figure supplement 4
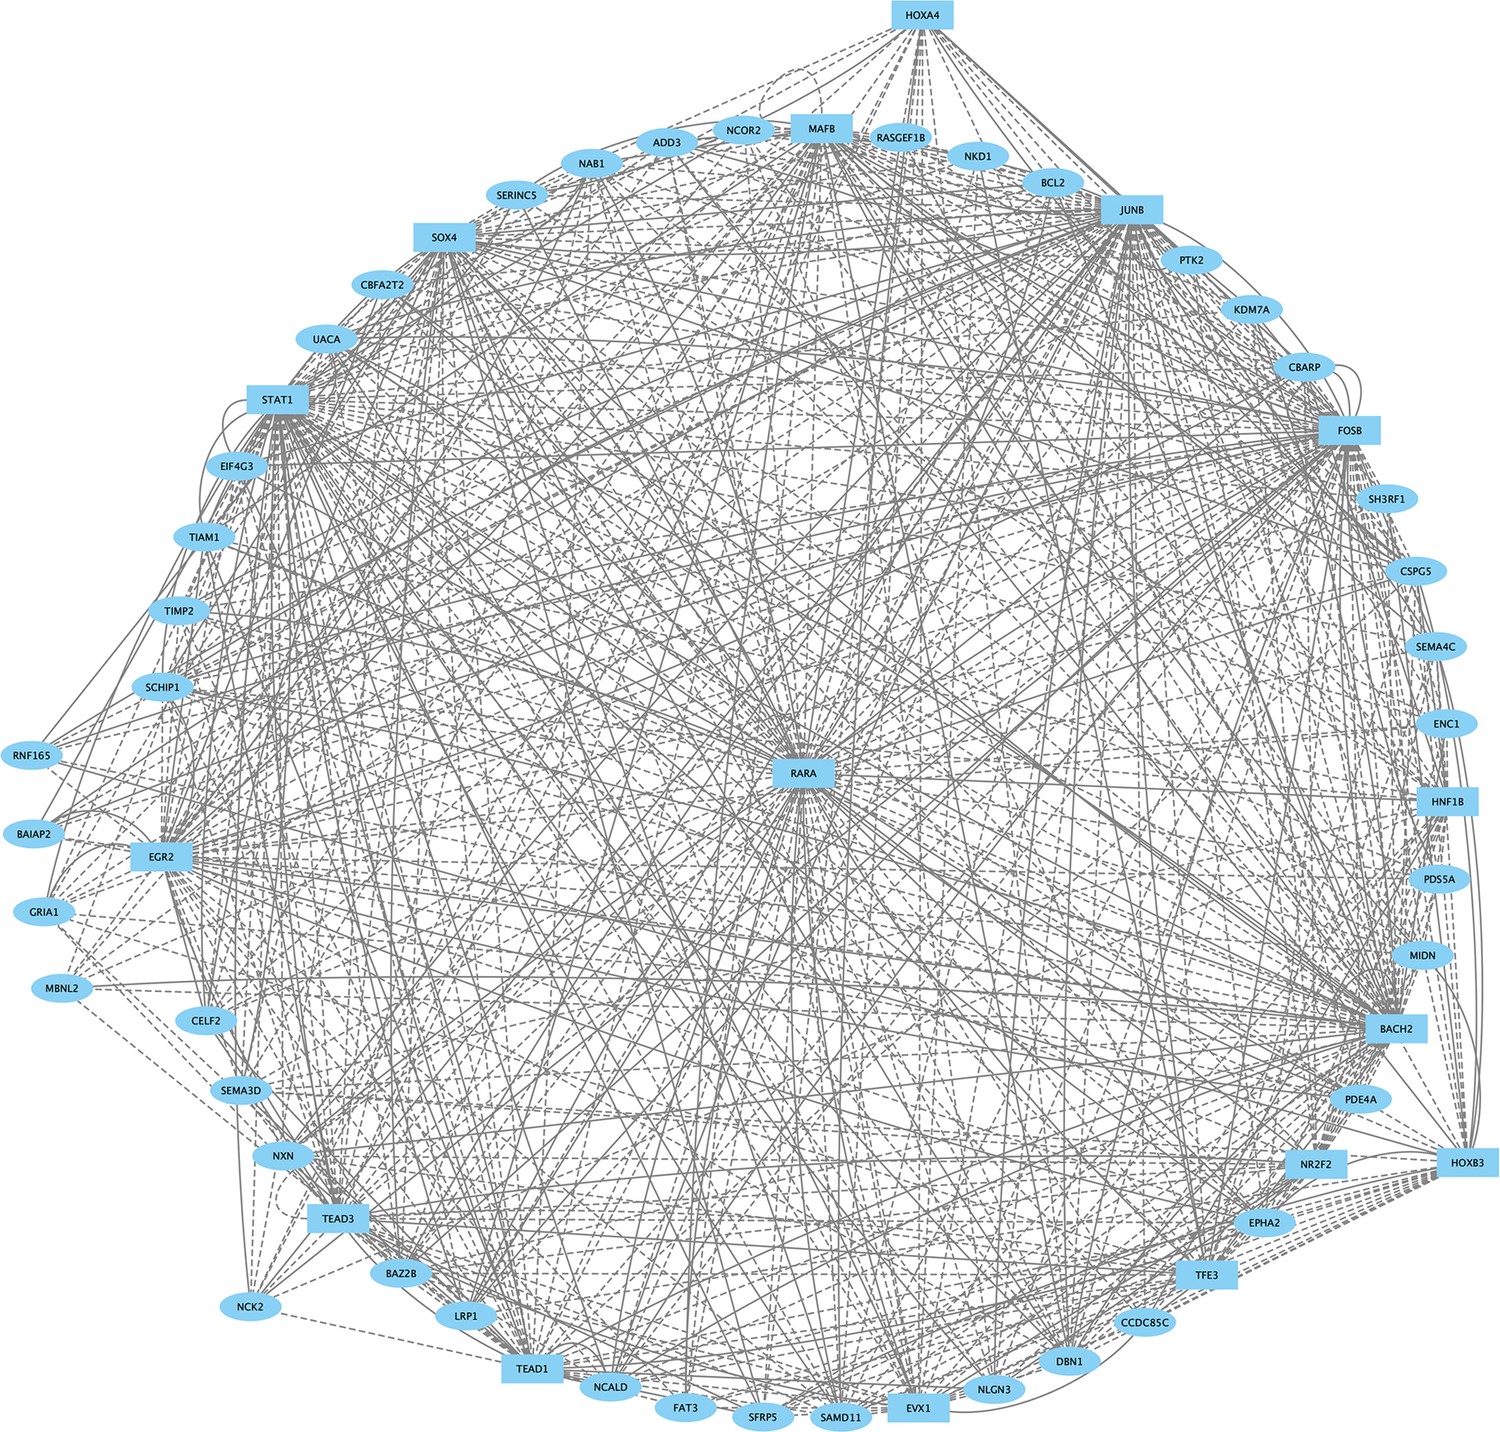
Direct-Net derived gene regulatory network for rhombomere 4 at 13hpf.
TFs (squares) and non-TFs (ovals) are linked by the presence of accessible TF motifs within 500 bp (solid lines) or 250 kb (dashed lines) of a gene’s transcription start site.
Figure 5—figure supplement 5
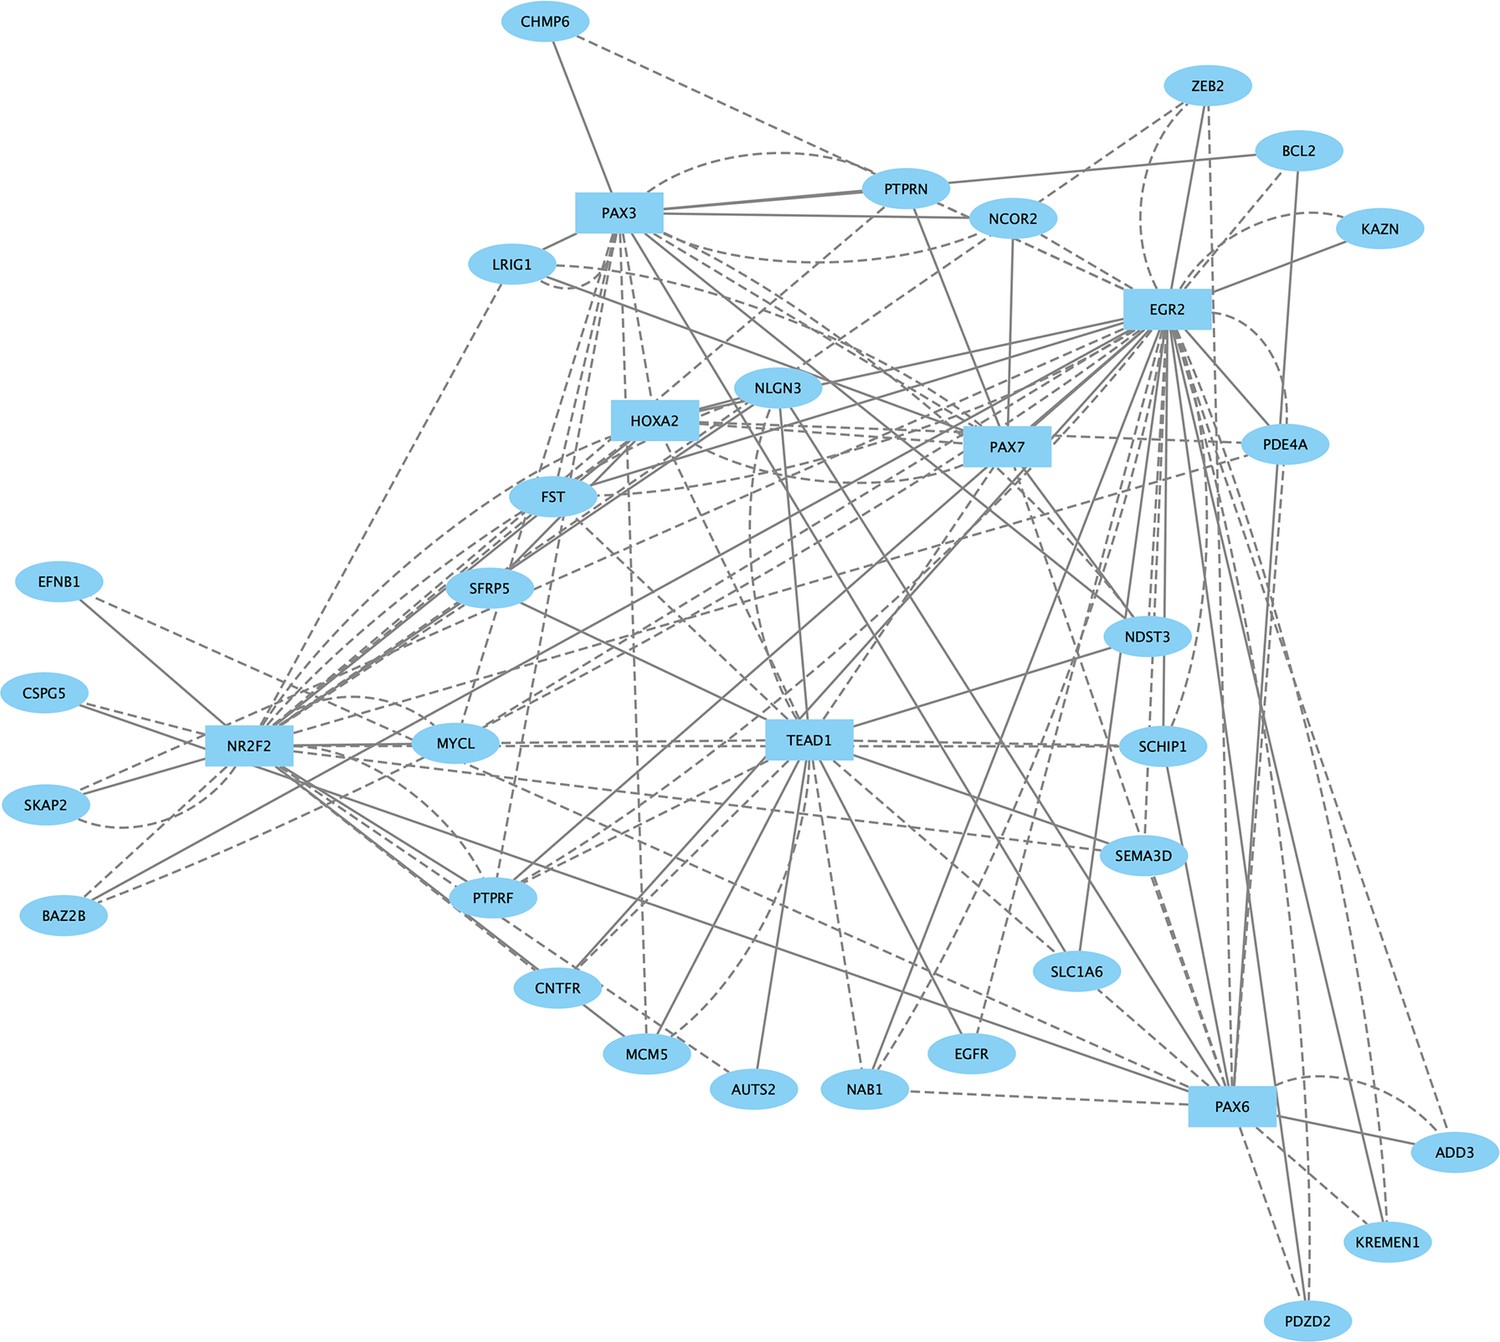
Direct-Net derived gene regulatory network for rhombomere 5 at 13hpf.
TFs (squares) and non-TFs (ovals) are linked by the presence of accessible TF motifs within 500 bp (solid lines) or 250 kb (dashed lines) of a gene’s transcription start site. Due to the large network produced for r5, only nodes with more than eight connections are shown.
Figure 5—figure supplement 6
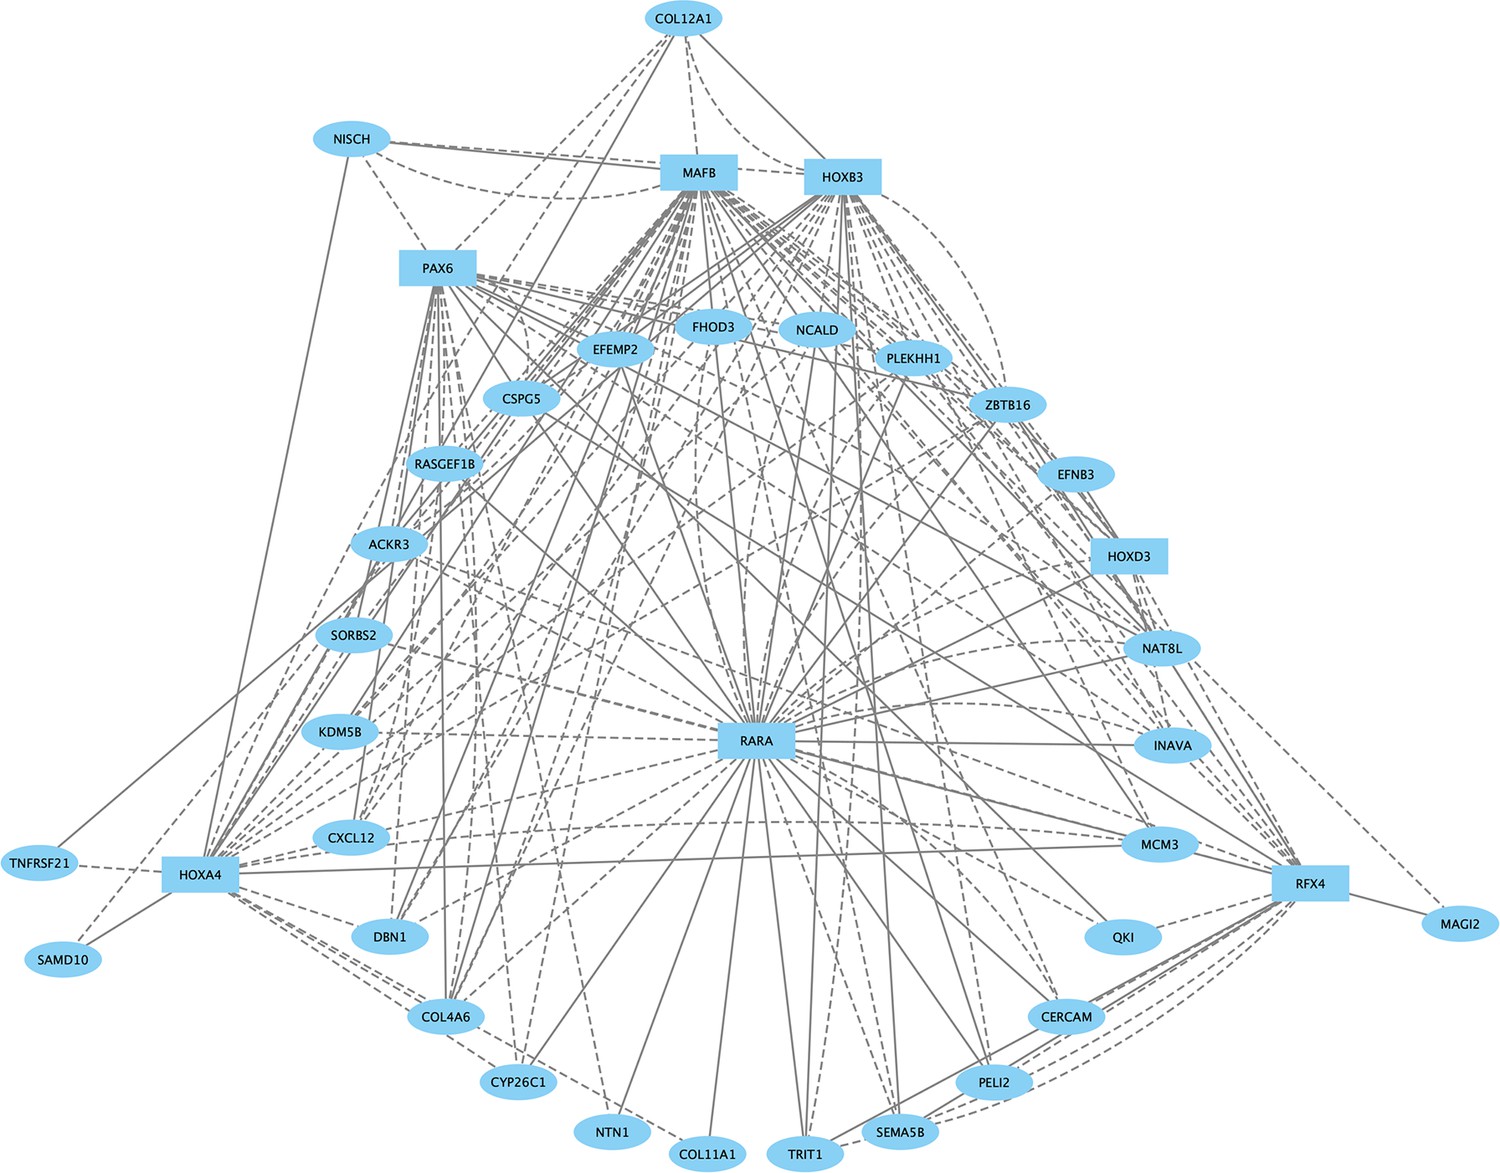
Direct-Net derived gene regulatory network for rhombomere 6 at 13hpf.
TFs (squares) and non-TFs (ovals) are linked by the presence of accessible TF motifs within 500 bp (solid lines) or 250 kb (dashed lines) of a gene’s transcription start site.
Figure 5—figure supplement 7
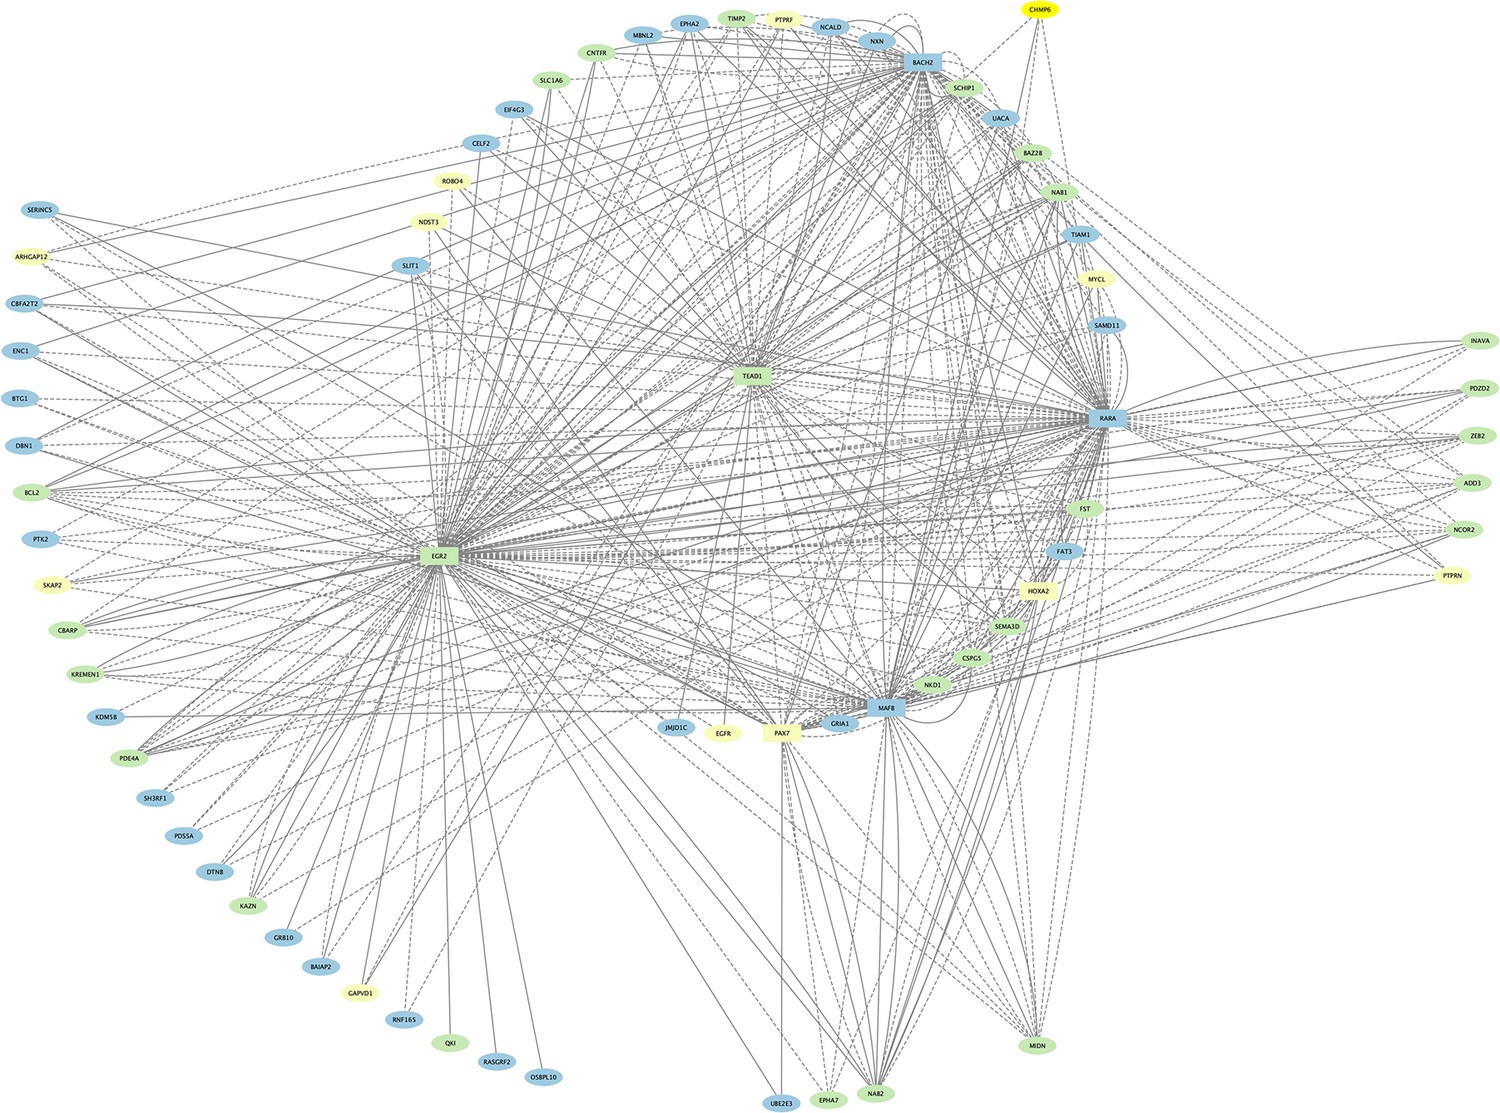
Direct-Net derived Egr2 networks for rhombomeres 3 and 5 at 13hpf.
The Egr2 networks for r3 and r5 were computationally combined, and color-coded such that Egr2 nodes observed only in r3 are indicated in yellow, ones observed only in r5 are blue, and Egr2 nodes shared between r3 and r5 are green. TFs (squares) and non-TFs (ovals) are linked by the presence of accessible TF motifs within 500 bp (solid lines) or 250 kb (dashed lines) of a gene’s transcription start site.
Figure 6 with 1 supplement
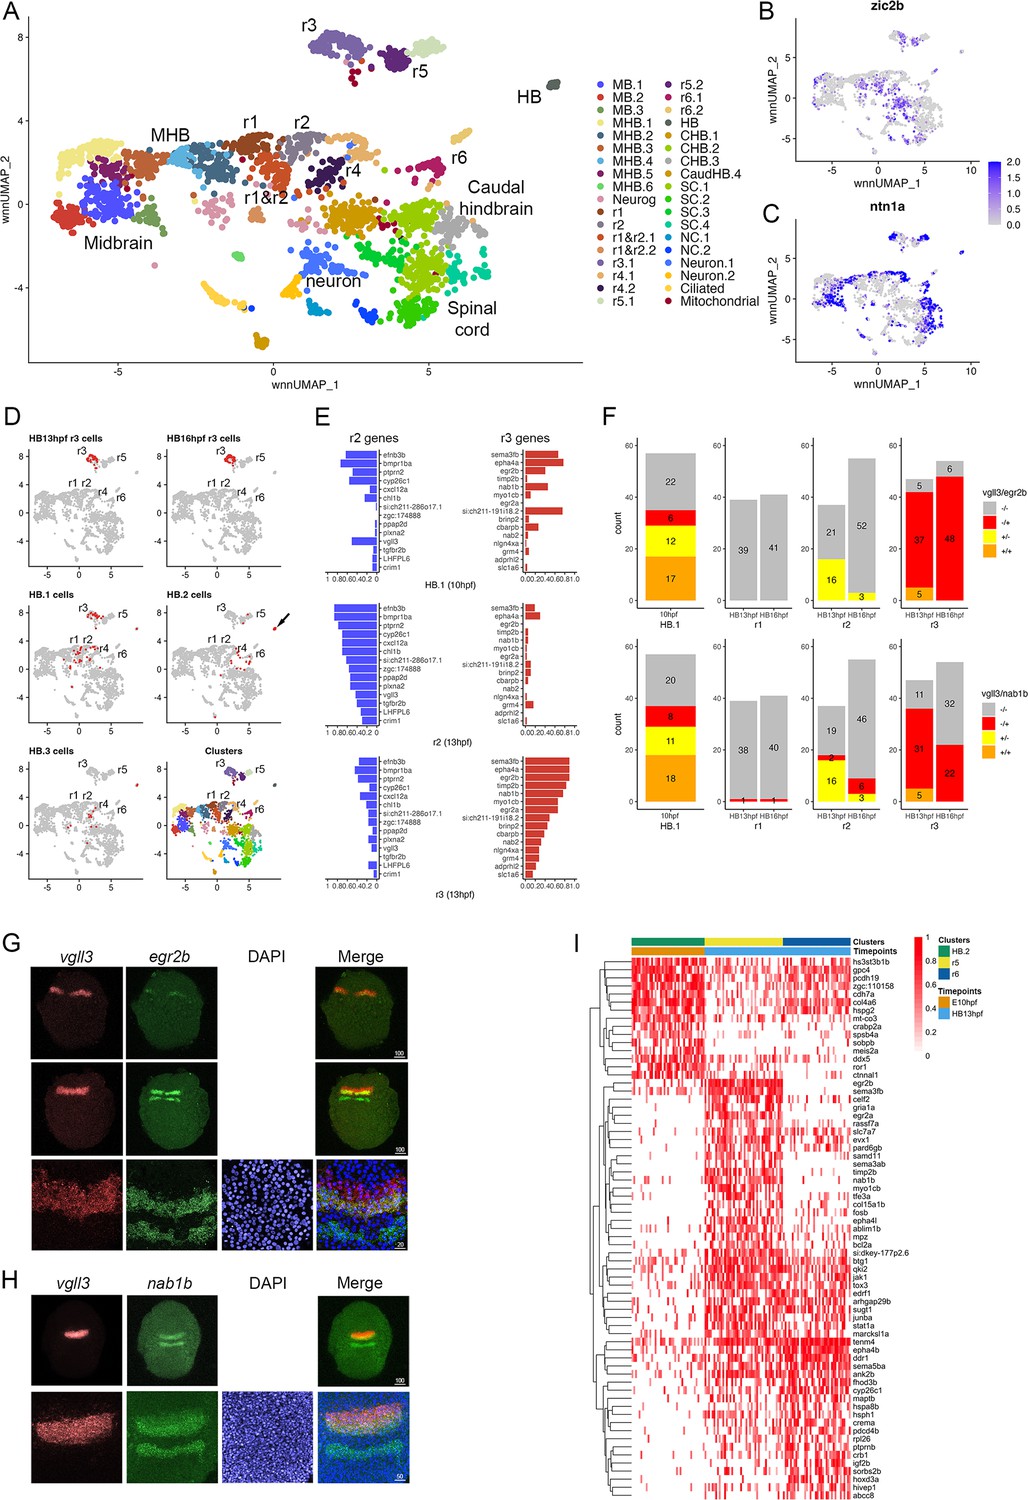
Rhombomere progenitor cells display mixed gene expression identities.
See also Figure 6—figure supplement 1, Figure 6—source data 1, Figure 6—source data 2 and Figure 6—source data 3. (A). UMAP of integrated data from 10hpf, 13hpf and 16hpf. (B, C). Feature plots showing the expression of dorsoventral marker genes. (D). Feature plots showing the contribution of various cell populations (listed at the top of each panel and shown as red cells) to the integrated rhombomere clusters. (E). Bar graphs showing expression of r2 genes (left column) and r3 genes (right column) in 10hpf HB.1 cells (top panel), 13hpf r2 cells (middle panel) and 13hpf r3 cells (bottom panel). (F). Co-expression of r2 markers (vgll3) and r3 markers (egr2b, nab1b) in individual cells from HB.1, r1, r2, and r3. Numbers in the bar graphs represent cell counts. (G, H). HCR analysis of rhombomere-restricted gene expression in 10-11hpf wild-type zebrafish embryos. Embryos are shown in dorsal view with anterior to the top. The bottom row in each panel displays a higher magnification of the row above. (I). Heatmap showing genes differentially expressed between HB.2 at 10hpf and its derivative rhombomeres (r5 and r6) at 13hpf. Scale bar sizes in (G, H) are given in um.
-
Figure 6—source data 1
Differential gene expression data for each cluster in the integrated data set.
- https://cdn.elifesciences.org/articles/87772/elife-87772-fig6-data1-v2.xlsx
-
Figure 6—source data 2
Differentially accessible transcription factor motifs for each cluster in the integrated dataset.
- https://cdn.elifesciences.org/articles/87772/elife-87772-fig6-data2-v2.xlsx
-
Figure 6—source data 3
Origin of cells contributing to each rhombomere cluster in the integrated UMAP.
- https://cdn.elifesciences.org/articles/87772/elife-87772-fig6-data3-v2.xlsx
Figure 6—figure supplement 1
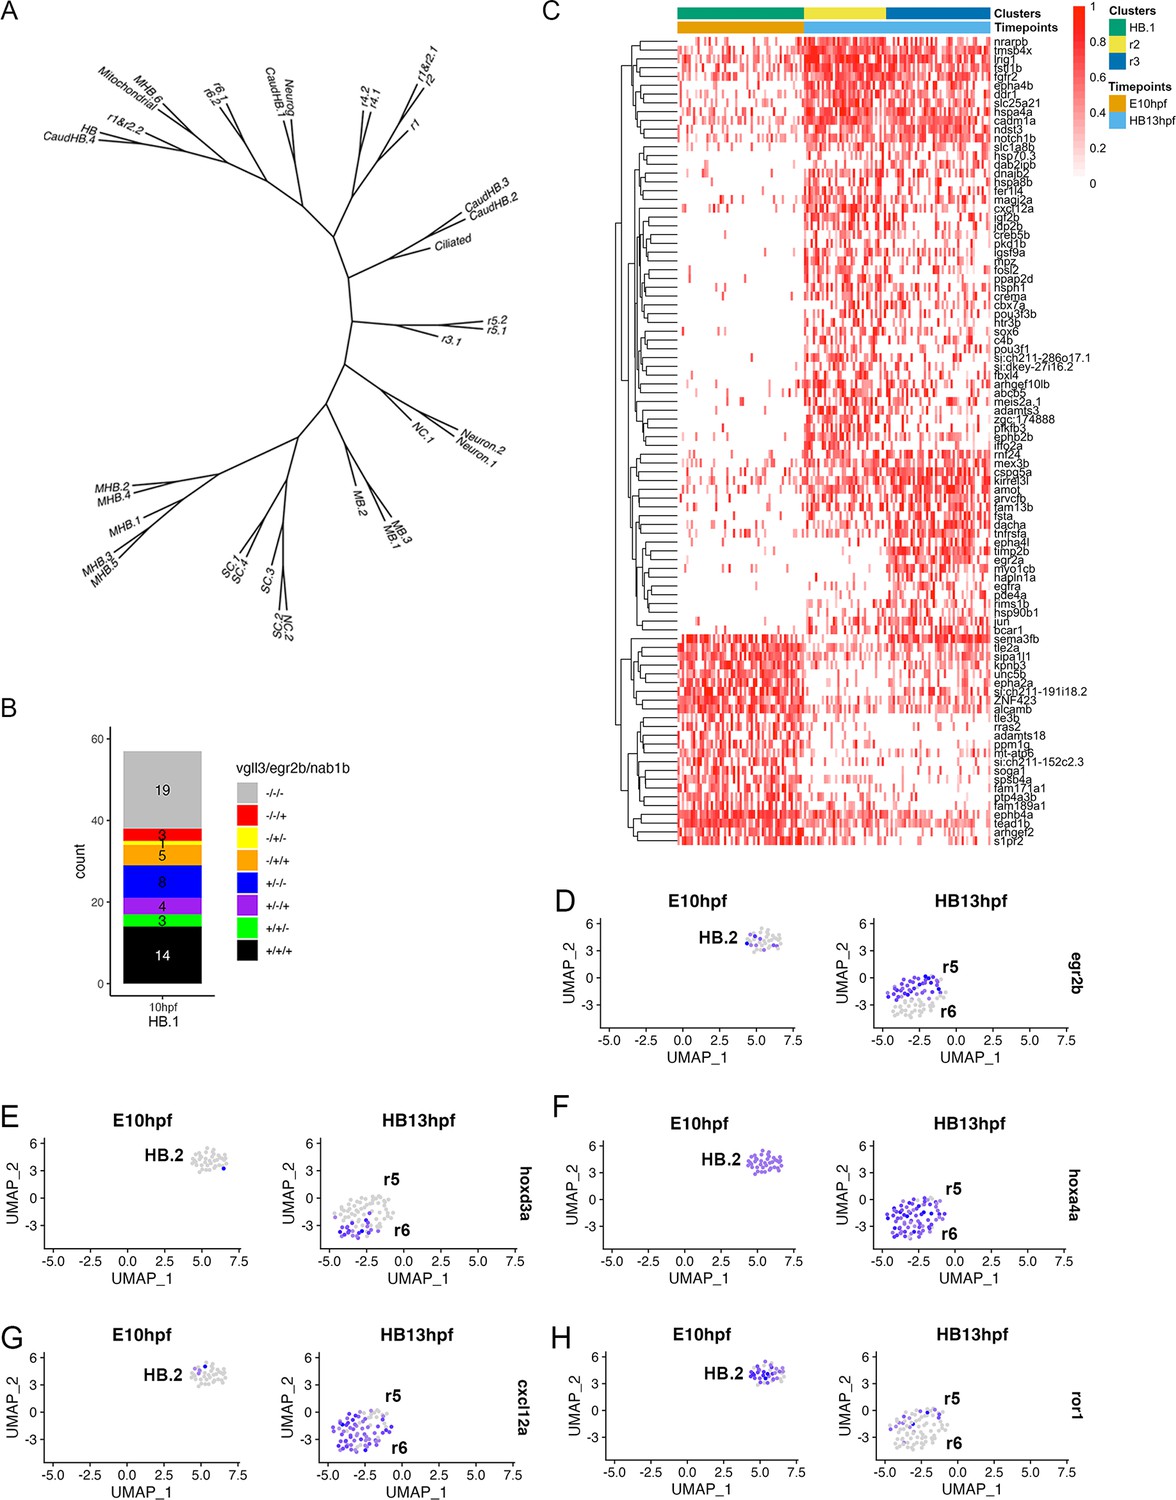
Characterization of gene expression in primary hindbrain progenitor domains (PHPDs) relative to their derivative rhombomeres.
(A). Dendrogram showing the relationship between the integrated neural clusters. (B). Co-expression of r2 markers (vgll3) and r3 markers (egr2b, nab1b) in individual cells of HB.1. Numbers in the bar graph represent cell counts. (C). Heatmap showing genes differentially expressed between HB.1 at 10hpf and its derivative rhombomeres (r2 and r3) at 13hpf. (D-H). Feature plots showing the gene expression in HB.2 at 10hpf relative to r5/r6 at 13hpf.
Figure 7 with 2 supplements
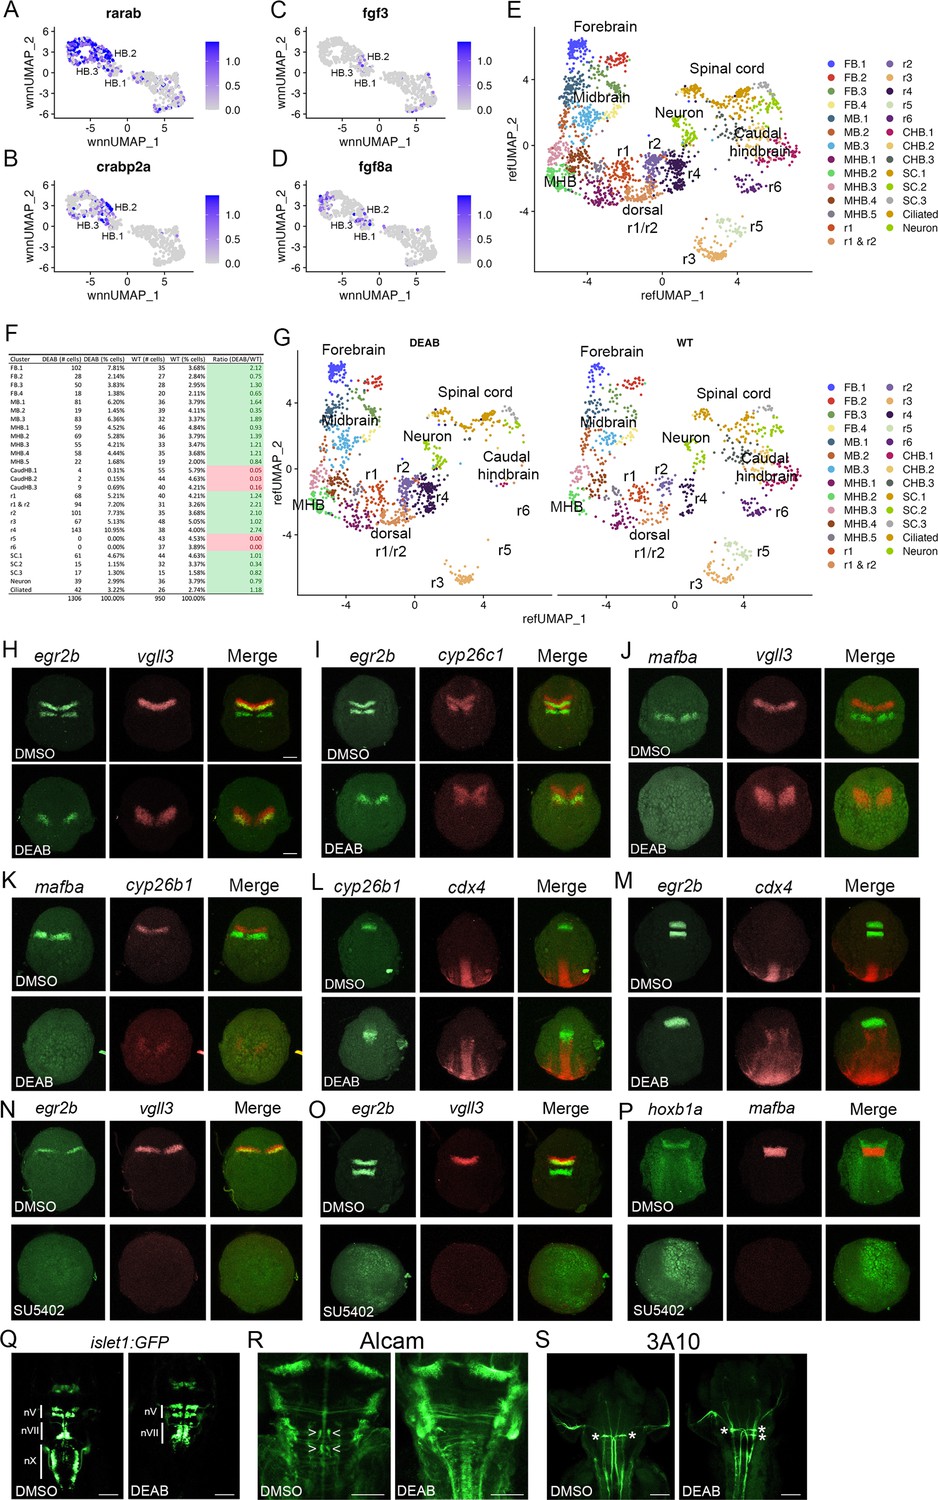
Primary hindbrain progenitor domain (PHPD) formation is controlled by morphogens.
(A-D). Feature plots showing the expression of retinoic acid (RA) and fibroblast growth factor (Fgf) signaling components at 10hpf. (E). Combined UMAP of 13hpf wild-type and DEAB-treated embryos. (F). Contribution of wild-type (WT) and DEAB-treated cells to each cluster in (E). (G). Separate UMAP projections of wild-type (right panel) and DEAB-treated (left panel) embryos at 13hpf. (H-M). Hybridization chain reaction (HCR) analysis of rhombomere-restricted gene expression in control (top panels) and DEAB-treated (bottom panels) embryos at 10-11hpf. N-P. HCR analysis of rhombomere-restricted gene expression in control (top panels) and SU5402-treated (bottom panels) embryos at 10-11hpf (N) or 12-13hpf (O–P). HCR marker gene expression: egr2b: r3/5; vgll3: r2; cyp26c1: r2/4; mafba: r5/r6; cyp26b1: r4; hoxb1a: r4; cdx4: spinal cord. (Q). Detection of branchiomotor neurons in DMSO- (left panel) and DEAB- (right panel) treated TG(isl1a:GFPrw0) transgenic embryos at 48hpf. (R, S). Immunostaining for abducens (Alcama antibody) and Mauthner (3A10 antibody) neurons in DMSO- (left panel) and DEAB- (right panel) treated embryos at 48hpf. Embryos are shown in dorsal view with anterior to the top. Scale bar in H is for panels (H-P) (100 um). Scale bars in (Q-S) are 100 um.
-
Figure 7—source data 1
Differential gene expression between control and DEAB-treated rhombomeres 1–4 at 13hpf.
- https://cdn.elifesciences.org/articles/87772/elife-87772-fig7-data1-v2.xlsx
Figure 7—figure supplement 1

scMultiome analysis of DEAB-treated 13hpf zebrafish.
(A). UMAP showing all clusters obtained from 13hpf dissected zebrafish hindbrain regions treated with DEAB. (B). Heatmap showing the expression of the top five enriched genes in each cluster. (C). Dot plot showing the expression of the top five enriched genes in each cluster.
Figure 7—figure supplement 2

DEAB treatment has a limited effect on gene expression in rhombomeres 1–4.
(A-E). Volcano plots showing differential gene expression between control and DEAB-treated cells for each rhombomere. A positive log2FC indicates higher expression in control than DEAB.
Figure 8
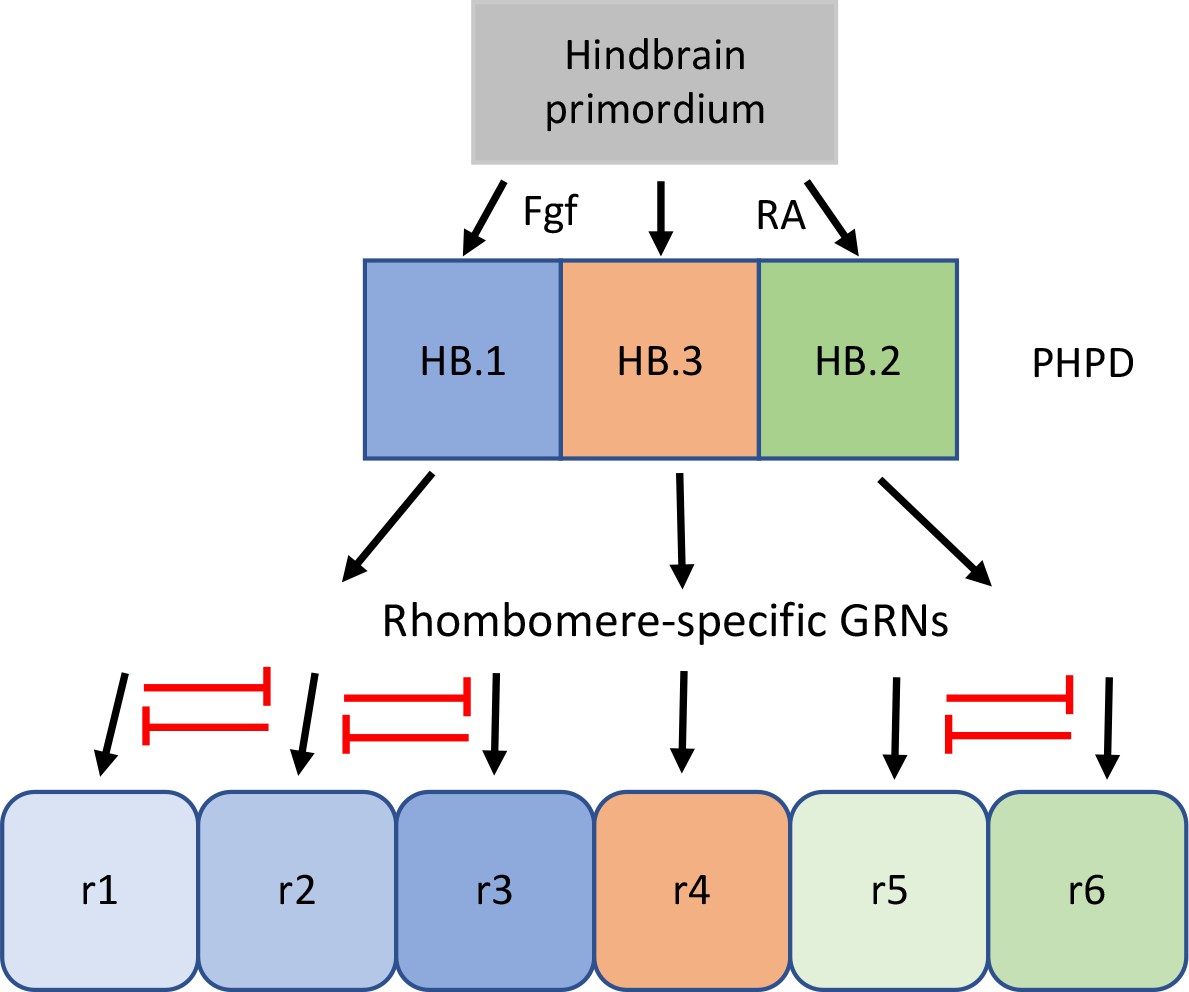
Proposed model for the transition from mixed identity primary hindbrain progenitor domain (PHPD) cells to rhombomere cells.
An early ground state that lacks an anteroposterior pattern is proposed to respond to morphogens (fibroblast growth factor (Fgf) anteriorly and retinoic acid posteriorly) to generate three PHPDs. Each PHPD contains progenitor cells with mixed identities (HB.1=r1, r2, r3; HB.2=r5, r6, HB.3=r4) that are subsequently resolved via repressive TF interactions (red lines) into rhombomere cells with a single transcriptional identity.
Tables
Key resources table
| Reagent type (species) or resource | Designation | Source or reference | Identifiers | Additional information |
|---|---|---|---|---|
| Strain, strain background (Danio rerio) | AB | Zebrafish International Resource Center | ZL1 | Wild-type zebrafish line |
| Strain, strain background (Danio rerio) | TU | Zebrafish International Resource Center | ZL57 | Wild-type zebrafish line |
| Genetic reagent (Danio rerio) | TG(hoxb1a:eGFPum8) | Choe et al., 2009 | Transgenic zebrafish line | |
| Genetic reagent (Danio rerio) | TG(isl1a:GFPrw0) | Higashijima et al., 2000 | Transgenic zebrafish line | |
| Antibody | Anti-Alcama (mouse monoclonal) | Developmental Studies Hybridoma Bank | ZN-8 | (1:1000) |
| Antibody | Anti-neurofilament antigen (mouse monoclonal) | Developmental Studies Hybridoma Bank | 3A10 | (5 ug/ml) |
| Antibody | Anti-mouse Alexa Fluor 488 (goat polyclonal) | Invitrogen | A11001 | (1:200) |
| Sequence-based reagent | cyp26c1 HCR probe | Molecular Instruments | PRK068 | 2 pmol |
| Sequence-based reagent | mafba HCR probe | Molecular Instruments | PRN449 | 2 pmol |
| Sequence-based reagent | nab1b HCR probe | Molecular Instruments | PRQ687 | 2 pmol |
| Sequence-based reagent | cyp26b1 HCR probe | Molecular Instruments | PRI299 PRR014 | 2 pmol |
| Sequence-based reagent | egr2b HCR probe | Molecular Instruments | PRM873 | 2 pmol |
| Sequence-based reagent | hoxb1a HCR probe | Molecular Instruments | PRA337 | 2 pmol |
| Sequence-based reagent | vgll3 HCR probe | Molecular Instruments | PRL721 | 2 pmol |
| Sequence-based reagent | cdx4 HCR probe | Molecular Instruments | PRN450 | 2 pmol |
| Commercial assay or kit | Chromium Next GEM Single-Cell Multiome ATAC +Gene Expression Reagent Bundle | 10 x Genomics, Inc. | 1000285 | |
| Commercial assay or kit | Chromium Next GEM Chip J Single-Cell Kit | 10 x Genomics, Inc. | 1000234 | |
| Chemical compound, drug | BI protease | Sigma | P5380 | (10 mg/ml) |
| Chemical compound, drug | DEAB | Sigma | D86256 | (5 uM) |
| Chemical compound, drug | SU5402 | Abcam | Ab141368 | 10 uM |
| Software, algorithm | Seurat | CRAN/open source; Hao et al., 2021 | https://satijalab.org/seurat/ | |
| Software, algorithm | Signac | CRAN/open source; Stuart et al., 2021 | https://stuartlab.org/signac/ | |
| Software, algorithm | DIRECT-NET | Github/open source; Zhang et al., 2022; Zhang, 2023 | https://github.com/zhanglhbioinfor/DIRECT-NET | |
| Software, algorithm | 10 X Genomics Arc 1.0.1 | 10 X Genomics, Zheng et al., 2017; Satpathy et al., 2019 | https://www.10xgenomics.com/ | |
| Software, algorithm | Cytoscape | Cytoscape, Shannon et al., 2003 | https://cytoscape.org/ |
Additional files
Download links
A two-part list of links to download the article, or parts of the article, in various formats.
Downloads (link to download the article as PDF)
Open citations (links to open the citations from this article in various online reference manager services)
Cite this article (links to download the citations from this article in formats compatible with various reference manager tools)
scMultiome analysis identifies embryonic hindbrain progenitors with mixed rhombomere identities
eLife 12:e87772.
https://doi.org/10.7554/eLife.87772


