Deterministic genetic barcoding for multiplexed behavioral and single-cell transcriptomic studies
- University of Minnesota Genomics Center, Minneapolis, United States
- Department of Genetics, Cell Biology, and Development, University of Minnesota, United States
Figures
Figure 1 with 1 supplement
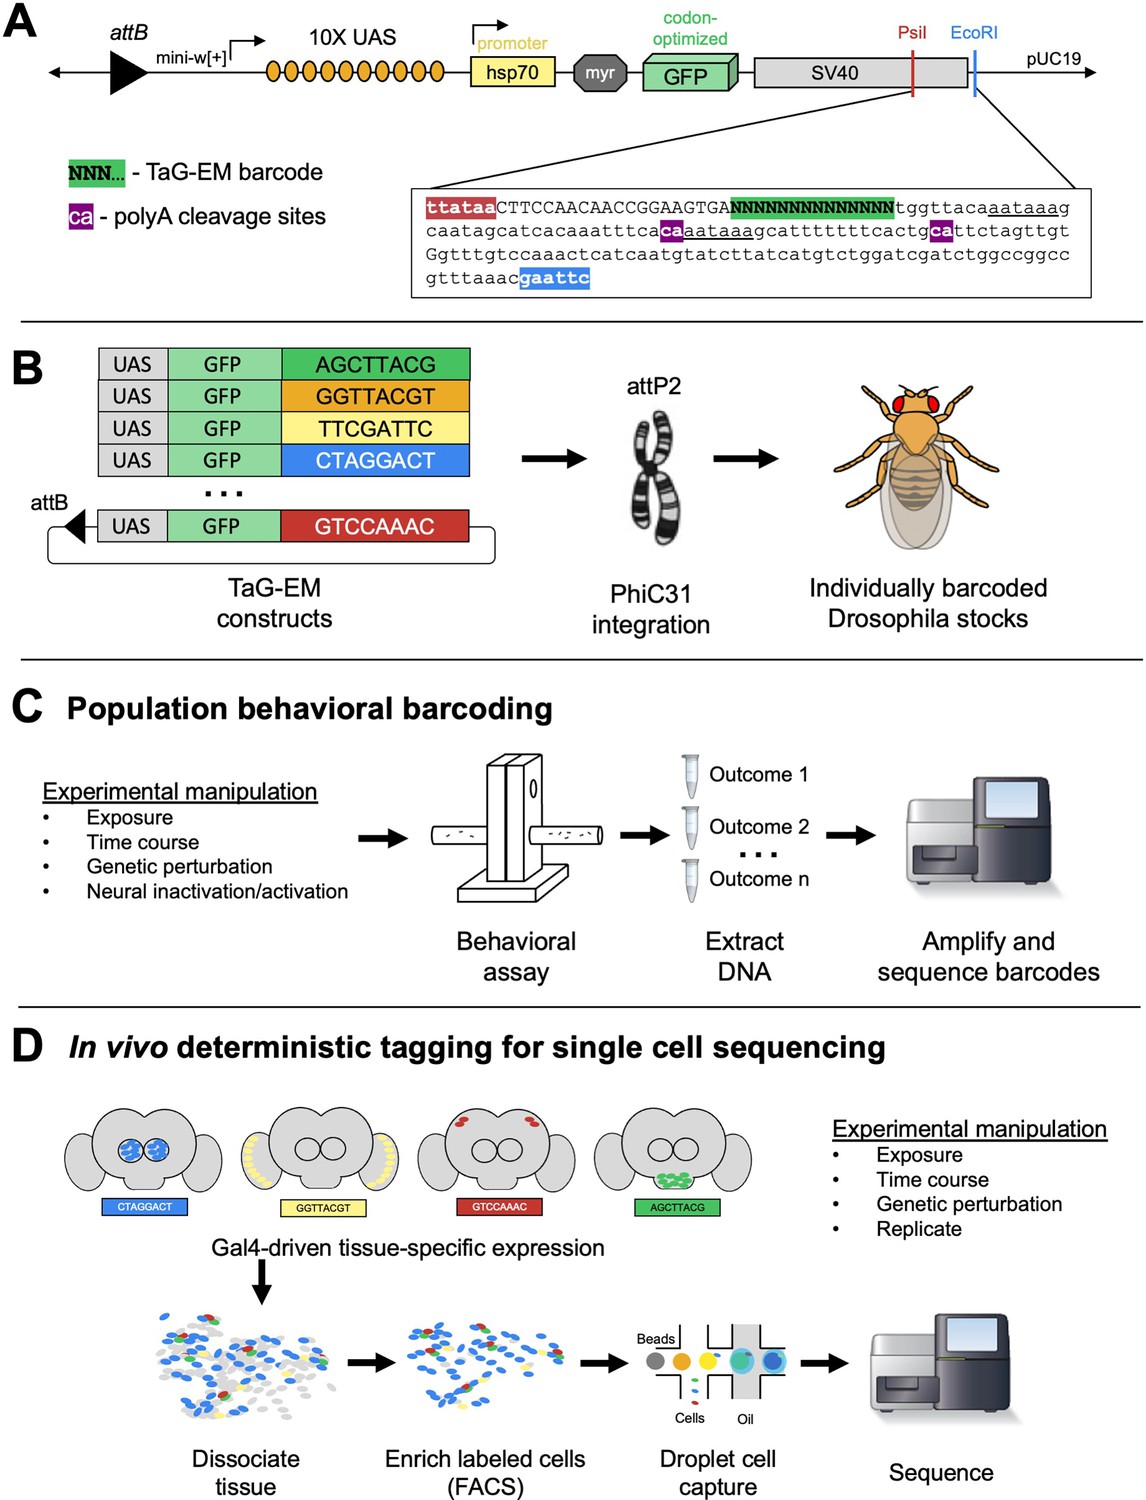
Overview of TaG-EM system.
(A) Detailed view of the 3’ UTR of the TaG-EM constructs showing the position of the 14 bp barcode sequence (green highlight) relative to the polyadenylation signal sequences (underlined) and poly-A cleavage sites (purple highlights). The pJFRC12 backbone schematic is modified with permission from an unpublished schematic made by Barret Pfeiffer. (B) Schematic illustrating the design of the TaG-EM constructs, where a barcode sequence is inserted in the 3’ UTR of a UAS-GFP construct and inserted in a specific genomic locus using PhiC31 integrase. (C) Use of TaG-EM barcodes for sequencing-based population behavioral assays. (D) Use of TaG-EM barcodes expressed with tissue-specific Gal4 drivers to label cell populations in vivo upstream of cell isolation and single-cell sequencing.
Figure 1—figure supplement 1
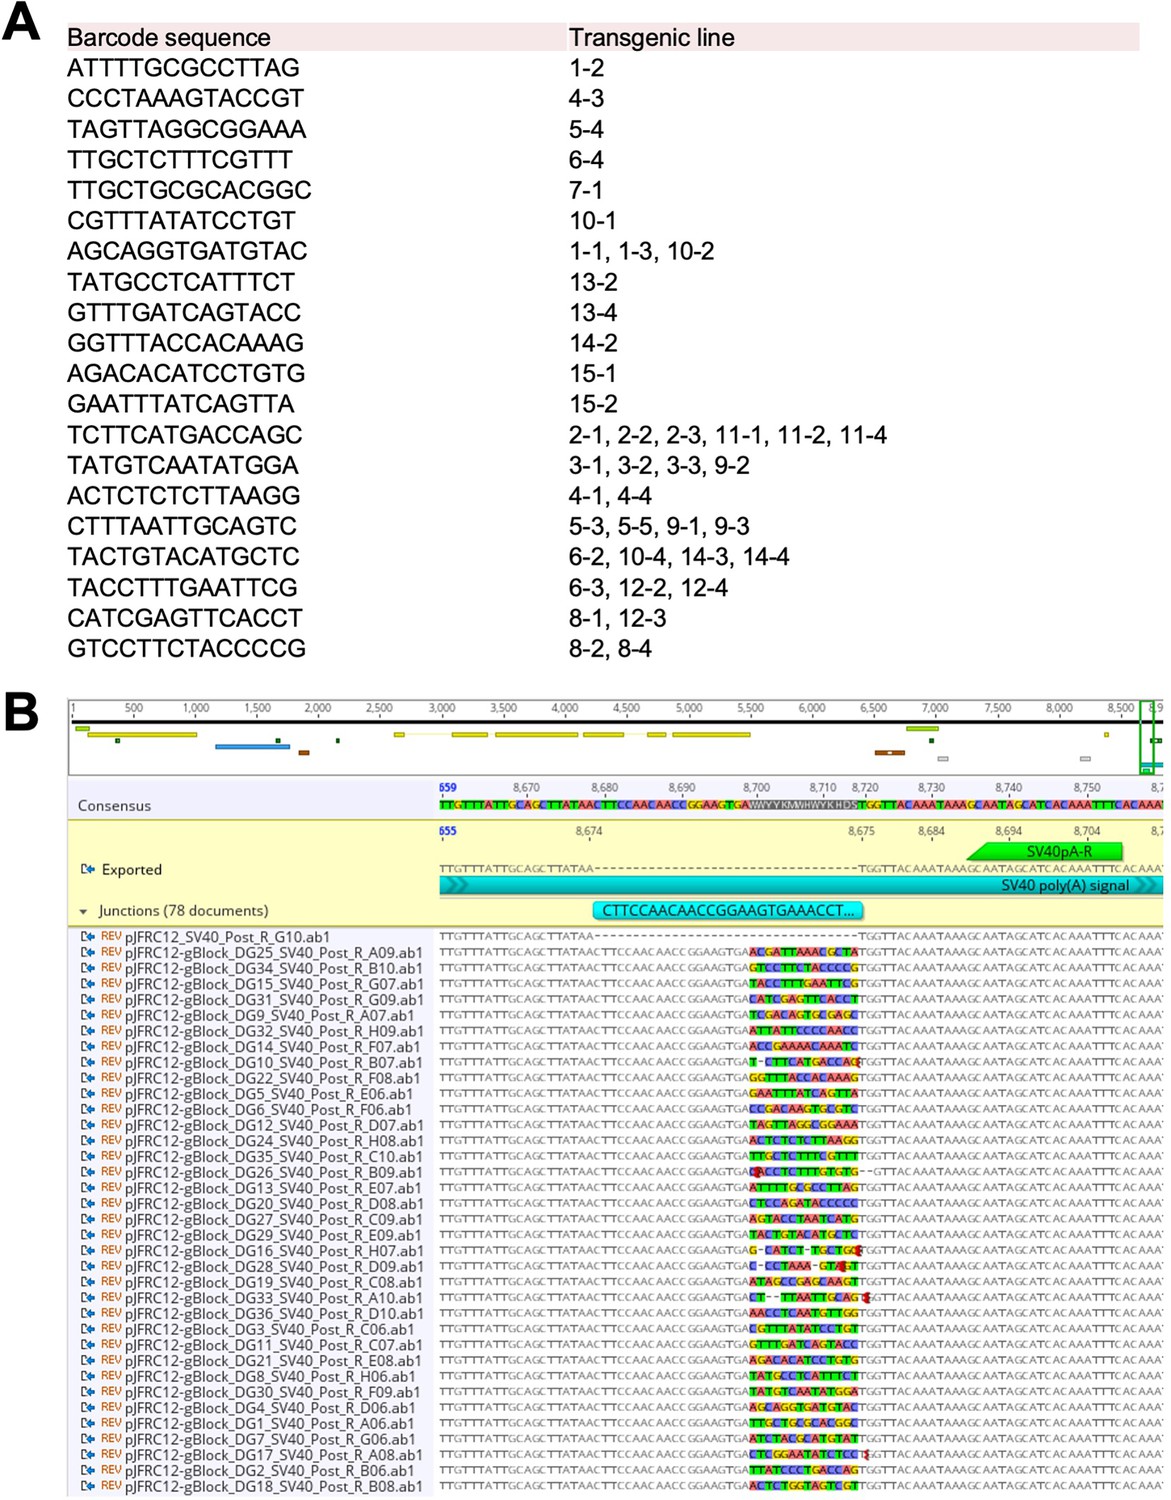
Sanger sequencing identification of TaG-EM barcode lines.
(A) Summary of barcode pool injections. Barcode sequence and transgenic vial identifier in which the barcode was identified are shown. (B) Sanger sequencing-based confirmation of the barcode sequence and PCR handle in TaG-EM transgenic lines. Because the TaG-EM barcode constructs were injected as a pool of 29 purified plasmids, some of the transgenic lines had inserts of the same construct. In total 20 unique lines were recovered from this round of injection.
Figure 2 with 2 supplements
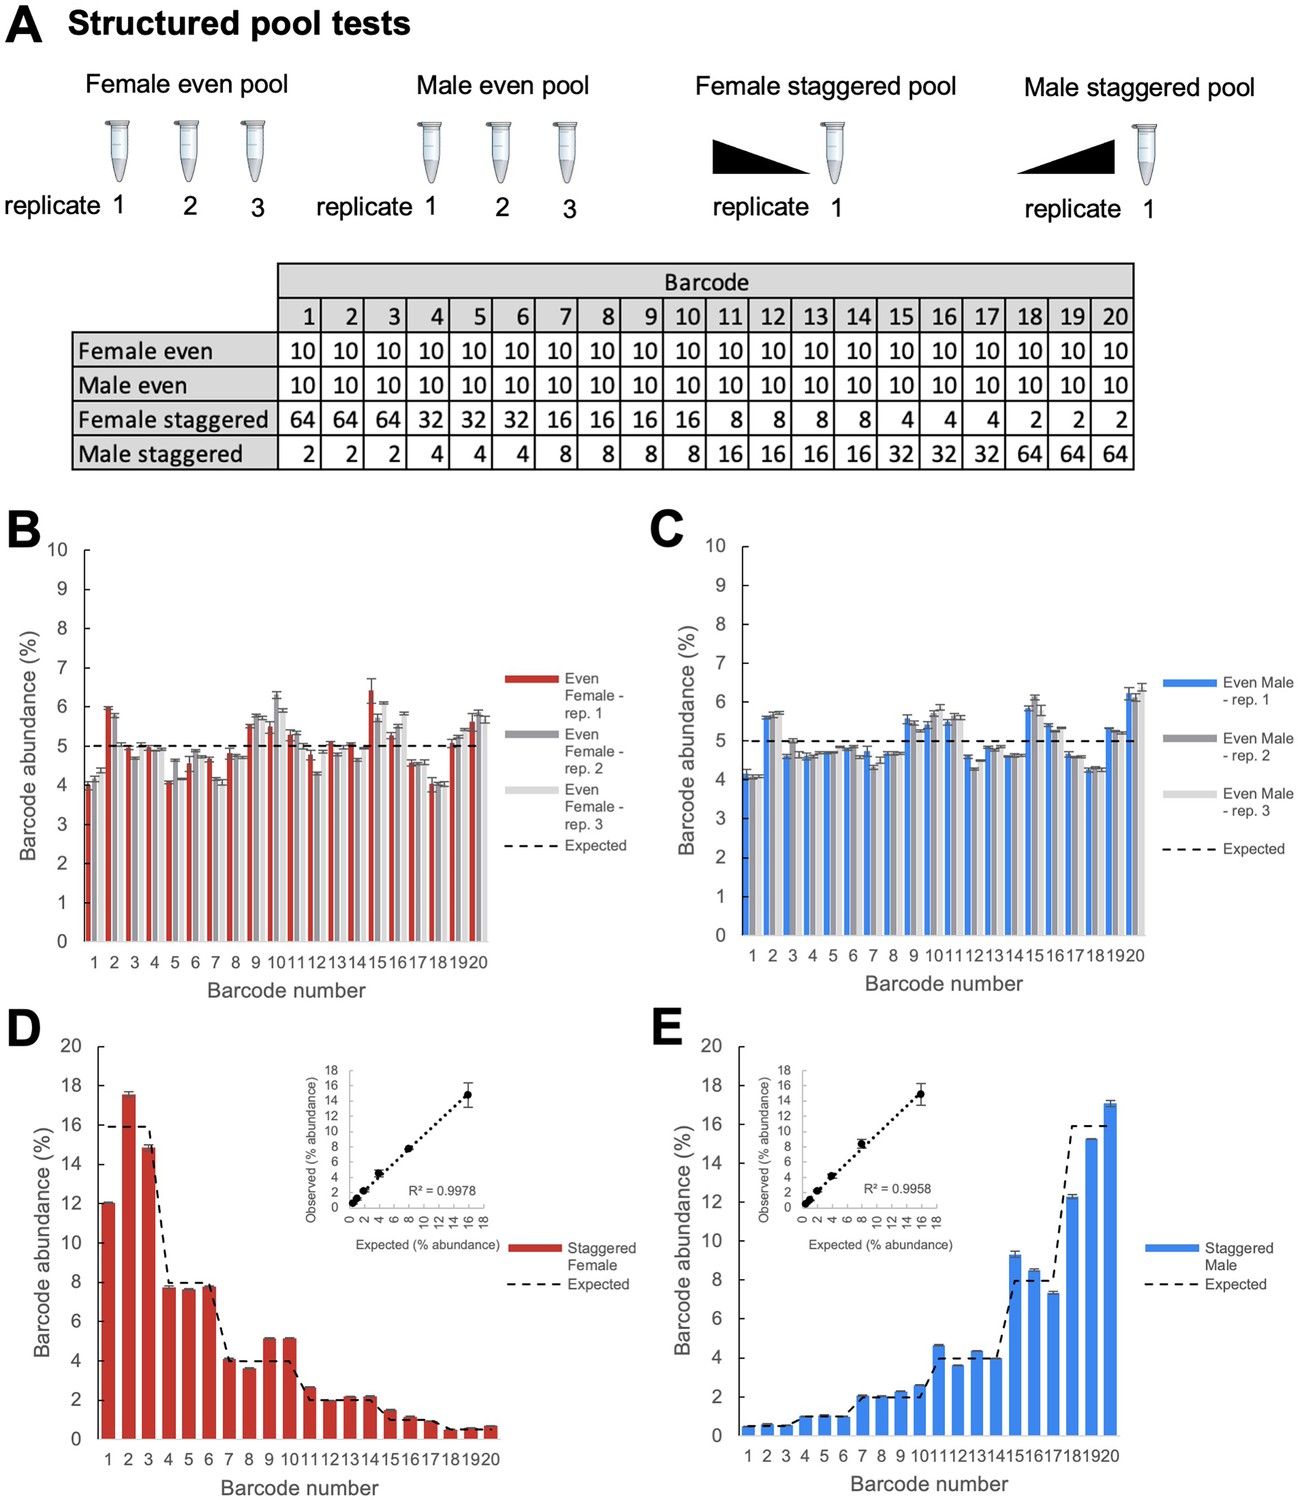
Structured pool tests.
(A) Overview of the construction of the structured pools for assessing the quantitative accuracy of TaG-EM barcode measurements. Male and female even pools were constructed and extracted in triplicate. The table shows the number of flies that were pooled for each experimental condition. (B) Barcode abundance data for three independent replicates of the female even pool. (C) Barcode abundance data for three independent replicates of the male even pool. (D) Barcode abundance data for the female staggered pool. Inset plot shows the average observed barcode abundance among lines pooled at each level compared to the expected abundance. (E) Barcode abundance data for the male staggered pool. Inset plot shows the average observed barcode abundance among lines pooled at each level compared to the expected abundance. For all plots, bars indicate the mean barcode abundance for three technical replicates of each pool, error bars are +/-S.E.M.
Figure 2—figure supplement 1
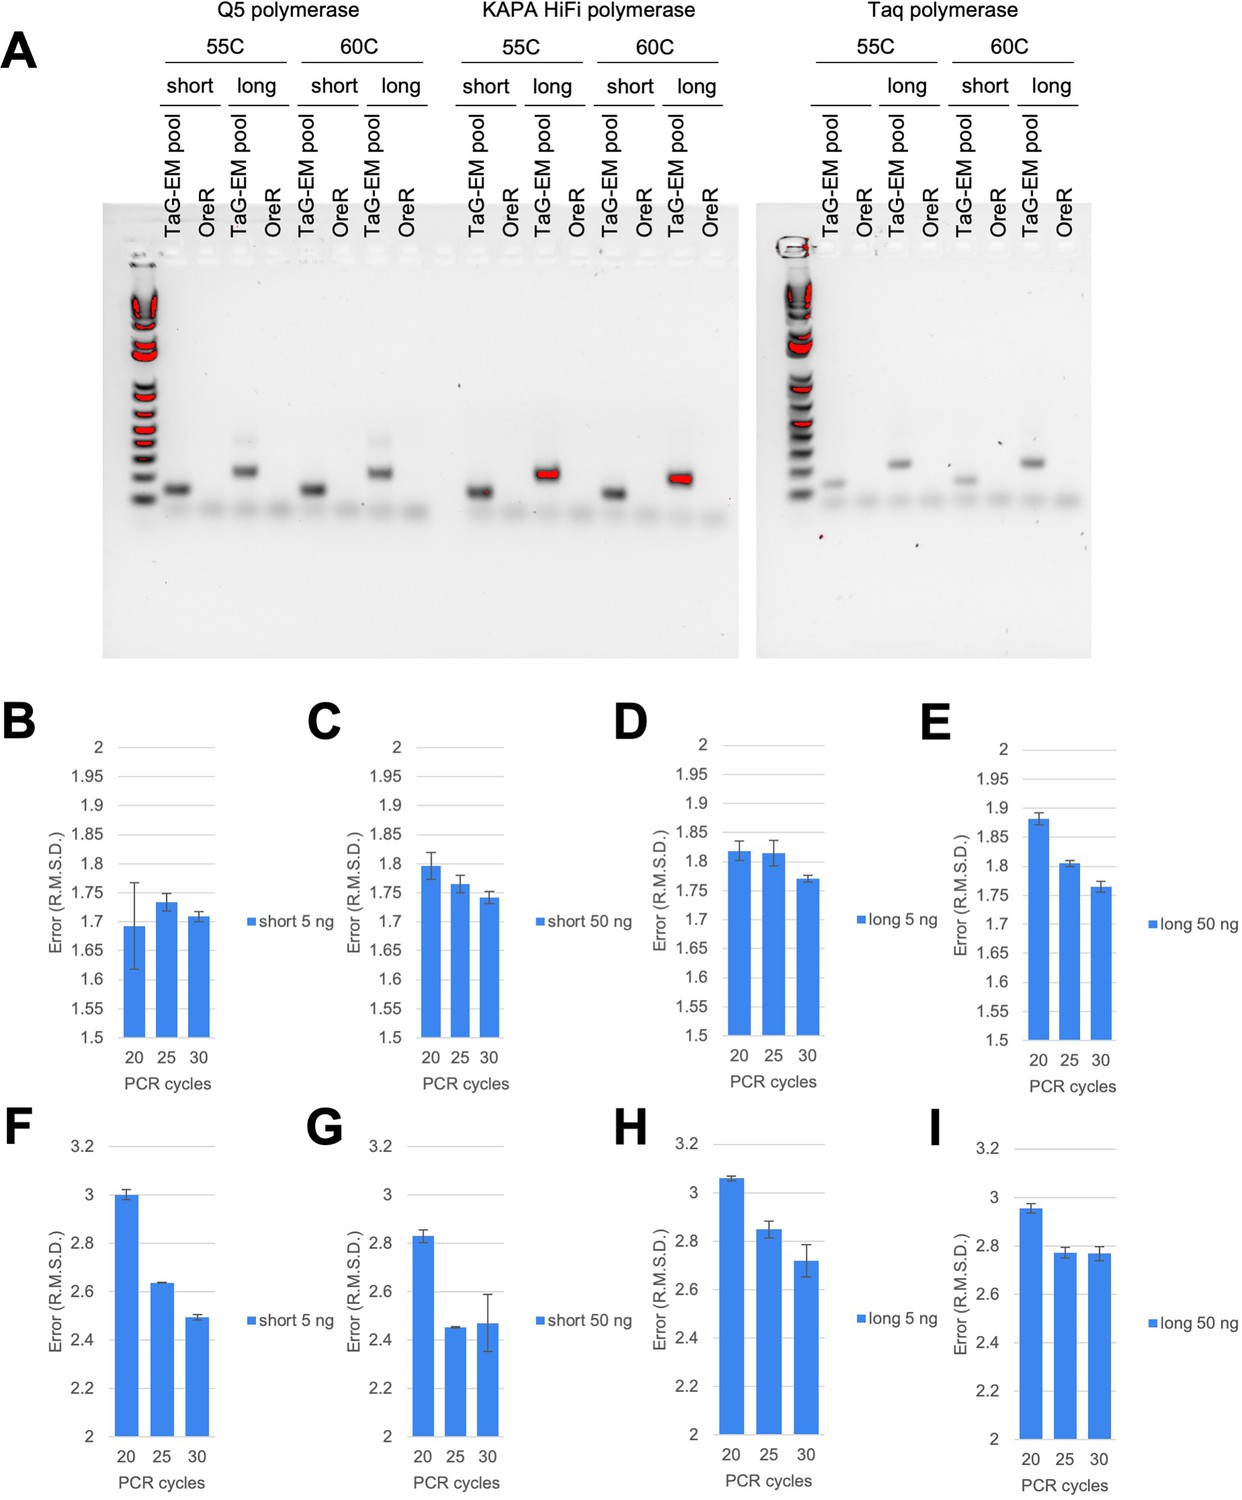
Optimization of TaG-EM barcode amplification.
(A) Gels showing bands produced when amplifying TaG-EM flies or a wild type control with the indicated polymerase, annealing temperature, and primer pair (short = B2_3'F1_Nextera/ SV40_pre_R_Nextera; long = B2_3'F1_Nextera/ SV40_post_R_Nextera). The leftmost lanes correspond to the 1 kb Plus DNA ladder (Invitrogen). (B–E) Mean error (R.M.S.D. root mean squared deviation from expected value) for even pool amplified with the indicated primer set, input amount, and cycle number using KAPA HiFi polymerase (n=3, error bars are +/-S.E.M.). (F–G) Mean error (R.M.S.D. root mean squared deviation from expected value) for staggered pool amplified with the indicated primer set, input amount, and cycle number using KAPA HiFi polymerase (n=3 technical replicates, error bars are +/-S.E.M.).
-
Figure 2—figure supplement 1—source data 1
Uncropped gel images with labels for data displayed in Figure 2—figure supplement 1A.
- https://cdn.elifesciences.org/articles/88334/elife-88334-fig2-figsupp1-data1-v1.zip
-
Figure 2—figure supplement 1—source data 2
Original files for gel images displayed in Figure 2—figure supplement 1A.
- https://cdn.elifesciences.org/articles/88334/elife-88334-fig2-figsupp1-data2-v1.zip
Figure 2—figure supplement 2
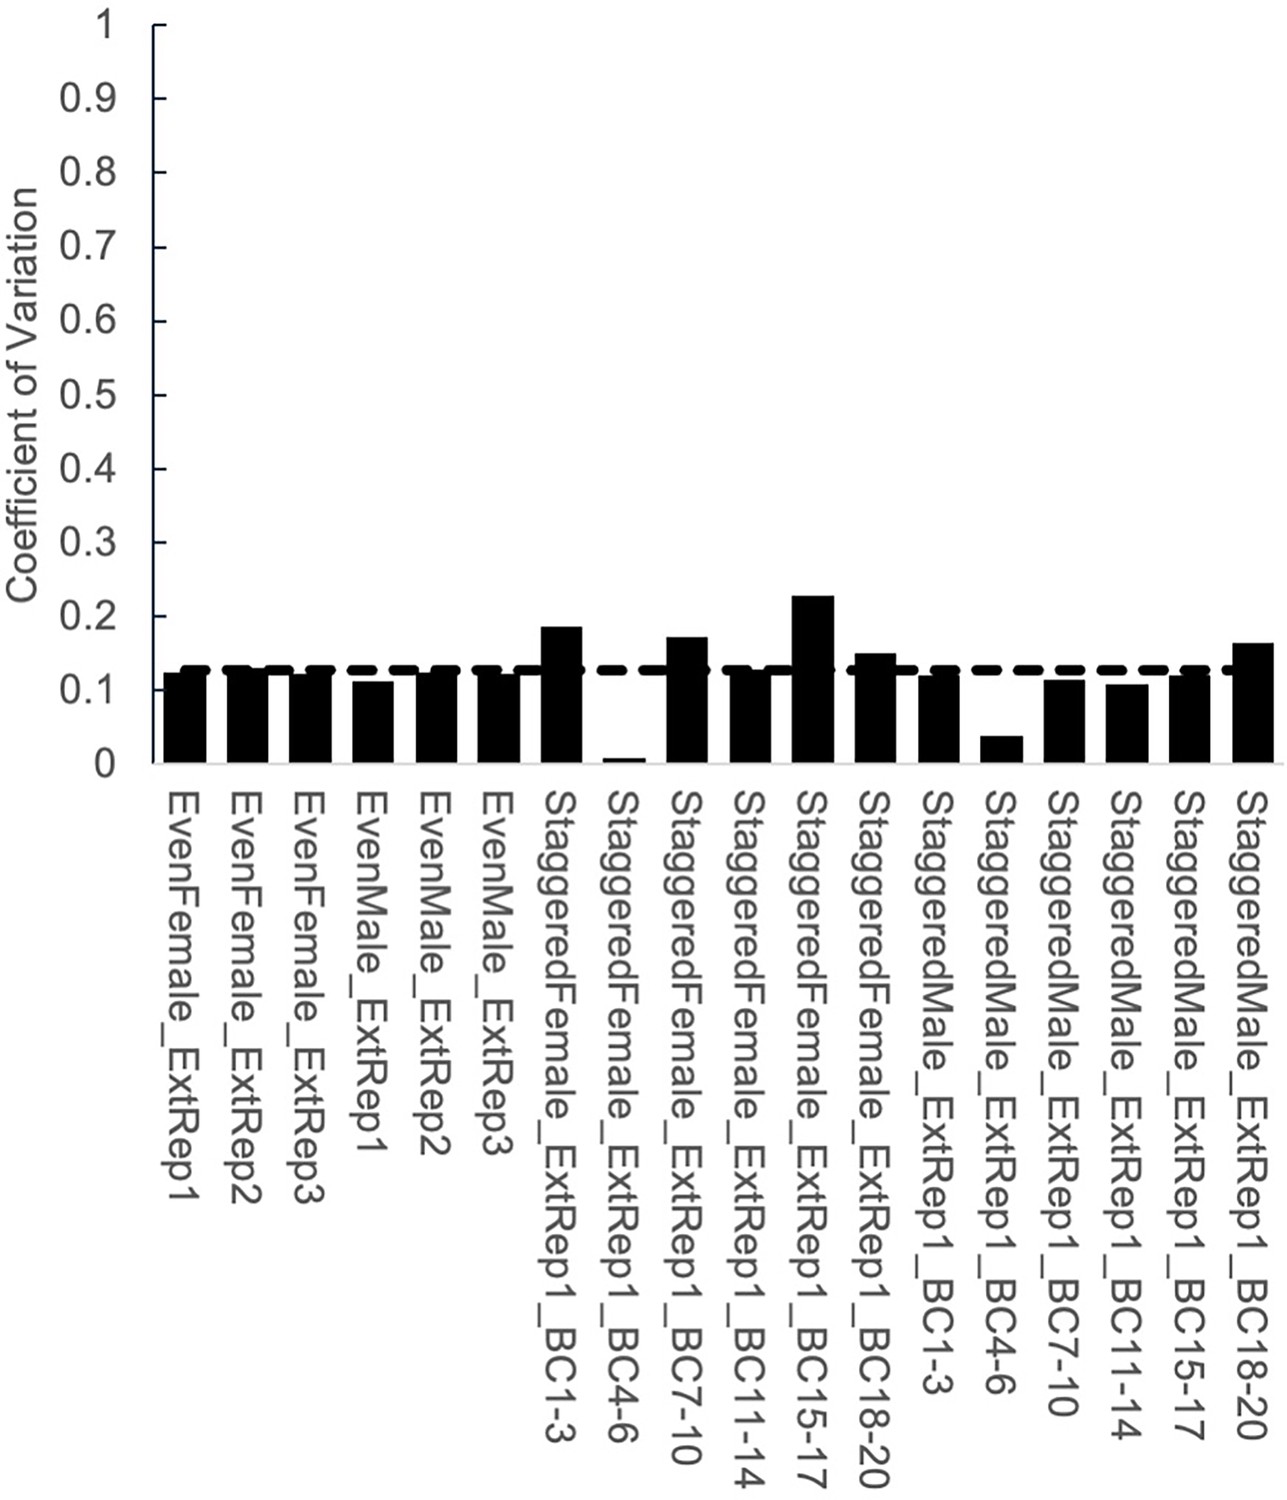
Coefficient of variation for TaG-EM structured pools.
Plot showing coefficient of variation for different groups of TaG-EM barcodes in the structured pools. Dashed line indicates the mean coefficient of variation across all conditions.
Figure 3 with 3 supplements
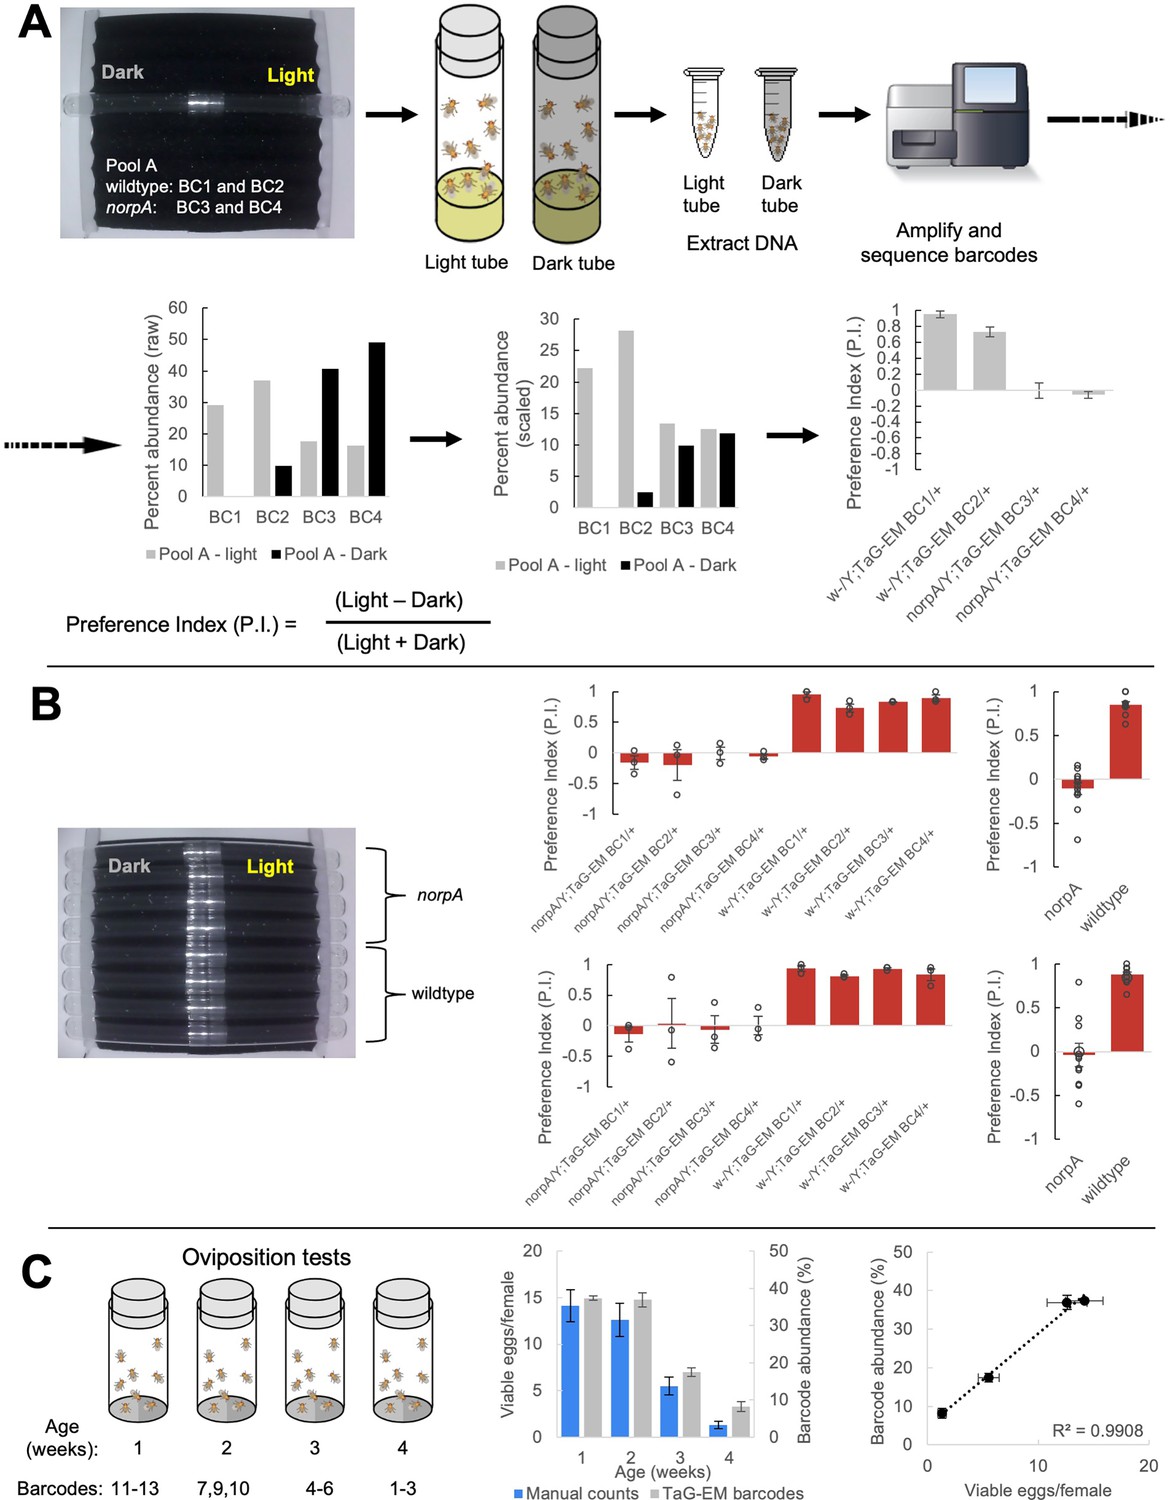
TaG-EM barcode-based behavioral measurements.
(A) TaG-EM barcode lines in either a wild-type or norpA background were pooled and tested in a phototaxis assay. After 30 s of light exposure, flies in tubes facing the light or dark side of the chamber were collected, DNA was extracted, and TaG-EM barcodes were amplified and sequenced. Barcode abundance values were scaled to the number of flies in each tube and used to calculate a preference index (P.I.). Average P.I. values for four different TaG-EM barcode lines in both the wild-type and norpA backgrounds are shown (n=3 biological replicates, error bars are +/-S.E.M.). (B) The same eight lines used for the sequencing-based TaG-EM barcode measurements were independently tested in the phototaxis assay and manually scored videos were used to calculate a P.I. for each genotype. Average P.I. values for each line are shown (n=3 biological replicates, error bars are +/-S.E.M.) for TaG-EM-based quantification (top) and manual video-based quantification (bottom). (C) Flies carrying different TaG-EM barcodes were collected and aged for 1 to 4 weeks and then eggs were collected, and egg number and viability was manually scored for each line. In parallel, the barcoded flies from each timepoint were pooled, and eggs were collected, aged, and DNA was extracted, followed by TaG-EM barcode amplification and sequencing. Average number of viable eggs per female (manual counts) and average barcode abundance are shown both as a bar plot and scatter plot (n=3 biological replicates for 3 barcodes per condition, error bars are +/-S.E.M.).
Figure 3—figure supplement 1

Oviposition tests with TaG-EM barcode lines.
Plots showing mean TaG-EM barcode abundance for adult females used in oviposition experiments (top) and eggs collected from these females (bottom). Data from two independent trials is shown (n=3 biological replicates for each trial, error bars are +/-S.E.M.). Dashed lines indicate the expected abundance values.
Figure 3—figure supplement 2
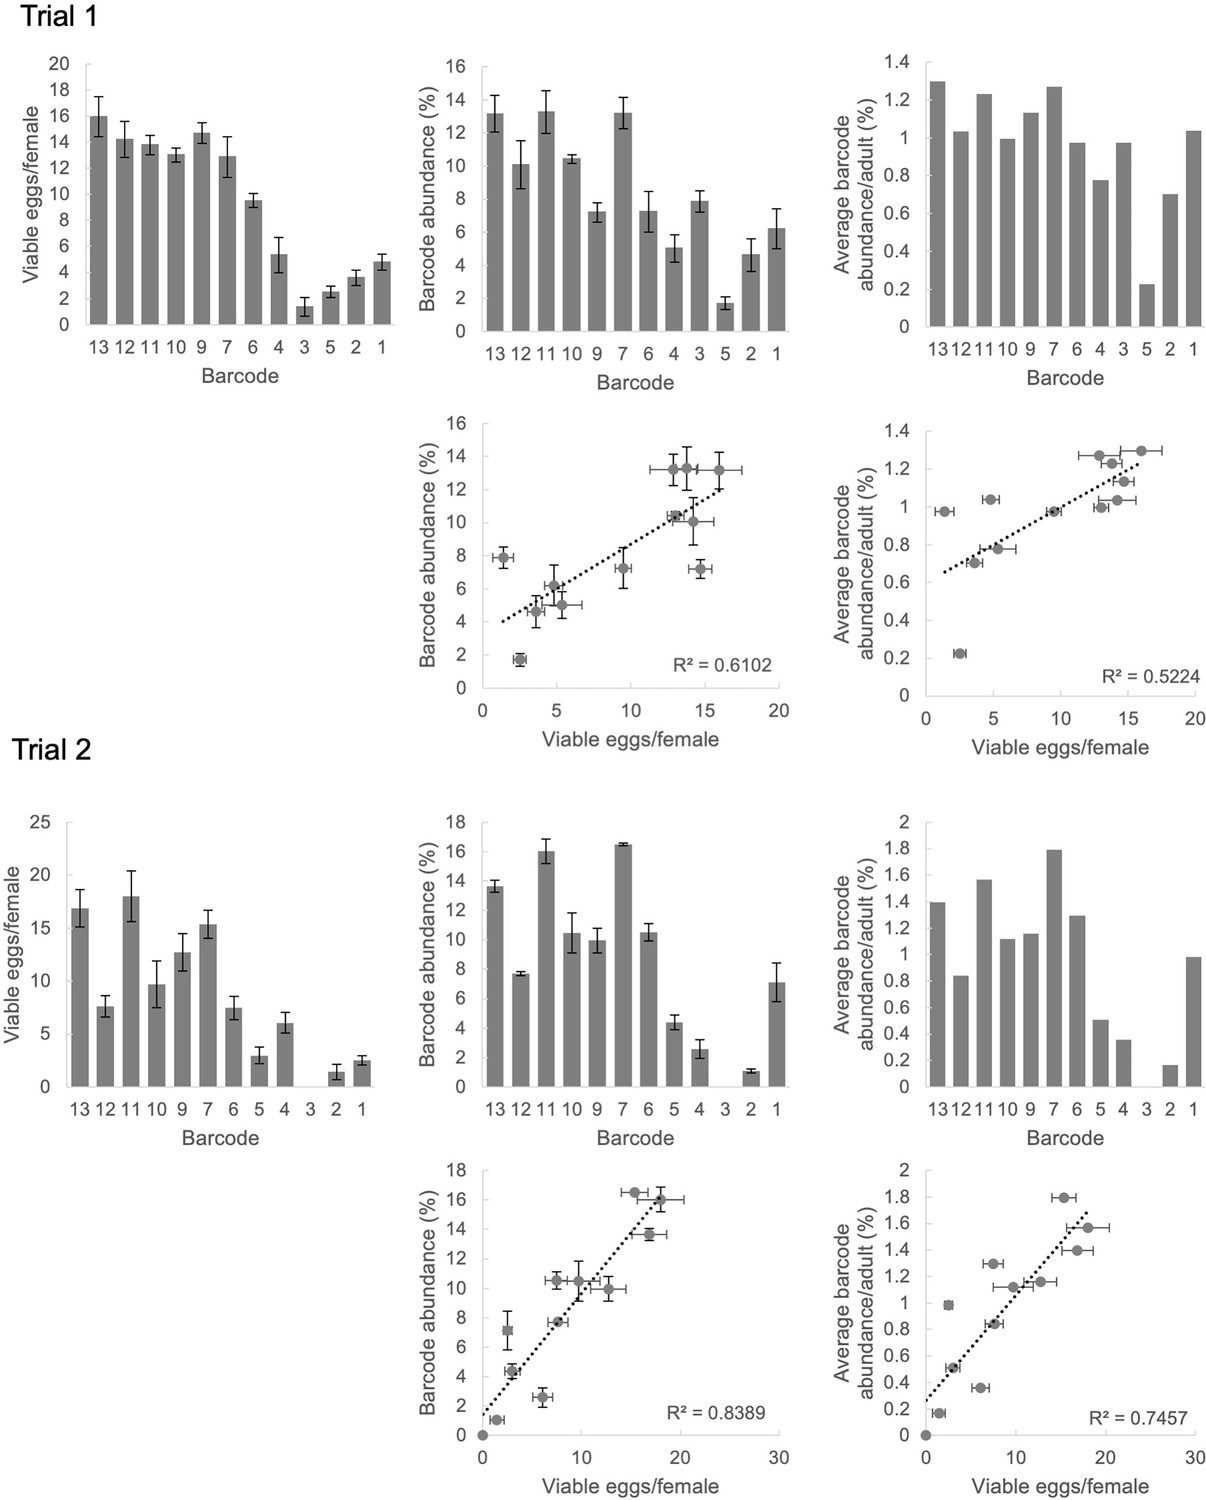
Fecundity data for individual TaG-EM lines.
Manually collected data for mean number of viable eggs per female, barcode abundance data, and barcode abundance data normalized to adult fly barcode data for each of the TaG-EM barcode lines used in the age-dependent fecundity experiment. Scatterplots show correlations between manually collected data and barcode sequencing results. Data from two independent trials is shown (n=3 biological replicates for each trial, error bars are +/-S.E.M.).
Figure 3—figure supplement 3
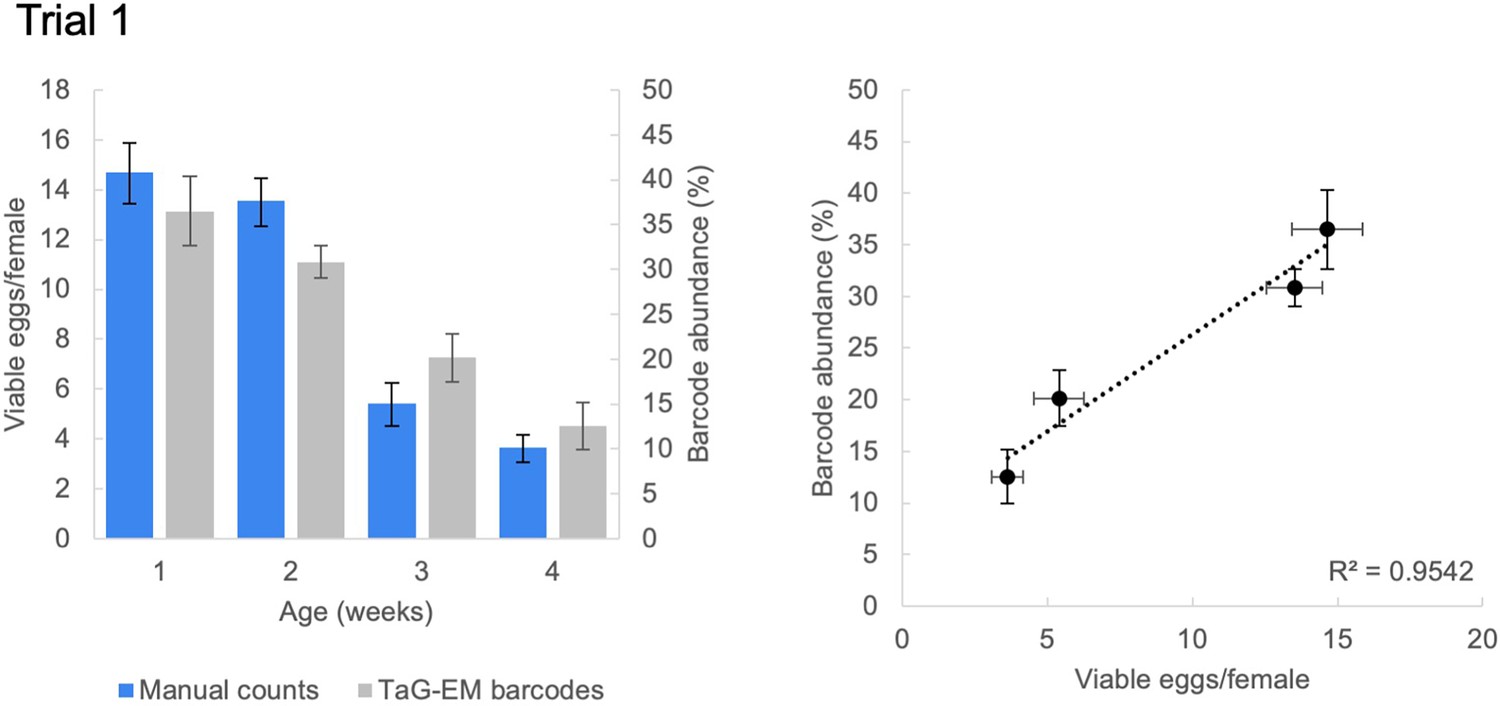
Average age-dependent fecundity data for Trial 1.
Average number of viable eggs per female (manual counts) and average barcode abundance are shown both as a bar plot and scatter plot (n=3 biological replicates for 3 barcodes per condition, error bars are +/-S.E.M.). Data from Trial 2 is shown in Figure 3C.
Figure 4 with 2 supplements
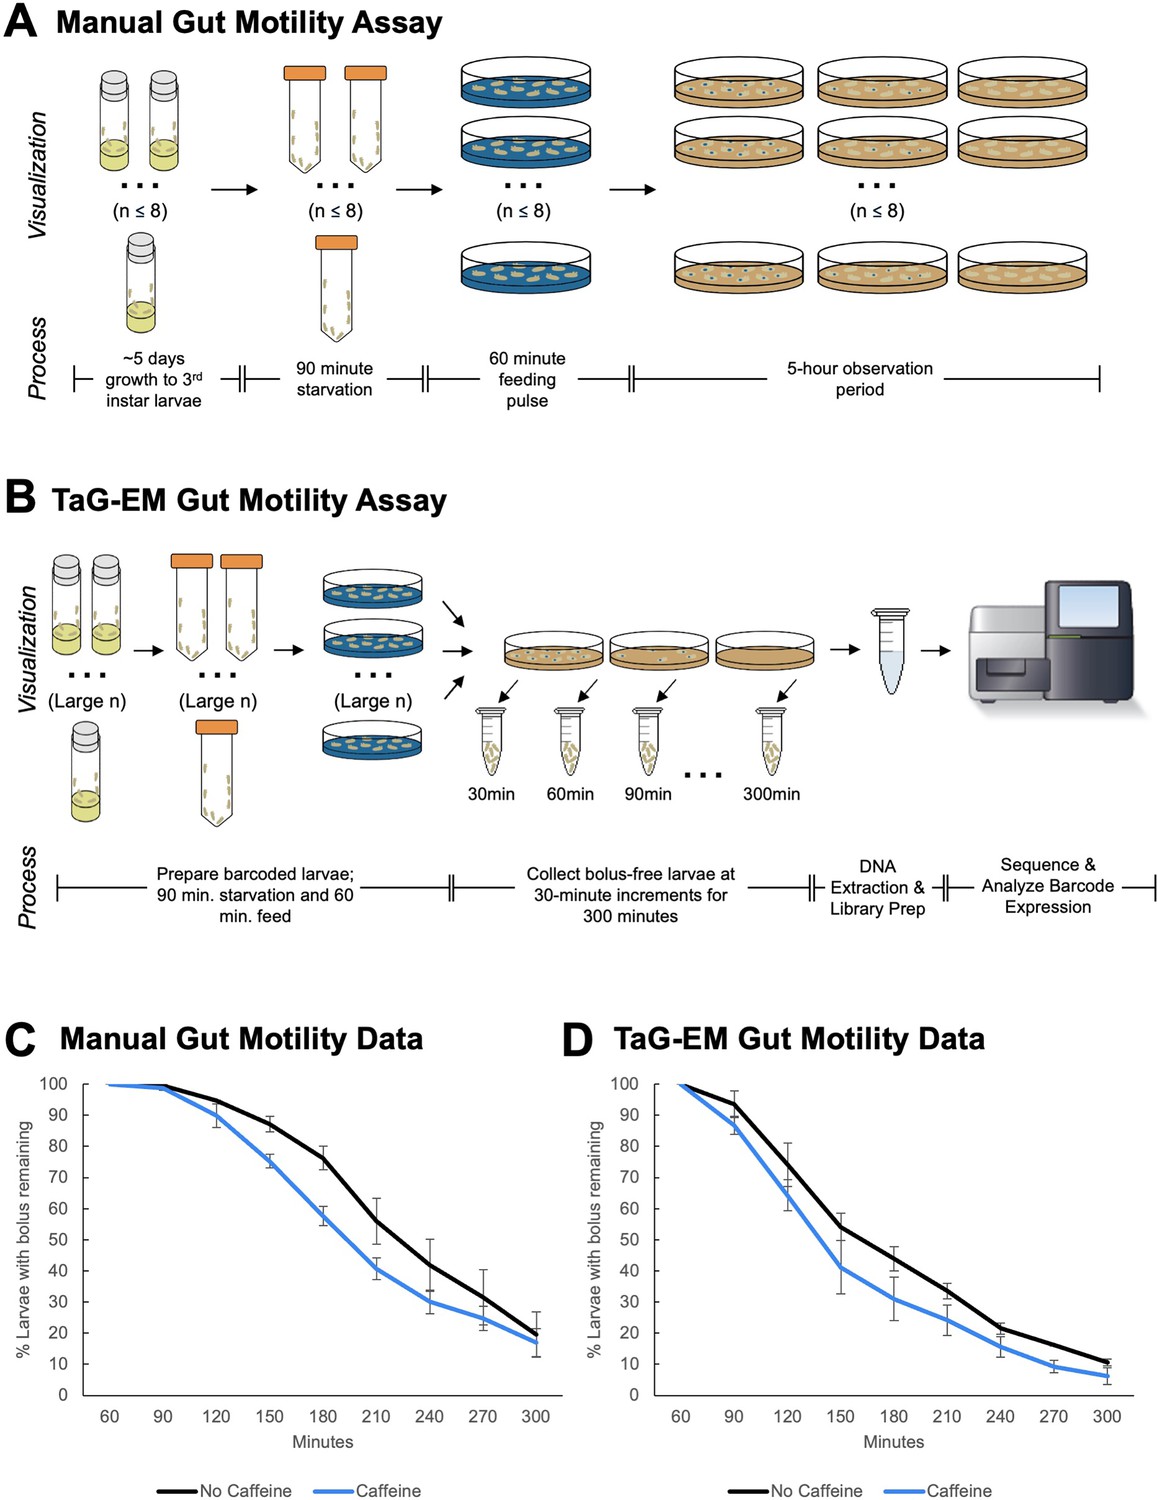
TaG-EM barcode-based quantification of larval gut motility.
Schematics depicting (A) manual and (B) TaG-EM-based assays for quantifying food transit time in Drosophila larvae. (C) Transit time of a food bolus in the presence and absence of caffeine measured using the manual assay (p=0.0340). (D) Transit time of a food bolus in the presence and absence of caffeine measured using the TaG-EM assay (p=0.0488). n=3 biological replicates for each condition. A modified Chi-squared method was used for statistical testing (Hristova and Wimley, 2023).
Figure 4—figure supplement 1
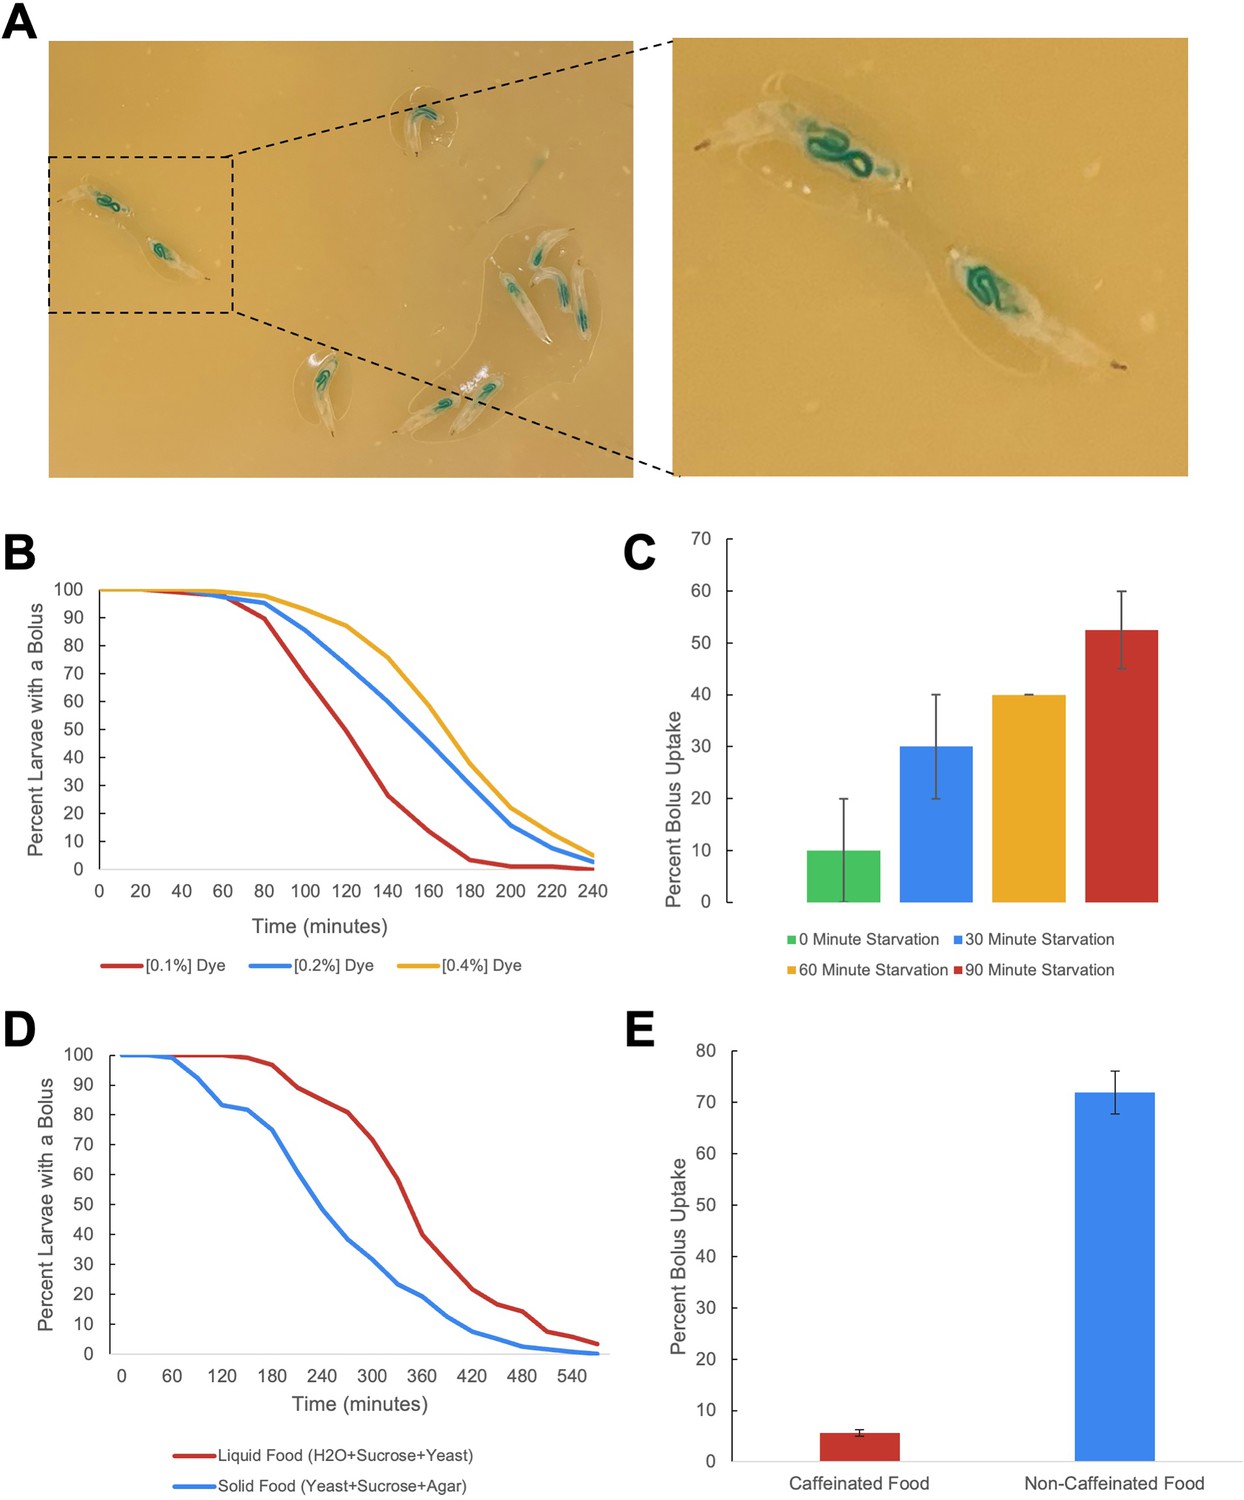
Larval gut motility assay parameters.
(A) Images of larvae fed with blue-dyed yeast agar. (B) Effect of dye concentration on food transit time. (C) Effect of starvation time on feeding and uptake of the dyed food bolus (n=3 biological replicates for each trial, error bars are +/-S.E.M.). (D) Effect of liquid versus solid diet on food transit time. (E) Aversive effect of caffeine on food bolus uptake (n=2 biological replicates for each trial, error bars are +/-S.E.M.).
Figure 4—figure supplement 2
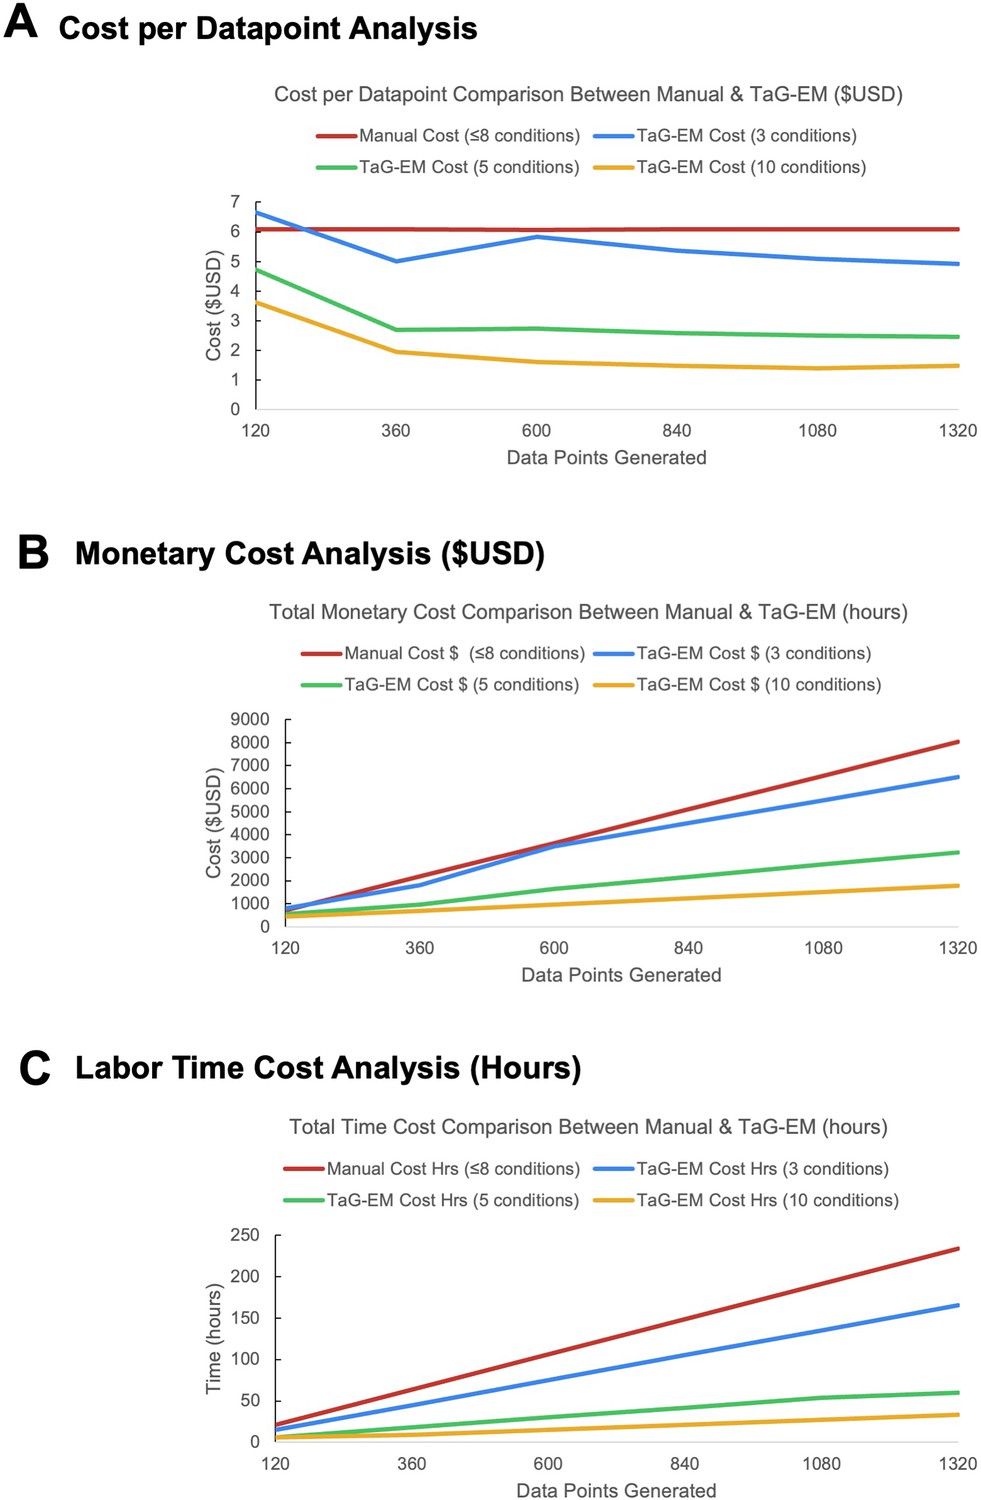
Cost comparisons for manual and TaG-EM gut motility assays.
(A) Cost per data point as a function of the number of data points generated and the number of experimental conditions screened. (B) Overall experiment cost and (C) labor effort as a function of the number of data points generated and the number of experimental conditions screened.
Figure 5 with 2 supplements
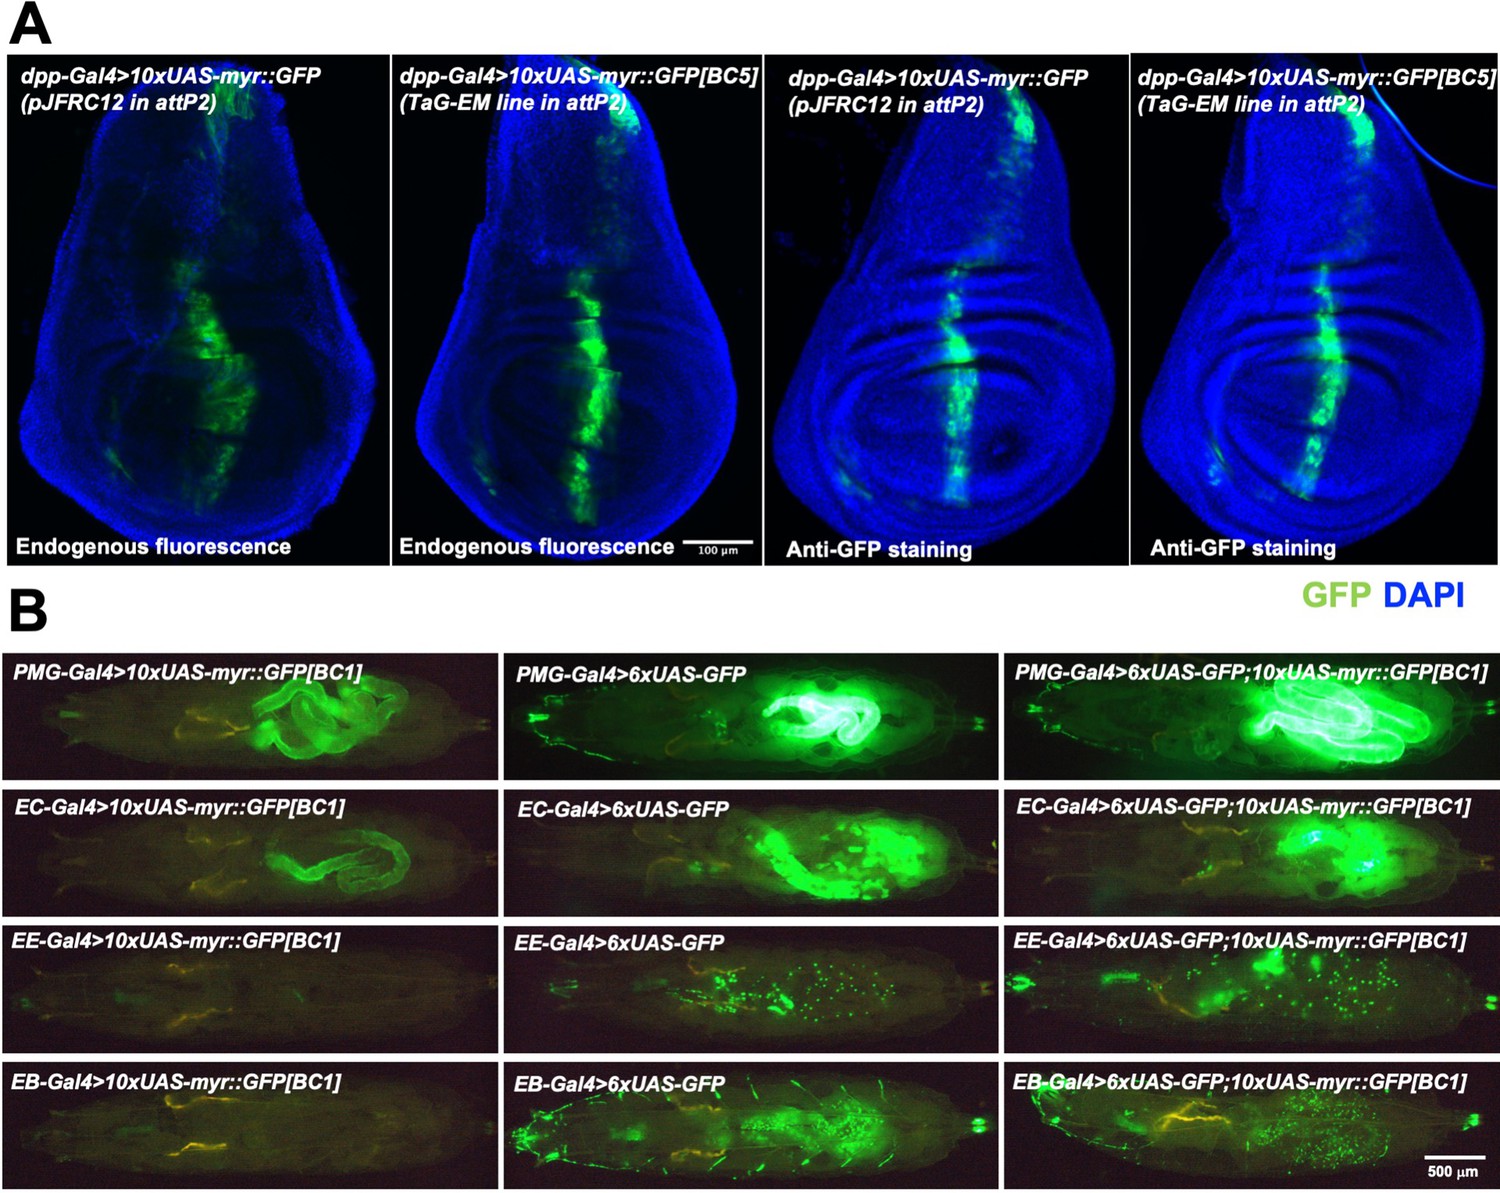
Gal4-driven expression of GFP from TaG-EM lines.
(A) Comparison of endogenous GFP expression and GFP antibody staining in the wing imaginal disc for the original pJFRC12 construct inserted in the attP2 landing site or for a TaG-EM barcode line driven by dpp-Gal4. Wing discs are counterstained with DAPI. (B) Endogenous expression of GFP from either a TaG-EM barcode construct (left column), a hexameric GFP construct (middle column), or a line carrying both a TaG-EM barcode construct and a hexameric GFP construct (right column) driven by the indicated gut driver line (PMG-Gal4: Pan-midgut driver; EC-Gal4: Enterocyte driver; EE-Gal4: Enteroendocrine driver; EB-Gal4: Enteroblast driver).
Figure 5—figure supplement 1
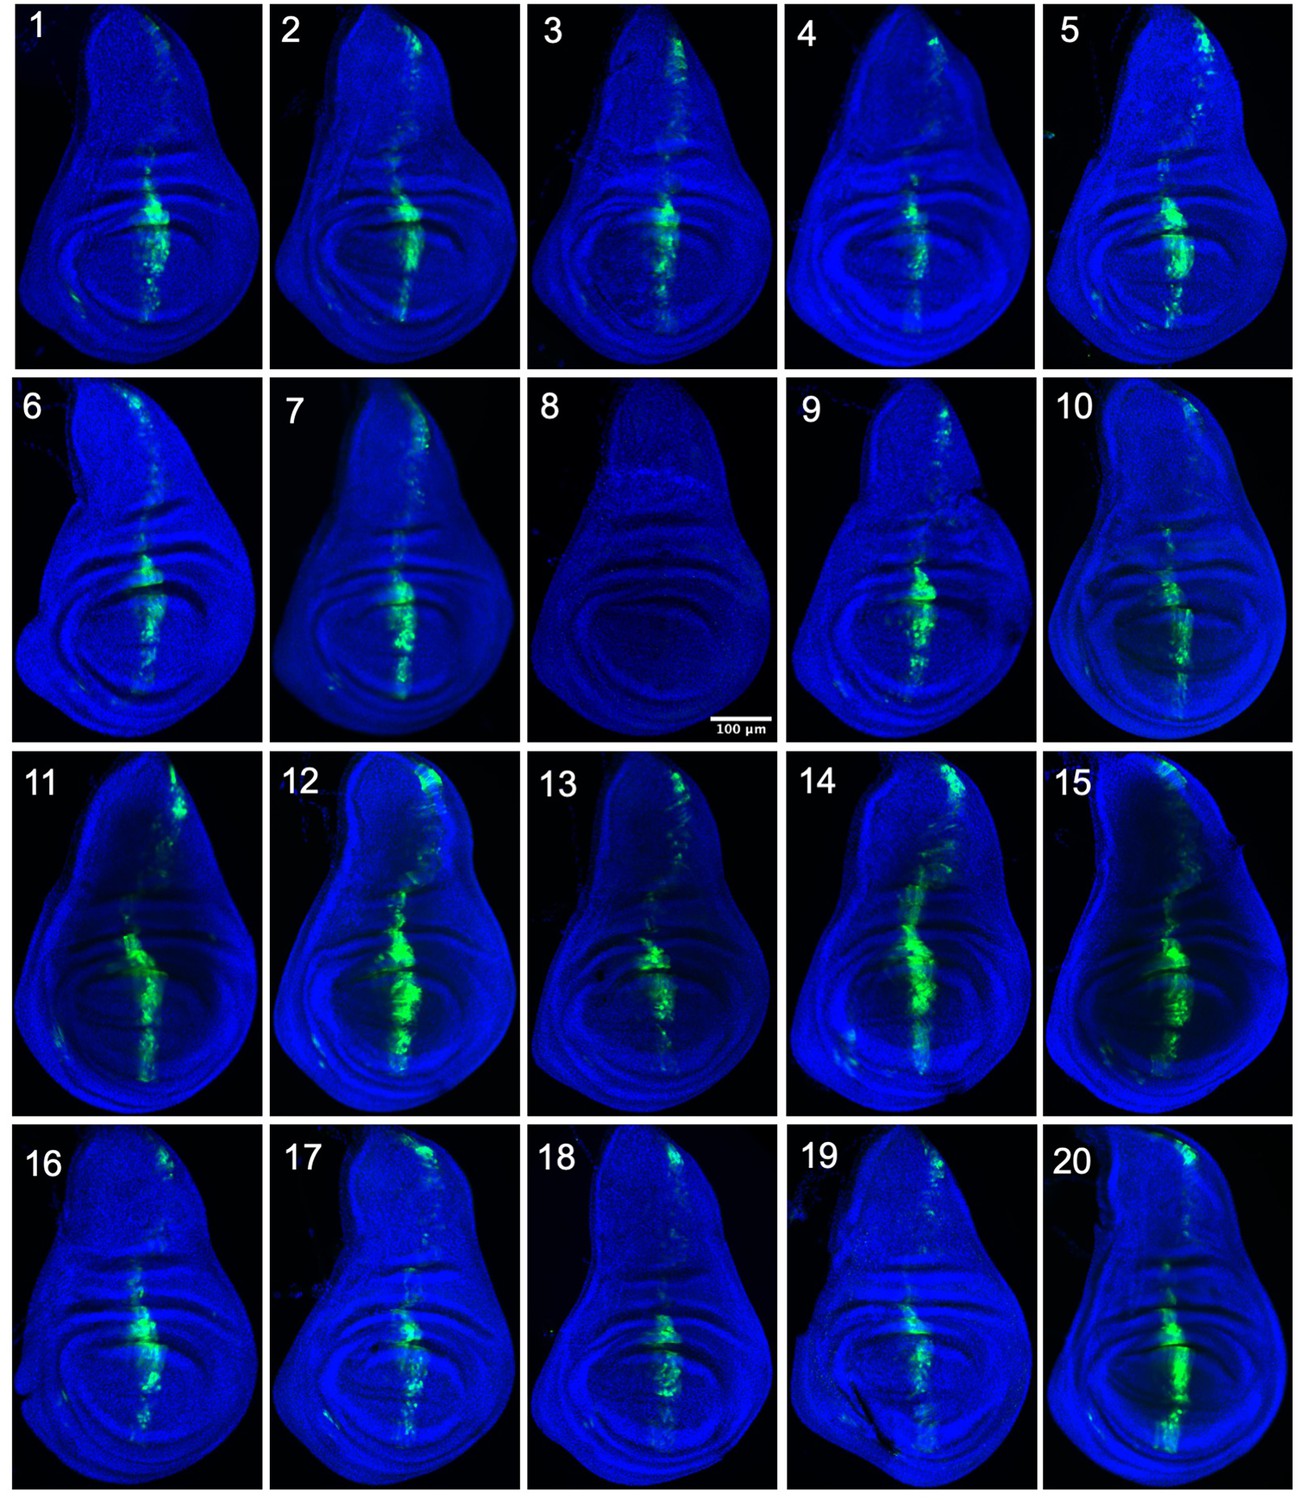
Expression driven by dpp-Gal4 for 20 TaG-EM lines.
GFP antibody staining in the wing imaginal disc for the indicated TaG-EM barcode line driven by dpp-Gal4. Wing discs are counterstained with DAPI.
Figure 5—figure supplement 2
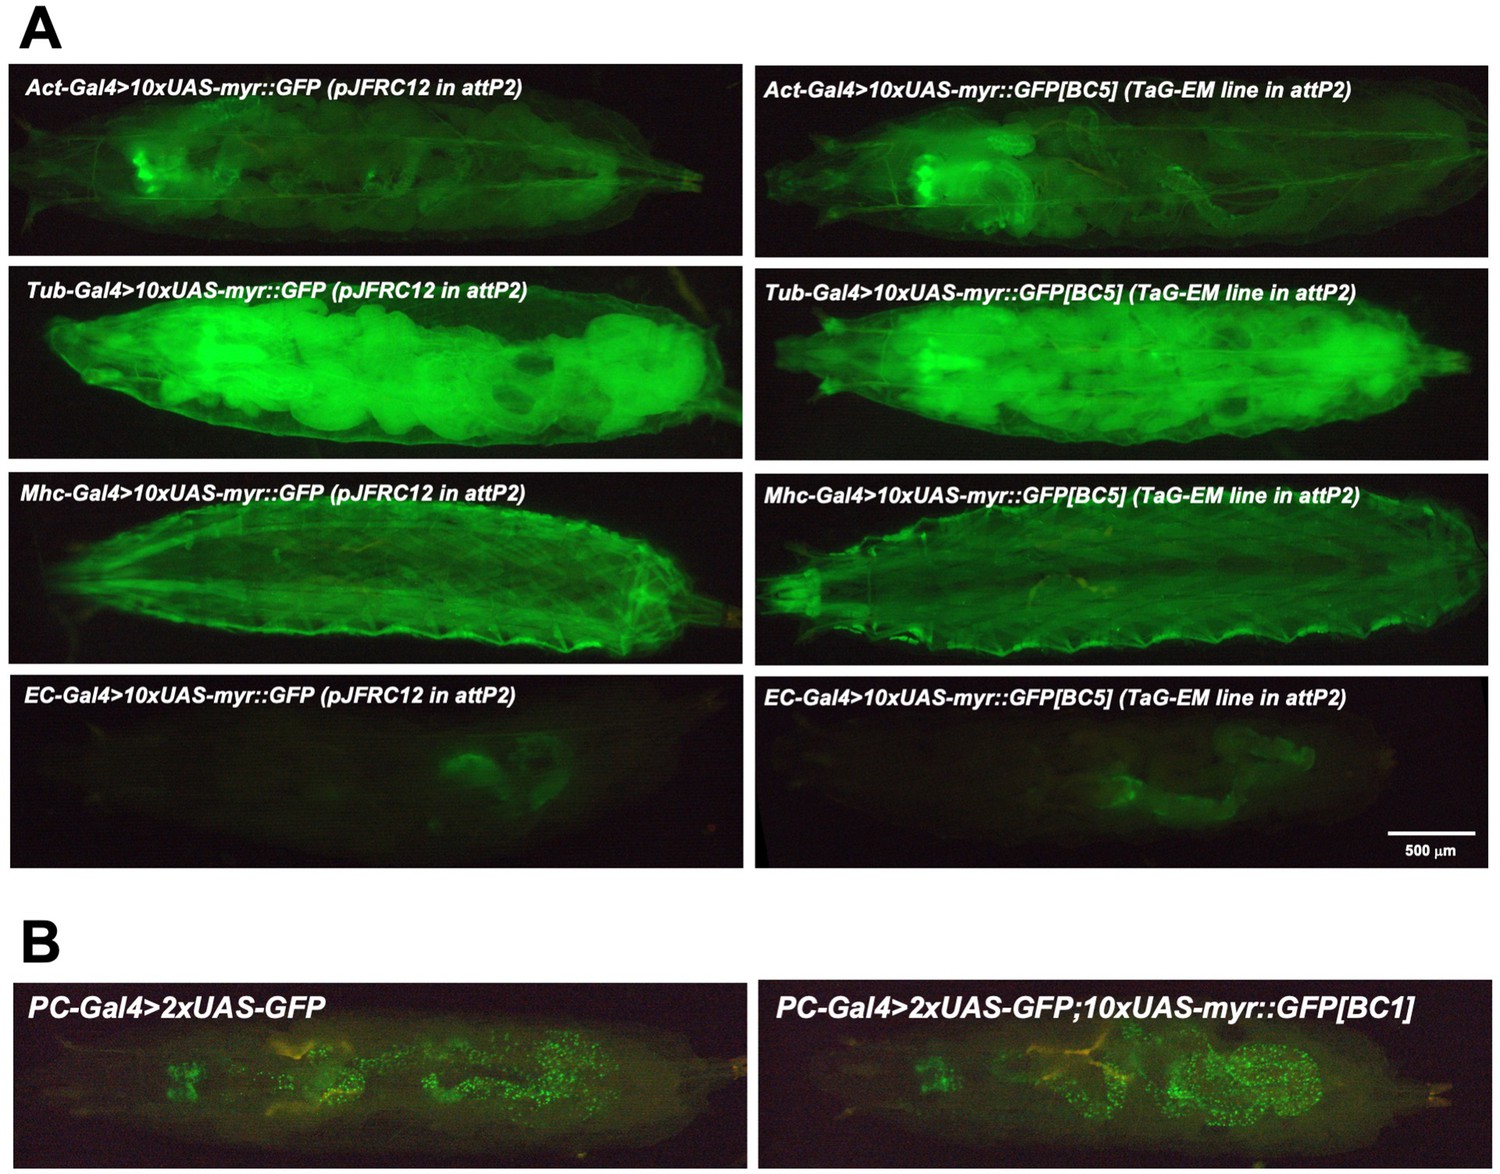
TaG-EM line GFP expression driven by different Gal4 drivers.
(A) Comparison of endogenous GFP expression in larvae for the original pJFRC12 construct inserted in the attP2 landing site (left) or for a TaG-EM barcode line (right) expressed under the control of the indicated driver line. (B) GFP expression of the PC-Gal (Precursor-Gal4) driver line together with either UAS-2xGFP or a combination of UAS-2xGFP and a TaG-EM barcode line.
Figure 6 with 11 supplements

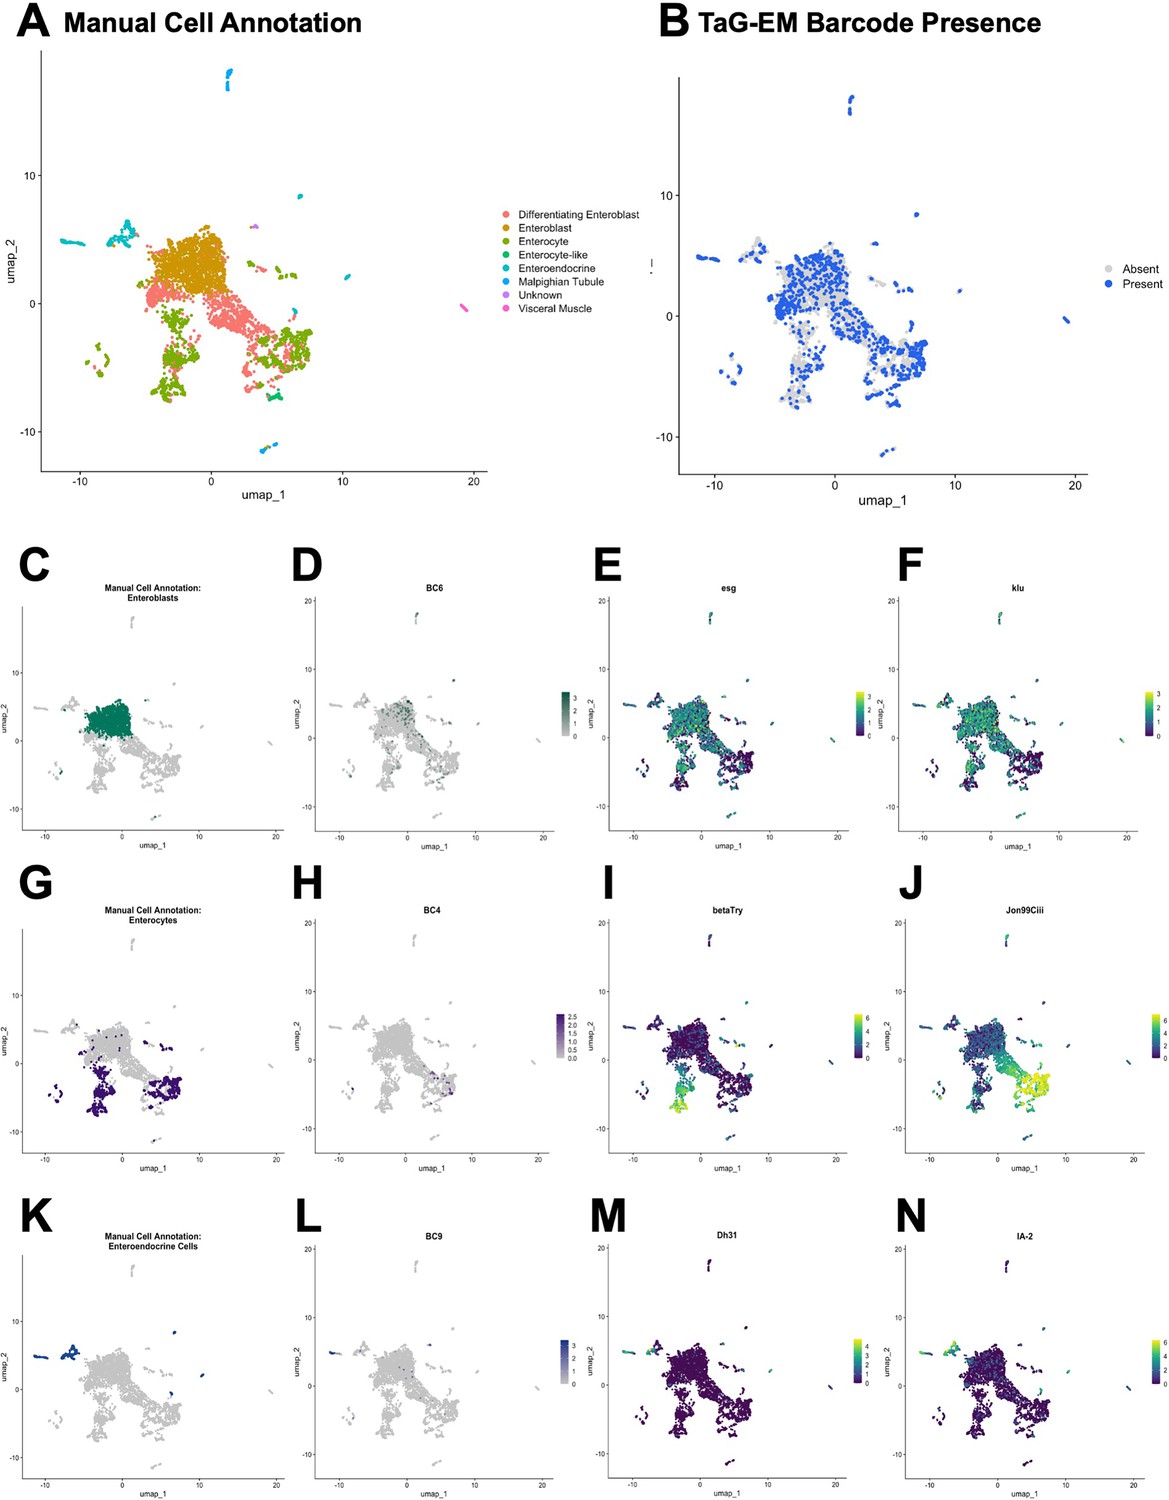
Expression of TaG-EM genetic barcodes in larval intestinal cell types.
(A) UMAP plot of Drosophila larval gut cell types. (B) Annotation of cells associated with a TaG-EM barcode across all 8 multiplexed experimental conditions using data from the gene expression library and an enriched TaG-EM barcode library. (C) Annotated enteroblast cells. (D) Presence of TaG-EM barcode (BC6) driven by the EB-Gal4 line using data from the gene expression library and an enriched TaG-EM barcode library. Gene expression levels of enteroblast marker genes (E) esg, (F) klu. (G) Annotated enterocyte cells. (H) Presence of TaG-EM barcode (BC4) driven by the EC-Gal4 line using data from the gene expression library and an enriched TaG-EM barcode library. Gene expression levels of enterocyte marker genes (I) betaTry, (J) Jon99Ciii. (K) Annotated enteroendocrine cells. (L) Presence of TaG-EM barcode (BC9) driven by the EE-Gal4 line using data from the gene expression library and an enriched TaG-EM barcode library. Gene expression levels of enteroendocrine cell marker genes (M) Dh31, (N) IA-2.
Figure 6—figure supplement 1
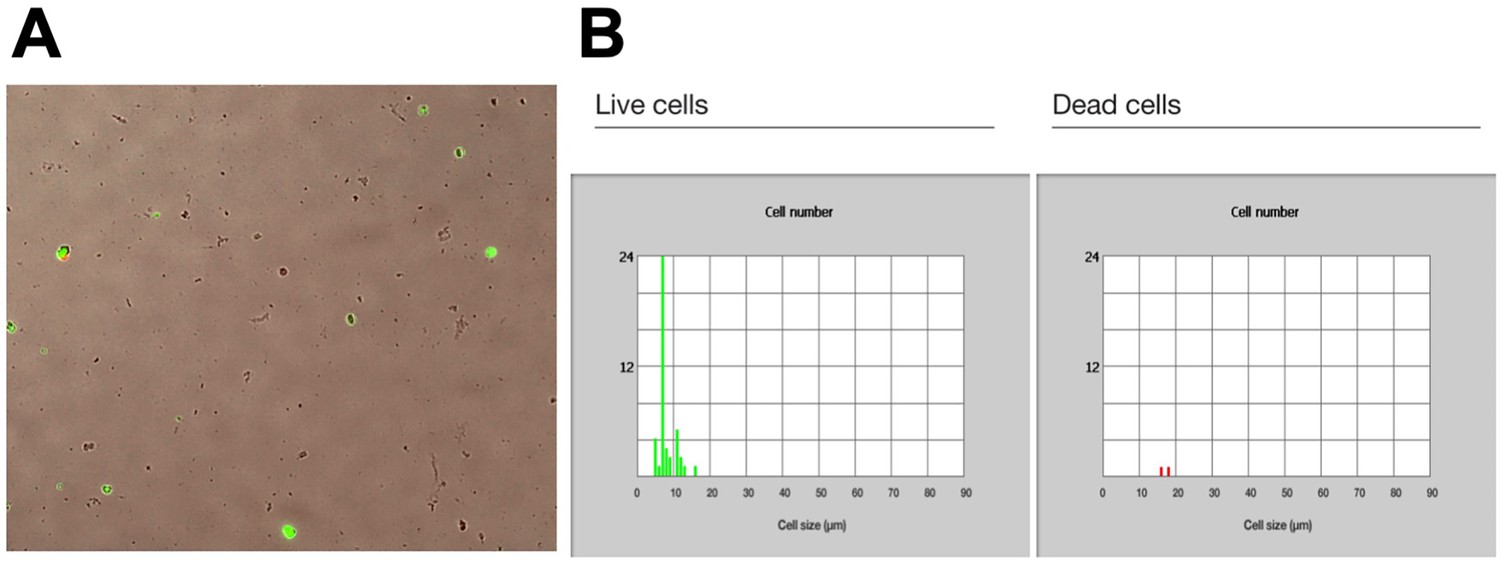
Dissociated intestinal cell viability.
(A) GFP expression visualized in dissociated cells from gut driver lines crossed to hexameric GFP and TaG-EM line. (B) Proportion of live (left) and dead (right) cells post-isolation and flow sorting as assessed by GFP expression and propidium iodide staining.
Figure 6—figure supplement 2
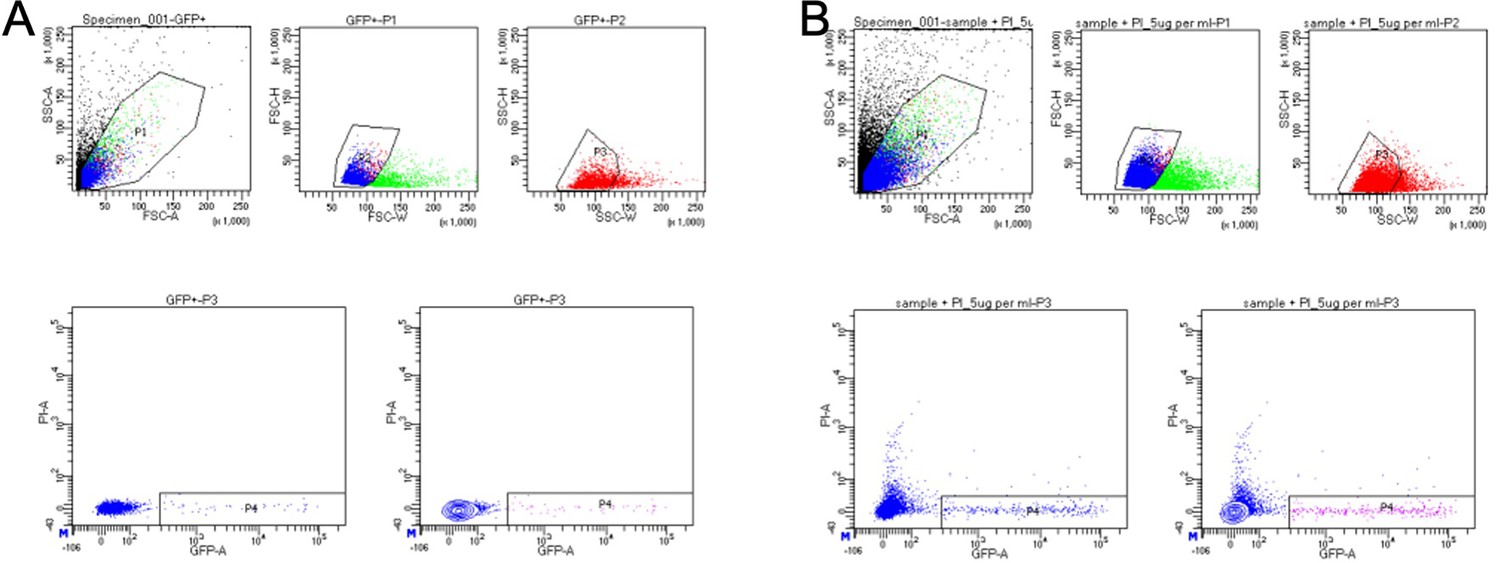
BD FACSDiva 8.0.1 gating for sorted cells.
(A) GFP gating created by analyzing a pool of GFP positive and negative cells. (B) Flow gating for Drosophila gut cells with TaG-EM GFP expression driven in intestinal precursor cells (PC-Gal4) and enterocytes (EC-Gal4).
Figure 6—figure supplement 3
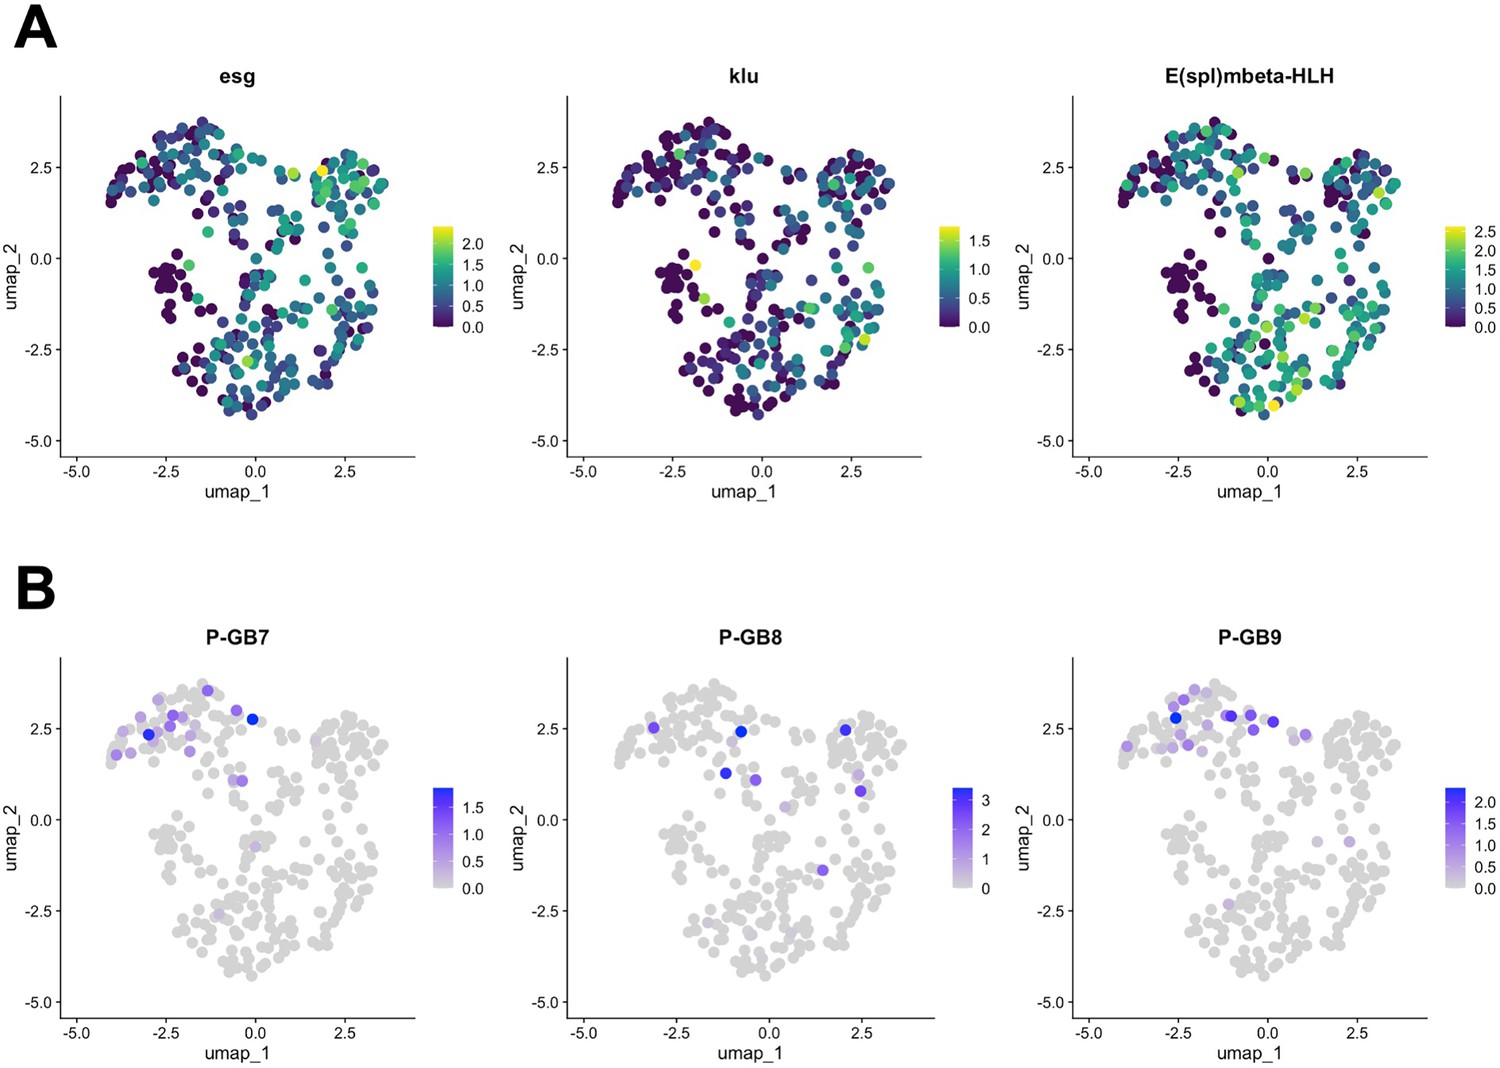
Expression of TaG-EM genetic barcodes in larval intestinal precursor cells.
UMAP plots showing gene expression levels of (A) enteroblast/ISC marker genes esg, klu, and E(spl)mbeta-HLH; and (B) the TaG-EM barcodes 7, 8, and 9 driven by the PC-Gal4 line.
Figure 6—figure supplement 4
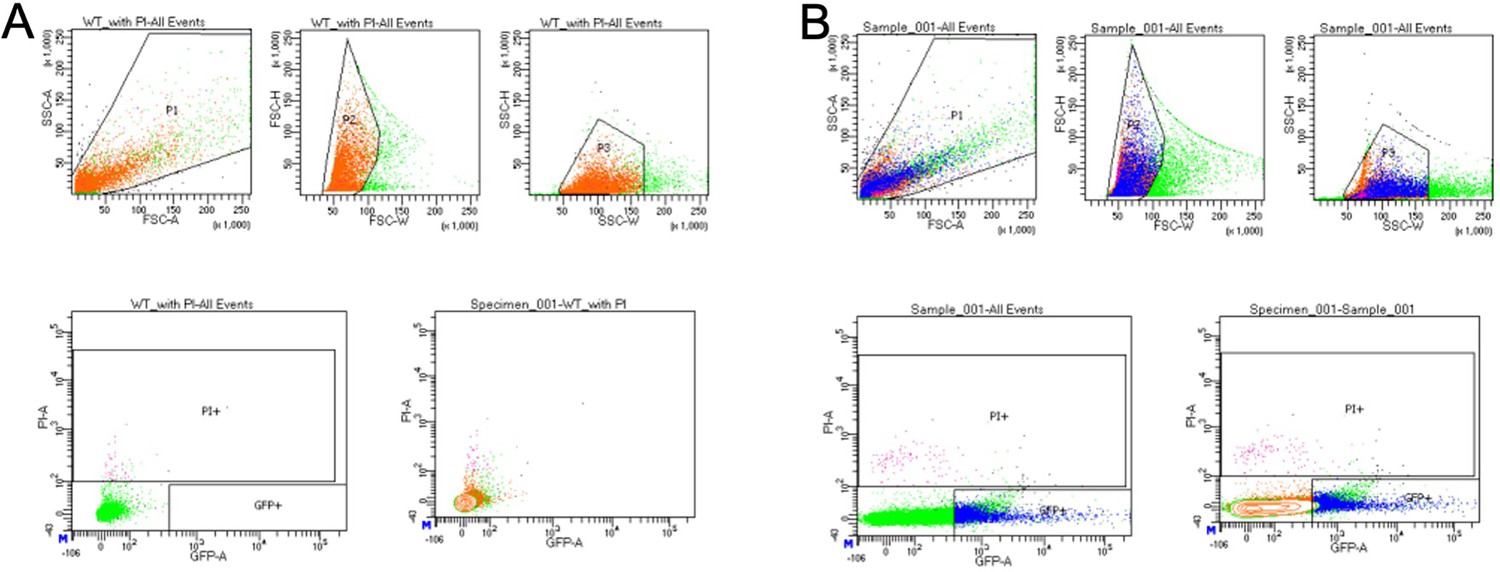
BD FACSDiva 8.0.1 gating for sorted cells.
(A) Dead cell gating created by staining sample with propidium iodine (PI). (B) Flow gating for Drosophila gut cells with TaG-EM and hexameric GFP expression driven by the pan-midgut, enteroblast, enterocyte, enteroendocrine, and precursor cell drivers.
Figure 6—figure supplement 5
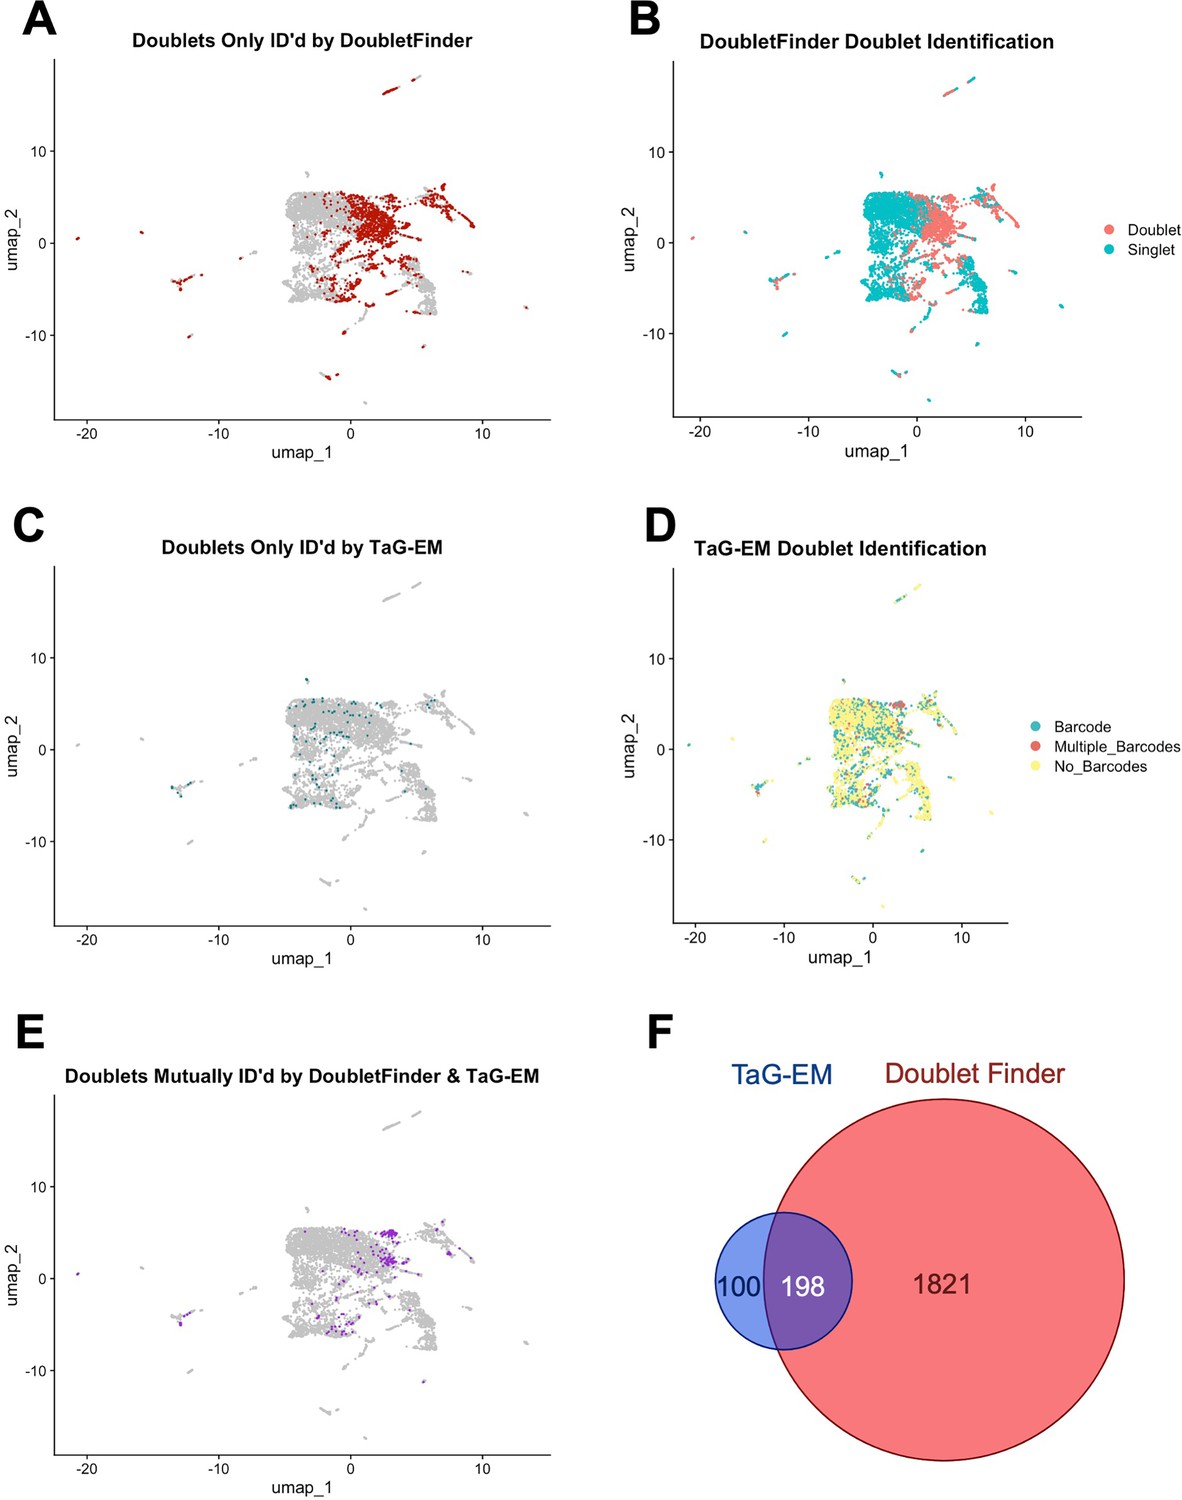
TaG-EM-based doublet identification.
UMAP plots pre-doublet removal showing (A) doublets uniquely identified by DoubletFinder, (B) all doublets identified by DoubletFinder, (C) doublets uniquely identified by TaG-EM barcodes, (D) all doublets identified by TaG-EM barcodes, (E) doublets mutually found by TaG-EM and DoubletFinder, (F) Venn diagram of overlap between doublets identified by TaG-EM and DoubletFinder.
Figure 6—figure supplement 6
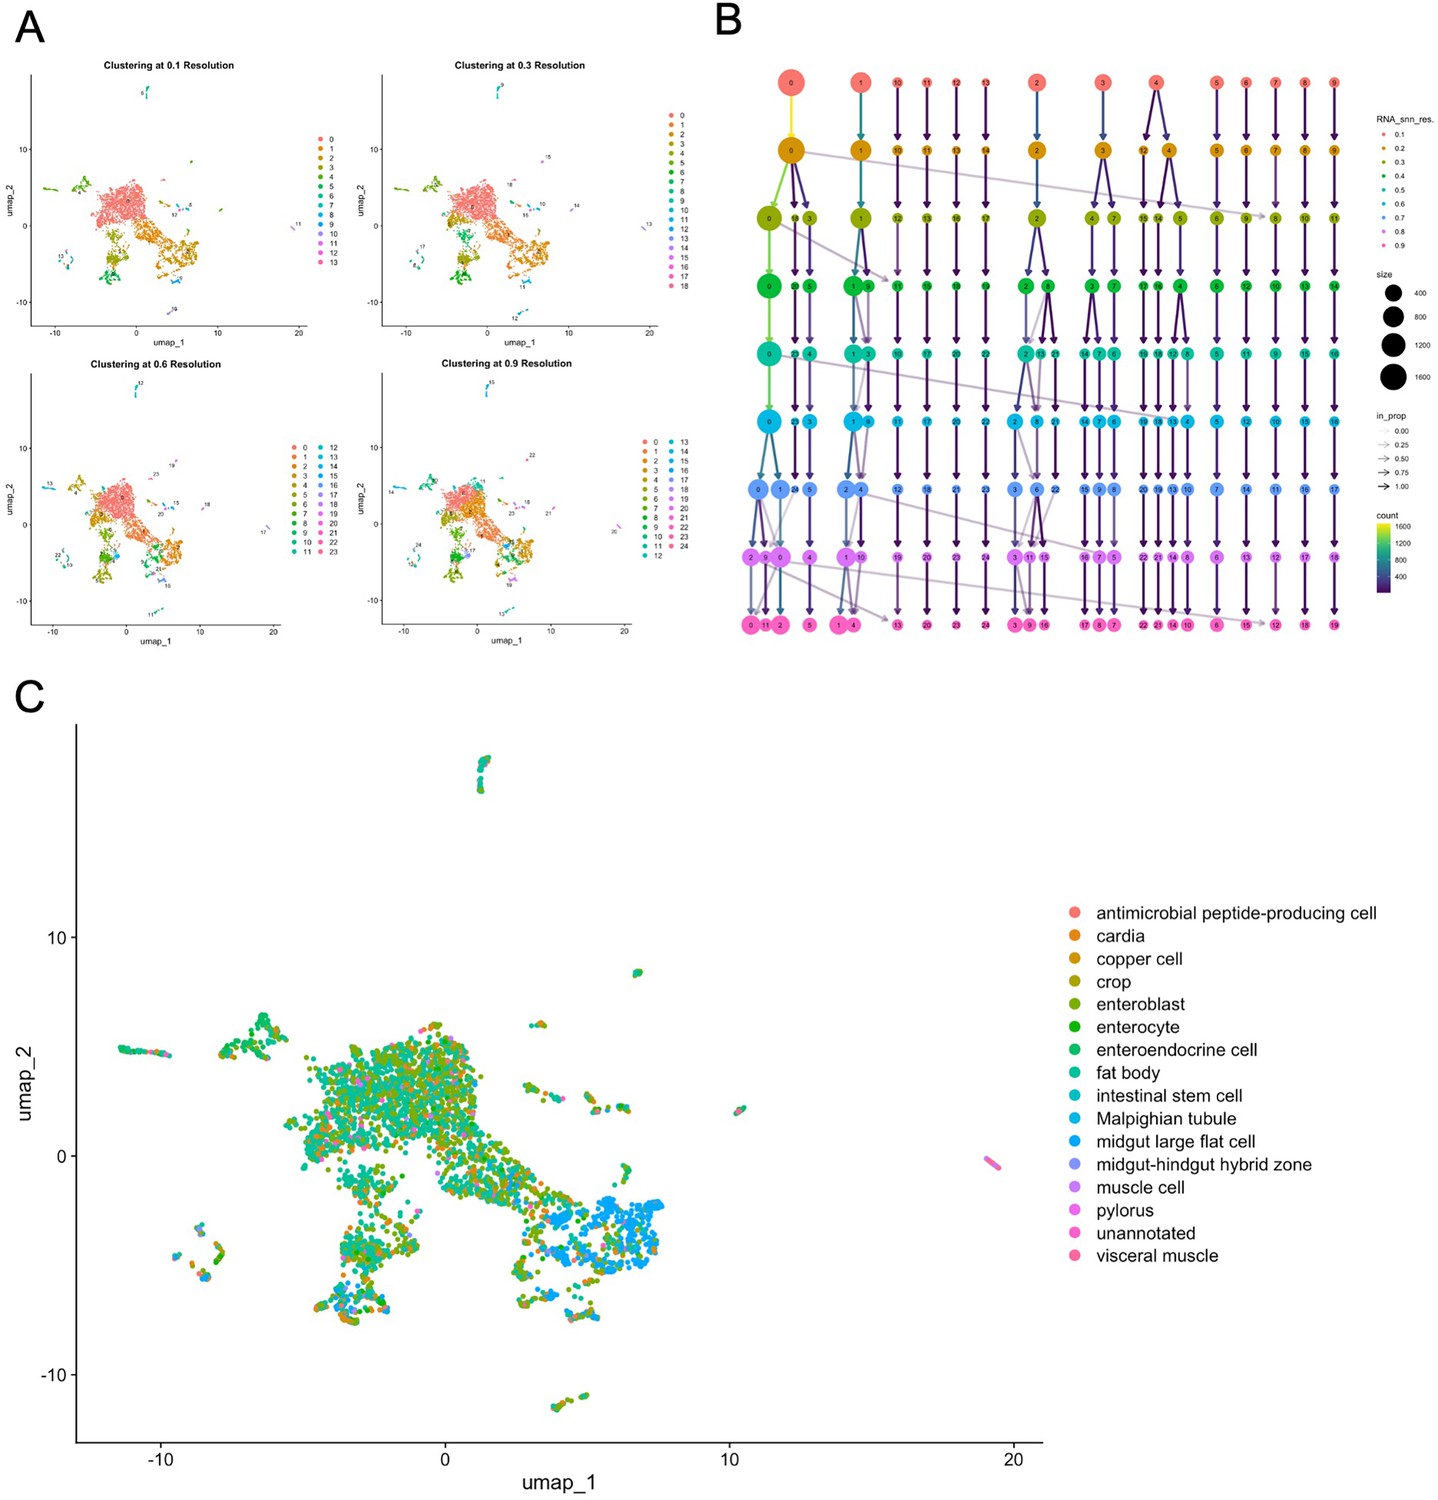
Clustering and automated annotation.
(A) UMAP plots clustered at different resolutions. (B) Clustree analysis of the effect of clustering resolution. (C) Automated cell type annotation using data from the Fly Cell Atlas.
Figure 6—figure supplement 7
Expression of TaG-EM genetic barcodes in larval intestinal cell types.
(A) UMAP plot of Drosophila larval gut cell types. (B) Annotation of cells associated with a TaG-EM barcode across all eight multiplexed experimental conditions using data from the gene expression library only. (C) Annotated enteroblast cells. (D) Expression level of TaG-EM barcode (BC6) driven by the EB-Gal4 line using data from the gene expression library only. Gene expression levels of enteroblast marker genes (E) esg, (F) klu. (G) Annotated enterocyte cells. (H) Expression level of TaG-EM barcode (BC4) driven by the EC-Gal4 line using data from the gene expression library only. Gene expression levels of enterocyte marker genes (I) betaTry, (J) Jon99Ciii. (K) Annotated enteroendocrine cells. (L) Expression level of TaG-EM barcode (BC9) driven by the EE-Gal4 line using data from the gene expression library only. Gene expression levels of enteroendocrine cell marker genes (M) Dh31, (N) IA-2.
Figure 6—figure supplement 8
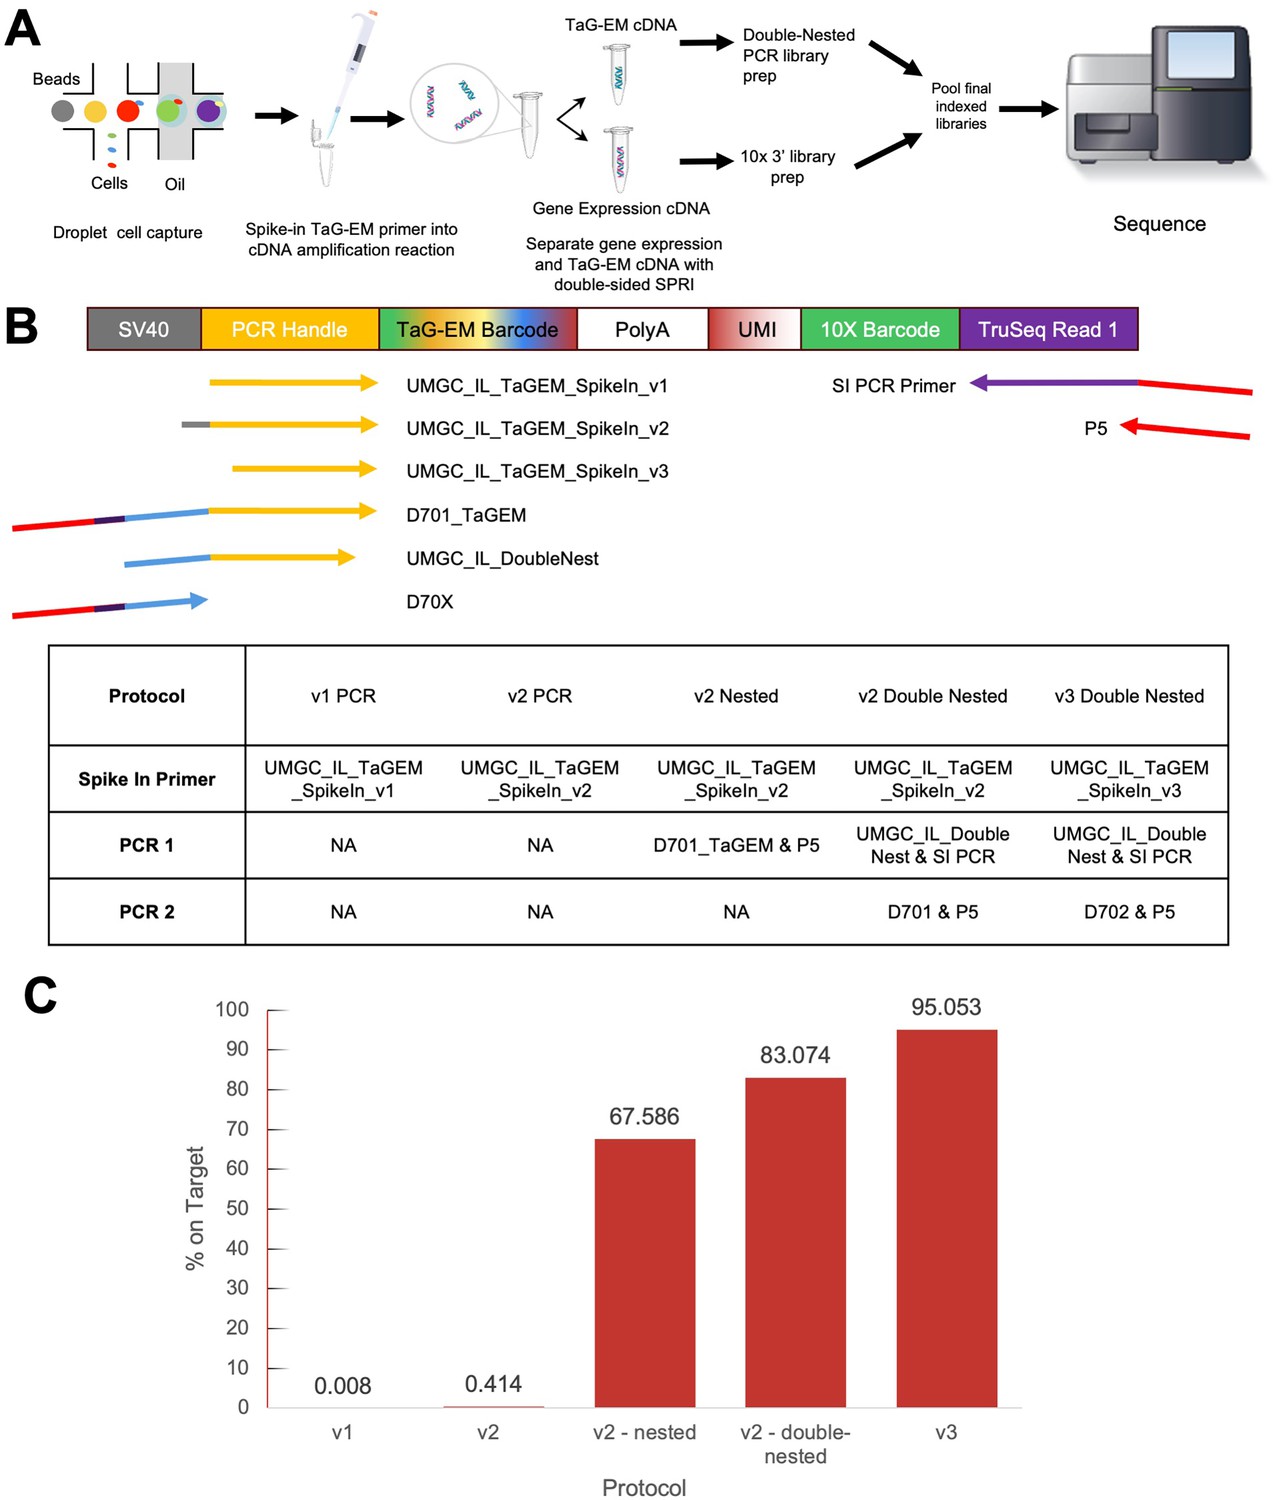
Optimizing amplification of the TaG-EM barcode library.
(A) Workflow for single-cell capture; cDNA amplification with added spike-in primer for TaG-EM library followed by a SPRI size-selection clean-up, then PCR(s) to create library for sequencing. (B) Spike-in primers and amplification primers used to enrich TaG-EM barcodes. Table summarizes different protocols tested to amplify the TaG-EM barcodes and create an enriched sequencing library. (C) Percent of on-target reads for each enriched TaG-EM barcode library.
Figure 6—figure supplement 9
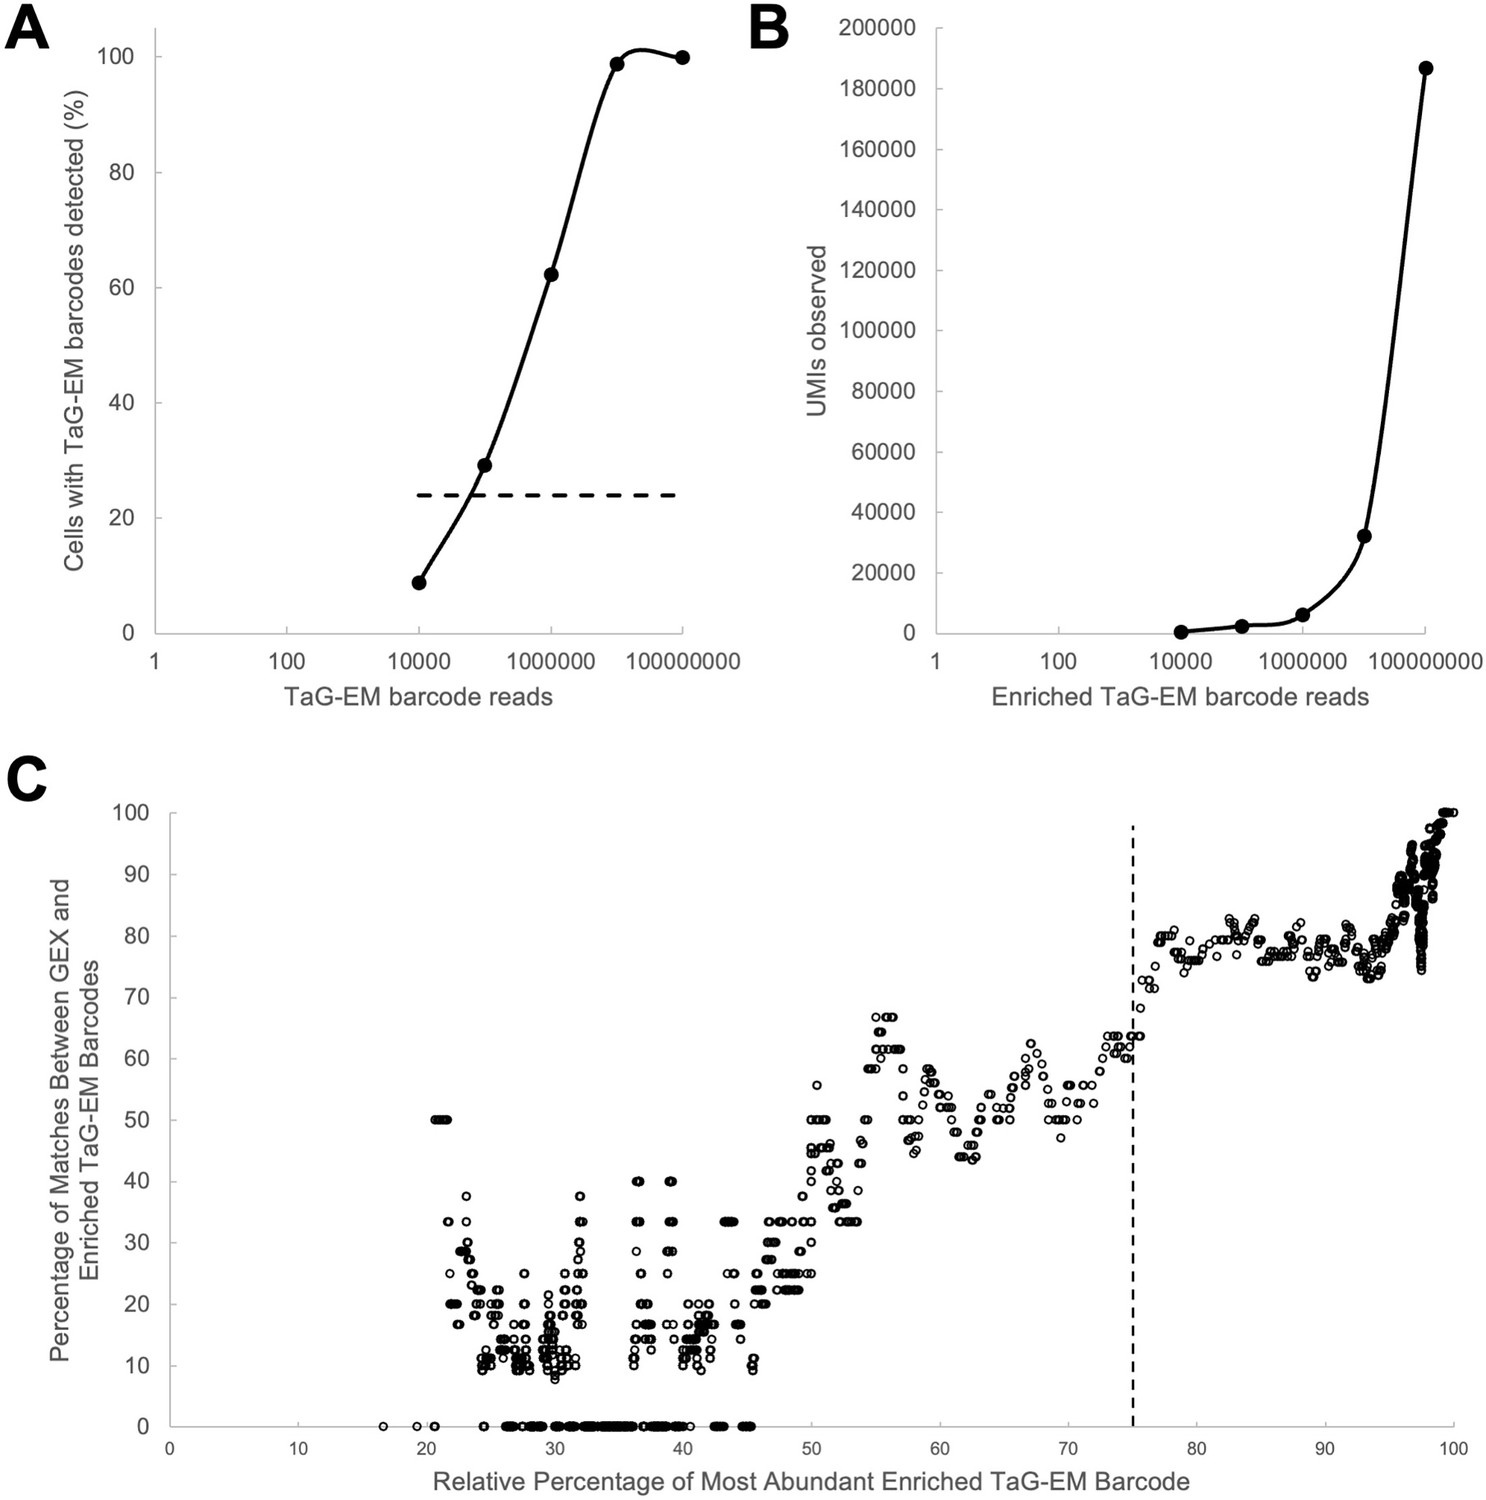
Performance of the enriched TaG-EM barcode library.
(A) Proportion of cells with at least one barcode read assigned as a function of read depth for the enriched TaG-EM barcode library. Dashed line indicated percentage of cells with TaG-EM barcodes detected in the gene expression library (B) Number of unique UMIs observed as a function of read depth. (C) Correlation between barcodes detected in the gene expression (GEX) library and the enriched TaG-EM barcode library as a function of the purity of TaG-EM barcode assignment to the corresponding cell barcode. Dashed line indicates the threshold used for TaG-EM barcode calling in the enriched TaG-EM barcode library.
Figure 6—figure supplement 10
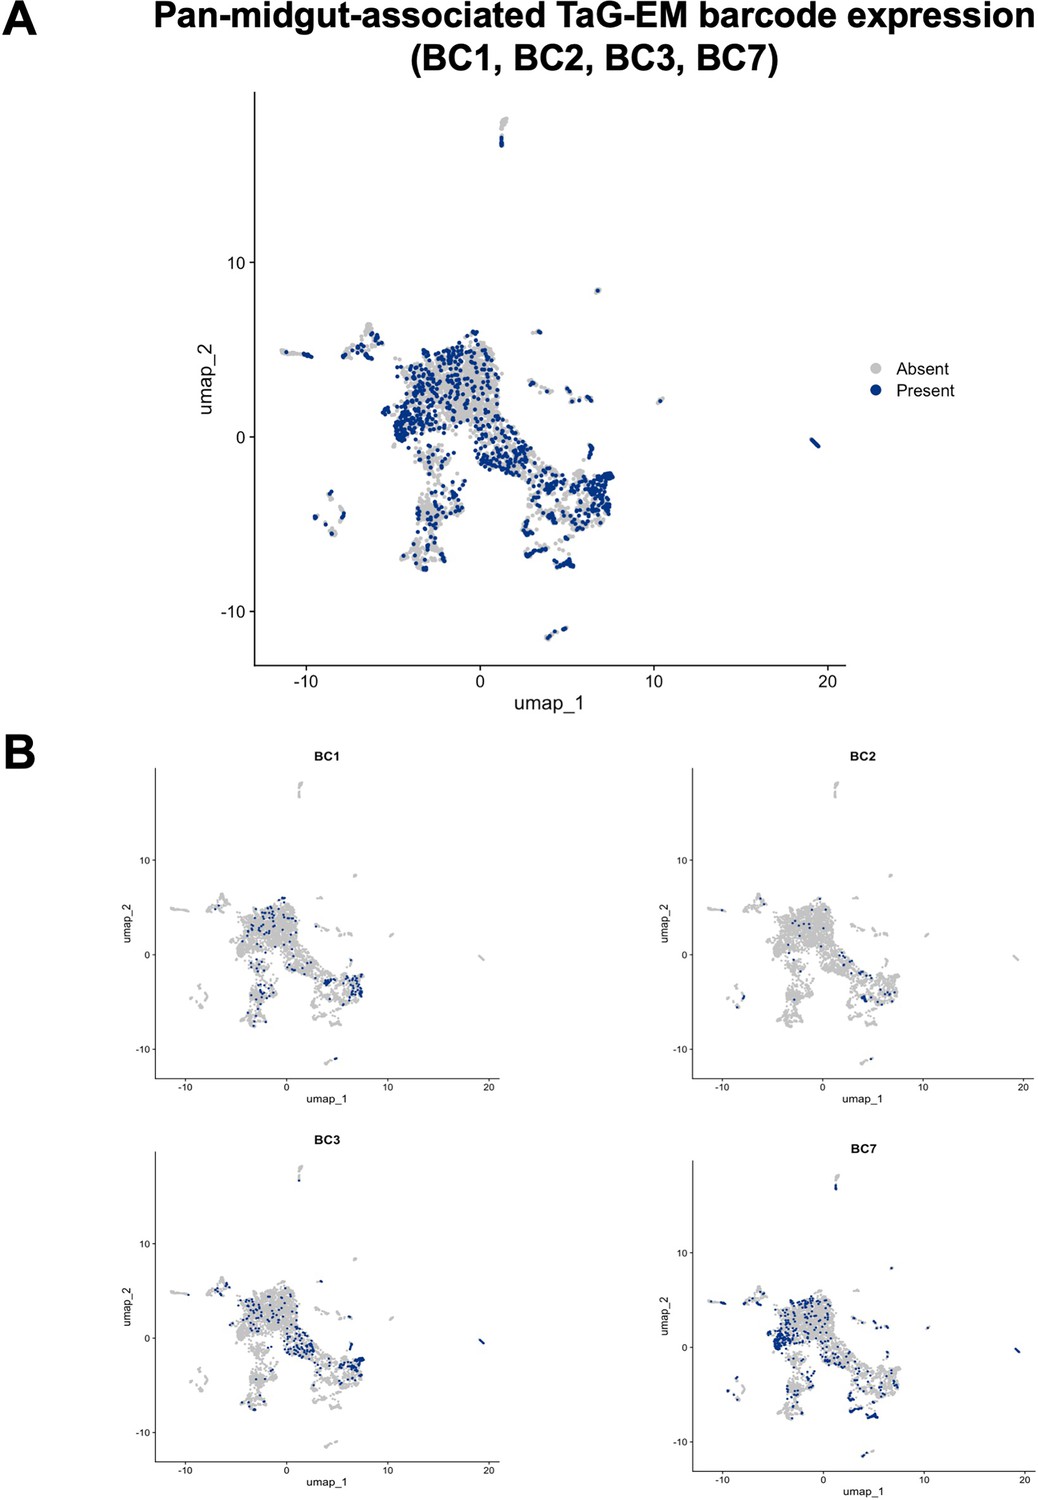
Expression of the PMG-Gal4-driven TaG-EM barcodes.
UMAP plots showing expression of the four PMG-Gal4 driven TaG-EM barcodes (BC1, BC2, BC3, and BC7) either (A) in aggregate or (B) individually.
Figure 6—figure supplement 11
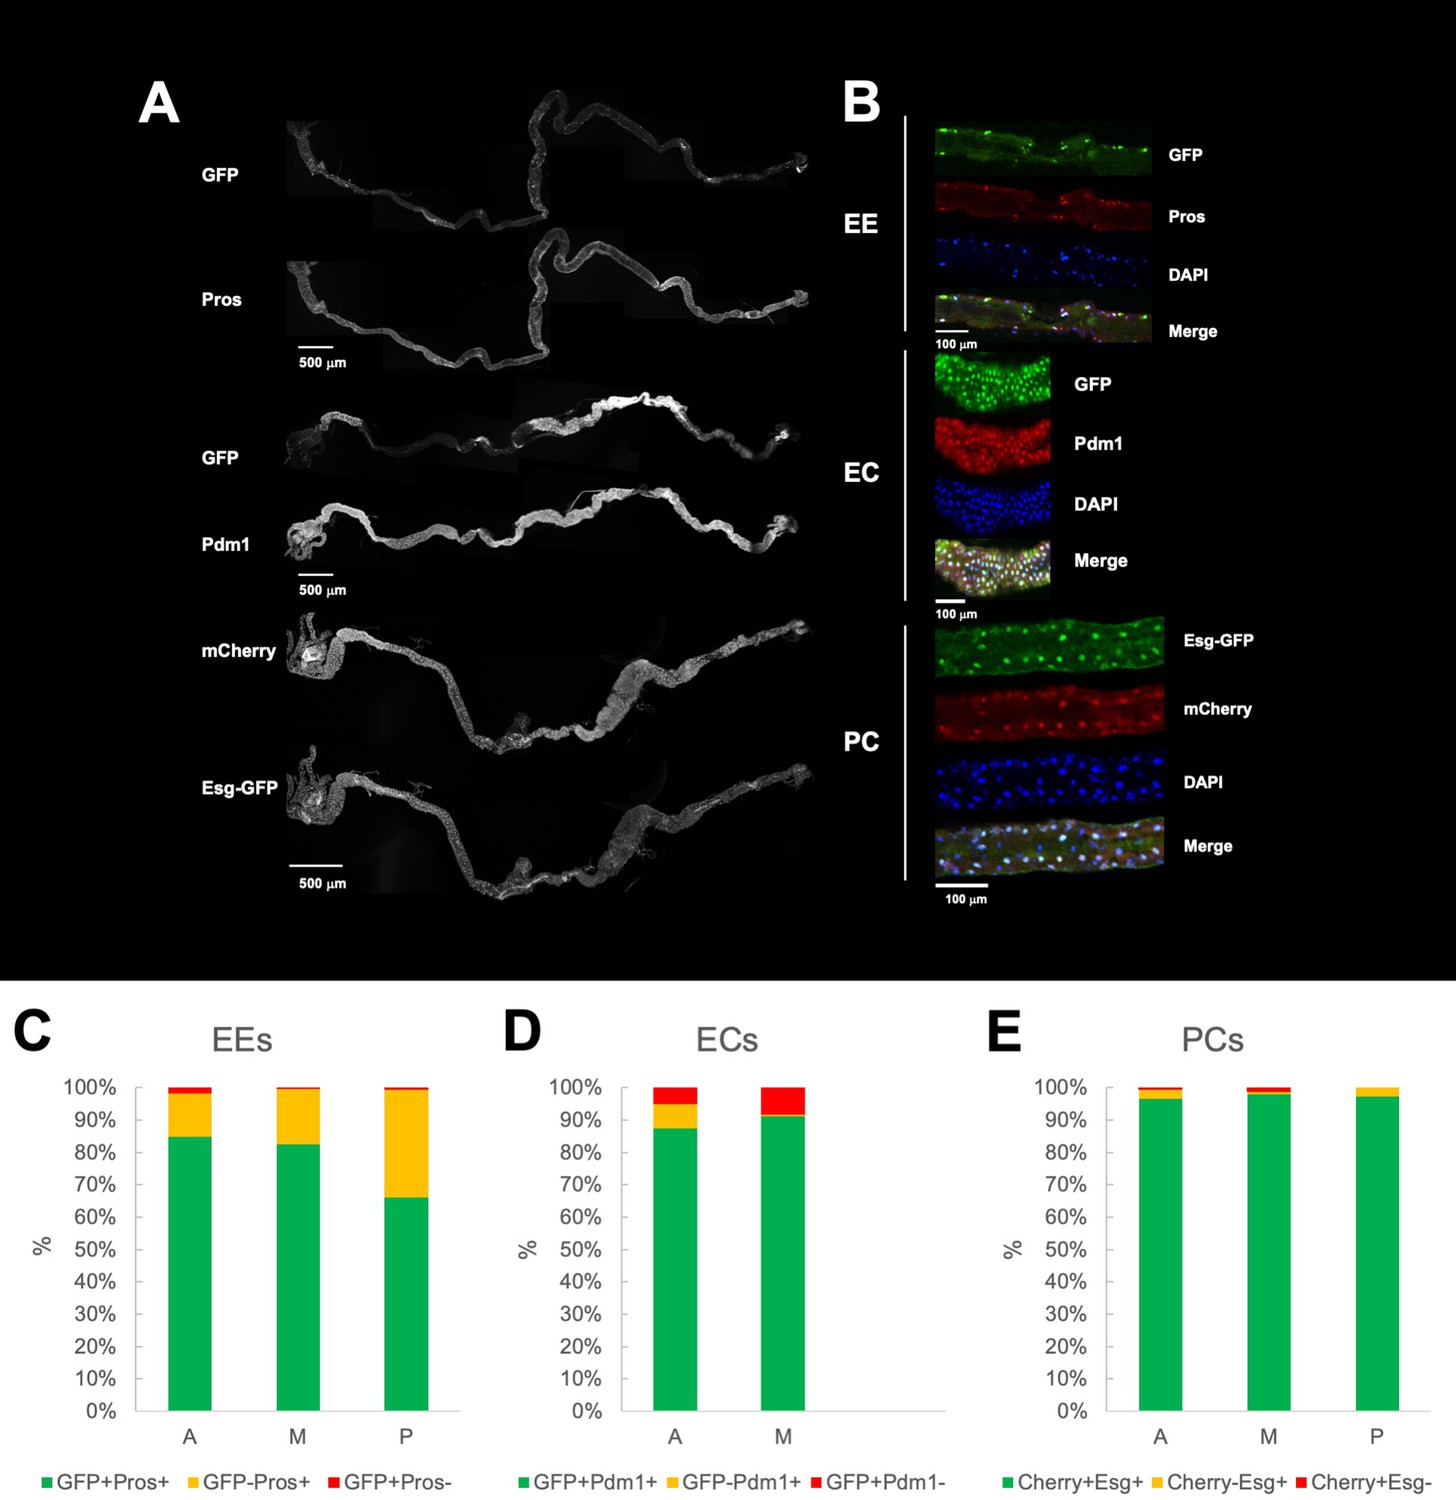
Characterization of Gal4 line expression in the larval gut.
(A) Confocal images of third instar midguts showing Gal4-driven fluorophore expression (GFP or mCherry) and comparison with immunostainings of the gut cell markers Prospero (enteroendocrine), Pdm1 (enterocyte) and Esg-GFP (progenitor cell). For each image, Z projections of the stacks recorded along the length of the midgut were manually stitched together. (B) Representative single frames confocal images of a small region of the midgut showing immunostainings of the different gut cell markers and the Gal4-driven fluorophores. Quantification of overlapping and non-overlapping expression between the Gal4-driver fluorophore expression and the cell type marker in the anterior (A), middle (M), and posterior (P) regions for (C) enteroendocrine cells (EC-Gal4), (D) enterocytes (EC-Gal4), (E) precursor cells (PC-Gal4). Five specimens for each Gal4 line were examined. In the case of the enterocyte-specific driver, only anterior and middle regions were analyzed since the driver is largely inactive in the posterior part of the midgut.
Author response image 1
Tables
Key resources table
| Reagent type (species) or resource | Designation | Source or reference | Identifiers | Additional information |
|---|---|---|---|---|
| Genetic reagent (D. melanogaster) | IsoD1 | Clandinin Lab, Stanford University, Silies et al., 2013 | Wild type | |
| Genetic reagent (D. melanogaster) | w-;+;+ (IsoD1) | Clandinin Lab, Stanford University, Silies et al., 2013 | ||
| Genetic reagent (D. melanogaster) | atttP2 line | Transgenic RNAi Project | RRID:BDSC_25710 | P{y[+t7.7]=nanos-phiC31\int.NLS}X, y (Alegria et al., 2024) sc (Alegria et al., 2024) v (Alegria et al., 2024) sev (Ingham, 1988); P{y[+t7.7]=CaryP}attP2 |
| Genetic reagent (D. melanogaster) | norpA | William Pak, Purdue University, West Lafayette | RRID:BDSC_9048 | w[*] norpA[P24] |
| Genetic reagent (D. melanogaster) | UAS-myr::GFP(pJFRC12) | Gerald M. Rubin & Barret Pfeiffer, Howard Hughes Medical Institute, Janelia Research Campus | RRID:BDSC_32197 | w[*]; P{y[+t7.7] w[+mC]=10XUAS-IVS-myr::GFP}attP2 |
| Genetic reagent (D. melanogaster) | Hexameric GFP lines | Nicholas Sokol, Indiana University, Bloomington | RRID:BDSC_91402, RRID:BDSC_91403 | w[*]; P{y[+t7.7] w[+mC]=R57 F07-p65.AD.A}attP40; P{y[+t7.7] w[+mC]=UAS-DSCP-6XEGFP}attP2 w[*]; PBac{y[+mDint2] w[+mC]=UAS-DSCP-6XEGFP}VK00018; P{y[+t7.7] w[+mC]=R57 F07-GAL4.DBD.A}attP2/TM6C, Sb (Alegria et al., 2024) Tb (Alegria et al., 2024) |
| Genetic reagent (D. melanogaster) | UAS-6XmCherry-HA | Steve Stowers, Montana State University | RRID:BDSC_52268 | y (Alegria et al., 2024) w[*]; wg[Sp-1]/CyO, P{Wee-P.ph0}Bacc[Wee-P20]; P{y[+t7.7] w[+mC]=20XUAS-6XmCherry-HA}attP2 |
| Genetic reagent (D. melanogaster) | UAS-GFP.nls | Bruce Edgar, Fred Hutchinson Cancer Center | RRID:BDSC_4776 | w[1118]; P{w[+mC]=UAS GFP.nls}8 |
| Genetic reagent (D. melanogaster) | esg-GFP.FPTB | modERN Project | RRID:BDSC_83386 | y (Alegria et al., 2024) w[*]; PBac{y[+mDint2] w[+mC]=esg GFP.FPTB}VK00031 |
| Genetic reagent (D. melanogaster) | dpp-Gal4 driver | Karen Staehling-Hampton, University of Wisconsin, Madison | RRID:BDSC_1553 | w[*]; wg[Sp-1]/CyO; P{w[+mW.hs]=GAL4 dpp.blk1}40 C.6/TM6B, Tb (Alegria et al., 2024) |
| Genetic reagent (D. melanogaster) | Act-Gal4 driver | Yash Hiromi, National Institute of Genetics | RRID:BDSC_4414 | y (Alegria et al., 2024) w[*]; P{w[+mC]=Act5 C-GAL4}25FO1/CyO, y[+] |
| Genetic reagent (D. melanogaster) | Tub-Gal4 driver | Liqun Luo, Stanford University | RRID:BDSC_5138 | y (Alegria et al., 2024) w[*]; P{w[+mC]=tubP-GAL4}LL7/TM3, Sb (Alegria et al., 2024) Ser (Alegria et al., 2024) |
| Genetic reagent (D. melanogaster) | Mhc-Gal4 driver | Frank Schnorrer, Max Planck Institute of Biochemistry | RRID:BDSC_55132 | P{w[+mC]=Mhc-GAL4.K}1, w[*]/FM7c |
| Genetic reagent (D. melanogaster) | PC-Gal4 driver lines | Barry Dickson, Howard Hughes Medical Institute, Janelia Research Campus | RRID:BDSC_73356 RRID:BDSC_75528 | w[1118]; P{y[+t7.7] w[+mC]=VT004241 p65.AD}attP40 w[1118]; P{y[+t7.7] w[+mC]=VT024642 GAL4.DBD}attP2 |
| Genetic reagent (D. melanogaster) | PC-Gal4 driver (with UAS-Stinger) lines | Nicholas Sokol, Indiana University, Bloomington | RRID:BDSC_91400 RRID:BDSC_91401 | w[*]; P{y[+t7.7] w[+mC]=VT004241 p65.AD}attP40, P{w[+mC]=UAS-Stinger}2/CyO; l(3)*[*]/TM3, Sb (Alegria et al., 2024) Ser (Alegria et al., 2024) w[*]; P{y[+t7.7] w[+mC]=VT024642 GAL4.DBD}attP2, P{w[+mC]=UAS-Stinger}3 |
| Genetic reagent (D. melanogaster) | EC-Gal4 driver | Nicholas Sokol, Indiana University, Bloomington | RRID:BDSC_91406 | w[*]; P{y[+t7.7] w[+mC]=CG10116 GAL4.DBD}su(Hw)attP6, P{y[+t7.7] w[+mC]=VT004958 p65.AD}attP40/CyO |
| Genetic reagent (D. melanogaster) | EB-Gal4 driver lines | Nicholas Sokol, Indiana University, Bloomington | RRID:BDSC_91398 RRID:BDSC_91404 | w[*]; P{y[+t7.7] w[+mC]=CG10116 p65.AD}attP40 w[*]; P{y[+t7.7] w[+mC]=Su(H)GBE-GAL4.DBD}attP2/TM6B, Tb[+] |
| Genetic reagent (D. melanogaster) | EE-Gal4 driver lines | Nicholas Sokol, Indiana University, Bloomington | RRID:BDSC_91402 RRID:BDSC_91403 | w[*]; P{y[+t7.7] w[+mC]=R57 F07-p65.AD.A}attP40; P{y[+t7.7] w[+mC]=UAS-DSCP-6XEGFP}attP2 w[*]; PBac{y[+mDint2] w[+mC]=UAS-DSCP-6XEGFP}VK00018; P{y[+t7.7] w[+mC]=R57 F07-GAL4.DBD.A}attP2/TM6C, Sb (Alegria et al., 2024) Tb (Alegria et al., 2024) |
| Genetic reagent (D. melanogaster) | PMG-Gal4 driver lines | Nicholas Sokol, Indiana University, Bloomington | RRID:BDSC_91398 RRID:BDSC_91399 | w[*]; P{y[+t7.7] w[+mC]=CG10116 p65.AD}attP40 w[*]; P{y[+t7.7] w[+mC]=CG10116 GAL4.DBD}su(Hw)attP6 |
| Genetic reagent (D. melanogaster) | TaG-EM lines | This study, Alegria et al., 2024 | Available upon request | |
| Genetic reagent (D. melanogaster) | TaG-EM lines +6 xGFP (x20) | This study | RRID:BDSC_99608 RRID:BDSC_99609 RRID:BDSC_99610 RRID:BDSC_99611 RRID:BDSC_99612 RRID:BDSC_99613 RRID:BDSC_99614 RRID:BDSC_99615 RRID:BDSC_99616 RRID:BDSC_99617 RRID:BDSC_99618 RRID:BDSC_99619 RRID:BDSC_99620 RRID:BDSC_99621 RRID:BDSC_99622 RRID:BDSC_99623 RRID:BDSC_99624 RRID:BDSC_99625 RRID:BDSC_99626 RRID:BDSC_99627 | These lines are available from the Bloomington Drosophila Stock Center (stock numbers 99608–99627) |
| Antibody | Anti-GFP (rabbit polyclonal) | ThermoFisher | A-6455 RRID:AB_221570 | 1:1000 dilution |
| Antibody | Anti-mCherry (mouse monoclonal) | DSHB | 3A11 RRID:AB_2617430 | 1:20 dilution |
| Antibody | Anti-Prospero (mouse monoclonal) | DSHB | MR1A RRID:AB_528440 | 1:50 dilution |
| Antibody | Anti-Pdm1 (mouse monoclonal) | DSHB | Nub2D4 RRID:AB_2722119 | 1:30 dilution |
| Antibody | Alexa Fluor 647 Goat Anti-mouse conjugated antibody (goat polyclonal) | ThermoFisher | A-21236 RRID:AB_2535805 | 1:200 dilution |
| Antibody | Alexa Fluor 488 Goat Anti-rabbit IgG conjugated antibody (goat polyclonal) | ThermoFisher | A-11008 RRID:AB_143165 | 1:200 dilution |
| Recombinant DNA reagent | pJFRC12-10XUAS-IVS-myr::GFP plasmid | Gerald Rubin Lab | RRID:Addgene_26222 | Addgene Plasmid #26222 |
| sequence-based reagent | TaG-Me construct gBlock | Integrated DNA Technologies (IDT) | caaaggaaaaagctgcactgctataca agaaaattatggaaaaatatttgatgtat agtgccttgactagagatcataatcagc cataccacatttgtagaggttttacttgcttt aaaaaacctcccacacctccccctgaac ctgaaacataaaatgaatgcaattgttgtt gttaacttgtttattgcagcttataa CTTCCAACAACCGGAAGTGA NNNNNNNNNNNNNNtggttaca aataaagcaatagcatcacaaatttcaca aataaagcatttttttcactgcattctagtt gtggtttgtccaaactcatcaatgt atcttatcatgtctggatcgatctggccgg ccgtttaaacgaattcttgaagacgaaag ggcctcgtgatacgcctatttttataggttaa tgtcatgataataatg | |
| Sequence-based reagent | SV40_post_R | IDT | GCCAGATCGATCCAGACATGA | |
| Sequence-based reagent | SV40_5 F | IDT | CTCCCCCTGAACCTGAAACA | |
| Sequence-based reagent | B2_3’F1_Nextera | IDT | TCGTCGGCAGCGTCAGATGT GTATAAGAGACAGCTTCCAACAACCGGAAG*TGA | |
| Sequence-based reagent | B2_3’F1_Nextera_2 | IDT | TCGTCGGCAGCGTCAGATGT GTATAAGAGACAGAGCTTCCAACAACCGGAAG*TGA | |
| Sequence-based reagent | B2_3’F1_Nextera_4 | IDT | TCGTCGGCAGCGTCAGATGT GTATAAGAGACAGTCGACTTCCAACAACCGGAAG*TGA | |
| Sequence-based reagent | B2_3’F1_Nextera_6 | IDT | TCGTCGGCAGCGTCAGATGT GTATAAGAGACAGGAAGAGCTTCCAACAACCGGAAG*TGA | |
| Sequence-based reagent | SV40_pre_R_Nextera | IDT | GTCTCGTGGGCTCGGAGATGT GTATAAGAGACAGATTTGTGAAATTTGTGATGCTATTGC*T TT | |
| Sequence-based reagent | SV40_post_R_Nextera | IDT | GTCTCGTGGGCTCGGAGATGT GTATAAGAGACAGGCCAGATCGATCCAGACA*TGA | |
| Sequence-based reagent | Forward indexing primer | IDT | AATGATACGGCGACCACCGAGA TCTACACXXXXXXXXTCGTCGGCAGCGTC | |
| Sequence-based reagent | Reverse indexing primer | IDT | CAAGCAGAAGACGGCATACGAGA TXXXXXXXXGTCTCGTGGGCTCGG | |
| Sequence-based reagent | UMGC_IL_TaGEM_SpikeIn_v1 | IDT | GTGACTGGAGTTCAGACGTGTGCTCTTCCGATCTCTTCCAACAACCGGAAGT*G*A | |
| Sequence-based reagent | UMGC_IL_TaGEM_SpikeIn_v2 | IDT | GTGACTGGAGTTCAGACGTGTGCTCTTCCGATCTGCAGCTTATAACTTCCAACAACCGGAAGT*G*A | |
| Sequence-based reagent | UMGC_IL_TaGEM_SpikeIn_v3 | IDT | TGTGCTCTTCCGATCTGCAGCTTATAACTTCCAACAACCGGAAGT*G*A | |
| Sequence-based reagent | D701_TaGEM | IDT | CAAGCAGAAGACGGCATACGAGATCGAGTAATGTGACTGGAGTTCAGACGTGTGCTCTTC CGATCTGCAGC*T*T | |
| Sequence-based reagent | SI PCR Primer | IDT | AATGATACGGCGACCACCGAGATCTACACTCTTTCCCTACACGACGC*T*C | |
| Sequence-based reagent | UMGC_IL_DoubleNest | IDT | GTGACTGGAGTTCAGACGTGTGCTCTTCCGATCTGCAGCTTATAACTTCCAACAACCGG*A* A | |
| Sequence-based reagent | P5 | IDT | AATGATACGGCGACCACCGA | |
| Sequence-based reagent | D701 | IDT | GATCGGAAGAGCACACGTCTGAACTCCAGTCACATTACTCGATCTCGTATGCCGTCTTCTG CTTG | |
| Sequence-based reagent | D702 | IDT | GATCGGAAGAGCACACGTCTGAACTCCAGTCACTCCGGAGAATCTCGTATGCCGTCTTCT GCTTG | |
| Commercial assay or kit | QIAprep Spin MiniPrep kit | Qiagen | 27104 | |
| Commercial assay or kit | ApaLI restriction enzyme | New England BioLabs (NEB) | R0507S | |
| Commercial assay or kit | PsiI restriction enzyme | NEB | R0657 | |
| Commercial assay or kit | EcoRI restriction enzyme | NEB | R0101S | |
| Commercial assay or kit | Cutsmart Buffer | NEB | B6004S | |
| Commercial assay or kit | Calf Intestinal Phosphatase (CIP) | NEB | M0290S | |
| Commercial assay or kit | T4 DNA ligase | NEB | M0202S | |
| Commercial assay or kit | TOP10 competent cells | Invitrogen | C404010 | |
| Commercial assay or kit | QIAquick Gel Purification Kit | Qiagen | 28104 | |
| Commercial assay or kit | Quant-iT PicoGreen dsDNA assay | ThermoFisher | P11496 | |
| Commercial assay or kit | GeneJET genomic DNA purification Kit | ThermoFisher | K0701 | |
| Commercial assay or kit | Taq DNA Polymerase | Qiagen | 201203 | |
| Commercial assay or kit | Exo-CIP Rapid PCR Cleanup Kit | NEB | E1050S | |
| Commercial assay or kit | Q5 High-Fidelity DNA Polymerase | NEB | M0491S | |
| Commercial assay or kit | KAPA HiFi HotStart ReadyMix | Roche | KK2601 | Material Number: 07958927001 |
| Commercial assay or kit | SequalPrep Normalization Plate Kit, 96-well | ThermoFisher | A1051001 | |
| Commercial assay or kit | Qubit dsDNA high sensitivity assay | ThermoFisher | Q32851 | |
| Commercial assay or kit | Chromium Next GEM Single Cell 3ʹ Kit v3.1, 4 rxns | 10x Genomics | PN-1000269 | |
| Commercial assay or kit | Chromium Next GEM Chip G Single Cell Kit, 16 rxns | 10x Genomics | PN-1000127 | |
| Commercial assay or kit | Dual Index Kit TT Set A, 96 rxns | 10x Genomics | PN-1000215 | |
| Chemical compound, drug | Ampicillin | Sigma | A9518-5G | |
| Chemical compound, drug | AMPure XP beads | Beckman Coulter | A63881 | |
| Chemical compound, drug | D-(+)-Glucose | Sigma-Aldrich | G7021 | |
| Chemical compound, drug | Caffeine | Sigma-Aldrich | W222402 | |
| Chemical compound, drug | Normal Goat Serum | Abcam | ab7481 | |
| Chemical compound, drug | 1xPBS | Corning | 21040CV | |
| Chemical compound, drug | paraformaldehyde | Electron Microscopy Sciences | 15714 | |
| Chemical compound, drug | Triton X-100 | Sigma-Aldrich | X100-5ML | |
| Chemical compound, drug | DAPI solution | ThermoFisher | 62248 | |
| Chemical compound, drug | Elastase | Sigma-Aldrich | E7885-20MG | |
| Chemical compound, drug | SPRIselect | Beckman Coulter | B23318 | |
| Software, algorithm | Photo Booth | Apple | ||
| Software, algorithm | Fiji | Schindelin et al., 2012 | RRID:SCR_002285 | http://fiji.sc |
| Software, algorithm | R | R Project for Statistical Computing | RRID:SCR_001905 | https://www.r-project.org/ |
| Software, algorithm | Python | Python Programming Language | RRID:SCR_008394 | http://www.python.org/ |
| Software, algorithm | BioPython | Cock et al., 2009 | RRID:SCR_007173 | http://biopython.org |
| Software, algorithm | Cell Ranger | 10x Genomics | RRID:SCR_017344 | |
| Software, algorithm | cutadapt | Martin, 2011 | RRID:SCR_011841 | https://cutadapt.readthedocs.io/en/stable/ |
| Software, algorithm | Seurat | Satija et al., 2015 | RRID:SCR_016341 | https://satijalab.org/seurat/get_started.html |
| Software, algorithm | DecontX | Yang et al., 2020 | https://github.com/campbio/celda | |
| Software, algorithm | DoubletFinder | McGinnis et al., 2019 | RRID:SCR_018771 | https://github.com/chris-mcginnis-ucsf/DoubletFinder |
| Software, algorithm | Clustree | Zappia and Oshlack, 2018 | RRID:SCR_016293 | https://CRAN.R-project.org/package=clustree |
| Software, algorithm | SingleR | Aran et al., 2019 | RRID:SCR_023120 | https://www.bioconductor.org/packages/release/bioc/html/SingleR.html |
| Other | LED Strip Light Diffusers | Muzata | HSL-0055 | U1SW WW 1 M, LU1 |
| Other | LED Strip Light, White | LEDJUMP | LJSP-111 | Size 2835, 6000 Kelvin color temperature |
| Other | Arduino Uno Rev 3 | Vilros | ARD_A000066 | See ‘Phototaxis experiments’ in Methods section. |
| Other | Acoustic Foam Panels | ALPOWL | 1”x12”x12”. See ‘Phototaxis experiments’ in Methods section. | |
| Other | 1080 P Day/Night Vision USB Camera, 2MP Infrared Webcam with Automatic IR-Cut Switching and IR LEDs | Arducam | B0506 | See ‘Phototaxis experiments’ in Methods section. |
| Other | AX R confocal microscope | Nikon | See ‘Dissection and immunostaining’ in Methods section. | |
| Other | FlowMi 40 µM tip filter | Bel-Art | H13680-0040 | See ‘Cell dissociation and isolation’ in Methods section. |
| Other | LUNA-FL Dual Fluorescence Cell Counter | Logos Biosystems | L20001 | See ‘Cell dissociation and isolation’ in Methods section. |
| Other | AO/PI dye | Logos Biosystems | F23001 | See ‘Cell dissociation and isolation’ in Methods section. |
| Other | FACSAria II Cell Sorter | BD Biosciences | See ‘Cell dissociation and isolation’ in Methods section. |
Additional files
Download links
A two-part list of links to download the article, or parts of the article, in various formats.
Downloads (link to download the article as PDF)
Open citations (links to open the citations from this article in various online reference manager services)
Cite this article (links to download the citations from this article in formats compatible with various reference manager tools)
Deterministic genetic barcoding for multiplexed behavioral and single-cell transcriptomic studies
eLife 12:RP88334.
https://doi.org/10.7554/eLife.88334.3


