Large-scale animal model study uncovers altered brain pH and lactate levels as a transdiagnostic endophenotype of neuropsychiatric disorders involving cognitive impairment
- Division of Systems Medical Science, Center for Medical Science, Fujita Health University, Japan
- Department of Neurology, National Cerebral and Cardiovascular Center, Japan
- Laboratory of Genome Science, Biosignal Genome Resource Center, Institute for Molecular and Cellular Regulation, Gunma University, Japan
- Department of Biochemistry and Cellular Biology, National Institute of Neuroscience, National Center of Neurology and Psychiatry, Japan
- Department of Synthetic Chemistry and Biological Chemistry, Graduate School of Engineering, Kyoto University, Japan
- Department of Cellular Neurobiology, Graduate School of Medicine, The University of Tokyo, Japan
- Department of Molecular Cellular Physiology, Graduate School of Medicine, University of the Ryukyus, Japan
- Department of Neurology, Jena University Hospital, Germany
- Department of Molecular and Cellular Biology, Medical Institute of Bioregulation, Kyushu University, Japan
- Laboratory of Mammalian Neural Circuits, National Institute of Genetics, Japan
- Department of Molecular Pharmacology and Neurobiology, Yokohama City University Graduate School of Medicine, Japan
- Laboratory for Neurogenetics, RIKEN Center for Brain Science, Japan
- Department of Neurodevelopmental Disorder Genetics, Institute of Brain Sciences, Nagoya City University Graduate School of Medical Sciences, Japan
- Laboratory of Structural Physiology, Center for Disease Biology and Integrative Medicine, Faculty of Medicine, The University of Tokyo, Japan
- Department of Physiology, Kitasato University School of Medicine, Japan
- International Research Center for Neurointelligence (WPI-IRCN), UTIAS, The University of Tokyo, Japan
- Research Core, Tokyo Medical and Dental University, Japan
- Department of Stem Cell Regulation, Medical Research Institute, Tokyo Medical and Dental University, Japan
- Department of Biochemistry, Faculty of Pharmacy, Cairo University, Egypt
- Department of Behavioral Physiology, Graduate School of Innovative Life Science, University of Toyama, Japan
- Medical Research Institute, Kanazawa Medical University, Japan
- Department of Behavioral Physiology, Faculty of Medicine, University of Toyama, Japan
- Department of Neuroscience, Southern Research, United States
- Institute for Developmental Research, Aichi Developmental Disability Center, Japan
- Department of Endocrinology, Diabetes and Metabolism, School of Medicine, Fujita Health University, Japan
- Department of Neuropsychiatry, Hyogo Medical University School of Medicine, Japan
- Department of Psychiatry and Behavioral Sciences, Northwestern University Feinberg School of Medicine, United States
- Department of Molecular Neurobiology, Faculty of Medicine, Kagawa University, Japan
- Department of Peripheral Nervous System Research, National Institute of Neuroscience, National Center of Neurology and Psychiatry, Japan
- Department of Molecular & Cellular Physiology, Shinshu University School of Medicine, Japan
- Department of Mental Disorder Research, National Institute of Neuroscience, National Center of Neurology and Psychiatry, Japan
- Department of Psychiatry, Teikyo University School of Medicine, Japan
- Program of Developmental Neurobiology, National Institute of Child Health and Human Development, National Institutes of Health, United States
- Laboratory of Molecular Neuropharmacology, Graduate School of Pharmaceutical Sciences, Osaka University, Japan
- Department of Pharmacology, Graduate School of Dentistry, Osaka University, Japan
- United Graduate School of Child Development, Osaka University, Kanazawa University, Hamamatsu University School of Medicine, Chiba University and University of Fukui, Japan
- Division of Bioscience, Institute for Datability Science, Osaka University, Japan
- Transdimensional Life Imaging Division, Institute for Open and Transdisciplinary Research Initiatives, Osaka University, Japan
- Department of Molecular Pharmaceutical Science, Graduate School of Medicine, Osaka University, Japan
- RIKEN Brain Science Institute, Japan
- Department of Physiology and Cell Biology, Kobe University School of Medicine, Japan
- Laboratory for Molecular Dynamics of Mental Disorders, RIKEN Center for Brain Science, Japan
- Institute of Biology and Environmental Sciences, Carl von Ossietzky University of Oldenburg, Germany
- Department of Psychiatry and Behavioral Science, Juntendo University Graduate School of Medicine, Japan
- Department of Pathology, Stanford University School of Medicine, United States
- Department of Pharmacology, Kyoto Prefectural University of Medicine, Japan
- Department of Molecular Pharmacology, Graduate School of Pharmaceutical Sciences, Kyoto University, Japan
- Department of Biomedical Science, Graduate School of Pharmaceutical Sciences, Nagoya City University, Japan
- Laboratory of Medical Neuroscience, Institute for Molecular and Cellular Regulation, Gunma University, Japan
- Laboratory for Multi-scale Biological Psychiatry, RIKEN Center for Brain Science, Japan
- Institut des Neurosciences Cellulaires et Intégratives, Centre National de la Recherche Scientifique, Université de Strasbourg, France
- Addictive Substance Project, Tokyo Metropolitan Institute of Medical Science, Japan
- Department of Biological Sciences, College of Natural Sciences, Seoul National University, Republic of Korea
- Department of Biomedical Engineering, Johns Hopkins School of Medicine, United States
- Center for Cognition and Sociality, Institute for Basic Science (IBS), Republic of Korea
- College of Agriculture, Ibaraki University, Japan
- United Graduate School of Agricultural Science, Tokyo University of Agriculture and Technology, Japan
- Ibaraki University Cooperation between Agriculture and Medical Science (IUCAM), Japan
- Genes to Cognition Program, Centre for Clinical Brain Sciences, University of Edinburgh, United Kingdom
- Simons Initiative for the Developing Brain, Centre for Discovery Brain Sciences, University of Edinburgh, United Kingdom
- Department of Developmental and Regenerative Medicine, Mie University, Graduate School of Medicine, Japan
- Department of Biosignaling and Radioisotope Experiment, Interdisciplinary Center for Science Research, Organization for Research and Academic Information, Shimane University, Japan
- Department of Biomedical Engineering, Osaka Institute of Technology, Japan
- Department of Physiology, Okayama University Graduate School of Medicine, Dentistry and Pharmaceutical Sciences, Japan
- Child Brain Project, Tokyo Metropolitan Institute of Medical Science, Japan
- Division for Therapies Against Intractable Diseases, Center for Medical Science, Fujita Health University, Japan
- Research Center for Idling Brain Science, University of Toyama, Japan
- Department of Biochemistry, Graduate School of Medicine and Pharmaceutical Sciences, University of Toyama, Japan
- Core Research for Evolutionary Science and Technology (CREST), Japan Science and Technology Agency (JST), University of Toyama, Japan
- Faculty of Pharmaceutical Sciences, Hokkaido University, Japan
- Department of Anatomy II, Fujita Health University School of Medicine, Japan
- Department of Medical Chemistry, Kansai Medical University, Japan
- Department of Developmental Medical Sciences, Graduate School of Medicine, The University of Tokyo, Japan
- Laboratory for Systems Molecular Ethology, RIKEN Center for Brain Science, Japan
- Department of Neurochemistry and Molecular Cell Biology, School of Medicine, and Graduate School of Medical and Dental Sciences, Niigata University, Japan
- Transdiciplinary Research Program, Niigata University, Japan
- Biomedical Research Institute, National Institute of Advanced Industrial Science and Technology (AIST), Japan
- Institute of Life and Environmental Sciences, University of Tsukuba, Japan
- Graduate School of Science and Technology, University of Tsukuba, Japan
- Integrated Technology Research Laboratories, Pharmaceutical Research Division, Takeda Pharmaceutical Company, Ltd, Japan
- Department of Genetic Disease Research, Osaka City University Graduate School of Medicine, Japan
- Department of Pediatrics, Hokkaido University Graduate School of Medicine, Japan
- Laboratory of Toxicology and Safety Science, Graduate School of Pharmaceutical Sciences, Osaka University, Japan
- Glycan & Life Systems Integration Center (GaLSIC), Soka University, Japan
- Graduate School of Frontier Biosciences, Osaka University, Japan
- Laboratory of Morphogenesis, National Institute for Basic Biology, Japan
- Division of Biophysics and Neurobiology, National Institute for Physiological Sciences, Japan
- Laboratory of Neuronal Cell Biology, National Institute for Basic Biology, Japan
- Department of Basic Biology, SOKENDAI (Graduate University for Advanced Studies), Japan
- Exploratory Research Center on Life and Living Systems (ExCELLS), National Institutes of Natural Sciences, Japan
- Department of Biological Sciences, School of Science, The University of Tokyo, Japan
- Healthy Food Science Research Group, Cellular and Molecular Biotechnology Research Institute, National Institute of Advanced Industrial Science and Technology (AIST), Japan
- Department of Applied Biological Science, Graduate School of Science and Technology, Tokyo University of Science, Japan
- Department of Computational Biology and Medical Sciences, Graduate School of Frontier Sciences, The University of Tokyo, Japan
- School of Integrative and Global Majors (SIGMA), University of Tsukuba, Japan
- Department of Molecular Neuroscience, Graduate School of Medicine and Pharmaceutical Sciences, University of Toyama, Japan
- Mouse Phenotype Analysis Division, Japan Mouse Clinic, RIKEN BioResource Research Center (BRC), Japan
- Graduate School of Life Sciences, Tohoku University, Japan
- Young Researcher Support Group, Research Enhancement Strategy Office, National Institute for Basic Biology, National Institute of Natural Sciences, Japan
- Division of Brain Biology, National Institute for Basic Biology, Japan
- Laboratory for Molecular Analysis of Higher Brain Function, RIKEN Center for Brain Science, Japan
- Department of Cellular Neurobiology, Brain Research Institute, Niigata University, Japan
- Department of Animal Model Development, Brain Research Institute, Niigata University, Japan
Figures
Figure 1 with 2 supplements
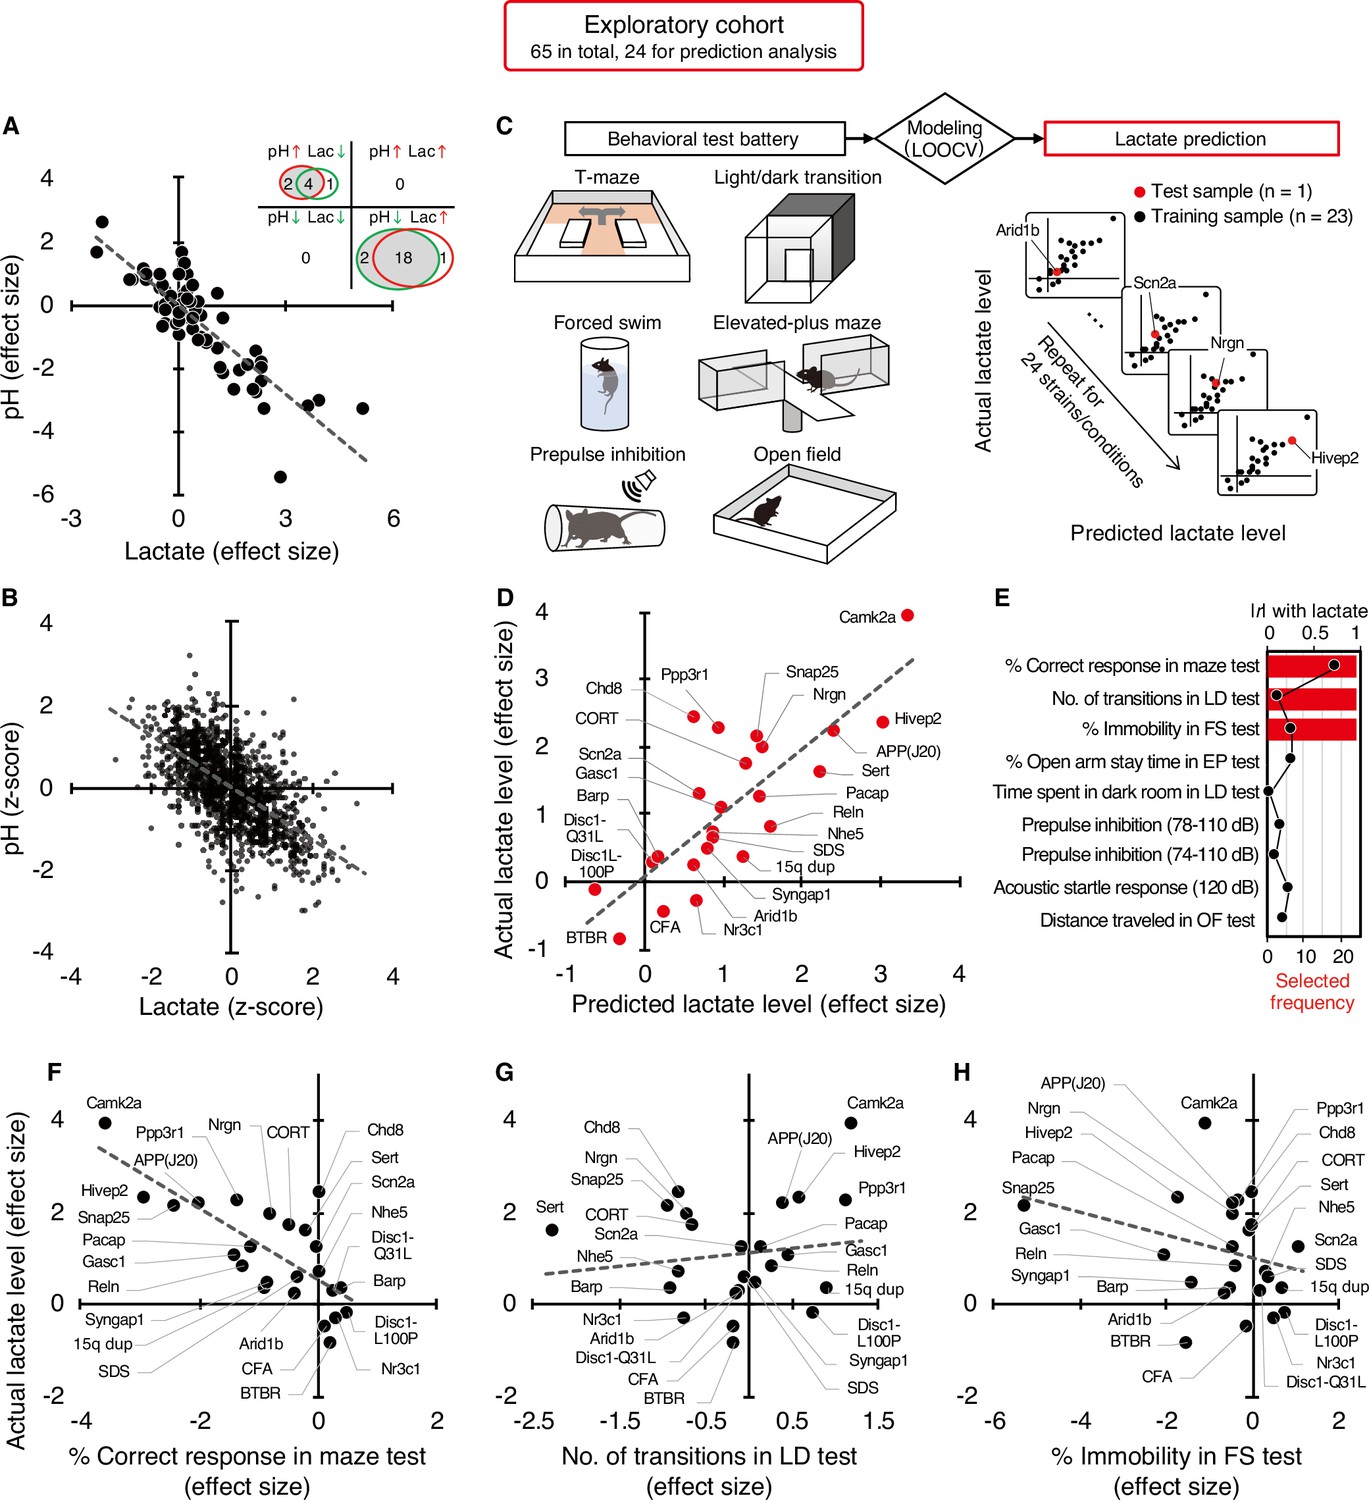
Increased brain lactate levels correlated with decreased pH are associated with poor working memory.
(A) Venn diagrams show the number of strains/conditions of animal models with significant changes (P<0.05 compared with the corresponding controls) in brain pH and lactate levels in an exploratory cohort. Scatter plot shows the effect size-based correlations between pH and lactate levels of 65 strains/conditions of animals in the cohort. (B) Scatter plot showing the z-score-based correlations between pH and lactate levels of 1,239 animals in the cohort. A z-score was calculated for each animal within the strain/condition and used in this study. (C) Schematic diagram of the prediction analysis pipeline. Statistical learning models with leave-one-out cross-validation (LOOCV) were built using a series of behavioral data to predict brain lactate levels in 24 strains/conditions of mice in an exploratory cohort. (D) The scatter plot shows significant correlations between predicted and actual lactate levels. (E) Feature preference for constructing the model to predict brain lactate levels. Bar graphs indicate the selected frequency of behavioral indices in the LOOCV. Line graph indicates absolute correlation coefficient between brain lactate levels and each behavioral measure of the 24 strains/conditions of mice. r, Pearson’s correlation coefficient. (F–H) Scatter plot showing correlations between actual brain lactate levels and measures of working memory (correct responses in maze test) (F), the number of transitions in the light/dark transition test (G), and the percentage of immobility in the forced swim test (H).
Figure 1—figure supplement 1
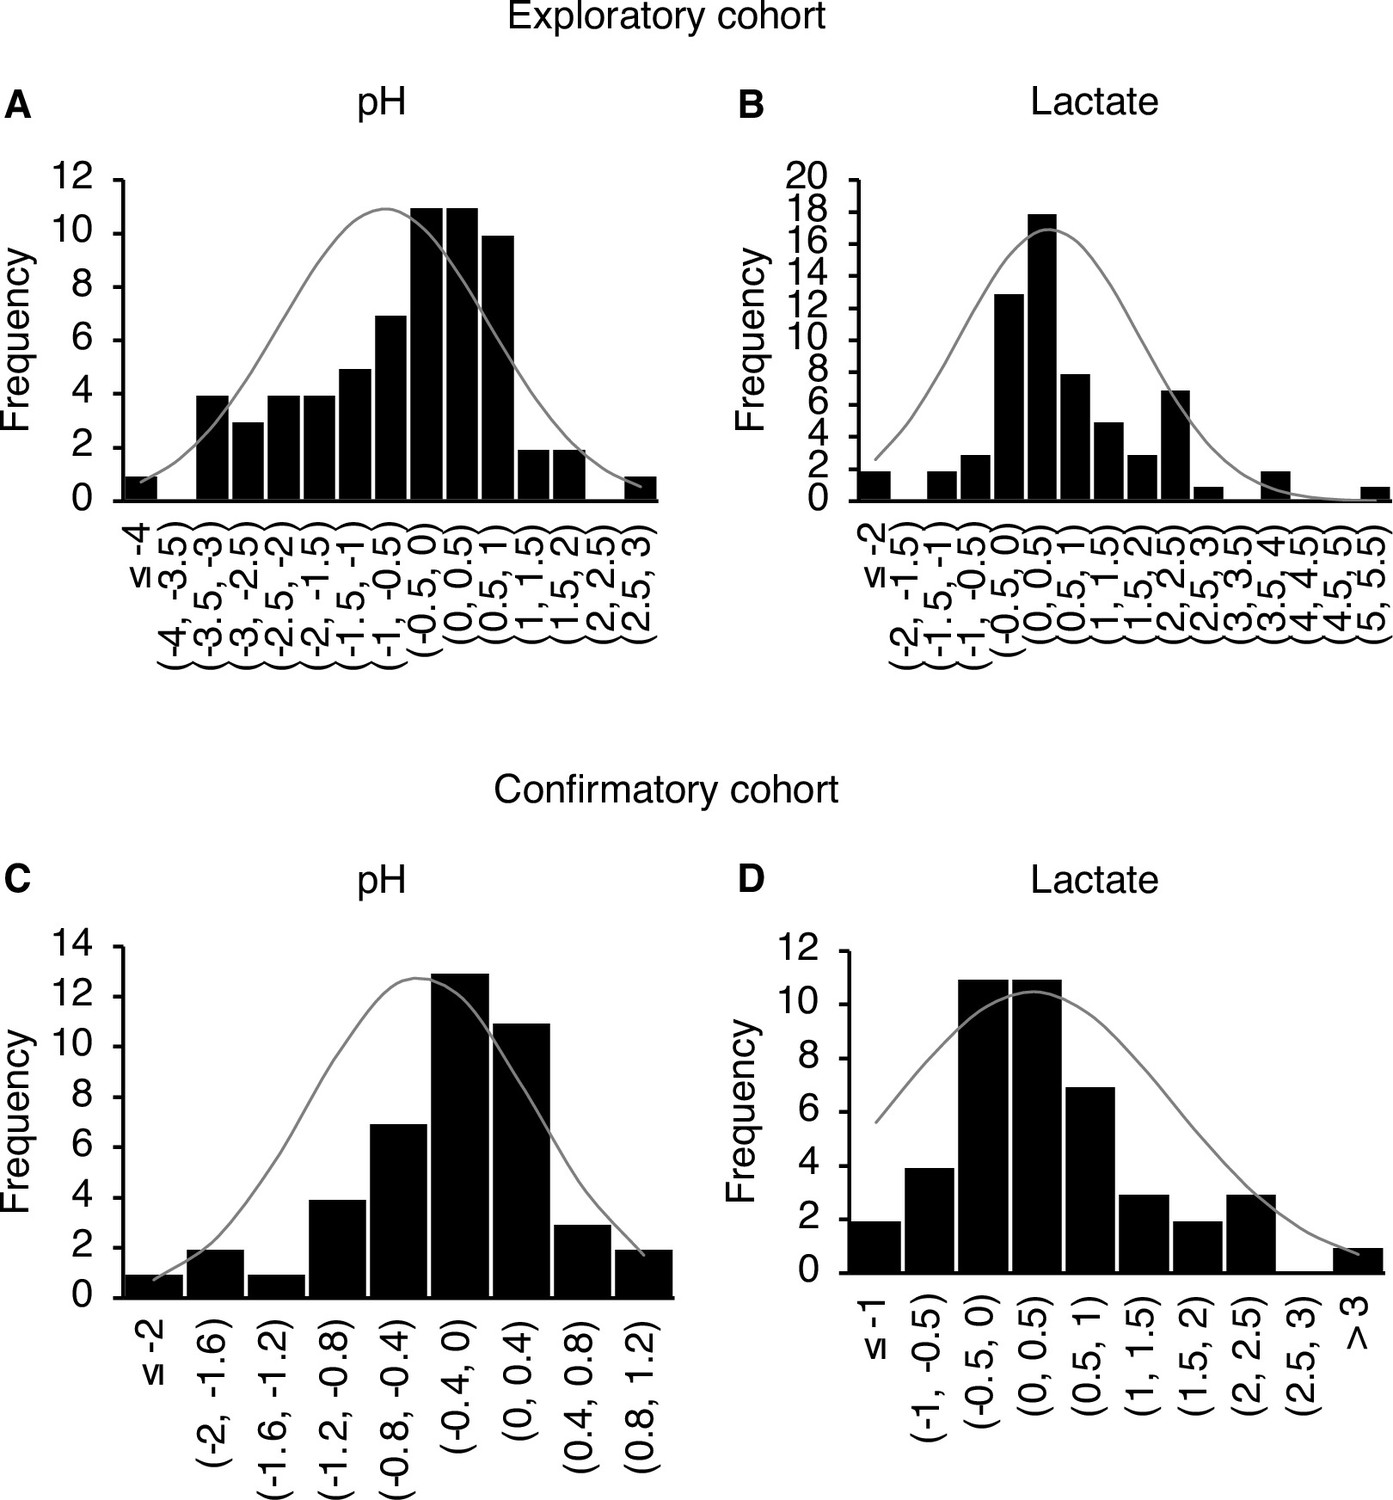
Normal distribution of effect size values for pH and lactate in the exploratory and confirmatory cohorts.
(A) D=0.12, P=0.32. (B) D=0.15, P=0.088. (C) D=0.14, P=0.33. (D) D=0.18, P=0.10.
Figure 1—figure supplement 2
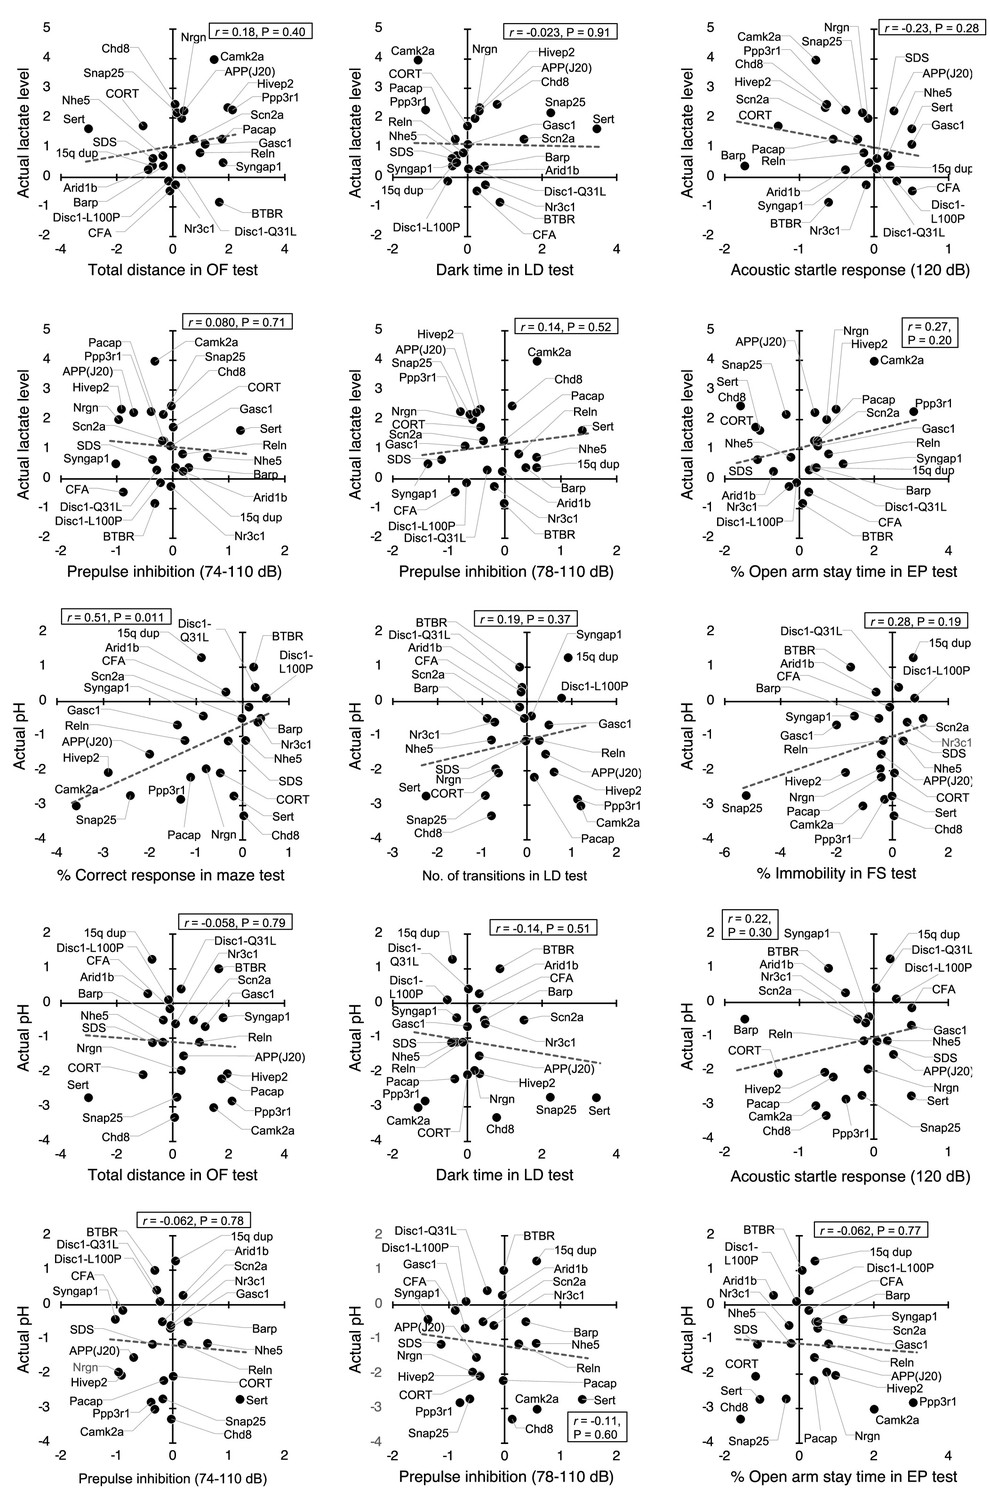
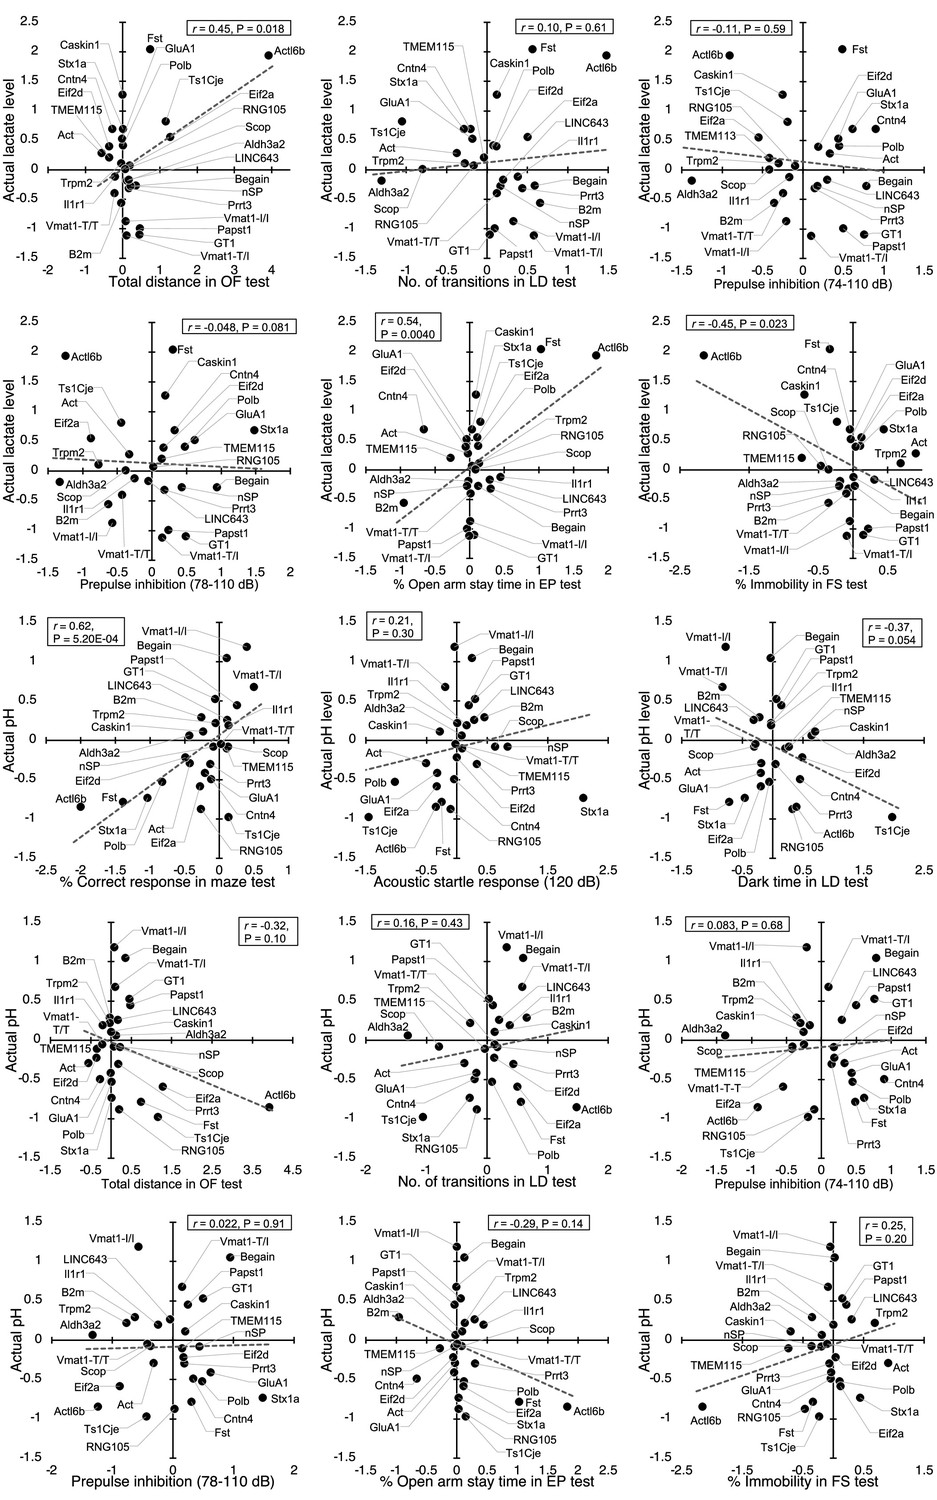
Correlations of brain lactate levels and pH with behavioral measures in an exploratory cohort.
Scatter plots showing effect size-based correlations between actual lactate levels and pH, and behavioral measures. Data from 24 strains/conditions of mice used in the prediction analysis are shown. EP, elevated-plus maze; FS, forced swim test; LD, light/dark transition test; OF, open field test; r, Pearson’s correlation coefficient.
Figure 2 with 6 supplements
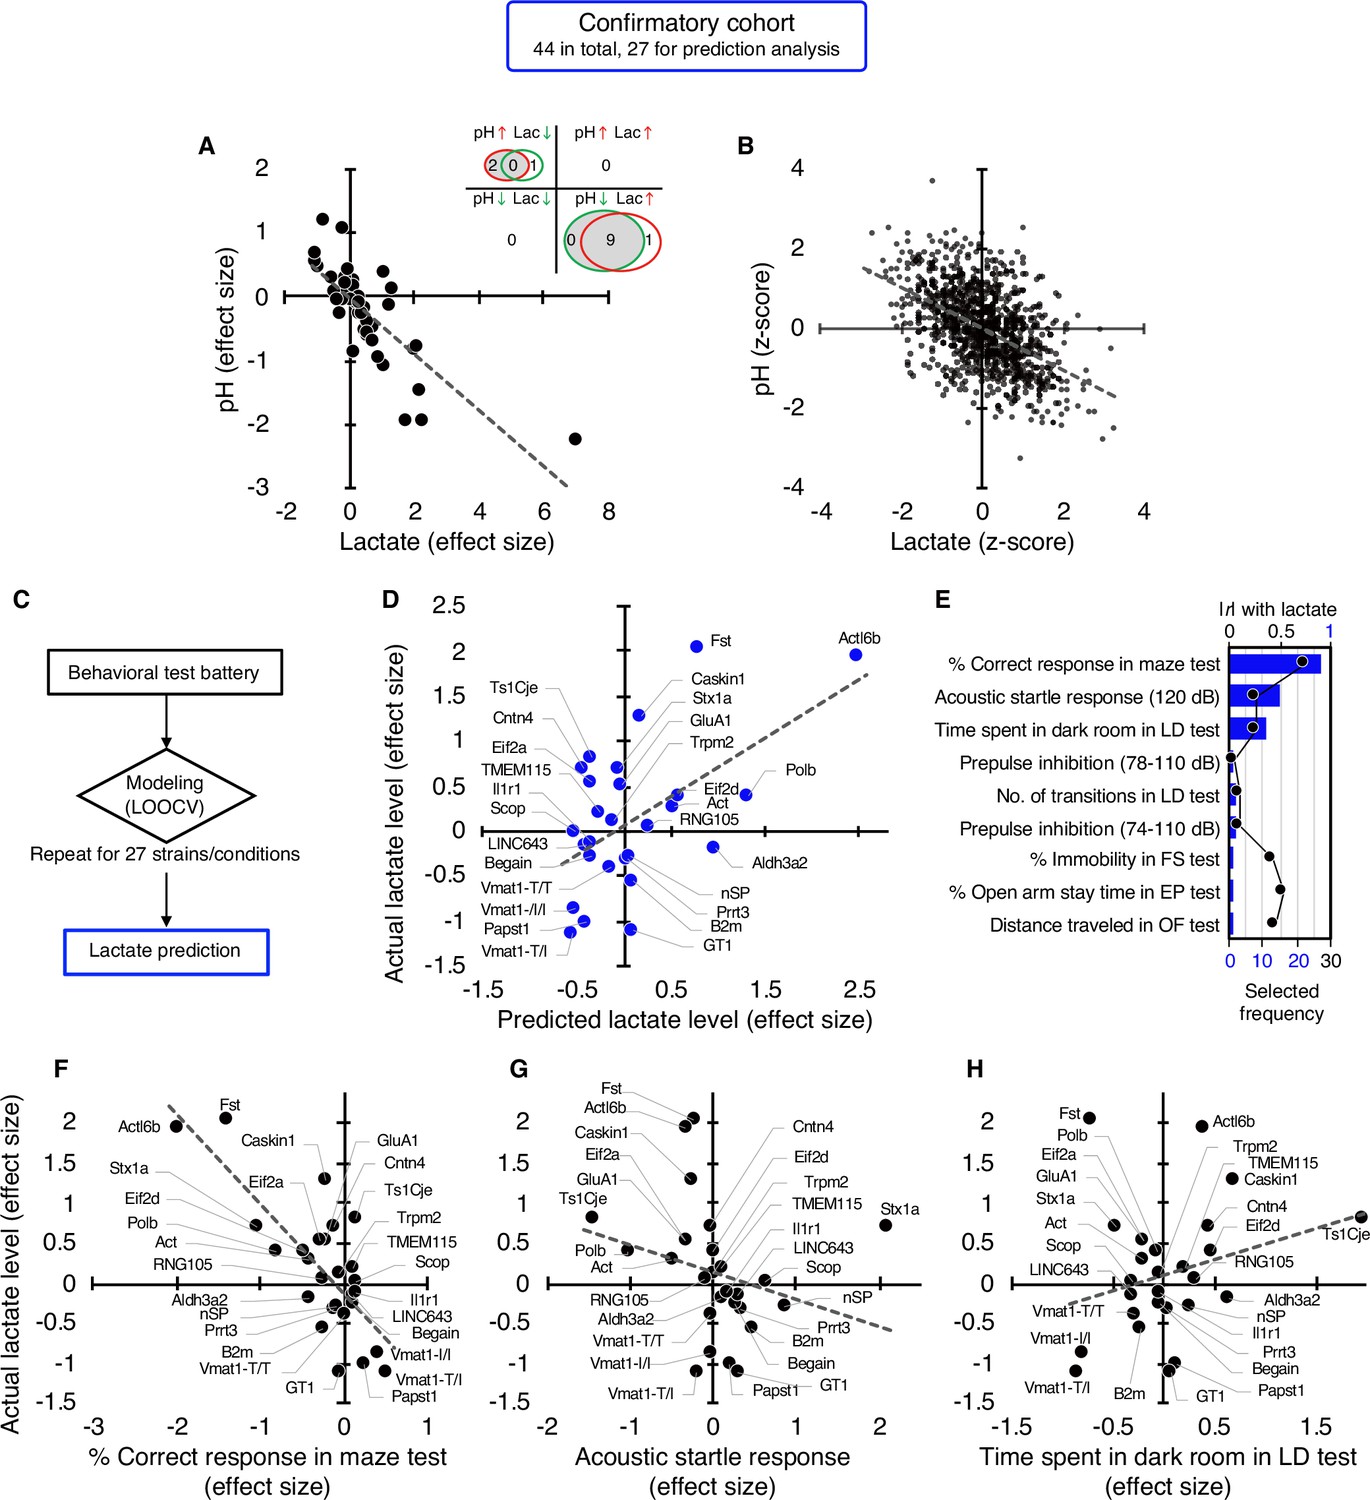
Studies in an independent confirmatory cohort validate the negative correlation of brain lactate levels with pH and the association of increased lactate with poor working memory.
(A) Venn diagrams show the number of strains/conditions of animal models with significant changes (P<0.05 compared with the corresponding controls) in brain pH and lactate levels in a confirmatory cohort. Scatter plot shows the effect size-based correlations between pH and lactate levels of 44 strains/conditions of animals in the cohort. (B) Scatter plot showing the z-score-based correlations between pH and lactate levels of 1,055 animals in the cohort. (C) Statistical learning models with leave-one-out cross-validation (LOOCV) were built using a series of behavioral data to predict brain lactate levels in 27 strains/conditions of mice in the confirmatory cohort. (D) The scatter plot shows significant correlations between predicted and actual lactate levels. (E) Feature preference for constructing the model to predict brain lactate levels. Bar graphs indicate the selected frequency of behavioral indices in the LOOCV. Line graph indicates absolute correlation coefficient between brain lactate levels and each behavioral index of the 27 strains of mice. r, Pearson’s correlation coefficient. (F–H) Scatter plots showing correlations between actual brain lactate levels and working memory measures (correct responses in the maze test) (F), the acoustic startle response at 120 dB (G), and the time spent in dark room in the light/dark transition test (H). Figure supplements.
Figure 2—figure supplement 1
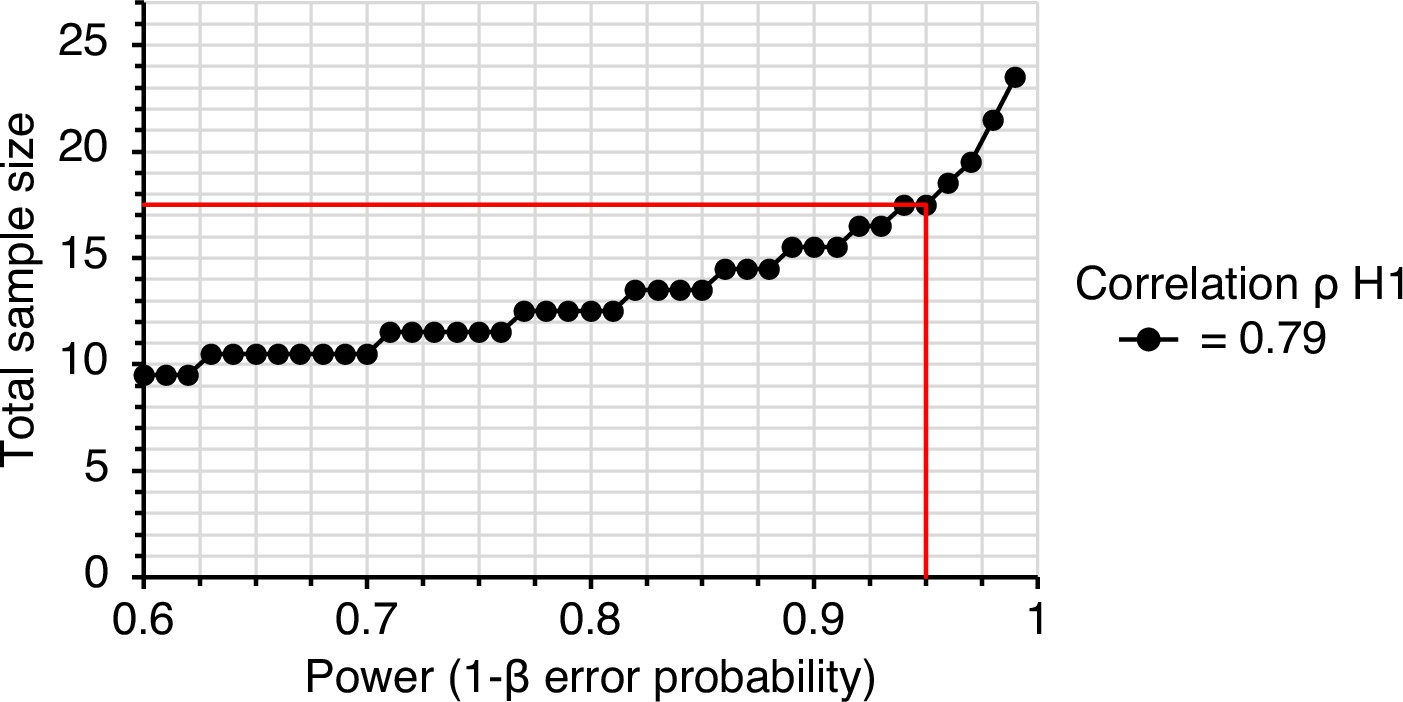
A priori power analysis to estimate the optimum sample size for the confirmatory experiment.
Input parameters: tails = two, correlation |ρ| H1=0.79, α error probability = 0.01, power (1–β error probability)=0.95, correlation |ρ| H0=0. Output parameters: total sample size = 18, actual power = 0.95. The red line indicates 1–β=0.95.
Figure 2—figure supplement 2
Correlations of brain lactate levels and pH with behavioral measures in a confirmatory cohort.
Scatter plots showing effect size-based correlations between actual lactate levels and pH, and behavioral measures. Data from 27 strains/conditions of mice used in the prediction analysis are shown. EP, elevated-plus maze; FS, forced swim test; LD, light/dark transition test; OF, open field test; r, Pearson’s correlation coefficient.
Figure 2—figure supplement 3
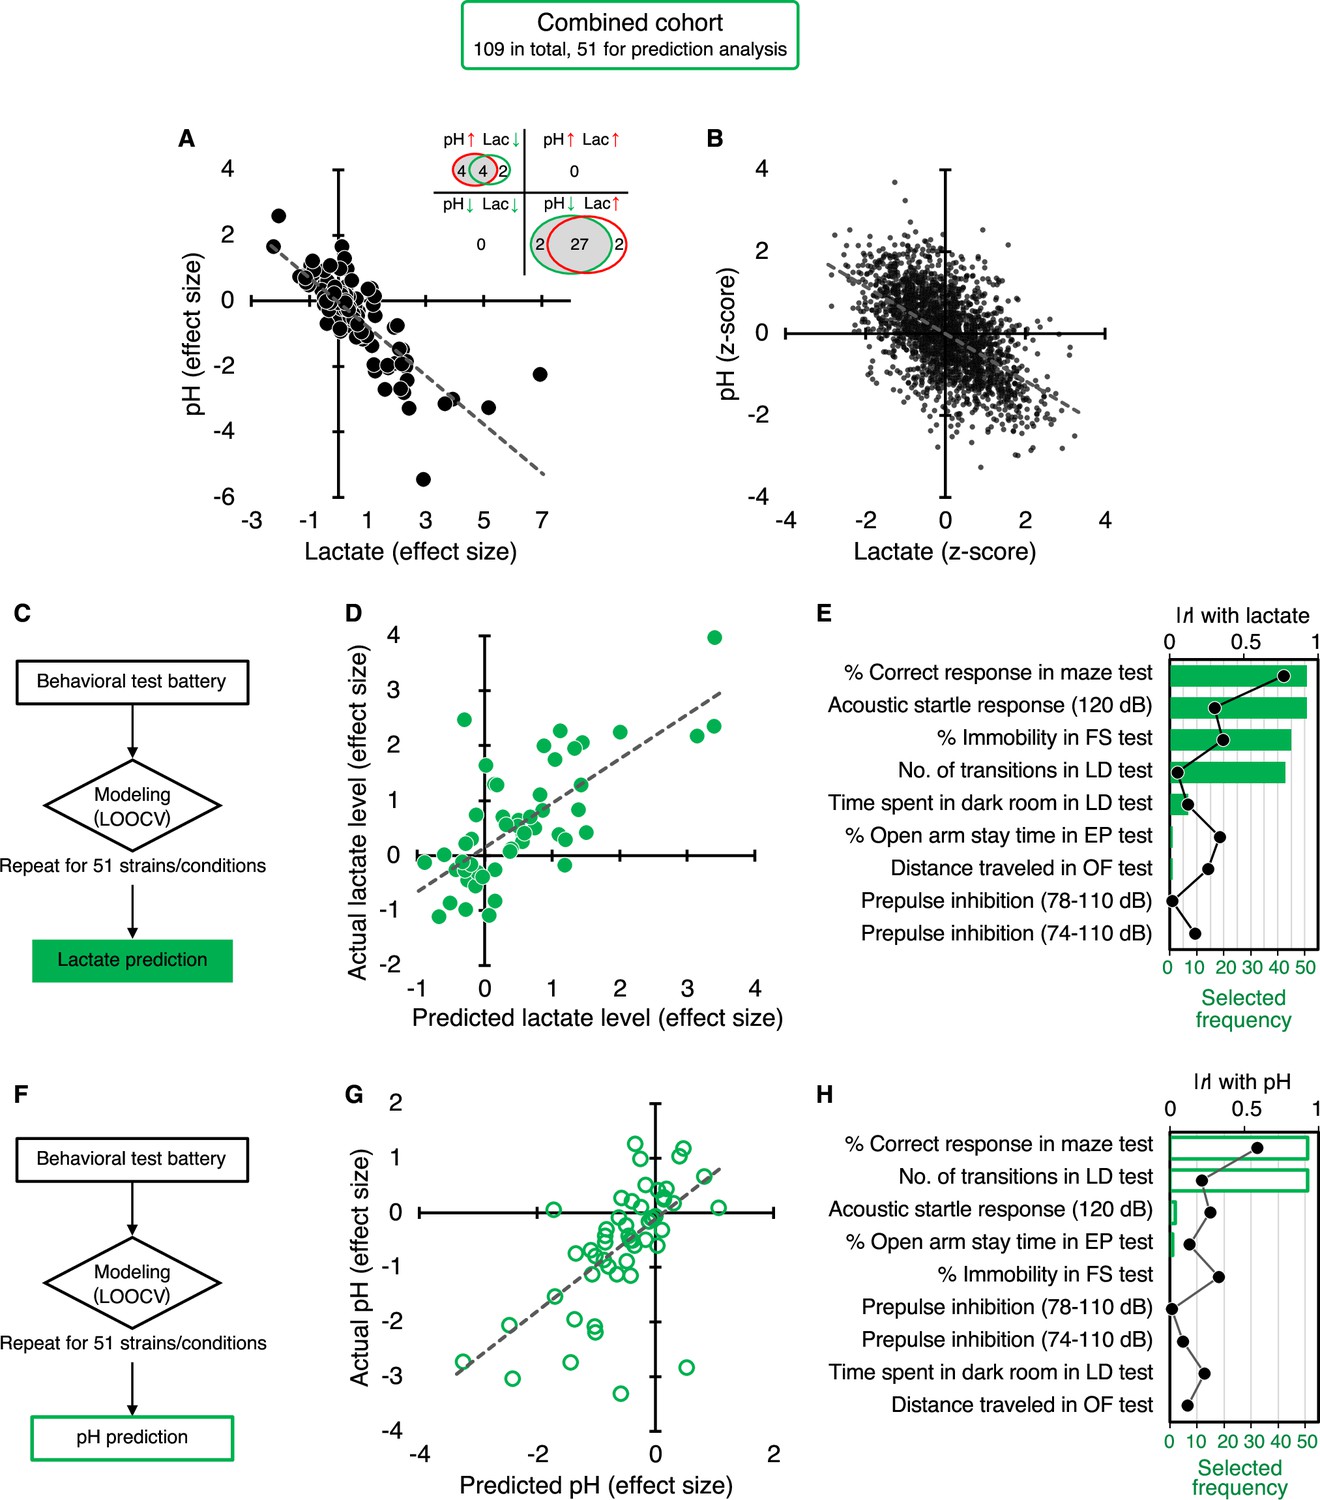
Correlation of increased brain lactate levels and decreased pH and their associations with poor working memory: studies in a combined cohort.
(A) Venn diagrams show the number of strains/conditions of animal models with significant changes (P<0.05 compared to the corresponding controls) in brain pH and lactate levels in a combined cohort. Scatter plot shows the effect size-based correlations between pH and lactate levels of 109 strains/conditions of animals combined. (B) Scatter plot showing z-score-based correlations between pH and lactate levels of 2,294 animals combined. A z-score was calculated for each animal within strain/condition. (C–H) Prediction of brain lactate levels (C–E) and pH (F–H) from behavioral outcomes in 51 strains/conditions of animals. The scatter plot shows correlations between predicted and actual lactate levels (D) and pH values (G). Feature preference for constructing the model to predict brain lactate levels (E) and pH (H). Bar graphs indicate the selected frequency of behavioral indices in the LOOCV. Line graph shows the absolute correlation coefficient between brain lactate levels and pH, and each behavioral index of 51 mouse strains. r, Pearson’s correlation coefficient.
Figure 2—figure supplement 4
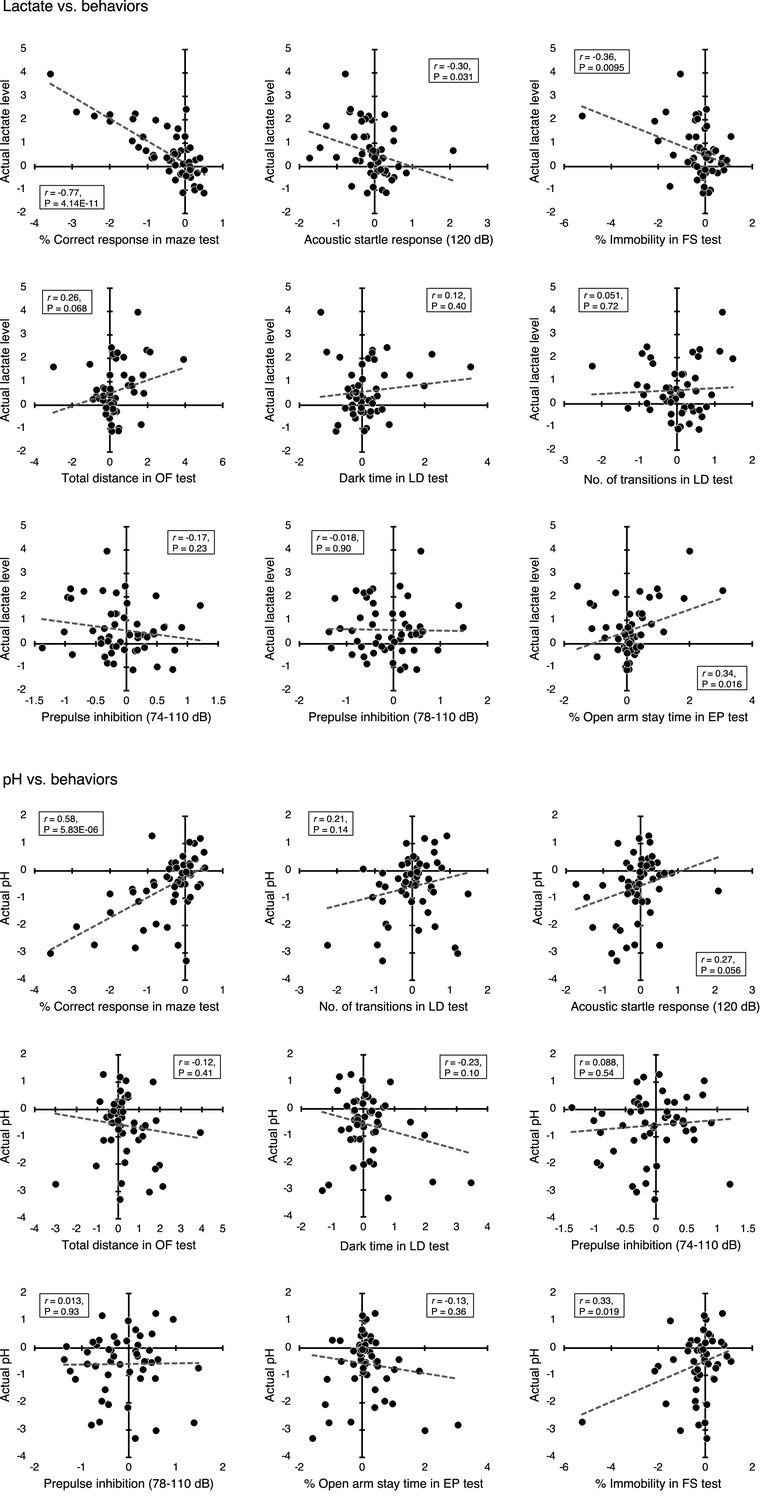
Correlations of brain lactate levels and pH with behavioral measures in a combined cohort.
Scatter plots showing effect size-based correlations between actual lactate levels and pH, and behavioral measures. Data from 51 strains/conditions of mice used in the prediction analysis are shown. EP, elevated-plus maze; FS, forced swim test; LD, light/dark transition test; OF, open field test; r, Pearson’s correlation coefficient.
Figure 2—figure supplement 5
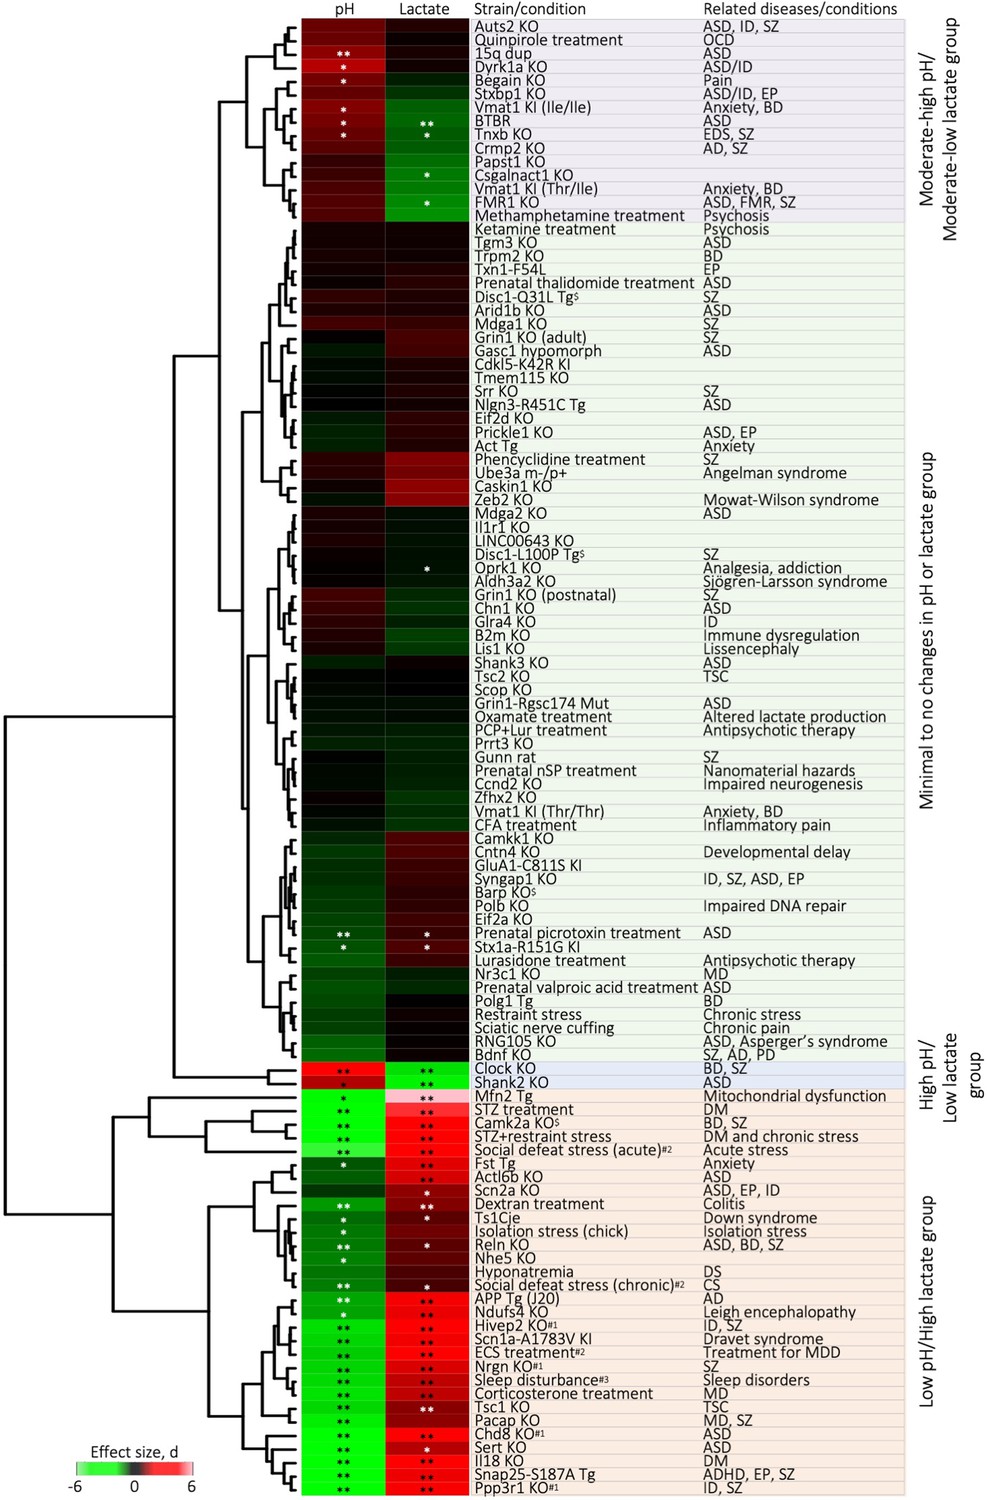
Hierarchical clustering of 109 strains/conditions of animals with respect to brain pH and lactate levels.
The effect size was calculated for each strain/condition and was used in this analysis. #1pH and lactate data have been previously reported (Hagihara et al., 2018). #2Lactate data have been reported previously (Hagihara et al., 2021a). #3Lactate data have been submitted elsewhere. Asterisks indicate significant effects of genotype/condition. *p < 0.05, **p < 0.01; unpaired t-test, or one-way or two-way ANOVA followed by post hoc Tukey’s multiple comparison test. Detailed statistical analysis is shown in Supplementary file 3. AD, Alzheimer’s disease; ADHD, attention-deficit/hyperactivity disorder; ASD, autism spectrum disorders; BD, bipolar disorder; CS, chronic stress; DM, diabetes mellitus; EDS, Ehlers-Danlos syndrome; DS, depression symptom; EP, epilepsy; FMR, Fragile X mental retardation; ID, intellectual disability, KI, knock-in; KO, knock out; MD, major depressive disorder; OCD, obsessive-compulsive disorder; PD, Parkinson’s disease; SZ, schizophrenia; Tg, transgenic; TSC, tuberous sclerosis complex.
Figure 2—figure supplement 6
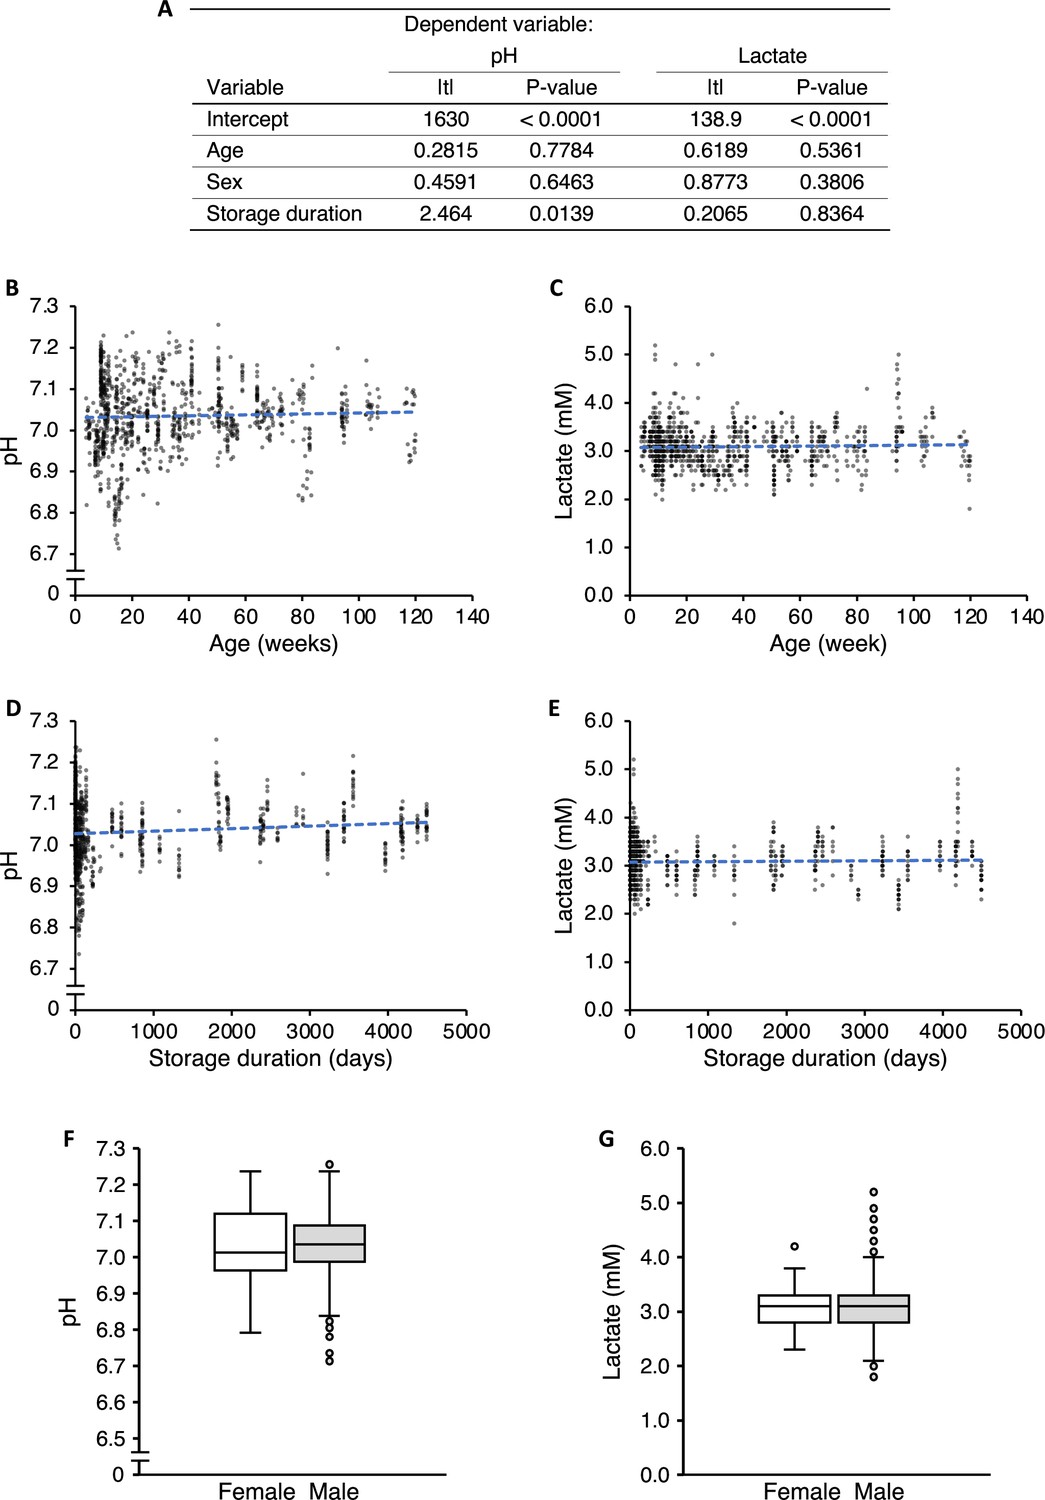
Effects of age, sex, and storage duration on brain pH and lactate levels.
(A) Multivariate linear regression analysis. (B, C) Scatter plots showing correlations between age at sampling and raw pH (B), and lactate values (C) in wild-type/control animals. (D, E) Scatter plots showing correlations between storage duration and pH (D), and lactate values (E) in the wild-type/control animals. (F, G) Box plots of pH (F) and lactate values (G) in wild-type/control animals of each sex.
Tables
Key resources table
| Reagent type (species) or resource | Designation | Source or reference | Identifiers | Additional information |
|---|---|---|---|---|
| Biological sample (mice, rats, and chicks) | See Supplementary files 1 and 2 | |||
| Commercial assay or kit | Lactate Lysing Reagent | Analox Instruments | GMRD-103 | |
| Software, algorithm | EZR software | Saitama Medical Center, Jichi Medical University (Kanda, 2013) |
Additional files
-
Supplementary file 1
Animal models used in this study.
- https://cdn.elifesciences.org/articles/89376/elife-89376-supp1-v1.docx
-
Supplementary file 2
Raw data of brain pH and lactate, as well as information about animals and brain samples (age at sampling, sex, duration of storage in the freezer, and treatment procedures).
- https://cdn.elifesciences.org/articles/89376/elife-89376-supp2-v1.xlsx
-
Supplementary file 3
Detailed statistical analysis of pH and lactate measurements in 109 strains/conditions of animals.
- https://cdn.elifesciences.org/articles/89376/elife-89376-supp3-v1.xlsx
-
Supplementary file 4
Source of behavioral data used in prediction analysis.
- https://cdn.elifesciences.org/articles/89376/elife-89376-supp4-v1.xlsx
-
Supplementary file 5
The effect size values used in prediction analysis.
- https://cdn.elifesciences.org/articles/89376/elife-89376-supp5-v1.xlsx
-
MDAR checklist
- https://cdn.elifesciences.org/articles/89376/elife-89376-mdarchecklist1-v1.docx
Download links
A two-part list of links to download the article, or parts of the article, in various formats.
Downloads (link to download the article as PDF)
Open citations (links to open the citations from this article in various online reference manager services)
Cite this article (links to download the citations from this article in formats compatible with various reference manager tools)
Large-scale animal model study uncovers altered brain pH and lactate levels as a transdiagnostic endophenotype of neuropsychiatric disorders involving cognitive impairment
eLife 12:RP89376.
https://doi.org/10.7554/eLife.89376.3


