Measures of genetic diversification in somatic tissues at bulk and single-cell resolution
- Department of Mathematics, Queen Mary University of London, United Kingdom
- Evolutionary Dynamics Group, Centre for Cancer Genomics and Computational Biology, Barts Cancer Centre, Queen Mary University of London, United Kingdom
- Interuniversity Institute of Bioinformatics in Brussels, Université Libre de Bruxelles, Belgium
- Group of Theoretical Biology, The State Key Laboratory of Biocontrol, School of Life Science, Sun Yat-sen University, China
Figures
Figure 1
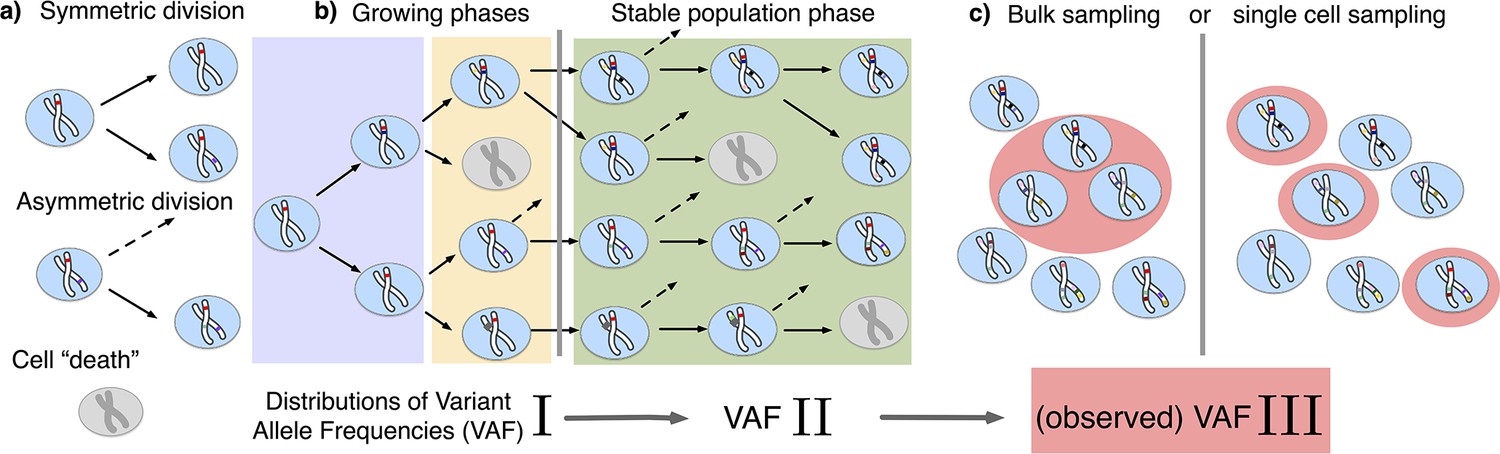
The distribution of variant allele frequencies changes with the growth phases and by sampling.
(a) In the current population, cells divide symmetrically into two daughter cells or asymmetrically with only one daughter cell kept in the focused population. All other events are mathematically equivalent to and are treated as a part of cell death. (b) The rates of symmetric and asymmetric division change during the population growth and lead to a dynamic distribution of variant allele frequencies. (c) The observed VAF distribution is shifted again during sampling compared to the VAF of the whole population – a fact should be considered when inferring population properties through genetic data.
Figure 2 with 1 supplement
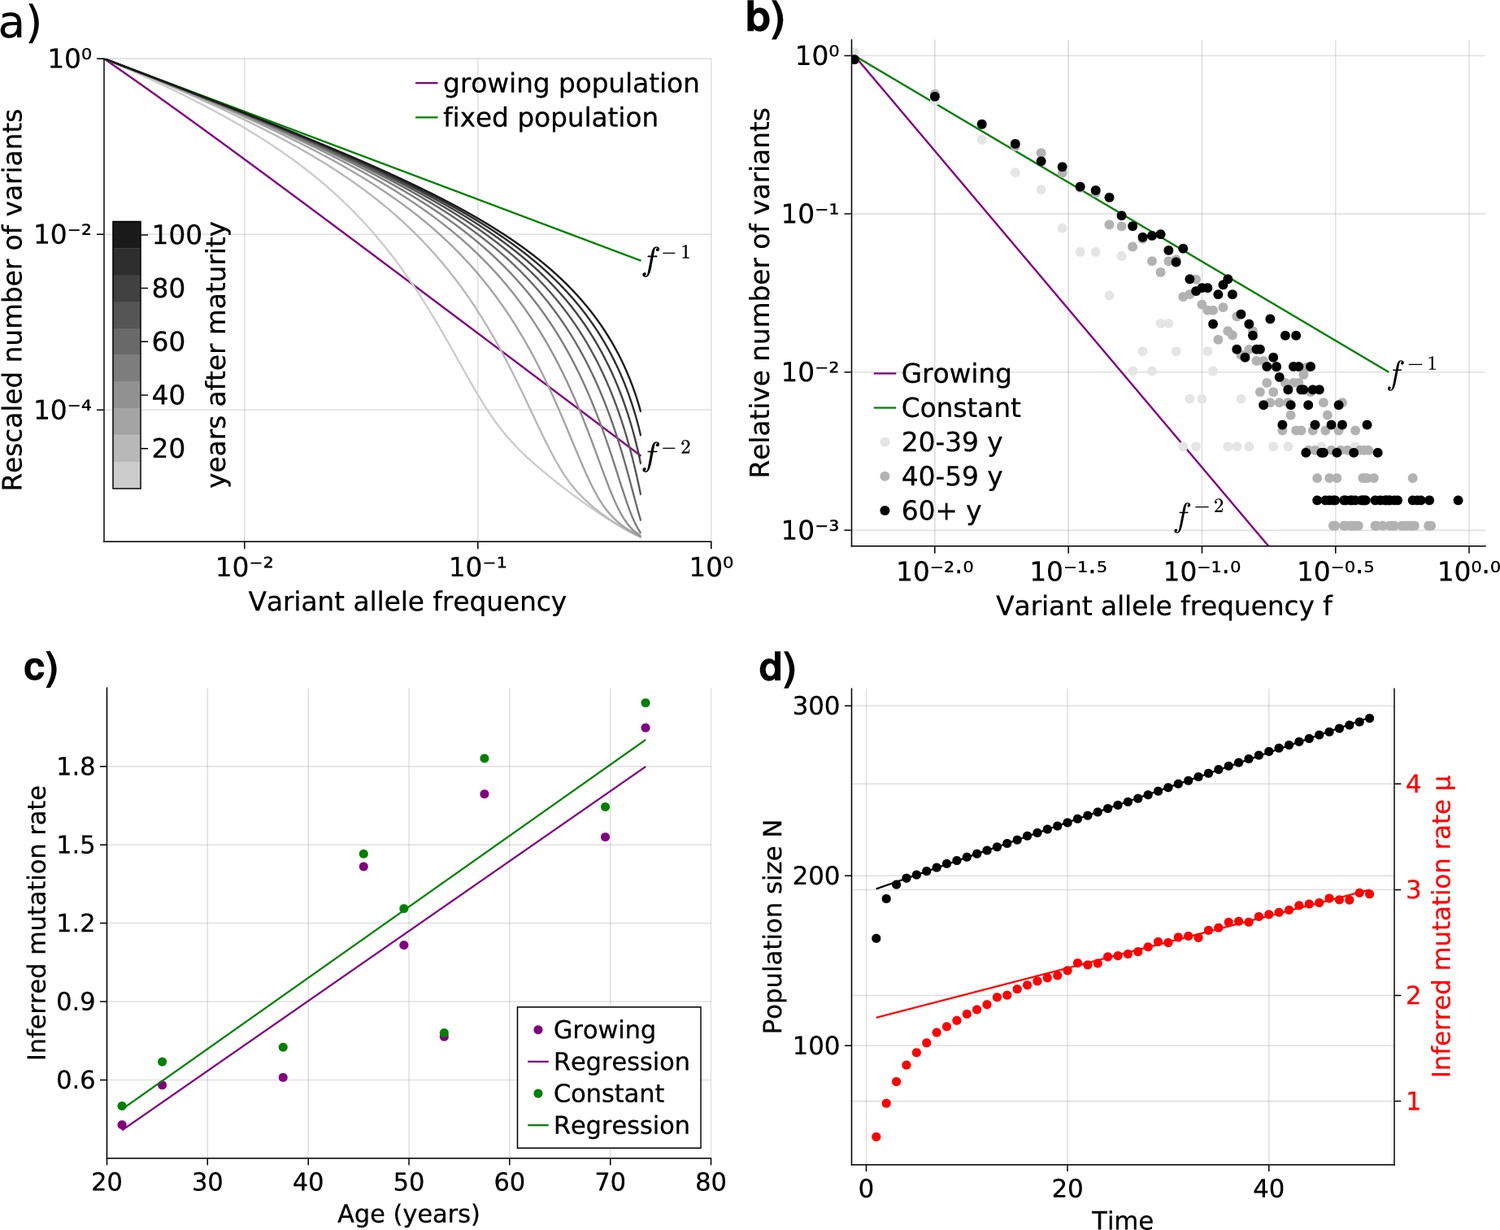
Bulk sequencing based variant allele frequency (VAF) and mutation rate inferences in healthy esophagus.
(a) Expected VAF distributions from evolving Equation 1 to different time points for a population with an initial exponential growth phase and subsequent constant population phase (mature size ). Once the population reaches the maximum carrying capacity, the distribution moves from a growing population shape (purple) to a constant population shape (green). Note that the shift slows considerably at older age. (b) VAF from healthy tissue in the esophagus of nine individuals sorted into age brackets. The youngest bracket, 20–39, is closer to the developmental scaling. The older age brackets are both close to the constant population scaling, resembling the theoretical expectations. (c) Inferred mutation rates increase linearly with age. (d) Simulations of slowly growing stem cell populations reveal that mutation rates appear to increase with age, although the true underlying per division mutation rate remaining constant (see Figure 2—figure supplement 1 as well).
Figure 2—figure supplement 1
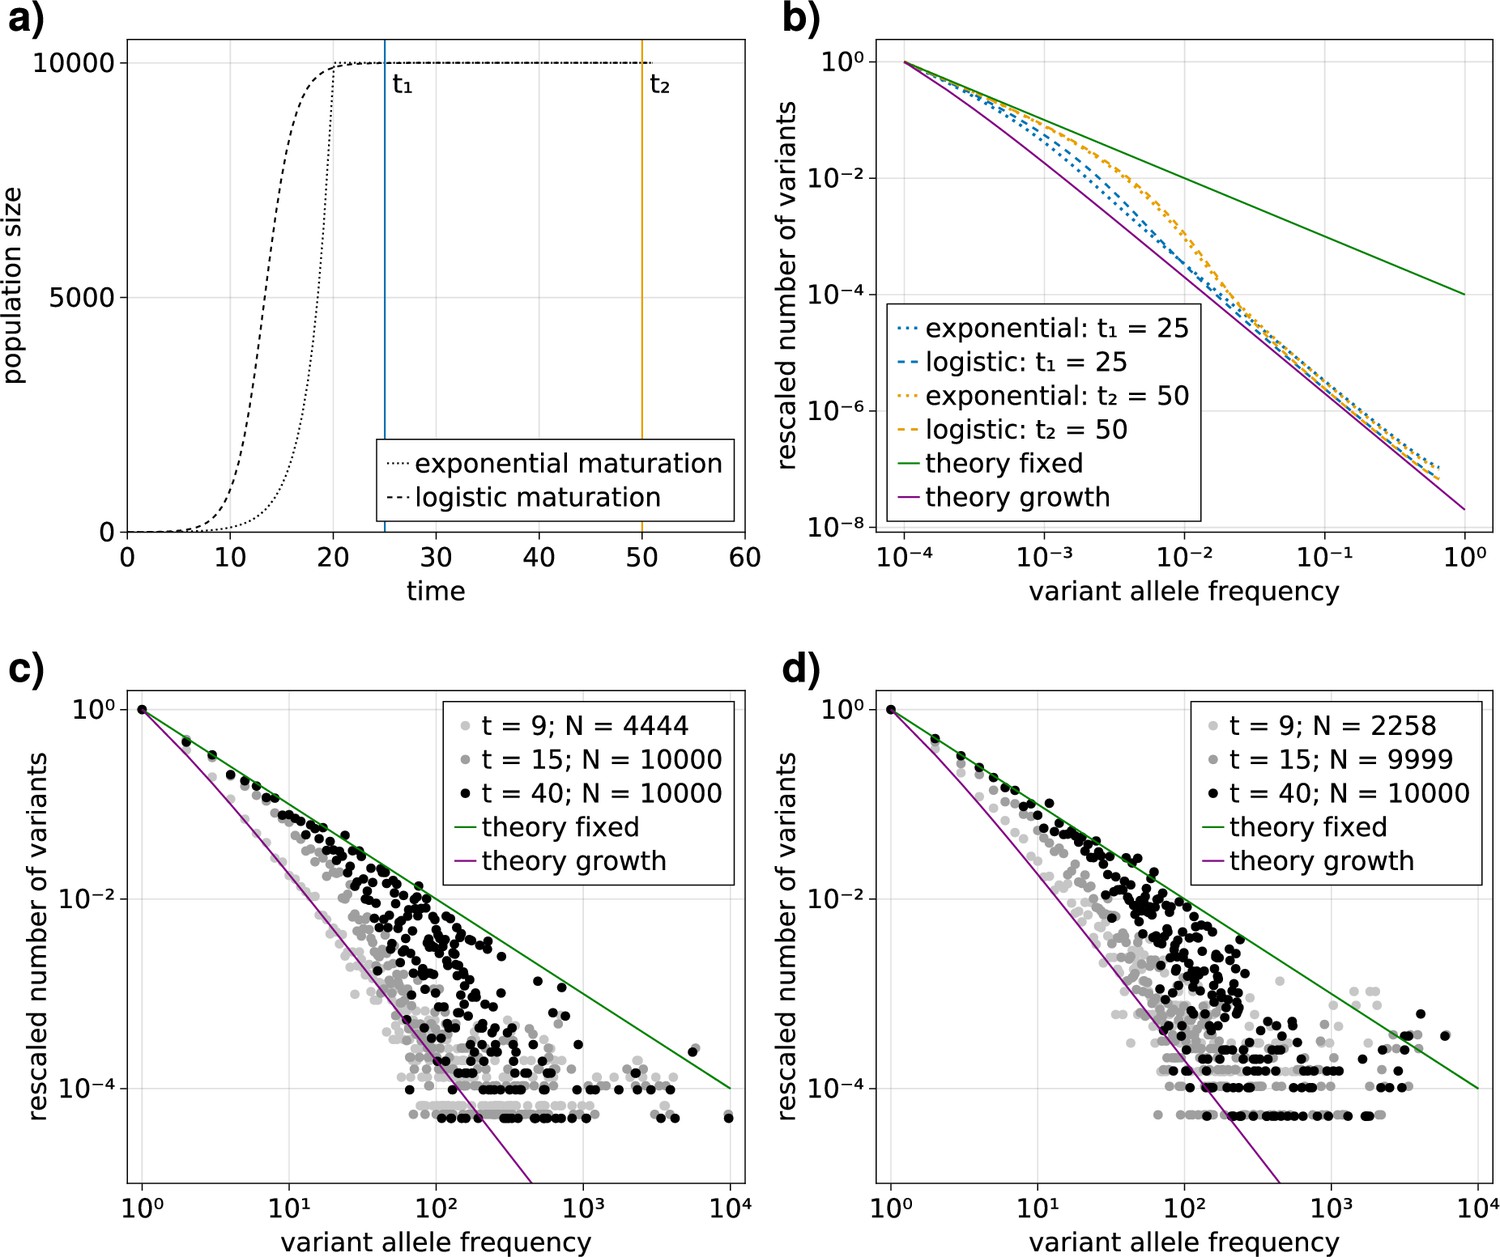
Comparison of an exponential and logistic growth model.
(a) Population size over time for exponential (dotted) and logistic (dashed) growth functions. At the point of maturity () the exponential function reaches the population capacity (), and the logistic function equals . The time points at which the VAF spectra are measured are indicated by solid vertical lines: (blue) and (orange). (b) Comparison of the expected variant allele frequency (VAF) spectra, calculated with Equation 1, in the exponential (dotted) and logistic (dashed) growth models measured at the time points and . For reference, the theoretical predictions for an exponentially growing population without cell death and a constant population in the long time limit are shown as solid purple and green lines, respectively.
Figure 3 with 3 supplements
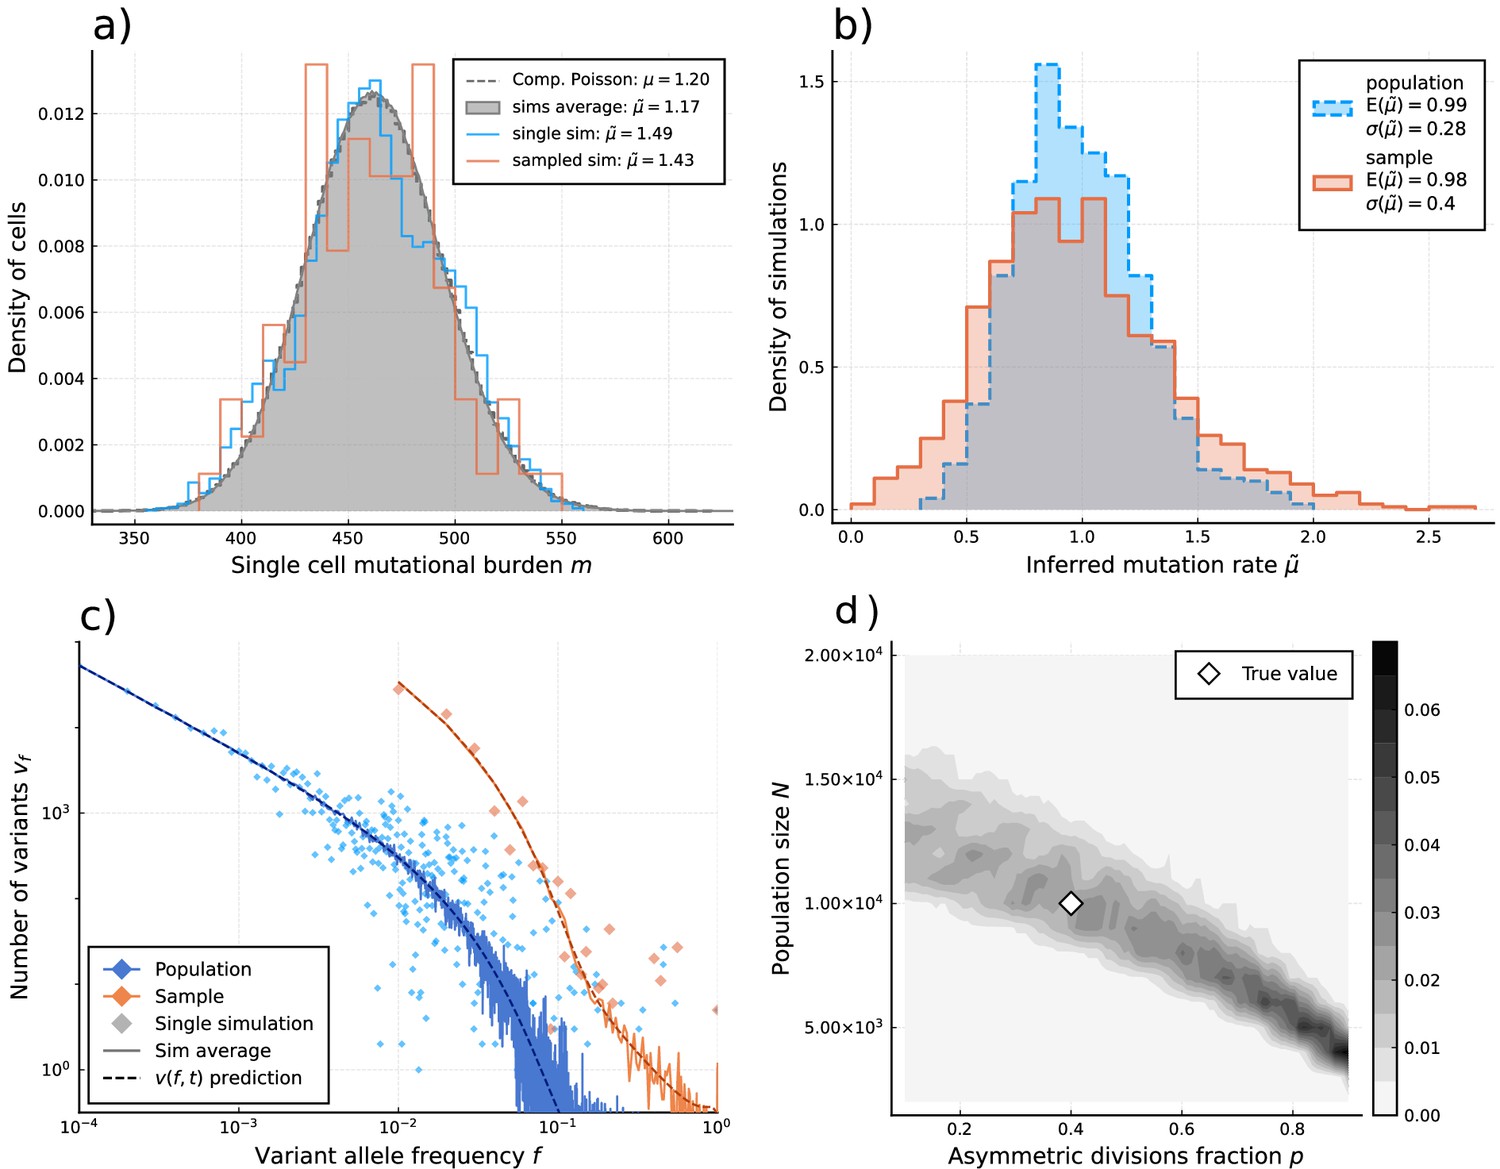
Inference of evolutionary parameters on simulated stem cell populations.
Simulated populations were run up to age 59, growing exponentially from a single-cell to constant size at age , with mutation rate and division rates and . Where sampling is mentioned, the sample size 89 was taken. (a) The single-cell mutational burden distribution. The compound Poisson distribution (dashed line) matches the burden distribution when averaging over multiple independently evolved populations (filled curve). (b) Distribution of estimated mutation rates from 10’000 individual simulations, obtained from burden distributions of the complete populations (blue) as well as sampled sets of cells (orange). Because the expected mutational burden distribution is unaltered by sampling, the expected estimate of the mutation rate from Equation 5 remains unchanged: . However, sampling increases the noise on the observed burden distribution, which results in a higher error margin of the estimate: . (c) VAF spectra measured in the complete population (blue) and a sampled set of cells (orange). In contrast with the mutational burden distribution, strong sampling changes the shape of the expected distribution. A single simulation result is shown (diamonds) alongside the theoretically predicted expected values for both the total and sampled populations (Equations 1 and 12) (dashed line) and the average across 100 simulations (solid line). (d) Distribution of and inference results for 100 simulated and sampled populations, through estimation of and from the single-cell burden distribution and fitting the number of lowest frequency () mutations to the theoretical prediction in Equation 1 (see Figure 3—figure supplements 1–3 as well).
Figure 3—figure supplement 1
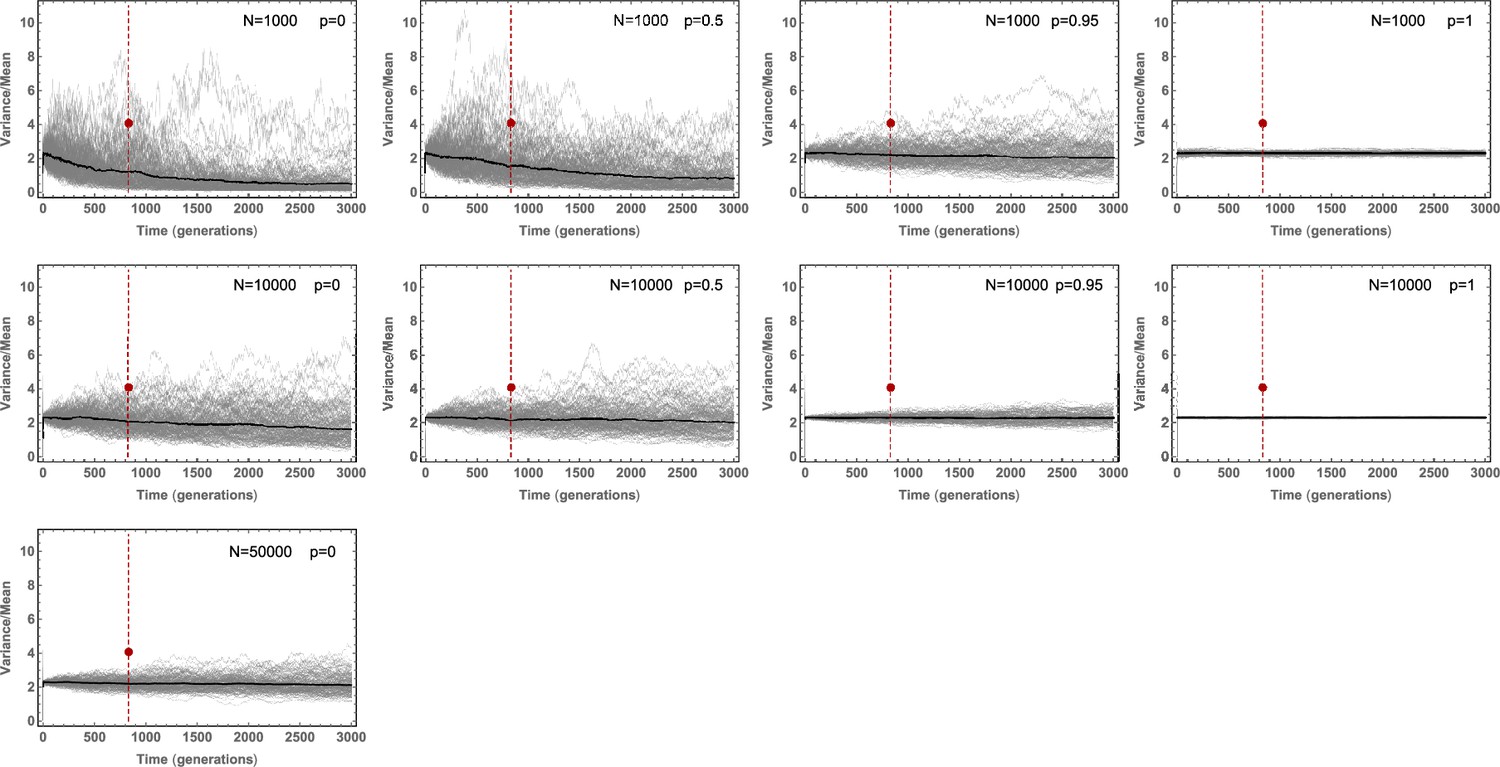
Stochastic simulations of the Variance/Mean of the mutational burden distribution over time for a per cell division mutation rate of and varying stem cell population size and asymmetric division probability .
Stochastic fluctuations are pronounced for small population size and low asymmetric division probability .
Figure 3—figure supplement 2
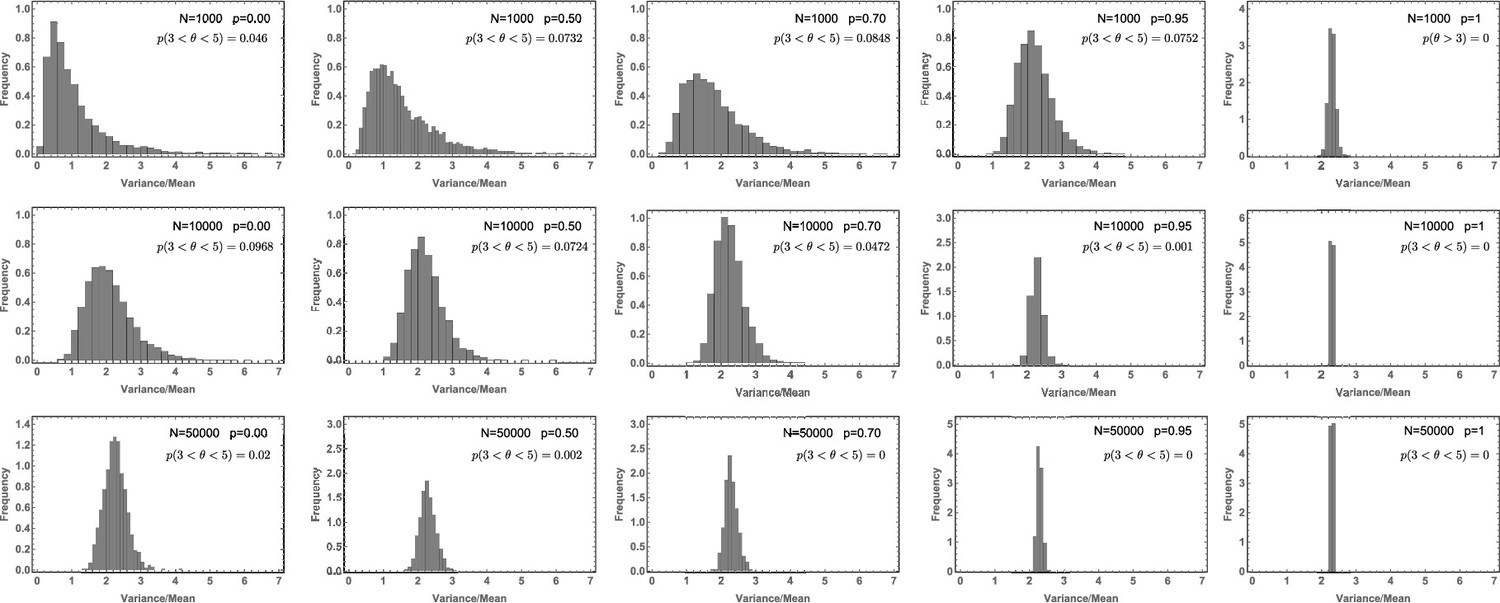
Likelihood of the Variance/Mean to be in the interval for a per division mutation rate of .
Figure 3—figure supplement 3
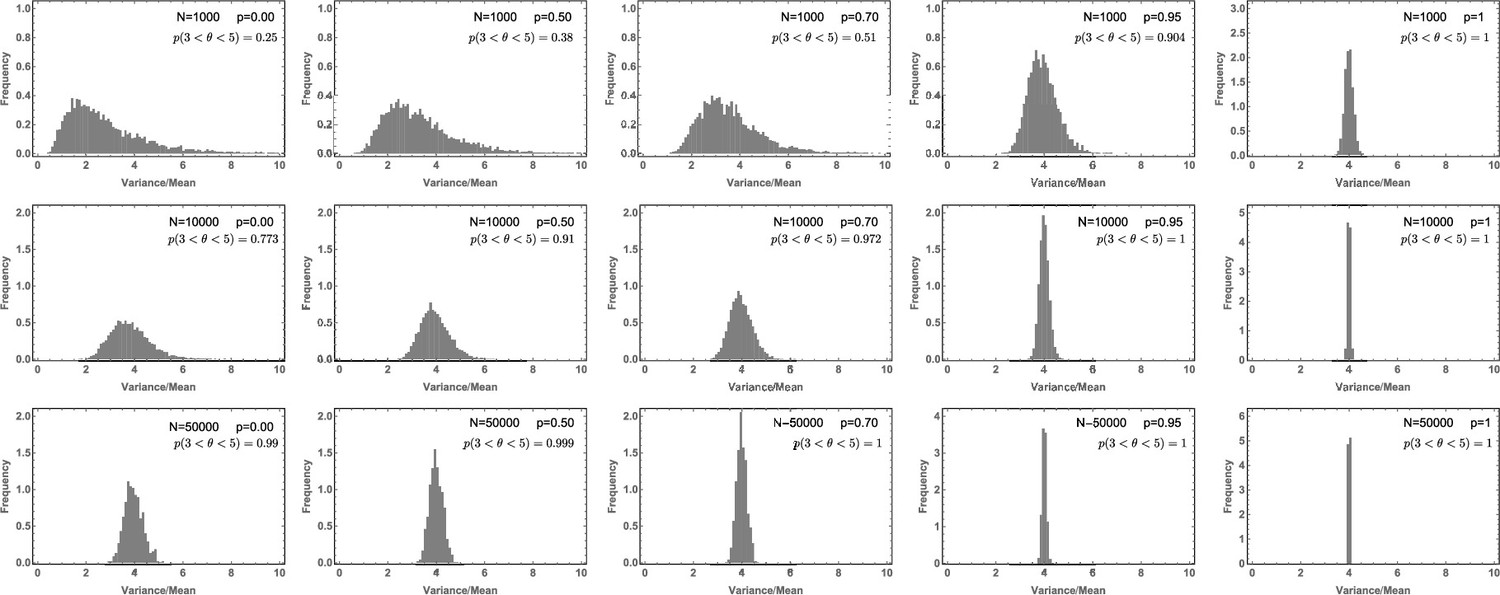
Likelihood of the Variance/Mean to be in the interval for a per division mutation rate of .
Figure 4 with 1 supplement
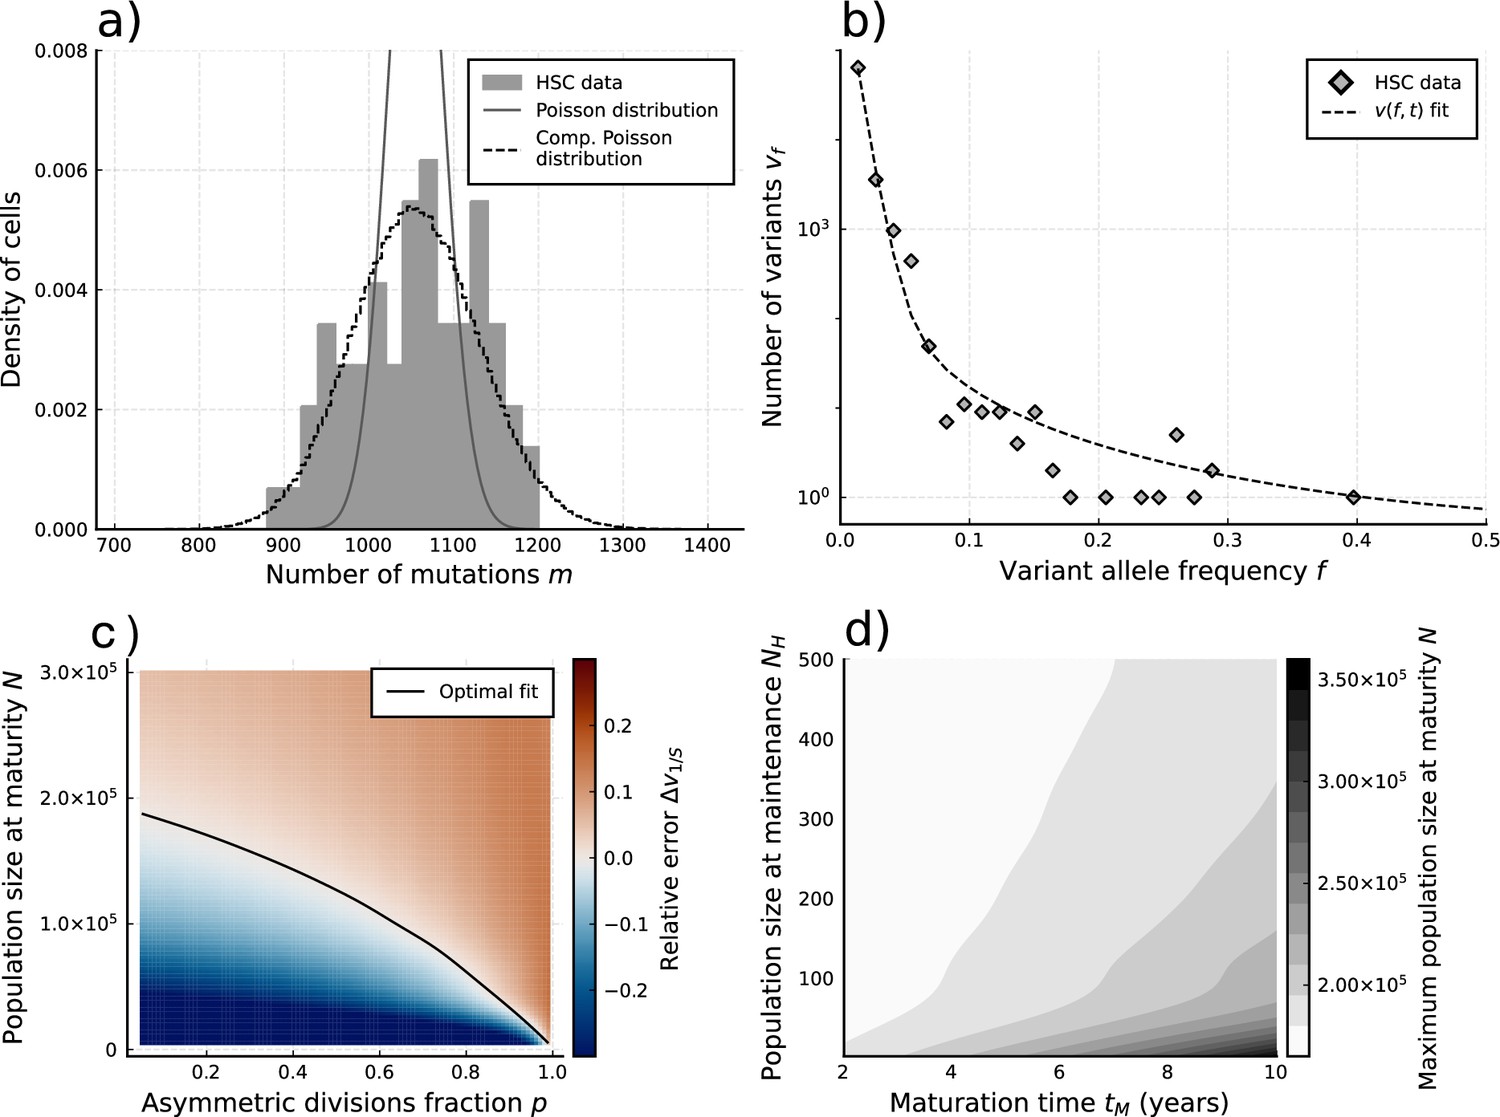
Evolutionary inferences in single-cell hematopoietic stem cell (HSC) data.
(a) The single-cell mutational burden distribution of the data (bars) and the compound Poisson distribution obtained from its mean and variance, used to obtain the estimated per division mutation rate . (b) Distribution of mutation frequencies of the data and theoretically predicted average fitted to only the lowest frequency () data point. (c) Difference between the measured value of the VAF spectrum at the lowest frequency () and its prediction from Equation 1, for varying total population size and asymmetric division proportion , with fixed maturation time and operational hematopoietic population size . The solid line denotes the plane of best fit where this difference is 0. (d) Maximally inferred population size (taking in (c)) for variation of the maturation time and the operational hematopoietic population size (see Figure 4—figure supplement 1 as well).
Figure 4—figure supplement 1
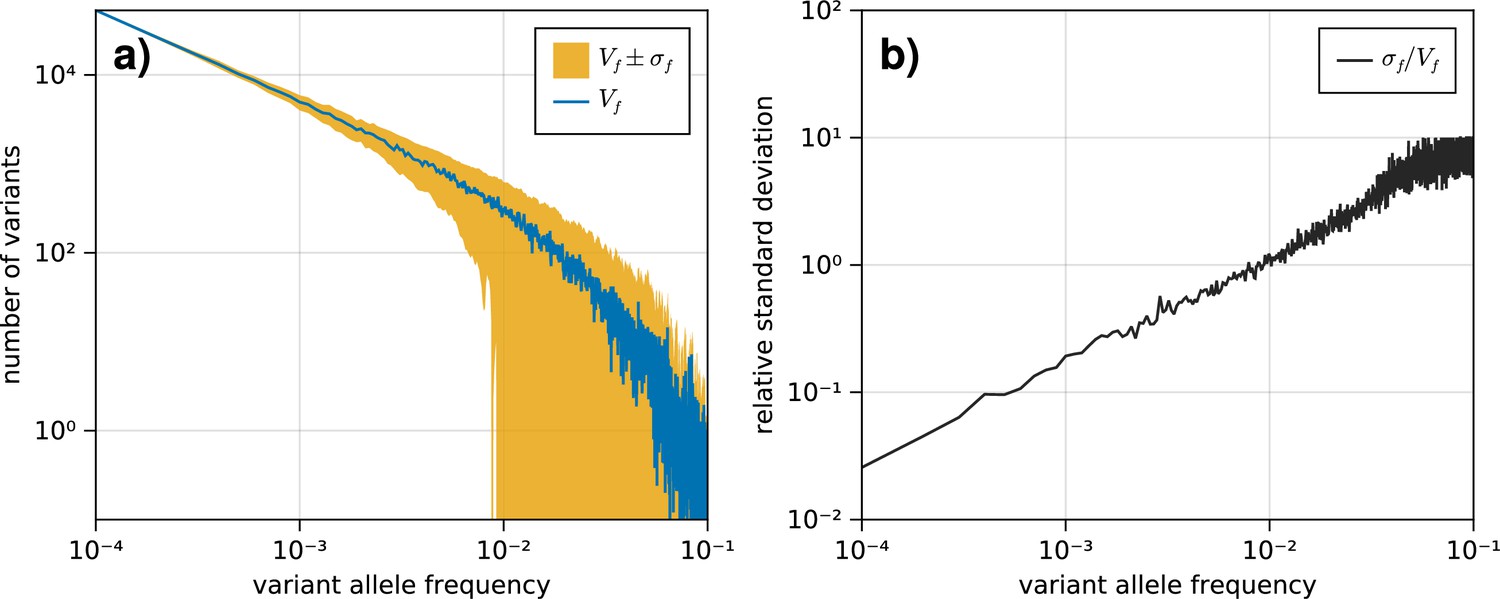
The standard deviation on the variant allele frequency (VAF) spectrum increases for higher frequencies.
(a) The VAF spectrum averaged across 100 simulations of a population evolved according to the model described in section 1.1. The standard deviation from the mean is shown as the band around the average. (b) The standard deviation across all simulations for each frequency , scaled by the average spectrum .
Tables
Table 1
Evolutionary parameters appearing in the model system.
| Symbol | Description | Units |
|---|---|---|
| Carrying capacity of the mature population | ||
| Age when the cell population reaches mature size | years | |
| Population size at homeostatic divisions(start of the mixed-growth phase) | ||
| Symmetric division rates in early developmental phase | /year | |
| Symmetric division rate in homeostatic state | /year | |
| Asymmetric division rate in homeostatic state | /year | |
| Mutation rate | /division/daughter |
Table 2
Evolutionary parameters appearing in the analytical derivations of the expected VAF distribution in the Moran and pure-birth models.
| Symbol | Description |
|---|---|
| Total number of cells | |
| Abundance or number of cells < N | |
| Number of mutations with abundance k | |
| Likelihood for a mutation with abundance k to increase or decrease | |
| The average number of mutations with abundance k that increase or decrease | |
| Average change of per time step | |
| Mutation rate per daughter cell |
Additional files
Download links
A two-part list of links to download the article, or parts of the article, in various formats.
Downloads (link to download the article as PDF)
Open citations (links to open the citations from this article in various online reference manager services)
Cite this article (links to download the citations from this article in formats compatible with various reference manager tools)
Measures of genetic diversification in somatic tissues at bulk and single-cell resolution
eLife 12:RP89780.
https://doi.org/10.7554/eLife.89780.3


