Strong isolation by distance and evidence of population microstructure reflect ongoing Plasmodium falciparum transmission in Zanzibar
- MD-PhD Program, University of North Carolina at Chapel Hill, United States
- Research Division, Ministry of Health, United Republic of Tanzania
- Department of Parasitology and Medical Entomology, Muhimbili University of Health and Allied Sciences, United Republic of Tanzania
- Global Health and Migration Unit, Department of Women's and Children's Health, Uppsala University, Sweden
- Department of Medicine, University of Massachusetts Chan Medical School, United States
- Carolina Population Center, University of North Carolina at Chapel Hill, United States
- Department of Pathology and Laboratory Medicine, Brown University, United States
- Institute for Global Health and Infectious Diseases, School of Medicine, University of North Carolina at Chapel Hill, United States
- Division of Infectious Diseases, Department of Medicine, School of Medicine, University of North Carolina at Chapel Hill, United States
- Center for Global Health Research, Kenya Medical Research Institute, Kenya
- MRC Centre for Global Infectious Disease Analysis, Imperial College London, United Kingdom
- Zanzibar Malaria Elimination Program (ZAMEP), United Republic of Tanzania
- Department of Microbiology, Tumor and Cell Biology, Karolinska Institutet, Sweden
- Department of Global Public Health, Karolinska Institute, Sweden
- Department of Epidemiology, Gillings School of Global Public Health, University of North Carolina at Chapel Hill, United States
- Curriculum in Genetics and Molecular Biology, University of North Carolina at Chapel Hill, United States
Figures
Figure 1 with 4 supplements
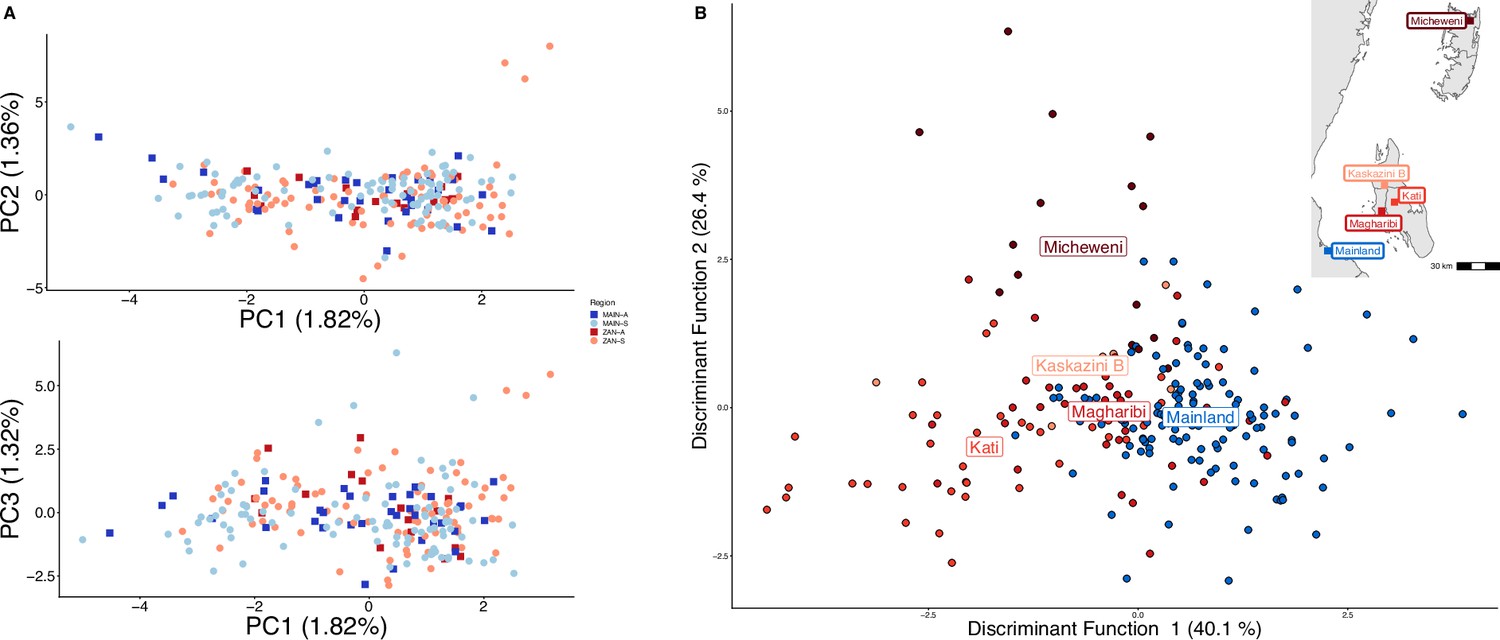
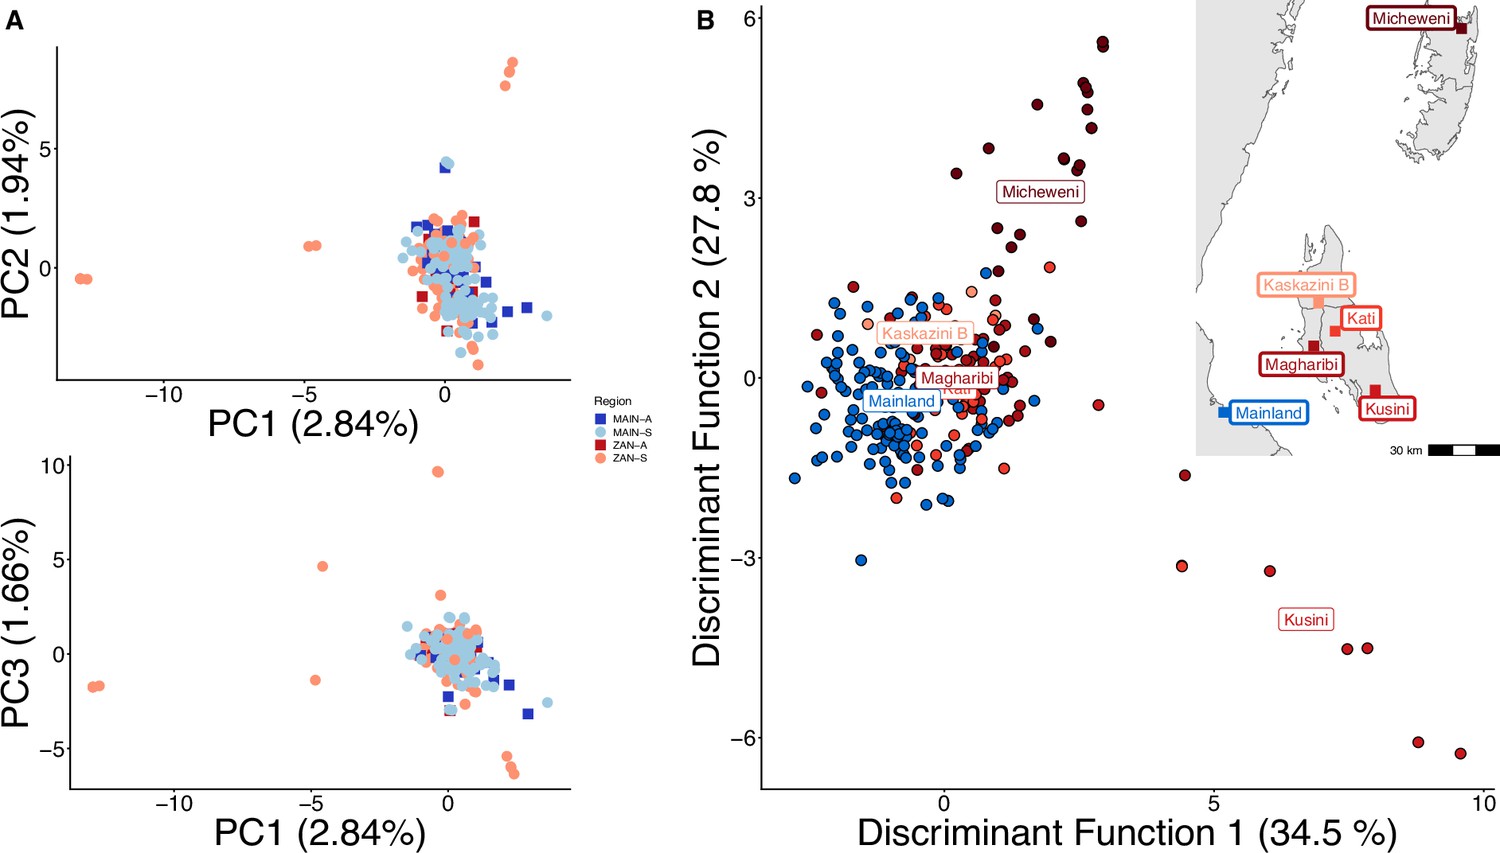
Parasites between Zanzibar and coastal mainland Tanzania are highly related but microstructure within Zanzibar is apparent.
(A) Principal component analysis (PCA) comparing parasites from symptomatic vs. asymptomatic patients from coastal Tanzania and Zanzibar. Clusters with an identity by descent (IBD) value of > 0.90 were limited to a single representative infection to prevent local structure of highly related isolates within shehias from driving clustering. (B) A discriminant analysis of principal components (DAPC) was performed utilizing isolates with unique pseudohaplotypes, pruning highly related isolates to a single representative infection. Districts were included with at least five isolates remaining to have sufficient samples for the DAPC. For plotting the inset map, the district coordinates (e.g., mainland, Kati, etc.) were calculated from the averages of the shehia centroids within each district.
Figure 1—figure supplement 1
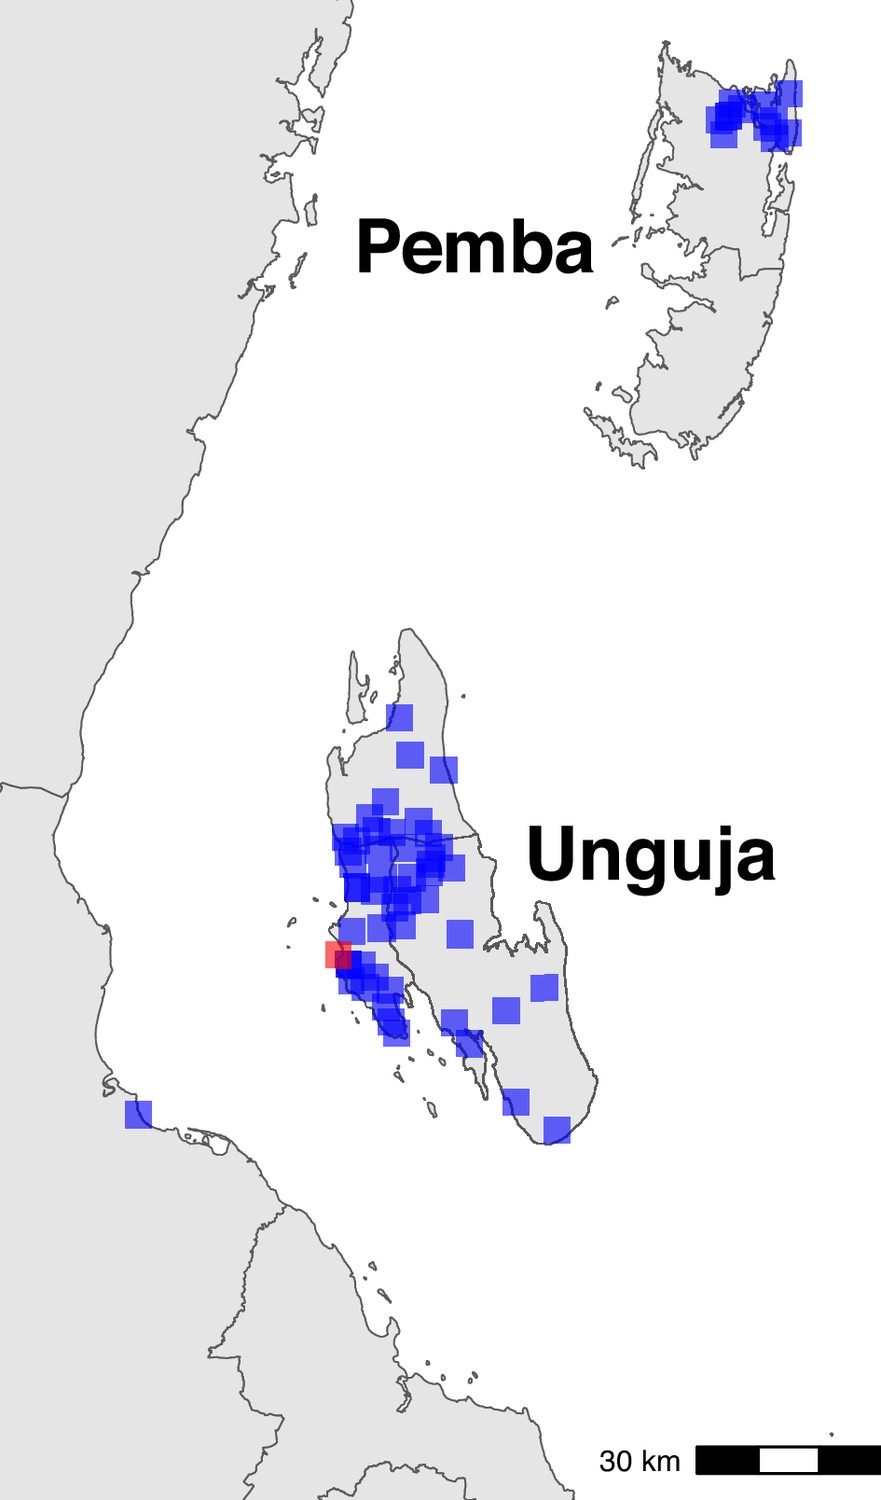
Sampling locations in Zanzibar (shehia) and mainland (Bagamoyo district) Tanzania.
The centroids of the sampling locations are shown as blue rectangles. The ferry terminal in Zanzibar town is shown as a red rectangle. In Zanzibar, samples were collected throughout Unguja and in northern Pemba. In mainland Tanzania, samples were collected from Bagamoyo district.
Figure 1—figure supplement 2
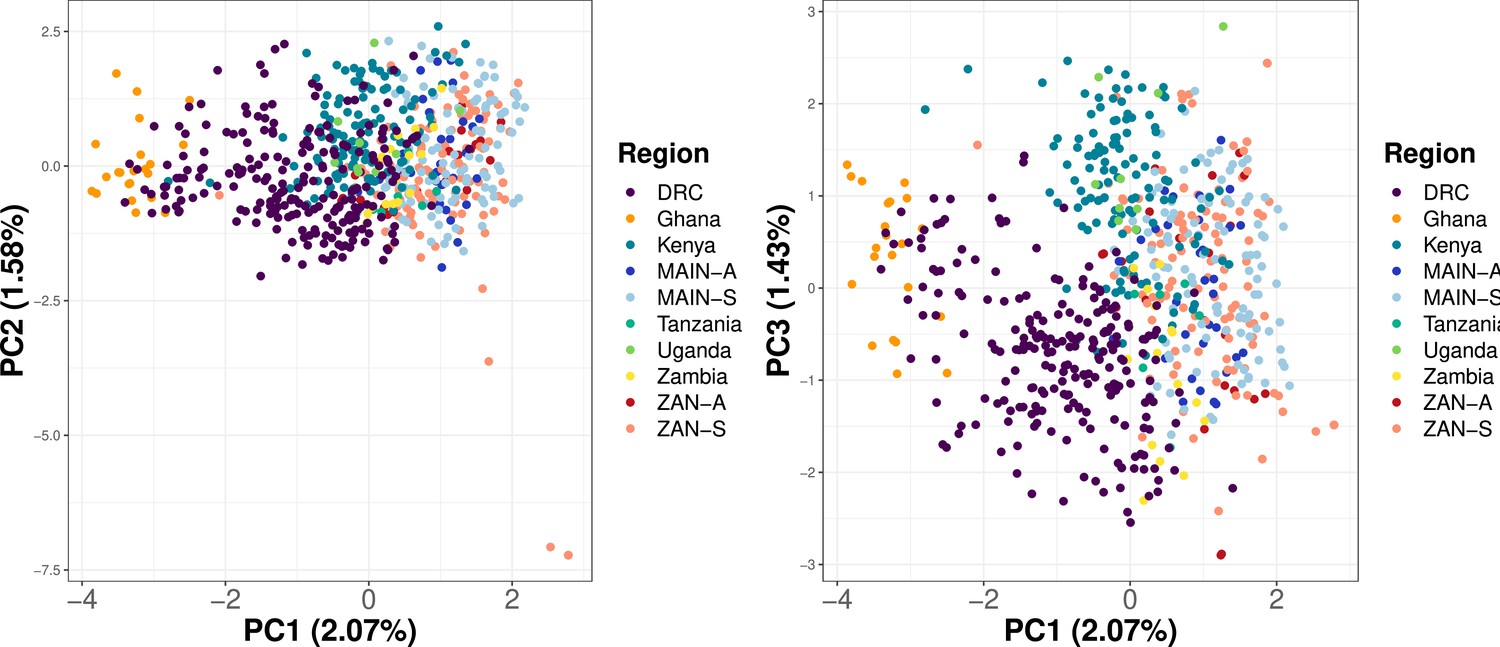
Principal component analysis (PCA) utilizing samples across Africa shows clustering based on geographic location.
Samples from Ahero, Kenya (n = 147), a random 20% of samples from five regions across Africa (Verity et al., 2020) (n = 275) and from this study (n = 282) were subsetted to 756 common loci. Within-sample allele frequency (WSAF) was calculated, with an imputation step to replace missing values with the median WSAF, to perform PCA.
Figure 1—figure supplement 3
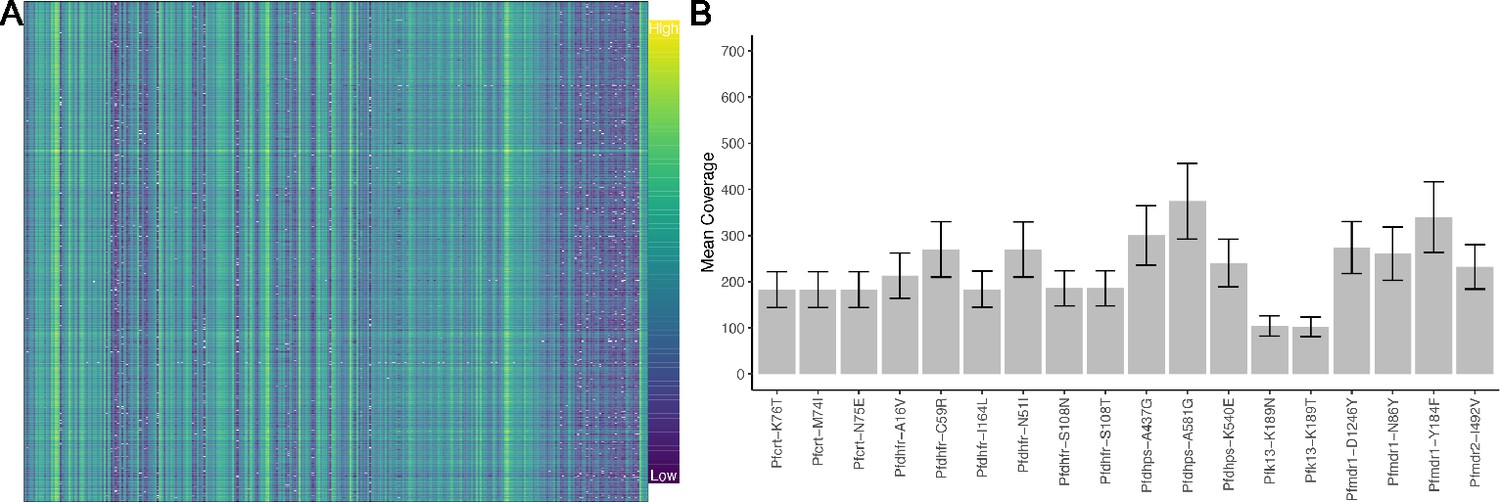
Molecular inversion probe (MIP) performance shows coverage of loci.
Panel (A) shows the log-transformed read depth for genome-wide single-nucleotide polymorphisms (SNPs) for samples (columns) and loci (rows). The log-transformed unique molecular identifier (UMI) count ranges from 0 to 9.87. Panel (B) shows the mean UMI coverage for the analyzed drug resistance mutations with a nonparametric bootstrap 95% CI.
Figure 1—figure supplement 4
Principal component analysis (PCA) with highly related samples shows population stratification radiating from coastal mainland to Zanzibar.
PCA of 282 total samples was performed using whole-sample allele frequency (A) and discriminant analysis of principal components (DAPC) was performed after retaining samples with unique pseudohaplotypes in districts that had five or more samples present (B). As opposed to Figure 1, all isolates were used in this analysis and isolates with unique pseudohaplotypes were not pruned to a single representative infection.
Figure 2 with 1 supplement
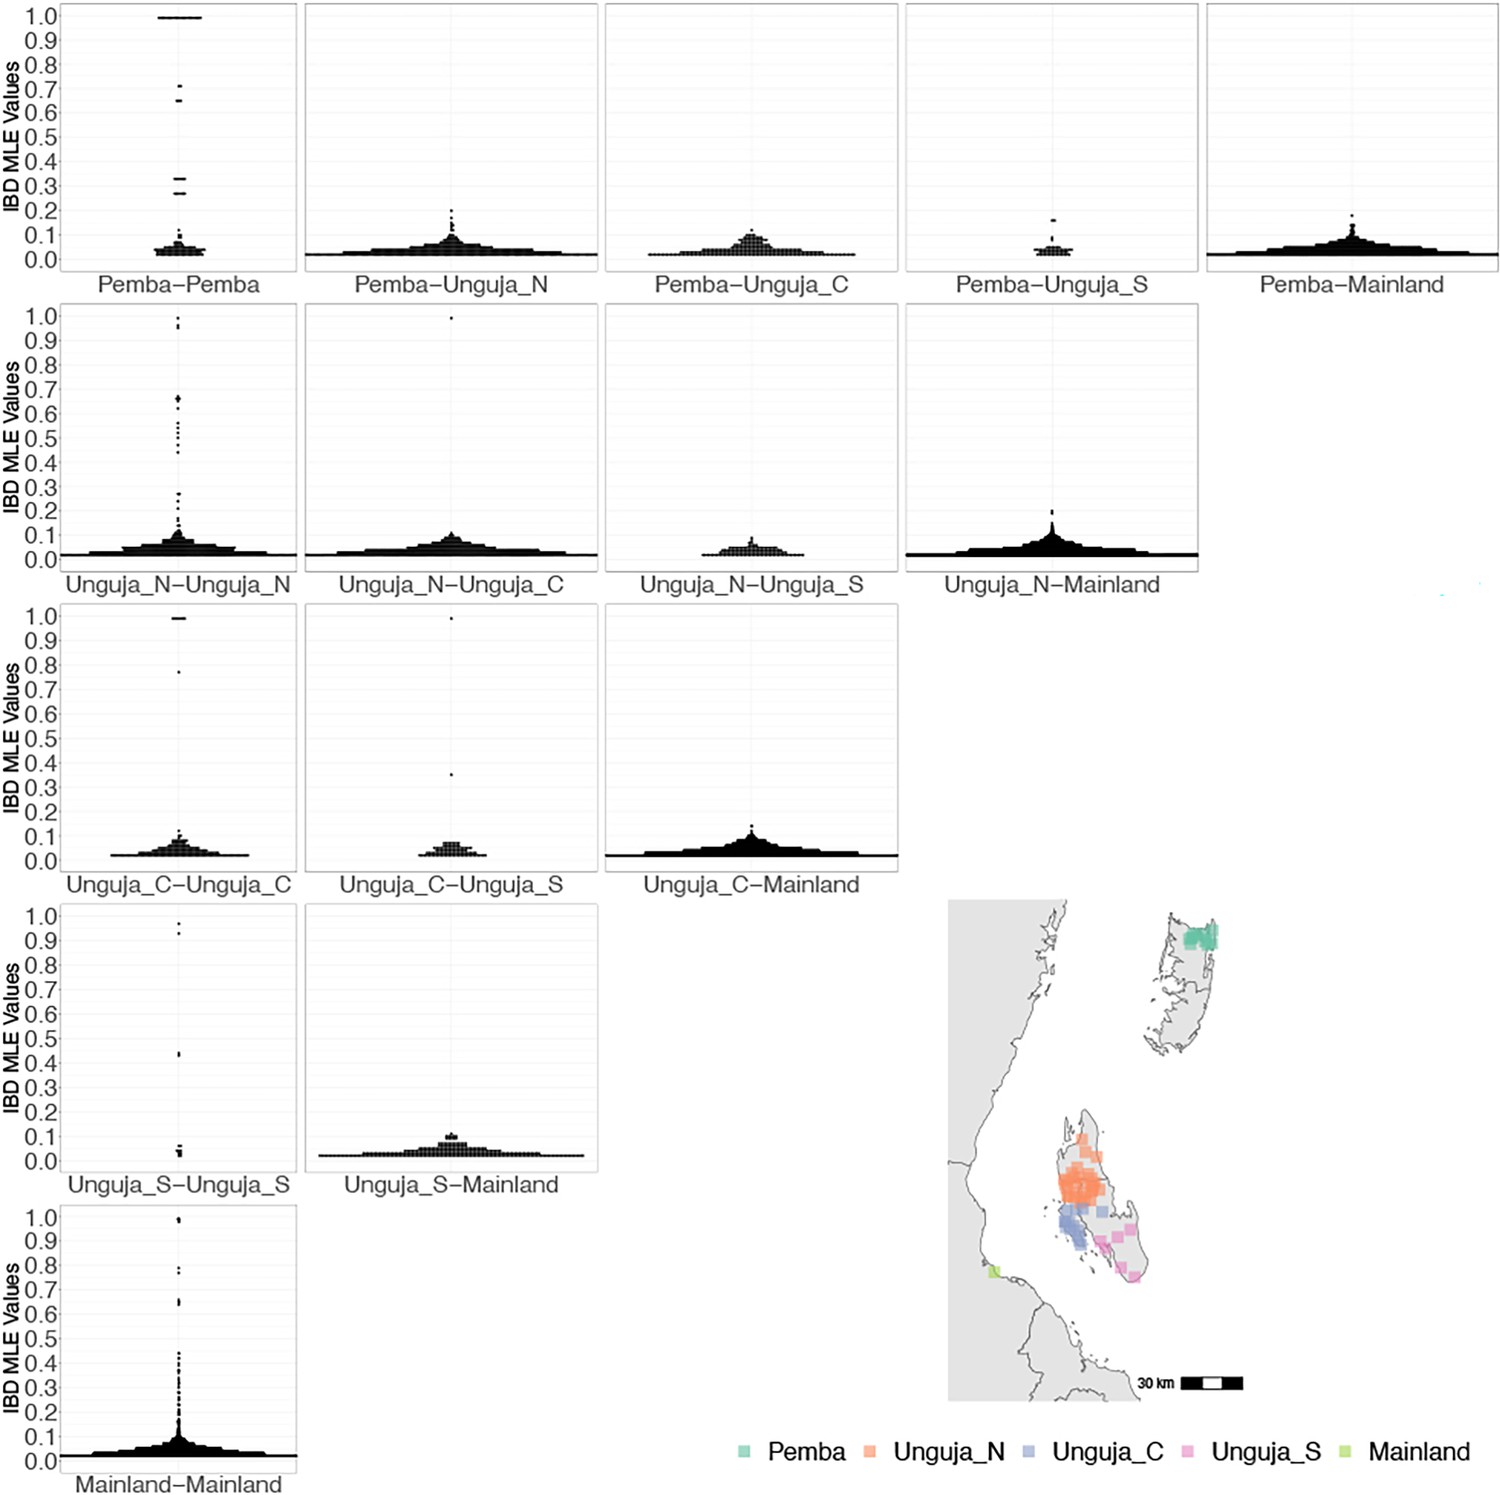
Coastal Tanzania and Zanzibari parasites have more highly related pairs within their given region than between regions.
K-means clustering of shehia coordinates was performed using geographic coordinates of all shehias present from the sample population to generate five clusters (colored boxes). All shehias were included to assay pairwise identity by descent (IBD) between differences throughout Zanzibar. K-means cluster assignments were converted into interpretable geographic names Pemba, Unguja North (Unguja_N), Unguja Central (Unguja_C), Unguja South (Unguja_S), and mainland Tanzania (Mainland). Pairwise comparisons of within-cluster IBD (column 1 of IBD distribution plots) and between-cluster IBD (columns 2–5 of IBD distribution plots) were done for all clusters. All IBD values > 0 were plotted for each comparison. In general, within-cluster IBD had more pairwise comparisons containing high IBD identity.
Figure 2—figure supplement 1
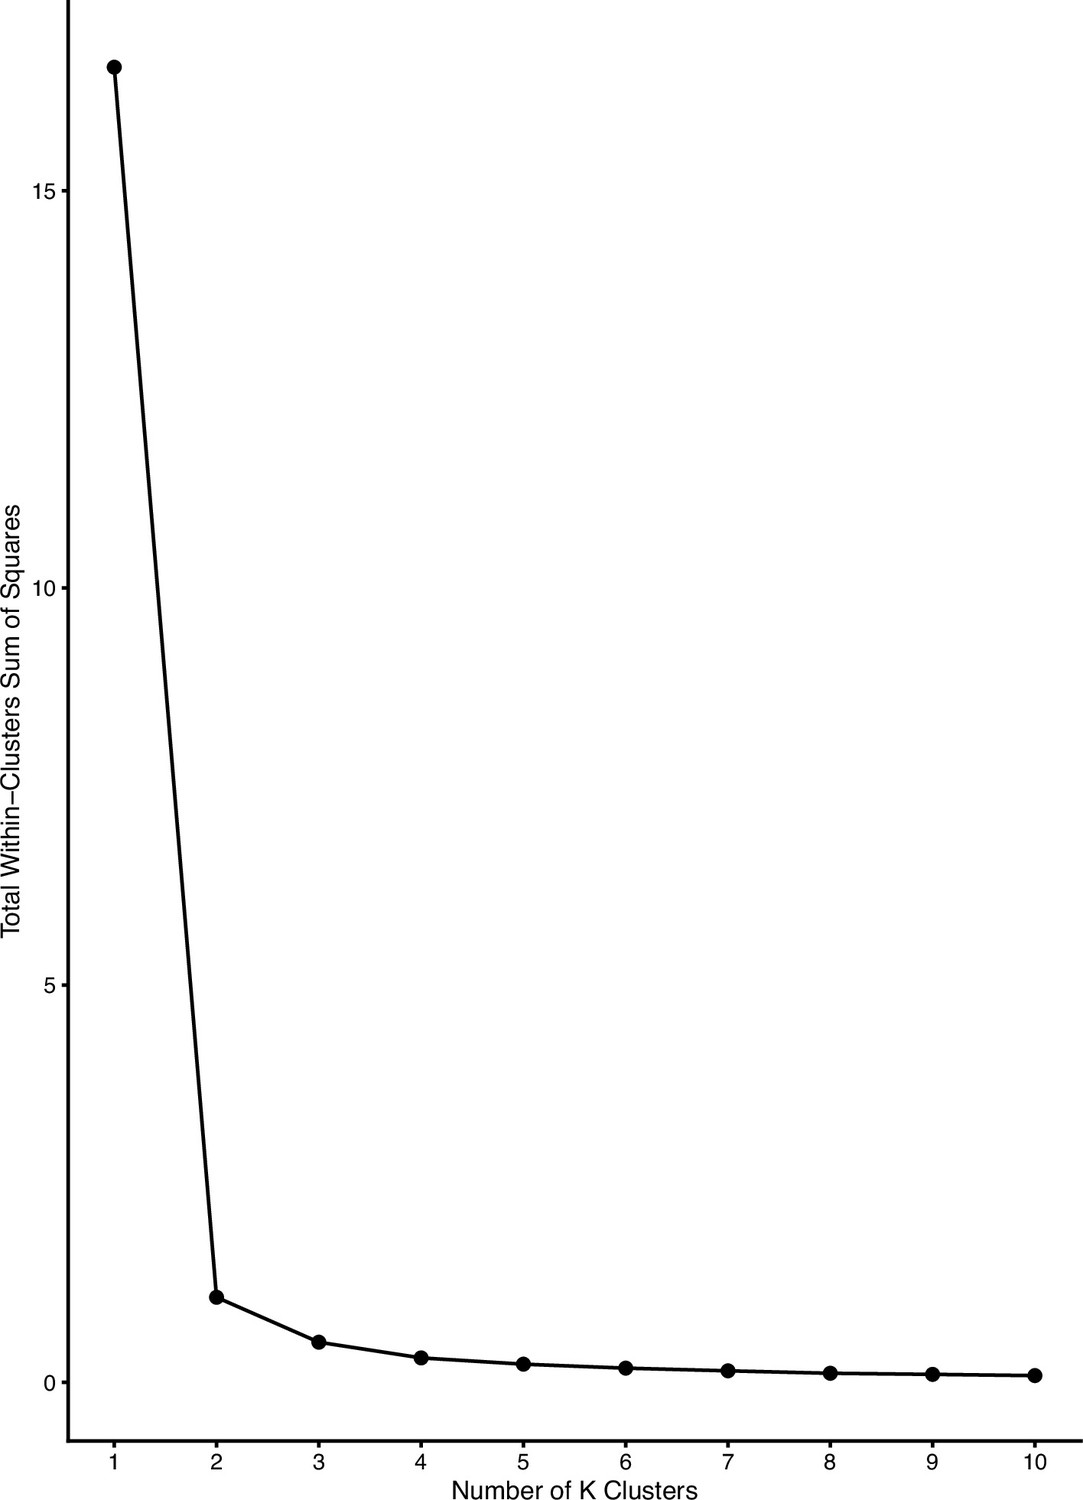
Diagnostic plot showing total within-cluster sum of squares versus number of clusters for the determination of optimal K.
Mainland samples were considered an independent cluster. We selected a K of 4 for determining clusters in Zanzibar based on the inflection point above.
Figure 3 with 1 supplement
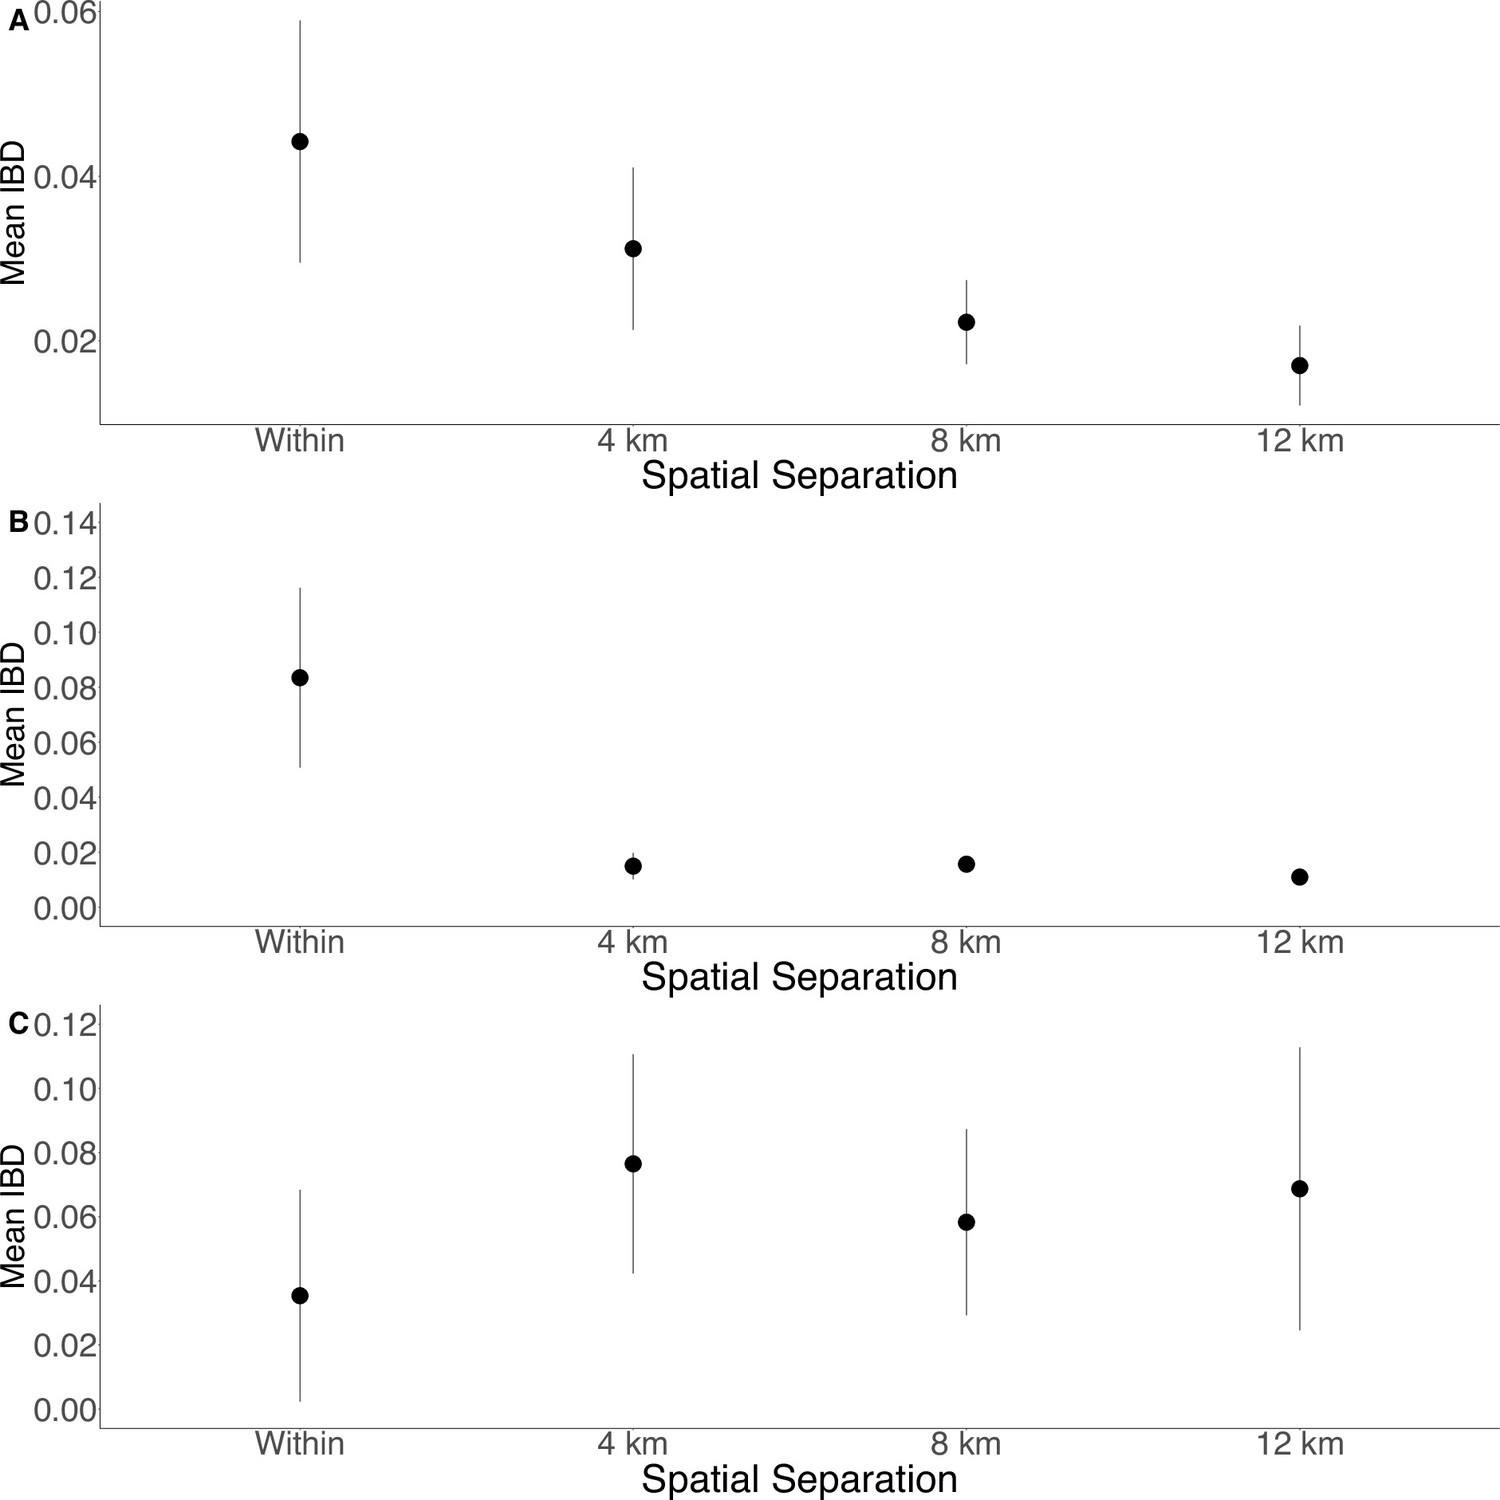
Isolation by distance is shown between all Zanzibari parasites (A), only Unguja parasites (B), and only Pemba parasites (C).
Samples were analyzed based on geographic location. Zanzibar (N = 136) (A), Unguja (N = 105) (B), or Pemba (N = 31) (C) and greater circle (GC) distances between pairs of parasite isolates were calculated based on shehia centroid coordinates. These distances were binned at 4 km increments out to 12 km. Identity by descent (IBD) beyond 12 km is shown in Figure 3—figure supplement 1. The maximum GC distance for all of Zanzibar was 135 km, 58 km on Unguja, and 12 km on Pemba. The mean IBD and 95% CI are plotted for each bin.
Figure 3—figure supplement 1
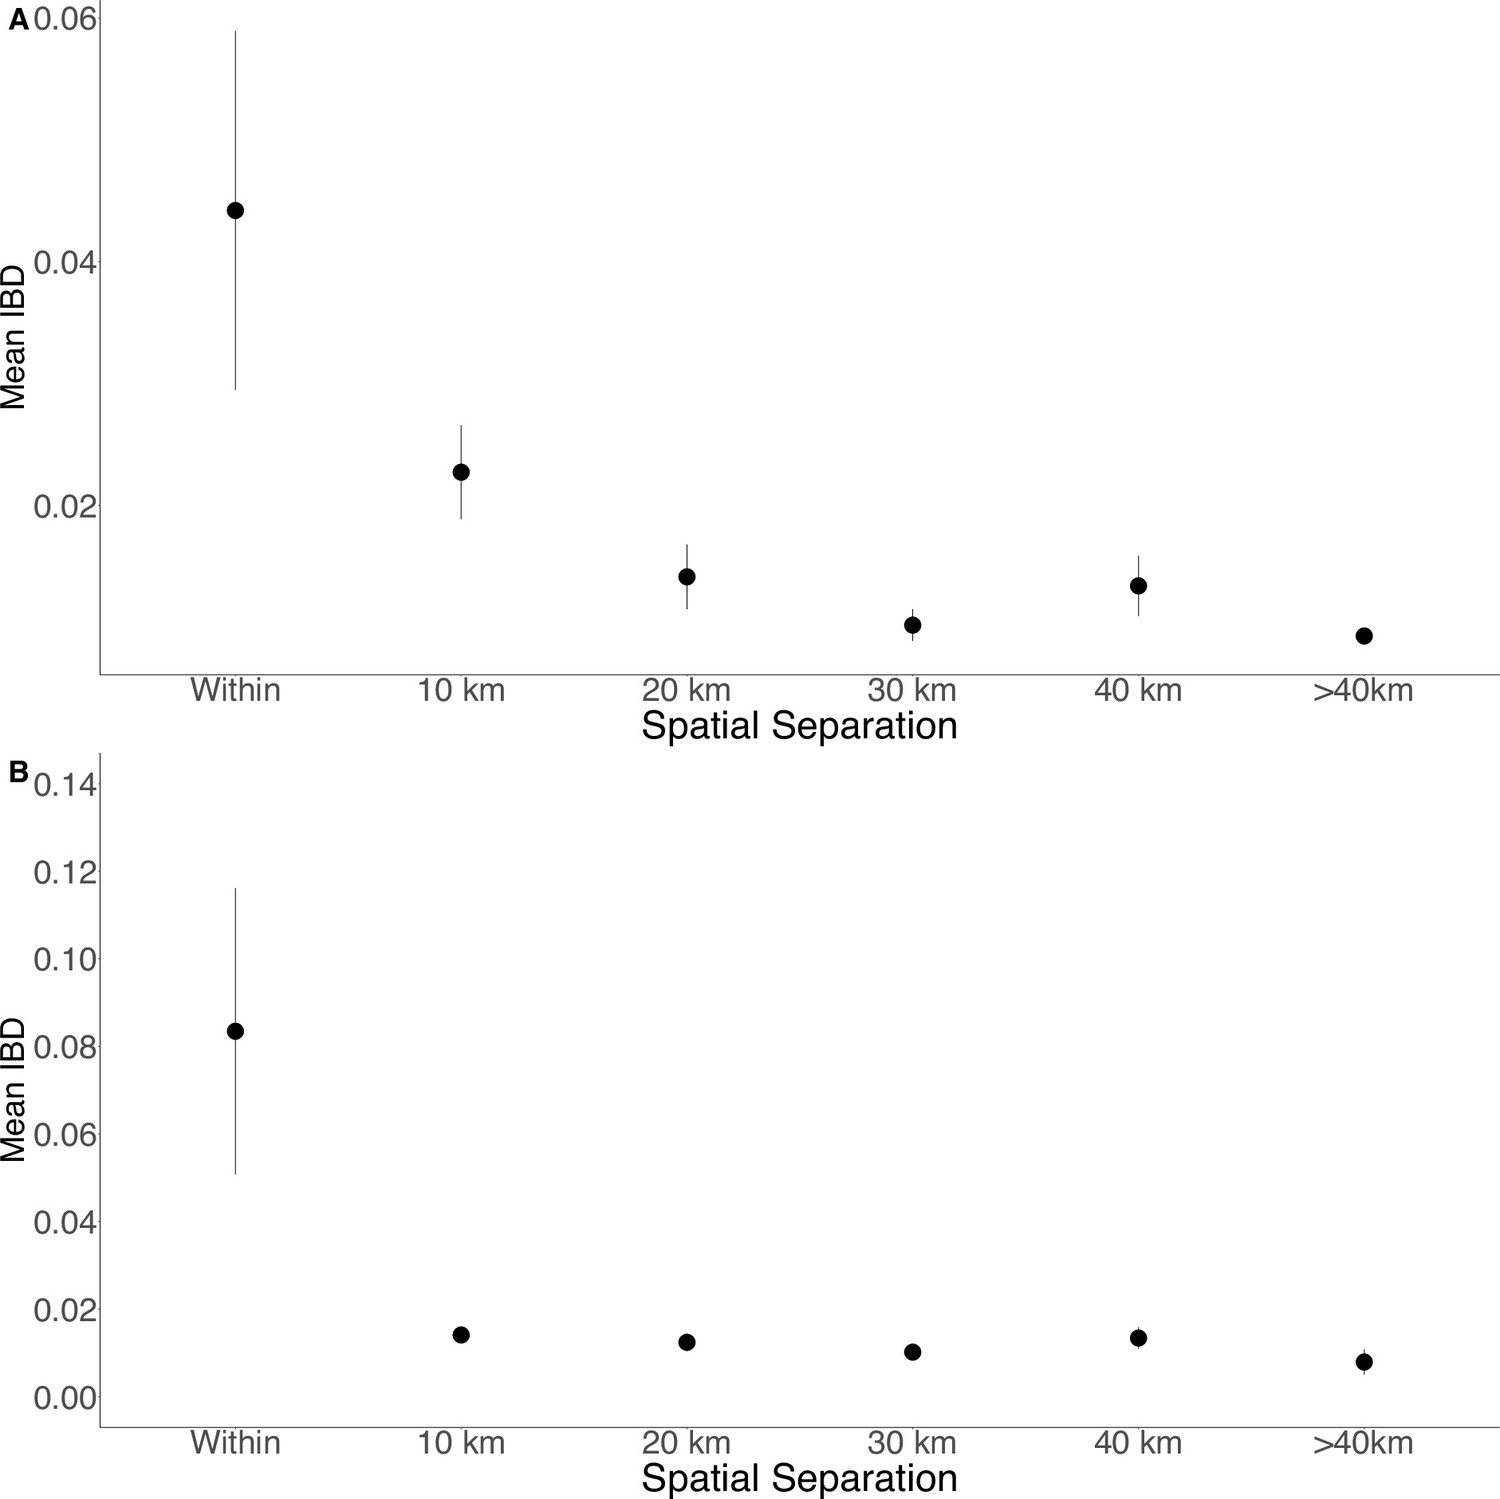
Isolation by distance in Zanzibar isolates (A) and only Unguja isolates (B).
Samples were filtered based on location and greater circle distance were calculated. These distances were binned at 10 km increments. The mean IBD and 95% CI are plotted for each bin.
Figure 4 with 4 supplements
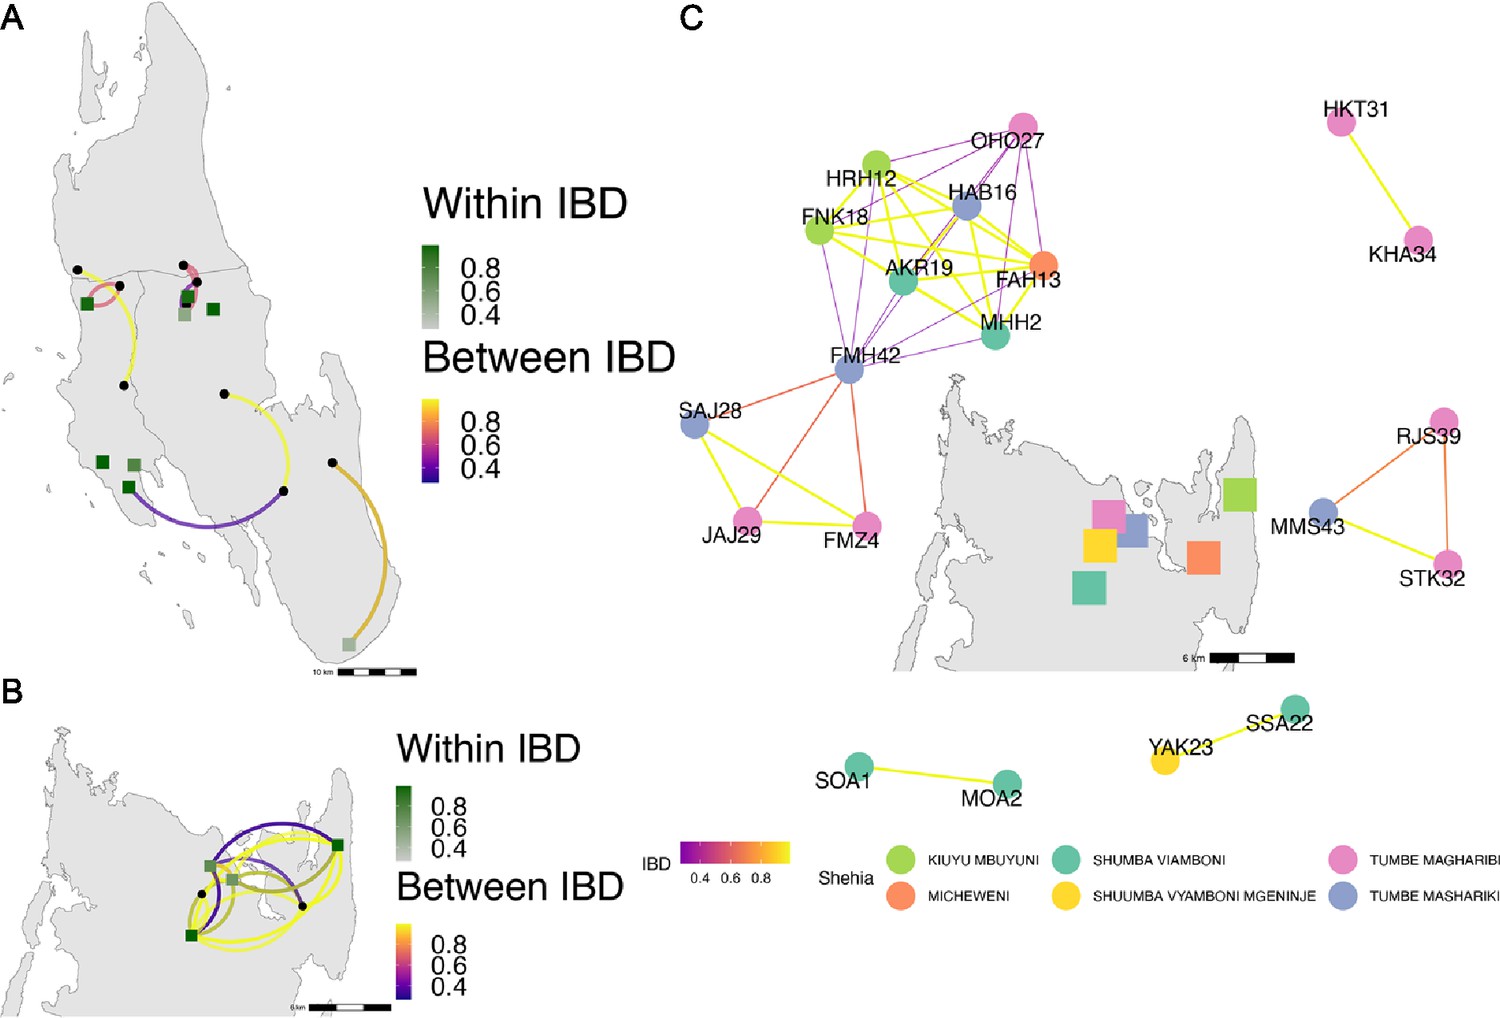
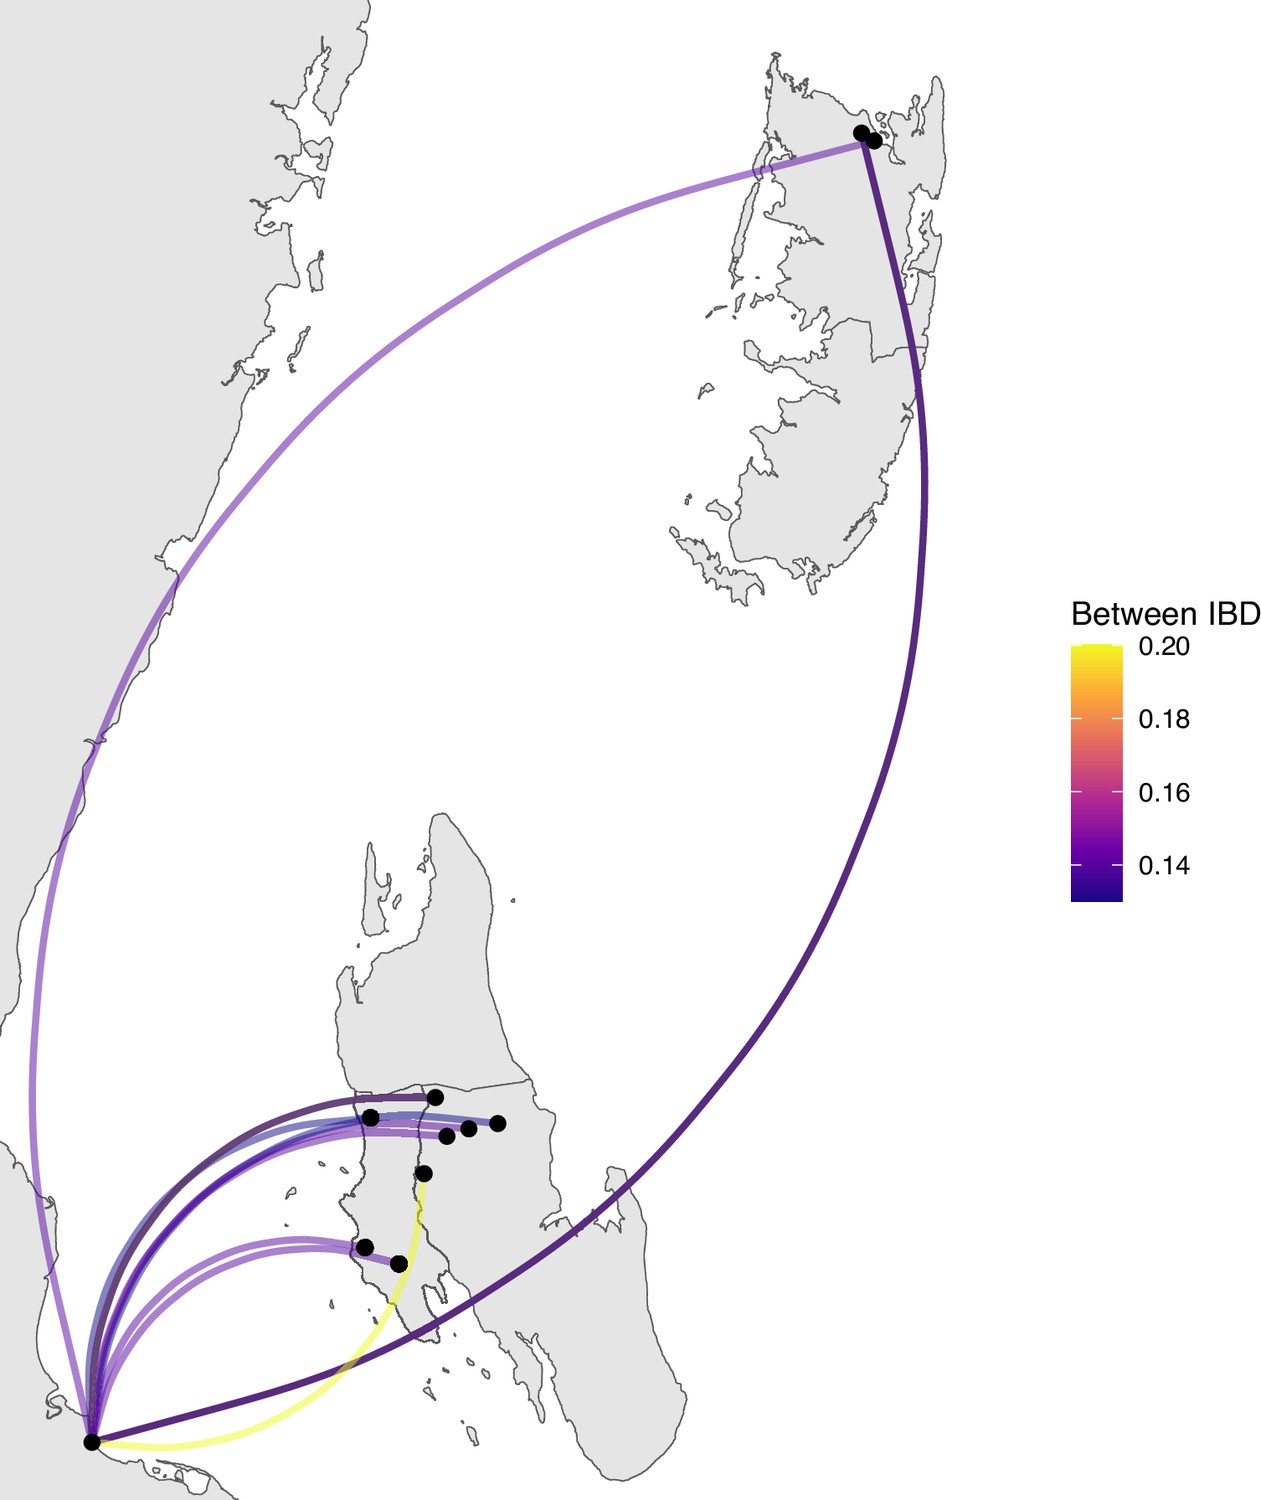
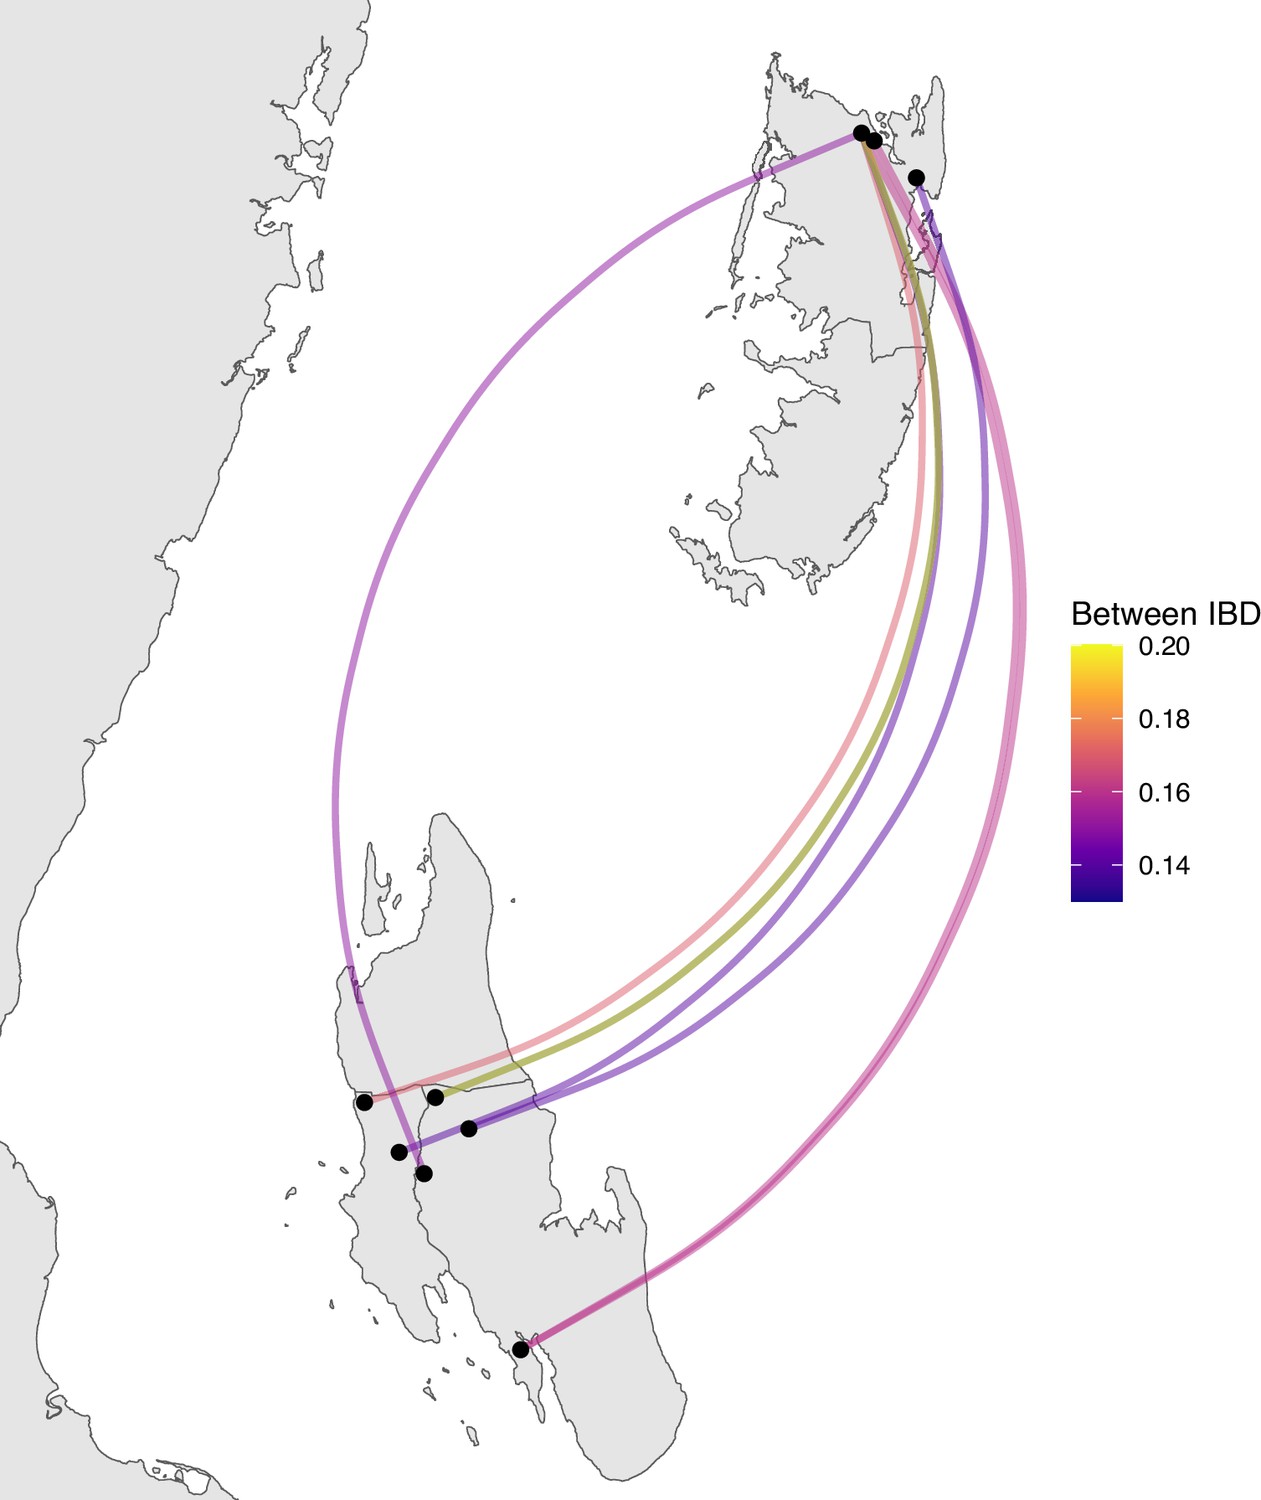
Highly related pairs span long distances across Zanzibar.
Sample pairs were filtered to have identity by descent (IBD) estimates of ≥ 0.25. Within shehia pairwise IBD estimates are shown within Unguja (A) and Pemba (B) as single points, with dark green representing the greatest degree of IBD. Shehias labeled with black dots do not have within IBD estimates of ≥ 0.25. Between shehia IBD reflects pairs of parasites with IBD ≥0.25, with the color of the connecting arc representing the degree of IBD and yellow representing maximal connectivity. Panel (C) shows the network of highly related pairs (IBD ≥ 0.25) within and between the six northern Pemba shehias (note: Micheweni is a shehia in Micheweni district). Samples (nodes) are colored by shehia and IBD estimates (edges) are represented on a continuous scale with increasing width and yellow-shading indicating higher IBD.
Figure 4—figure supplement 1
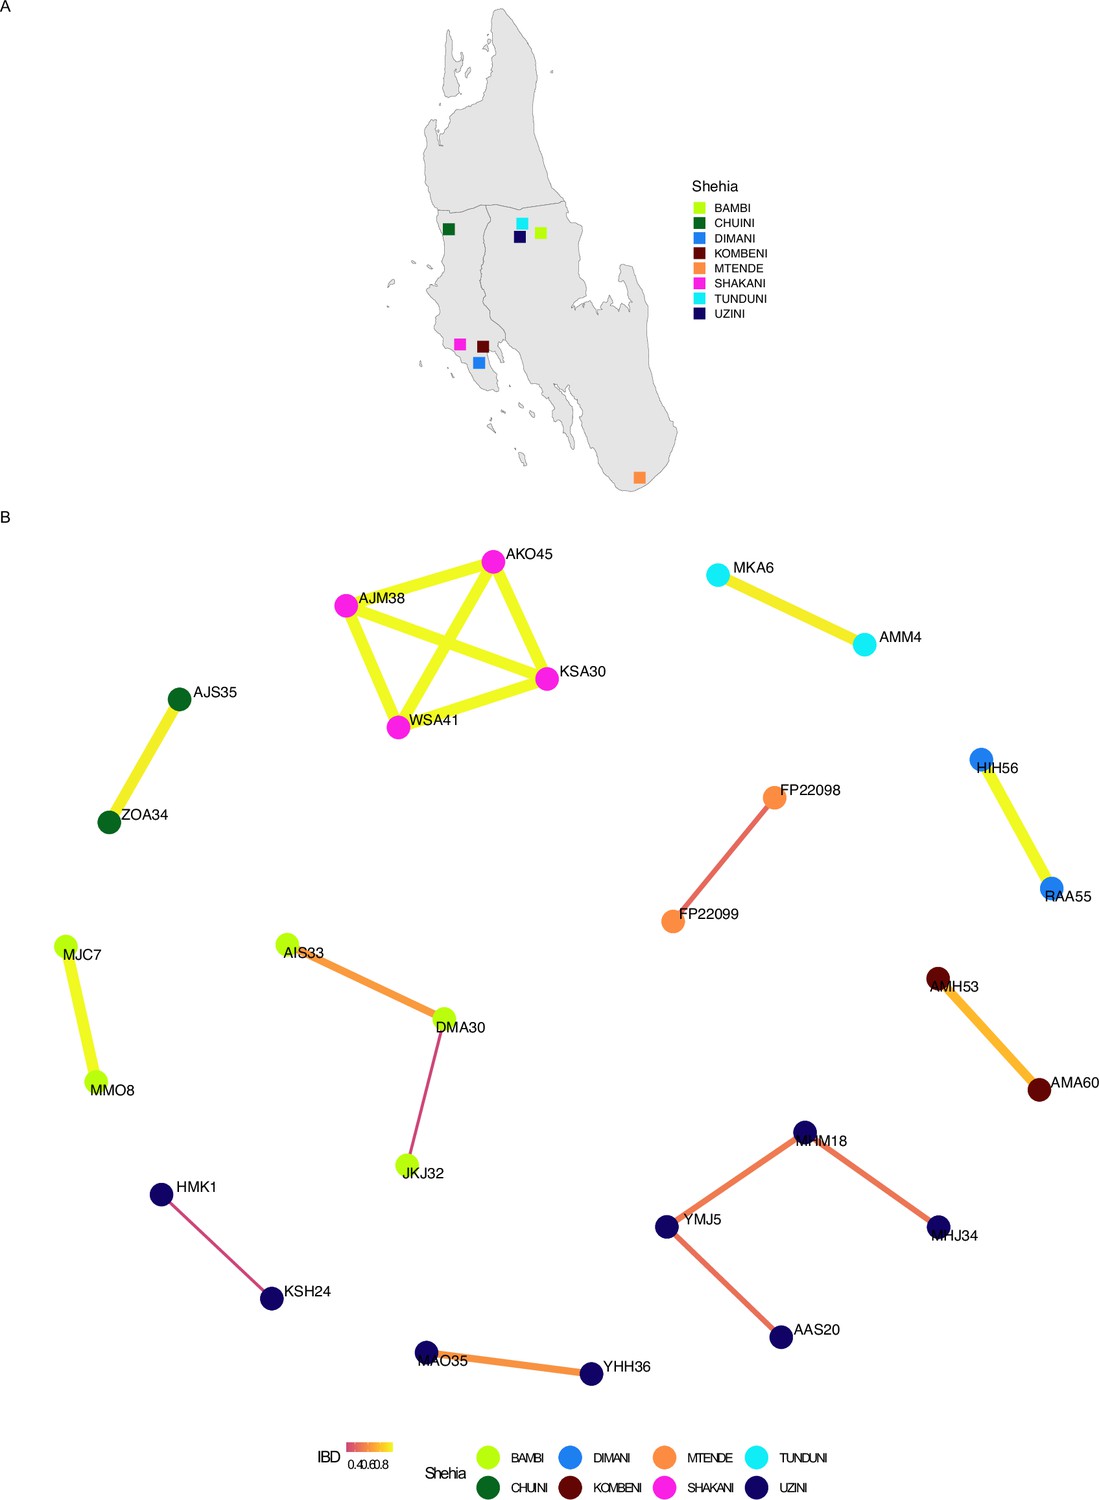
Network analysis of within shehia comparisons with an identity by descent (IBD) of ≥0.25 in Unguja.
Pairwise IBD comparisons of ≥ 0.25 within different shehias were used. If a shehia is not represented, it does not have a pairwise comparison meeting the IBD threshold. Shehias that did contain a pair with an IBD of ≥ 0.25 are plotted (A). Network analysis of related pairs (IBD ≥ 0.25) is plotted in (B). The width of each line represents higher magnitudes of IBD between pairs.
Figure 4—figure supplement 2
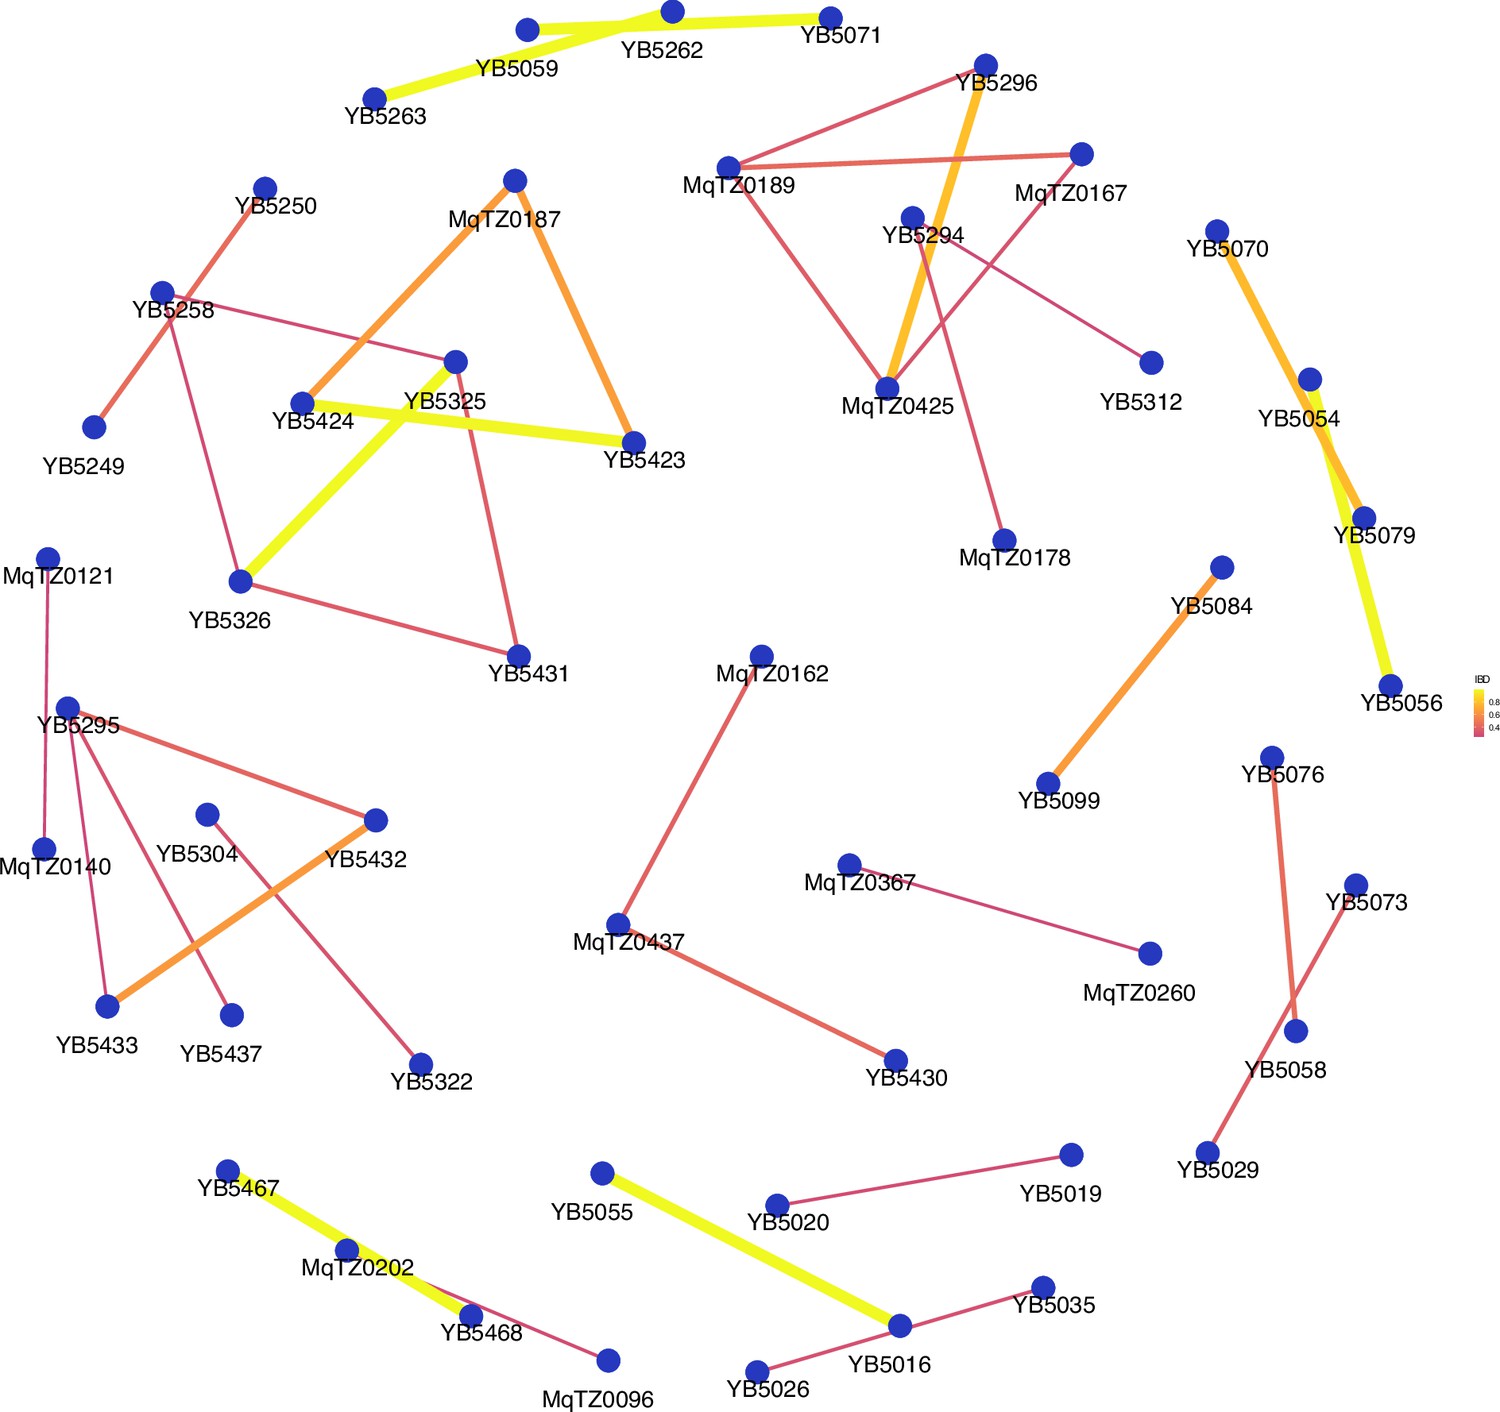
Network analysis of sample pairs with an identity by descent (IBD) of ≥0.25 for coastal mainland Tanzania.
The network of highly related (IBD ≥ 0.25) pairs is plotted above within coastal mainland Tanzania. The width of each line represents higher magnitudes of IBD between pairs.
Figure 4—figure supplement 3
Sample pairs with an identity by descent (IBD) of ≥0.125 between Zanzibar and mainland Tanzania.
Relatively few sample pairs showed moderate levels of IBD (between 0.125 and 0.20) between the coastal mainland and Zanzibar.
Figure 4—figure supplement 4
Sample pairs with an identity by descent (IBD) of ≥0.125 between Unguja and Pemba.
Relatively few sample pairs showed moderate levels of IBD (between 0.125 and 0.20) between Unguja and Pemba.
Figure 5
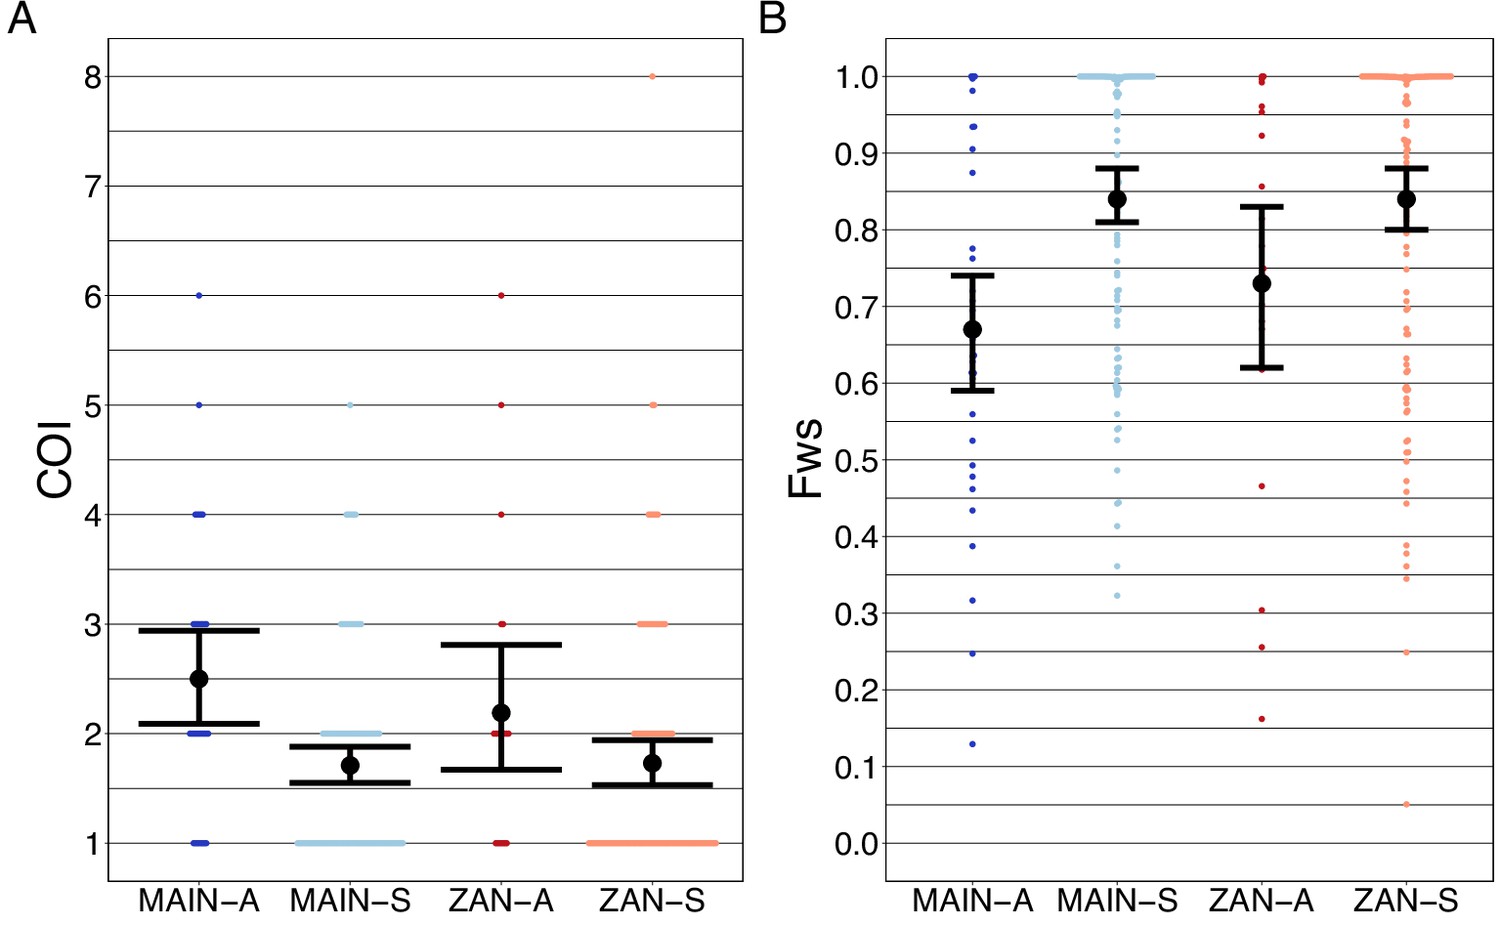
Complexity of infection (COI) and Fws metric shows a higher COI and lower Fws in asymptomatic than symptomatic infections in both mainland Tanzania and Zanzibar isolates.
COI (A) was estimated using the REAL McCOIL’s categorical method (Chang et al., 2017). The mean COI for asymptomatic was greater than symptomatic infections for all regions; MAIN-A: 2.5 (2.1–2.9), MAIN-S: 1.7 (1.6–1.9), p<0.05, Wilcoxon–Mann–Whitney test and ZAN-A: 2.2 (1.7–2.8), ZAN-S: 1.7 (1.5–1.9), p=0.05, Wilcoxon–Mann–Whitney test. Fws (B) was estimated utilizing the formula, (1-Hw)/Hp, where Hw is the within-sample heterozygosity and Hp is the heterozygosity across the population. Mean Fws was less in asymptomatic than symptomatic samples; MAIN-A: 0.67 (0.6–0.7), MAIN-S: 0.85 (0.8–0.9), p<0.05, Wilcoxon–Mann–Whitney test and ZAN-A: 0.73 (0.6–0.8), ZAN-S: 0.84 (0.8–0.9), p=0.05, Wilcoxon–Mann–Whitney test. A nonparametric bootstrap was applied to calculate the mean and 95% CI from the COI and Fws values.
Tables
Table 1
Blood samples from Zanzibar and coastal Tanzania.
| Description | Location (district) | Dates | Clinical status* | Sample size | Age range (yr) | # in genome-wide analysis | # in drug resistance analysis |
|---|---|---|---|---|---|---|---|
| Community cross-sectional surveys | Zanzibar (multiple) | 2016 | A | 70 | 2–70 | 21 | 52 |
| In vivo efficacy study of artesunate-amodiaquine (ASAQ) with single low-dose primaquine (SLDP) in pediatric uncomplicated malaria patients | Zanzibar (multiple) | 2017 | S | 143 | 2–60 | 117 | 134 |
| Study of transmission of Plasmodium falciparum to colony-reared mosquitoes | Mainland Tanzania (Bagamoyo) | 2018 | A | 40 | 7–16 | 34 | 0 |
| Parasite clearance study of artemether-lumefantrine (AL) | Mainland Tanzania (Bagamoyo) | 2018 | S | 138 | 2–11 | 110 | 123 |
-
*
Asymptomatic (A) or symptomatic (S).
Table 2
Drug resistance polymorphism prevalence in Zanzibar and coastal mainland Tanzania.
| Mutation | Zanzibar | Mainland Tanzania | ||||
|---|---|---|---|---|---|---|
| Mutant allele prevalence* | CI† | # Genotyped samples ‡ | Mutant allele prevalence* | CI† | # Genotyped samples ‡ | |
| Pfcrt-M74I | 0.054 | 0.026–0.098 | 184 | 0.000 | 0–0.034 | 106 |
| Pfcrt-N75E | 0.054 | 0.026–0.098 | 184 | 0.000 | 0–0.034 | 106 |
| Pfcrt-K76T | 0.054 | 0.026–0.098 | 184 | 0.000 | 0–0.034 | 106 |
| Pfdhfr-A16V | 0.000 | 0–0.021 | 173 | 0.000 | 0–0.032 | 112 |
| Pfdhfr-N51I | 0.977 | 0.943–0.994 | 177 | 0.964 | 0.911–0.99 | 112 |
| Pfdhfr-C59R | 0.971 | 0.934–0.991 | 174 | 0.945 | 0.884–0.98 | 109 |
| Pfdhfr-S108N | 1.000 | 0.98–1 | 179 | 1.000 | 0.965–1 | 104 |
| Pfdhfr-S108T | 0.000 | 0–0.02 | 179 | 0.000 | 0–0.035 | 104 |
| Pfdhfr-I164L | 0.000 | 0–0.02 | 184 | 0.000 | 0–0.037 | 98 |
| Pfdhps-A437G | 1.000 | 0.98–1 | 182 | 1.000 | 0.968–1 | 115 |
| Pfdhps-K540E | 0.955 | 0.913–0.98 | 178 | 0.964 | 0.91–0.99 | 111 |
| Pfdhps-A581G | 0.044 | 0.019–0.085 | 181 | 0.107 | 0.058–0.175 | 122 |
| Pfk13-K189N | 0.023 | 0.006–0.058 | 174 | 0.000 | 0–0.04 | 90 |
| Pfk13-K189T | 0.078 | 0.042–0.13 | 166 | 0.095 | 0.042–0.179 | 84 |
| Pfmdr1-N86Y | 0.011 | 0.001–0.04 | 180 | 0.008 | 0–0.044 | 124 |
| Pfmdr1-Y184F | 0.644 | 0.57–0.714 | 180 | 0.530 | 0.435–0.624 | 115 |
| Pfmdr1-D1246Y | 0.011 | 0.001–0.039 | 184 | 0.019 | 0.002–0.067 | 105 |
| Pfmdr2-I492V | 0.430 | 0.357–0.506 | 179 | 0.407 | 0.302–0.518 | 86 |
-
*
Prevalence was calculated as described in the ‘Methods’.
-
†
95% CI of these polymorphisms were calculated using the Pearson–Klopper method.
-
‡
The number of genotyped samples per loci is also shown for each polymorphism.
Additional files
Download links
A two-part list of links to download the article, or parts of the article, in various formats.
Downloads (link to download the article as PDF)
Open citations (links to open the citations from this article in various online reference manager services)
Cite this article (links to download the citations from this article in formats compatible with various reference manager tools)
Strong isolation by distance and evidence of population microstructure reflect ongoing Plasmodium falciparum transmission in Zanzibar
eLife 12:RP90173.
https://doi.org/10.7554/eLife.90173.3


