Hypothalamic corticotropin-releasing hormone neurons modulate sevoflurane anesthesia and the post-anesthesia stress responses
- Department of Pharmacology, School of Basic Medical Sciences; State Key Laboratory of Medical Neurobiology and MOE Frontiers Center for Brain Science, Institutes of Brain Science, Fudan University, China
Figures
Figure 1 with 3 supplements
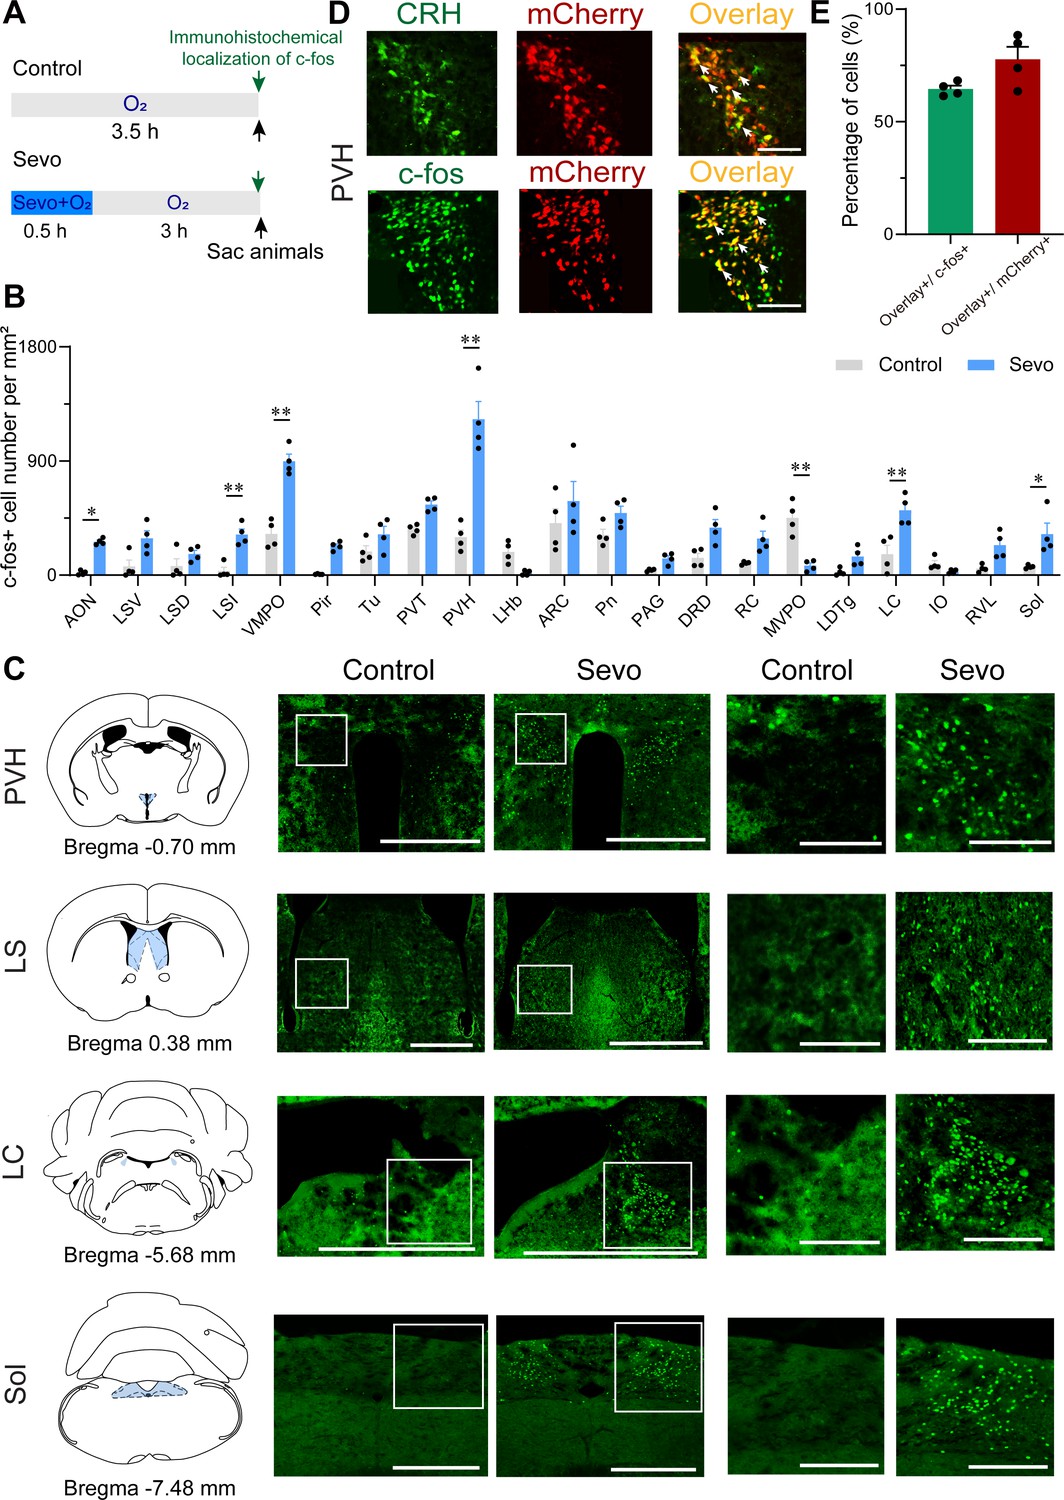
Whole-brain mapping of activated neurons during the post-anesthesia period.
(A) Experimental timeline for c-fos visualization. Animals were exposed to sevoflurane or oxygen for 30 min and were sacrificed 3 hr after the treatment. (B) Quantification of the number of c-fos+ cells per mm2 in different brain regions (n = 4, unpaired two-tailed t-test, *p < 0.05, **p < 0.01). AON, anterior olfactory nucleus; ARC, arcuate hypothalamic nucleus; DRD, dorsal raphe nucleus, dorsal part; IO, inferior olive; LC, locus coeruleus; LDTg, laterodorsal tegmental nucleus; LHb, lateral habenular nucleus; LSD, lateral septal nucleus, dorsal part; LSI, lateral septal nucleus, intermediate part; LSV, lateral septal nucleus, ventral part; MVPO, medioventral periolivary nucleus; PAG, periaqueductal gray; Pir, piriform cortex; Pn, pontine nuclei; PVH, paraventricular nucleus of the hypothalamus; PVT, paraventricular thalamus; RC, raphe cap; RVL, rostroventrolateral reticular nucleus; Sol, nucleus of the solitary tract; Tu, olfactory tubercle; VMPO, ventromedial preoptic nucleus. (C) Representative images of c-fos immunoreactivity in the PVH, LS, LC, and Sol for a control and an experimental animal exposed to sevoflurane general anesthesia. Scale bar, 500 µm (left), 250 µm (right, enlarged). (D) Representative images showing colocalization of CRH immunoreactivity and mCherry expression (upper panel, scale bar, 100 µm), c-fos immunoreactivity and mCherry expression (bottom panel, scale bar, 100 µm) in the PVH of CRH-Cre mice. Arrowheads indicate co-labeled neurons. (E) Quantification of the percentage of mCherry+ cells in the c-fos+ population (green) and the percentage of c-fos+ cells in the mCherry+ population (red) in the PVH.
Figure 1—figure supplement 1
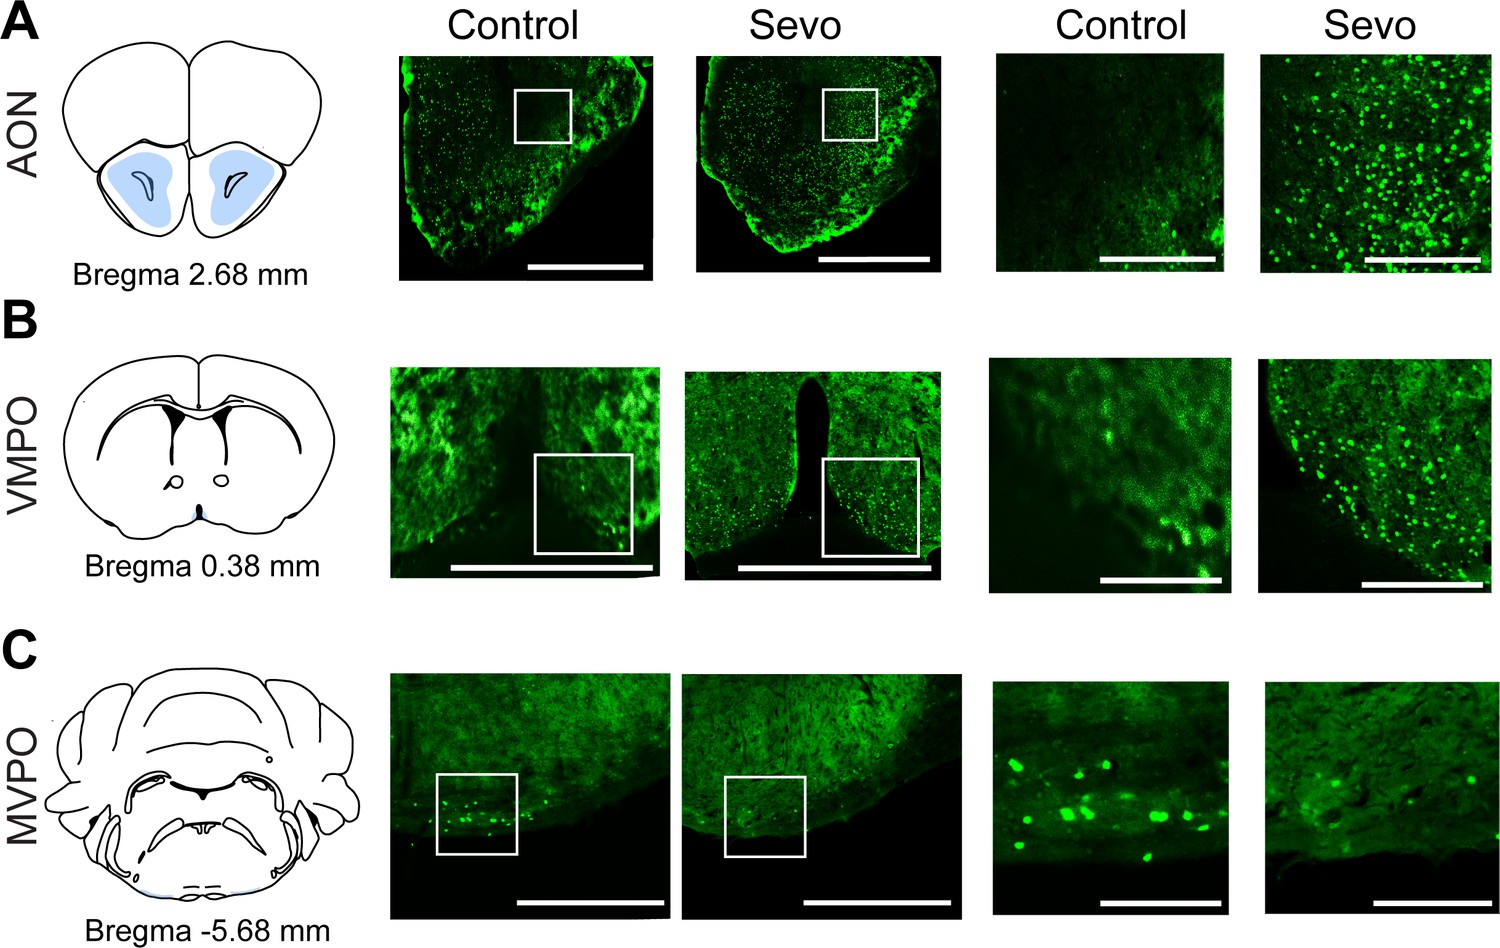
Whole-brain mapping of active neurons during the post-anesthesia period.
(A–C) Representative images of c-fos immunoreactivity in the AON, VMPO, and MVPO for control and experimental animals exposed to sevoflurane GA. Scale bar, 500 µm (left), 250 µm (right, enlarged). AON, anterior olfactory nucleus; MVPO, medioventral periolivary nucleus; VMPO, ventromedial preoptic nucleus.
Figure 1—figure supplement 2
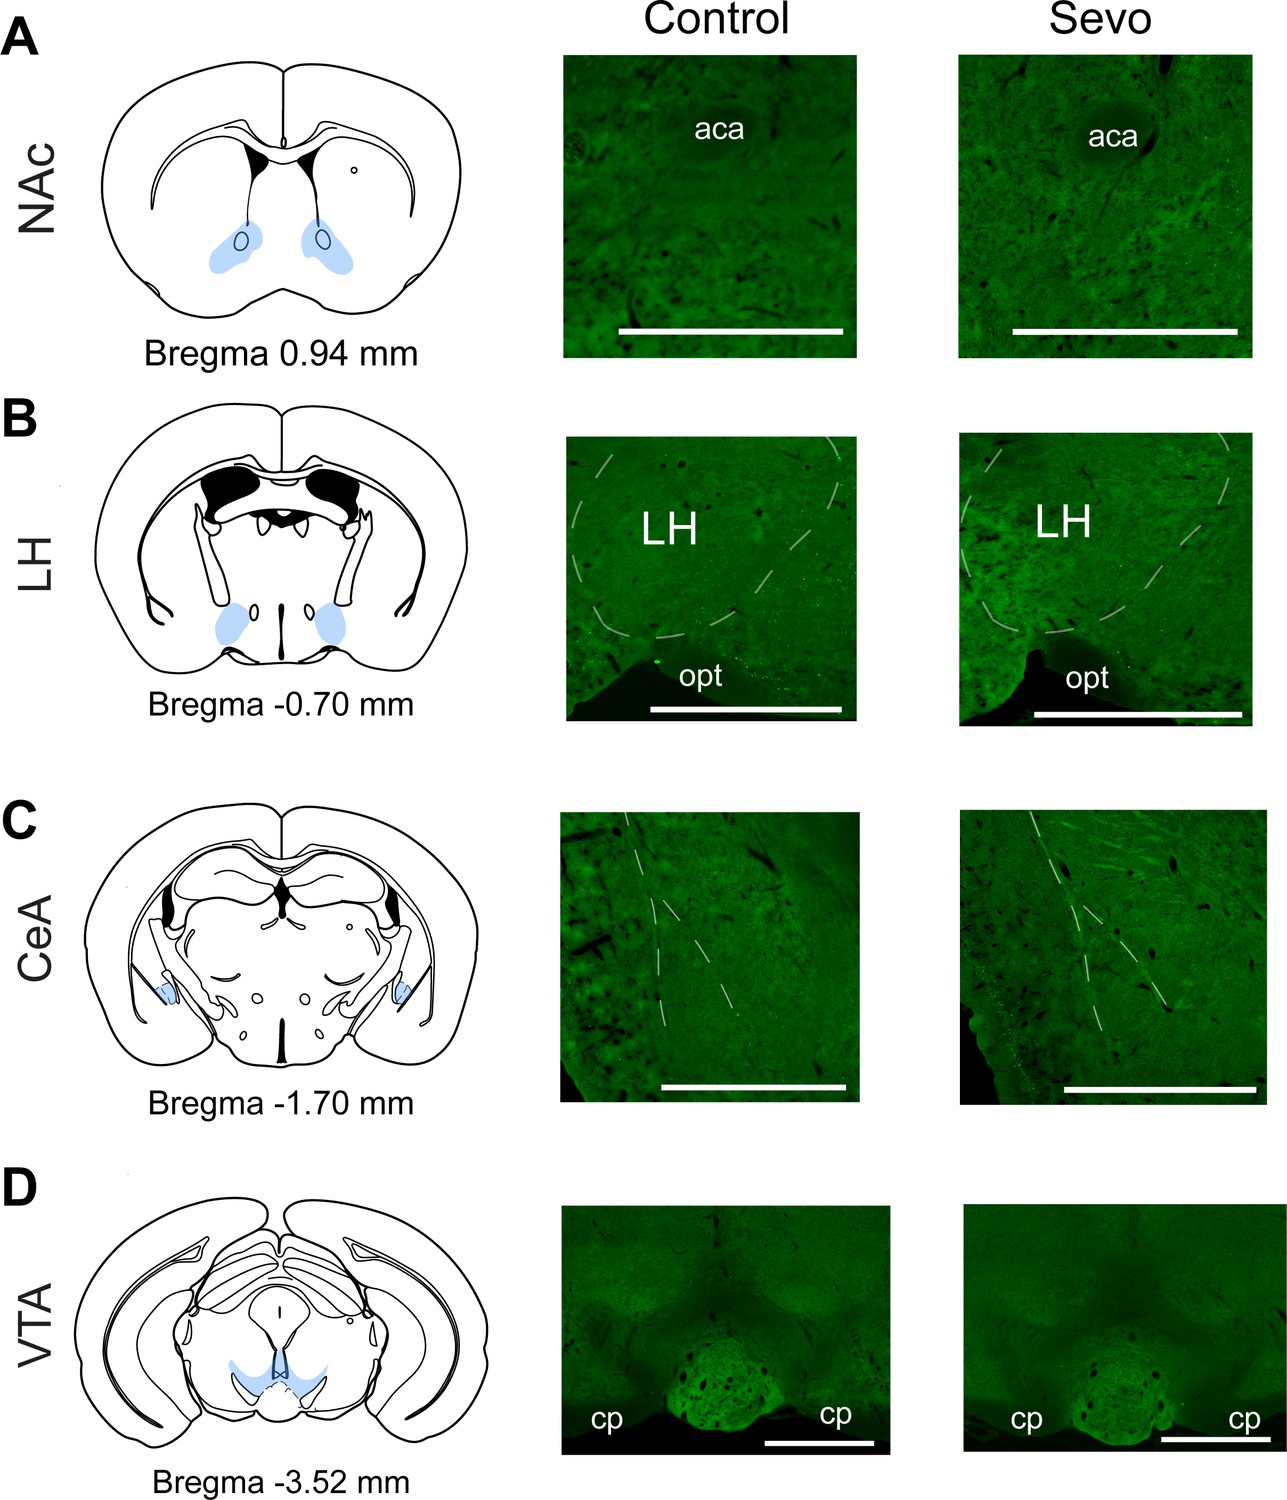
Representative images of brain regions without robust c-fos immunoreactivity.
(A–D) Representative images of brain regions showing undetectable c-fos immunoreactivity. aca, anterior commissure – the anterior part; CeA, central amygdaloid nucleus; cp, cerebral peduncle – the basal part; LH, lateral hypothalamus; NAc, nucleus accumbens; opt, optic tract; VTA, the ventral tegmental area. Scale bar, 500 µm.
Figure 1—figure supplement 3
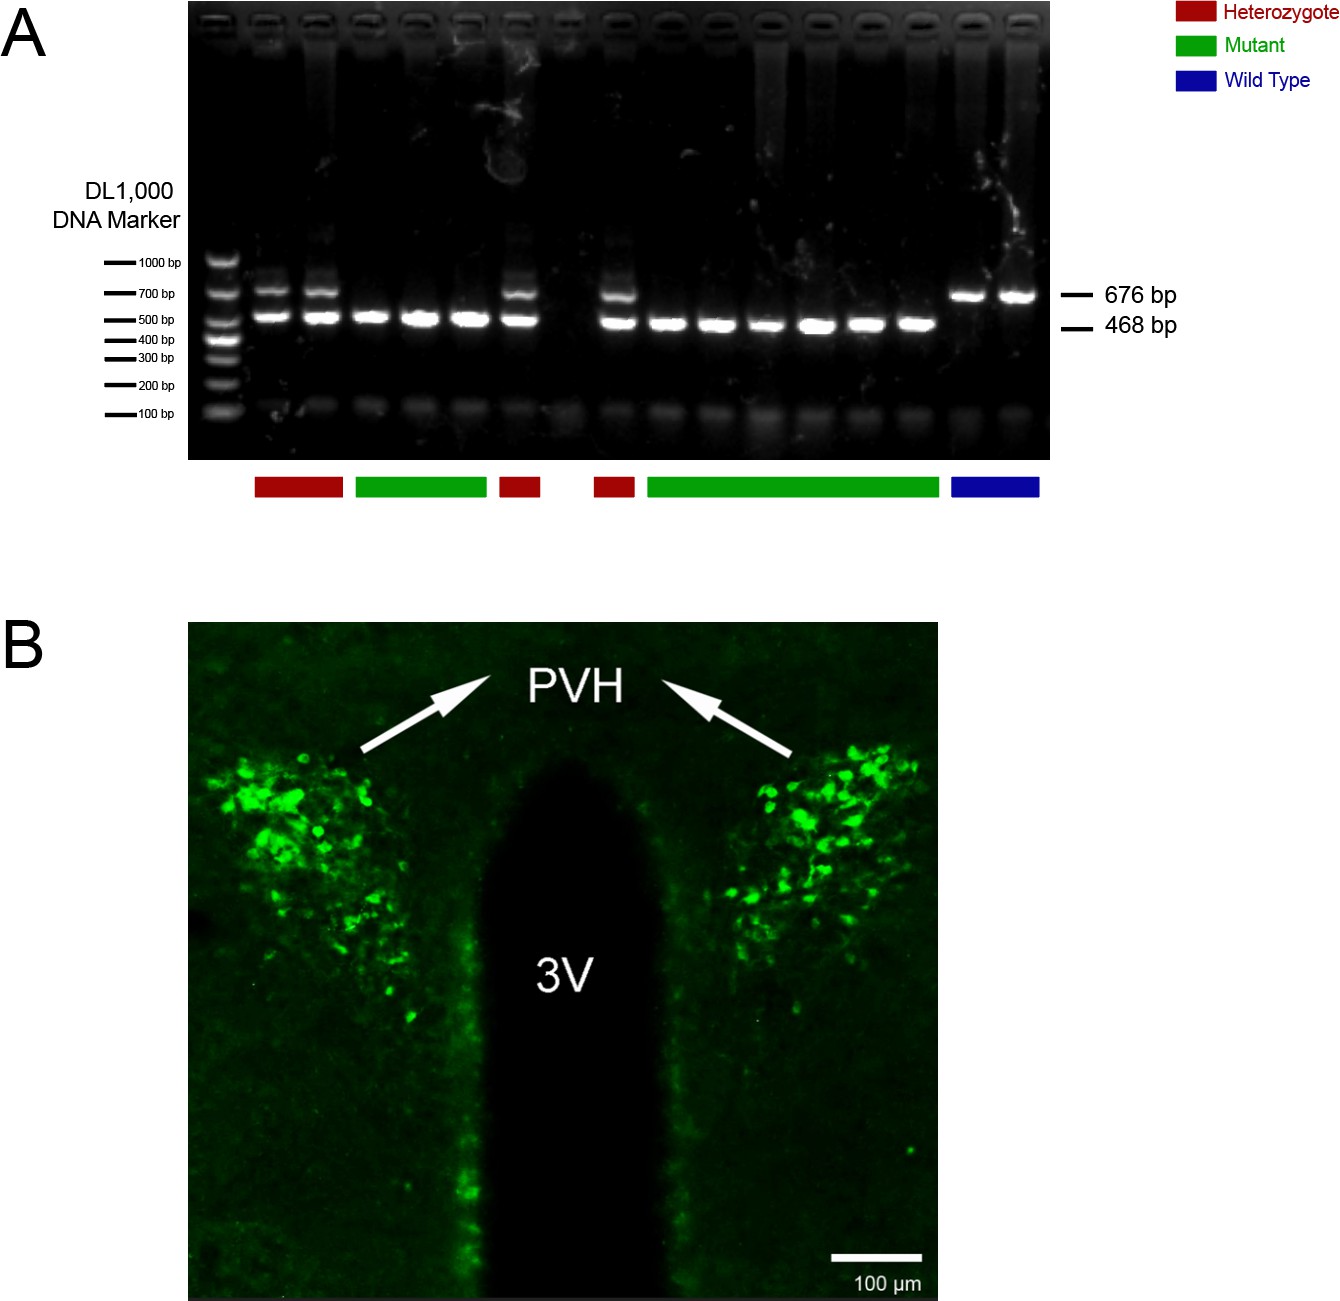
Validation of CRH-Cre mice and CRH antibody.
(A) Standard PCR of CRH-Cre mice (B6(Cg)-Crhtm1(cre)Zjh/J). Gels were provided as Figure 1—figure supplement 3—source data 1 and 2. The 468 bp CRH-specific PCR product was amplified in mutant (CRH-Cre+/+) mice; in heterozygote (CRH-Cre+/−) mice, both the 468 and the 676 bp PCR products were detected; in wild-type (WT) mice, only the 676 bp WT allele-specific PCR product was amplified. (B) Representative images showing CRH immunoreactivity using CRH antibody at a concentration of 1:800, Scale bar, 100 μm.
-
Figure 1—figure supplement 3—source data 1
Original file of the full raw uncropped, unedited gels of RT-PCR for the validation of CRH-Cre mice.
- https://cdn.elifesciences.org/articles/90191/elife-90191-fig1-figsupp3-data1-v1.zip
-
Figure 1—figure supplement 3—source data 2
Figure with the uncropped gels with the relevant bands clearly labeled of RT-PCR for the validation of CRH-Cre mice.
- https://cdn.elifesciences.org/articles/90191/elife-90191-fig1-figsupp3-data2-v1.zip
Figure 2
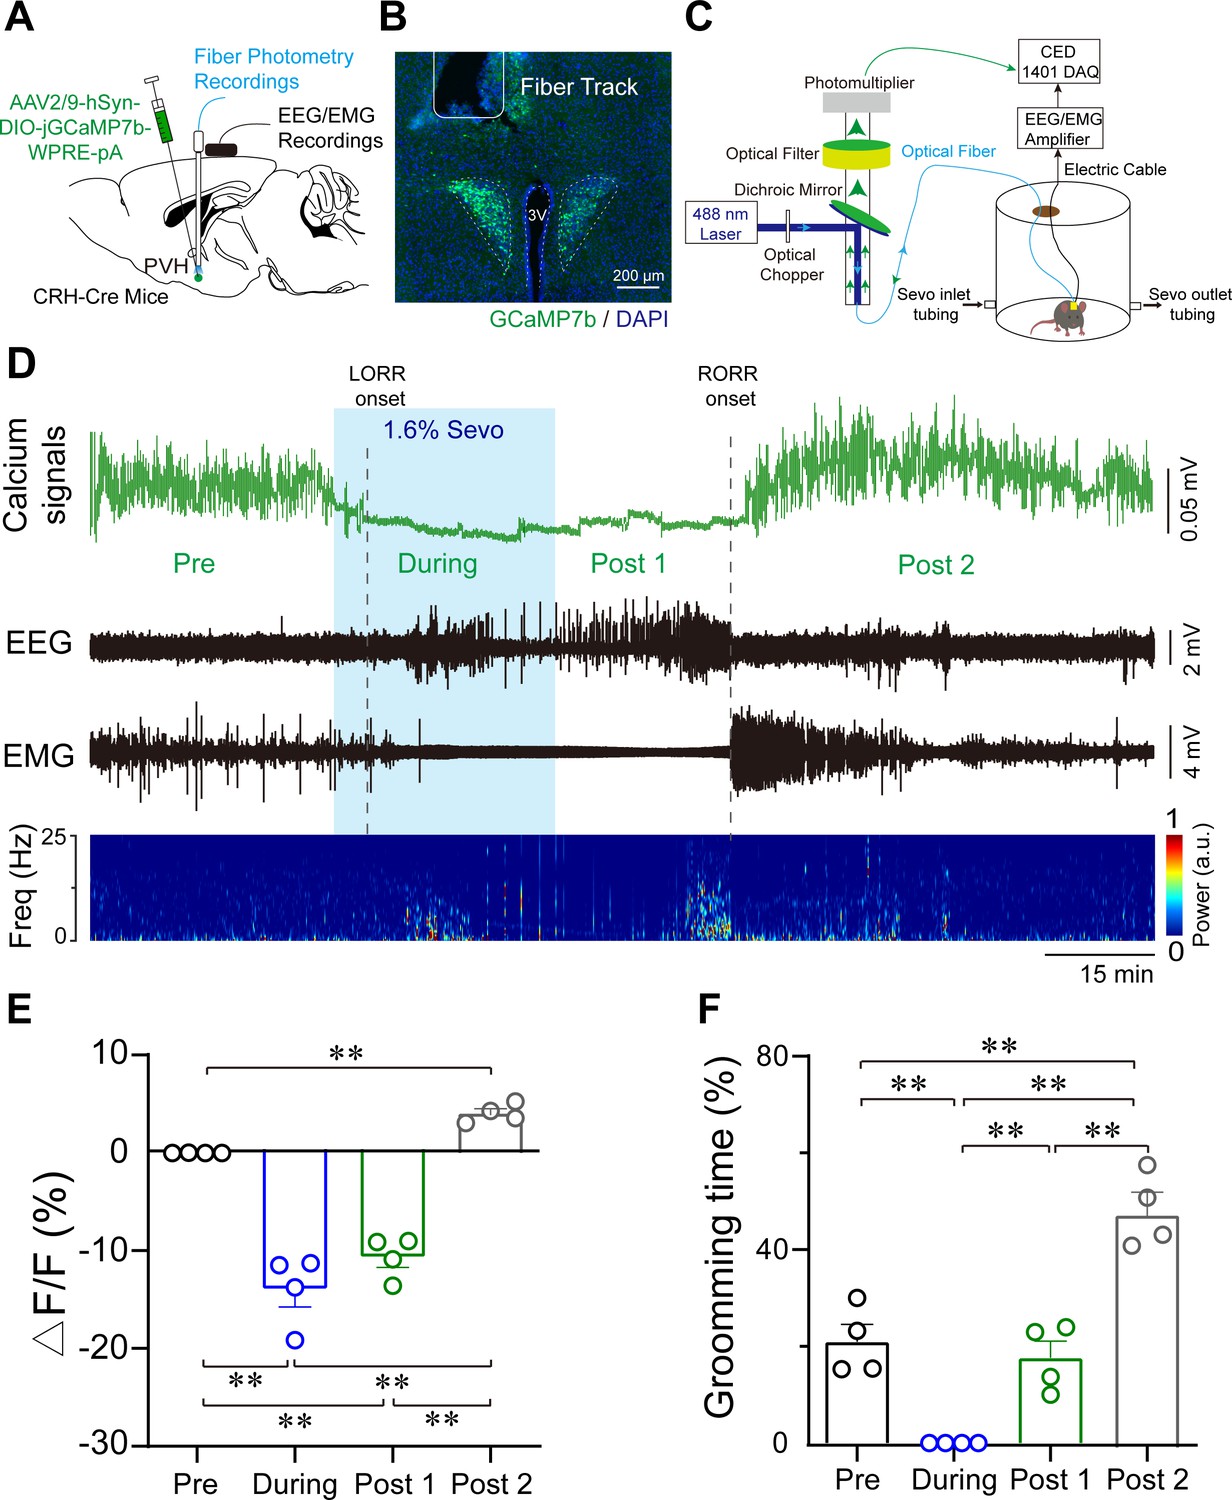
Population activities of PVHCRH neurons in response to sevoflurane general anesthesia.
(A) Diagram of the virus injection, electroencephalogram (EEG)/electromyography (EMG) electrode, and optic fiber implantation sites of CRH-Cre mice. (B) jGCaMP7b/DAPI immunofluorescence in CRH neurons and track of the optic fiber implanted above the paraventricular nucleus of the hypothalamus (PVH); scale bar, 200 μm. Viral expression of jGCaMP7b and placement of the fiber-optic probe above the PVH. (C) Schematic of the recording configuration. (D-–E) Time courses of Ca2+ signals (D) and quantification of Ca2+ signal changes before, during, and after (post 1 and post 2 periods) sevoflurane inhalation (E), n = 4, F(3, 12) = 61.49, p < 0.001, one-way ANOVA with Tukey’s post hoc test; pre vs. during, pre vs. post 1, during vs. post 2, post 1 vs. post 2, **p < 0.001; pre vs. post 2, p = 0.0894; during vs. post 1, p = 0.2012. Freq, frequency; LORR, loss of right reflexing; RORR, recovery of right reflexing; Sevo, sevoflurane. (F) Time percentage of self-grooming before, during, and after (post 1 and post 2 periods) sevoflurane inhalation (n = 4, F(3, 12) = 76.87, p < 0.001, one-way repeated measures ANOVA with Tukey’s post hoc test; pre vs. during, pre vs. post 1, p = 0.0005; pre vs. post 2 during vs. post 2, post 1 vs. post 2, **p < 0.0001; during vs. post 1, p > 0.9999).
-
Figure 2—source data 1
Original data for analysis displayed in Figure 2E,F.
- https://cdn.elifesciences.org/articles/90191/elife-90191-fig2-data1-v1.xlsx
Figure 3 with 1 supplement
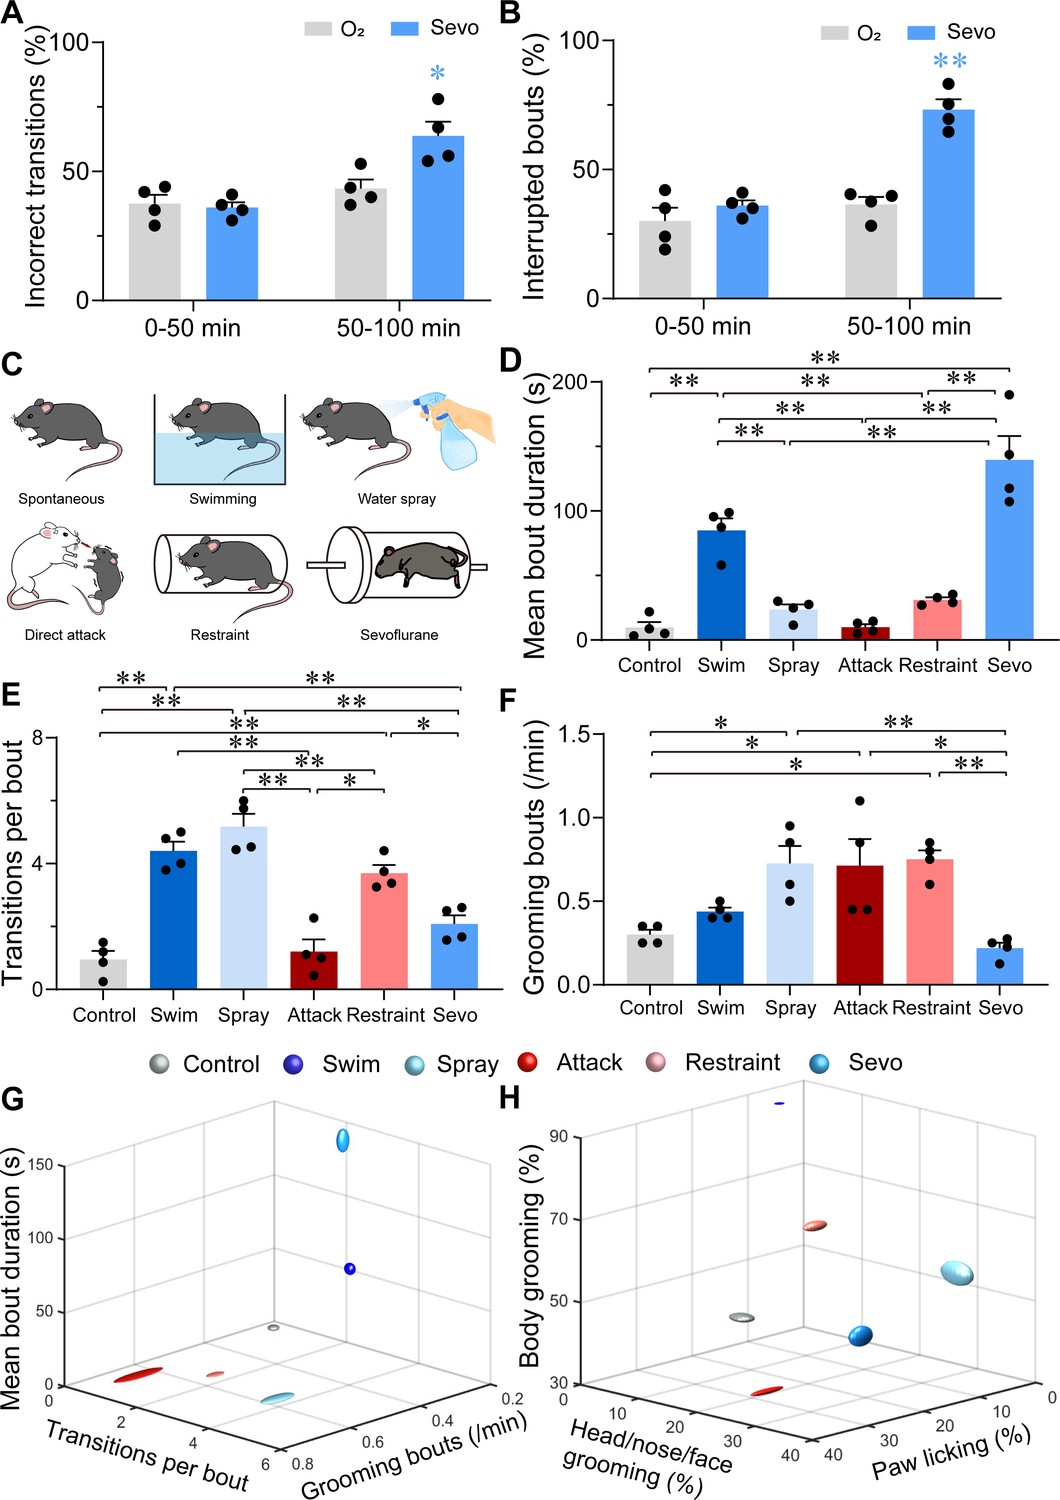
Characterizations of sevoflurane general anesthesia-induced grooming.
(A) Quantification of incorrect transitions with respect to the cephalocaudal sequence of stereotypic grooming patterns in the post-anesthesia period (n = 4, two-way ANOVAs followed by Sidak’s test, F(1, 6) = 8.646, p = 0.0259, 0–50 min: O2 vs. sevo, p = 0.9545, t = 0.2767, df = 12, 95% CI = −12.34 to 15.34; 50–100 min, O2 vs. sevo, p = 0.0055, t = 3.753, df = 12, 95% CI = −34.19 to −6.504). (B) Number of interrupted bouts in the post-anesthesia period (n = 4, two-way ANOVAs followed by Sidak’s test, F(1, 6) = 19.14, p = 0.0047, 0–50 min: O2 vs. sevo, p = 0.4770, t = 1.139, df = 12, 95% CI = −19.45 to 7.446; 50–100 min, O2 vs. sevo, **p < 0.01, t = 6.969, df = 12, 95% CI = −50.15 to −23.26). (C) Six representative grooming models, including spontaneous (control), swimming, water spray, physical attack, body restraint, and sevoflurane GA-induced grooming. (D-F) The mean bout duration (D, F(5, 18) = 34.52, p < 0.0001), transitions per bout (E, F(5, 18) = 30.32, p < 0.0001), and grooming frequency (bouts per min, F, F(5, 18) = 7.935, p = 0.0004) varied across the models (n = 4, one-way ANOVA with Tukey’s post hoc test. *p < 0.05; **p < 0.01). (G-H) 3D plot of bout frequency, bout duration, and transitions per bout (G); the percentage of time spent grooming different body parts (H). The dimension of the symbol along an axis is defined by the SD of the corresponding parameter.
-
Figure 3—source data 1
Original data for analysis displayed in Figure 3.
- https://cdn.elifesciences.org/articles/90191/elife-90191-fig3-data1-v1.xlsx
Figure 3—figure supplement 1
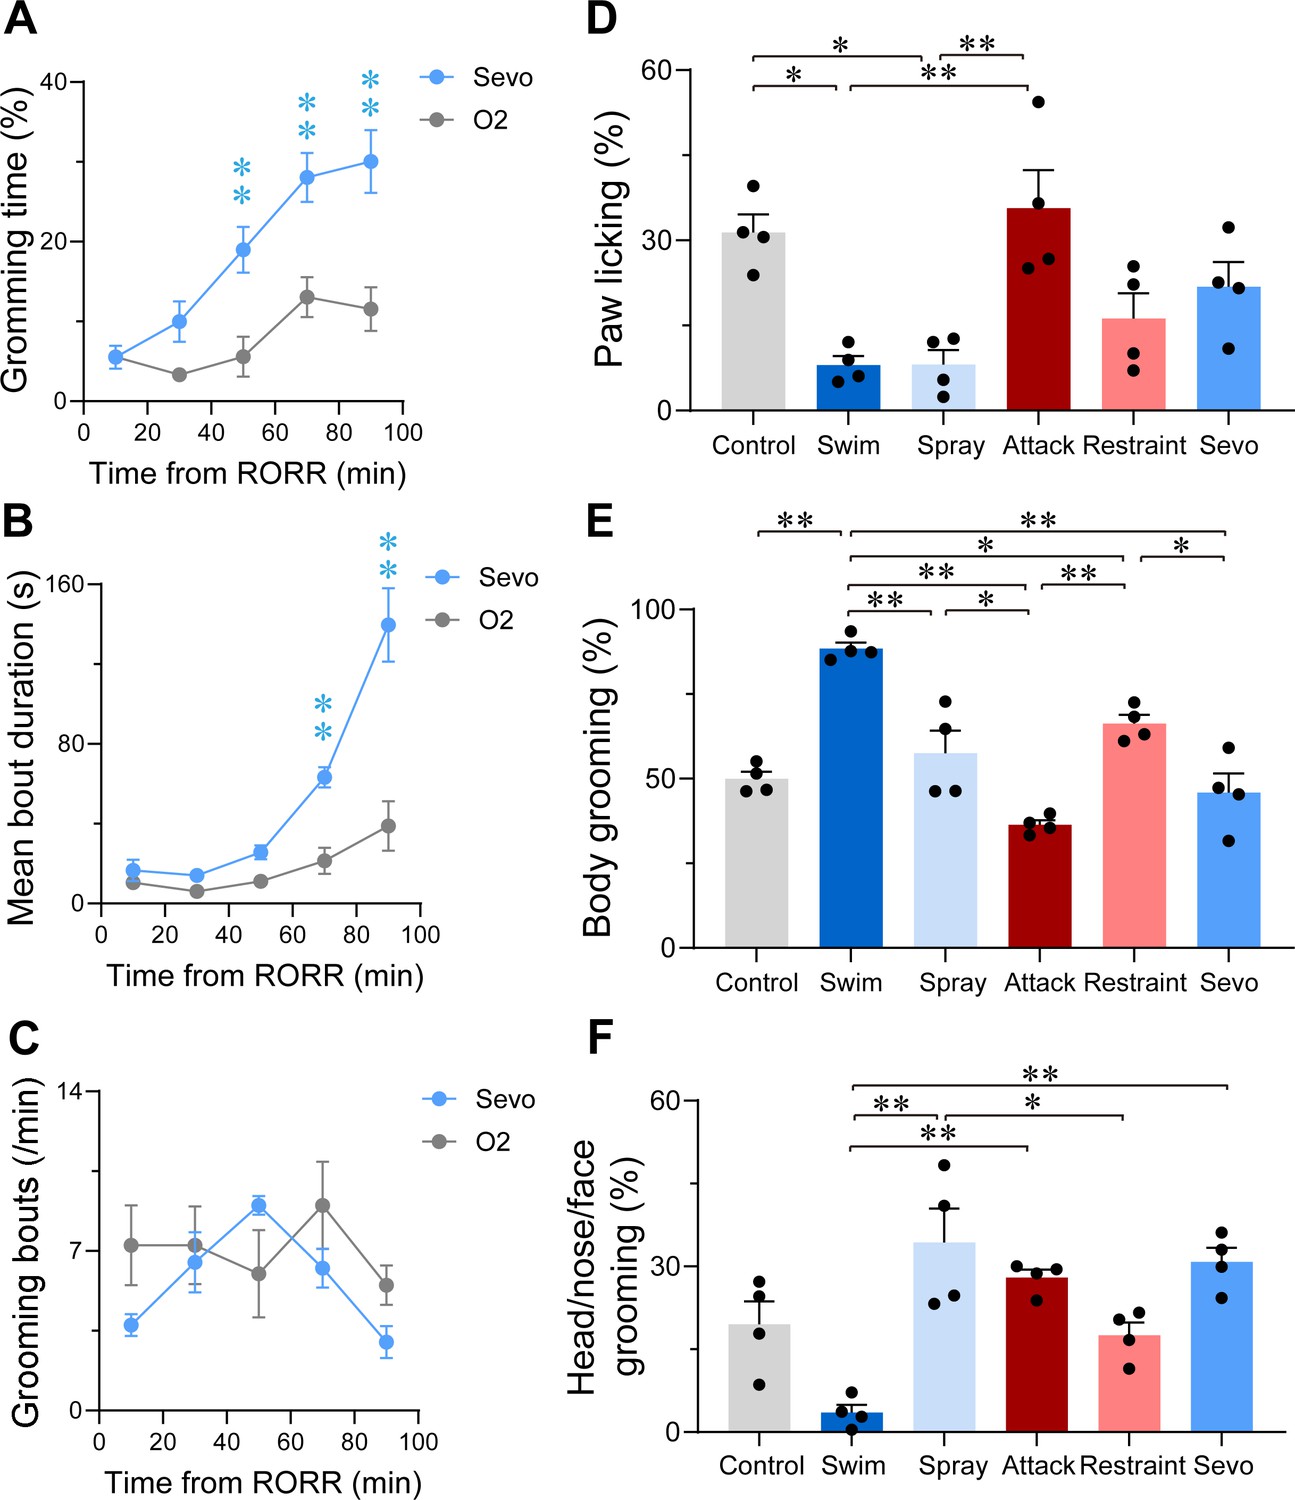
Characterization of sevoflurane general anesthesia -induced grooming.
Time courses for grooming time percentage (A, F(4, 24) = 4.268, p = 0.0095), mean bout duration (B, F(4, 24) = 17.42, p < 0.0001), grooming frequency (bouts per min, C, F(4, 24) = 1.927, p = 0.1385) within 100 min in mice after 30 min exposure of sevoflurane GA or oxygen (n = 4, two-way ANOVAs followed by Sidak’s test). Quantification of the number of bouts spent on paw licking (D, F(5, 18) = 7.824, p = 0.0005), body grooming (E, F(5, 18) = 21.67, p < 0.0001) and head/nose/face grooming (F, F(5, 18) = 10.72, p < 0.0001) in the six grooming models (n = 4, one-way ANOVA with Tukey’s post hoc test. *p < 0.05; **p < 0.01).
-
Figure 3—figure supplement 1—source data 1
Original data for analysis displayed in Figure 3—figure supplement 1.
- https://cdn.elifesciences.org/articles/90191/elife-90191-fig3-figsupp1-data1-v1.xlsx
Figure 4 with 3 supplements
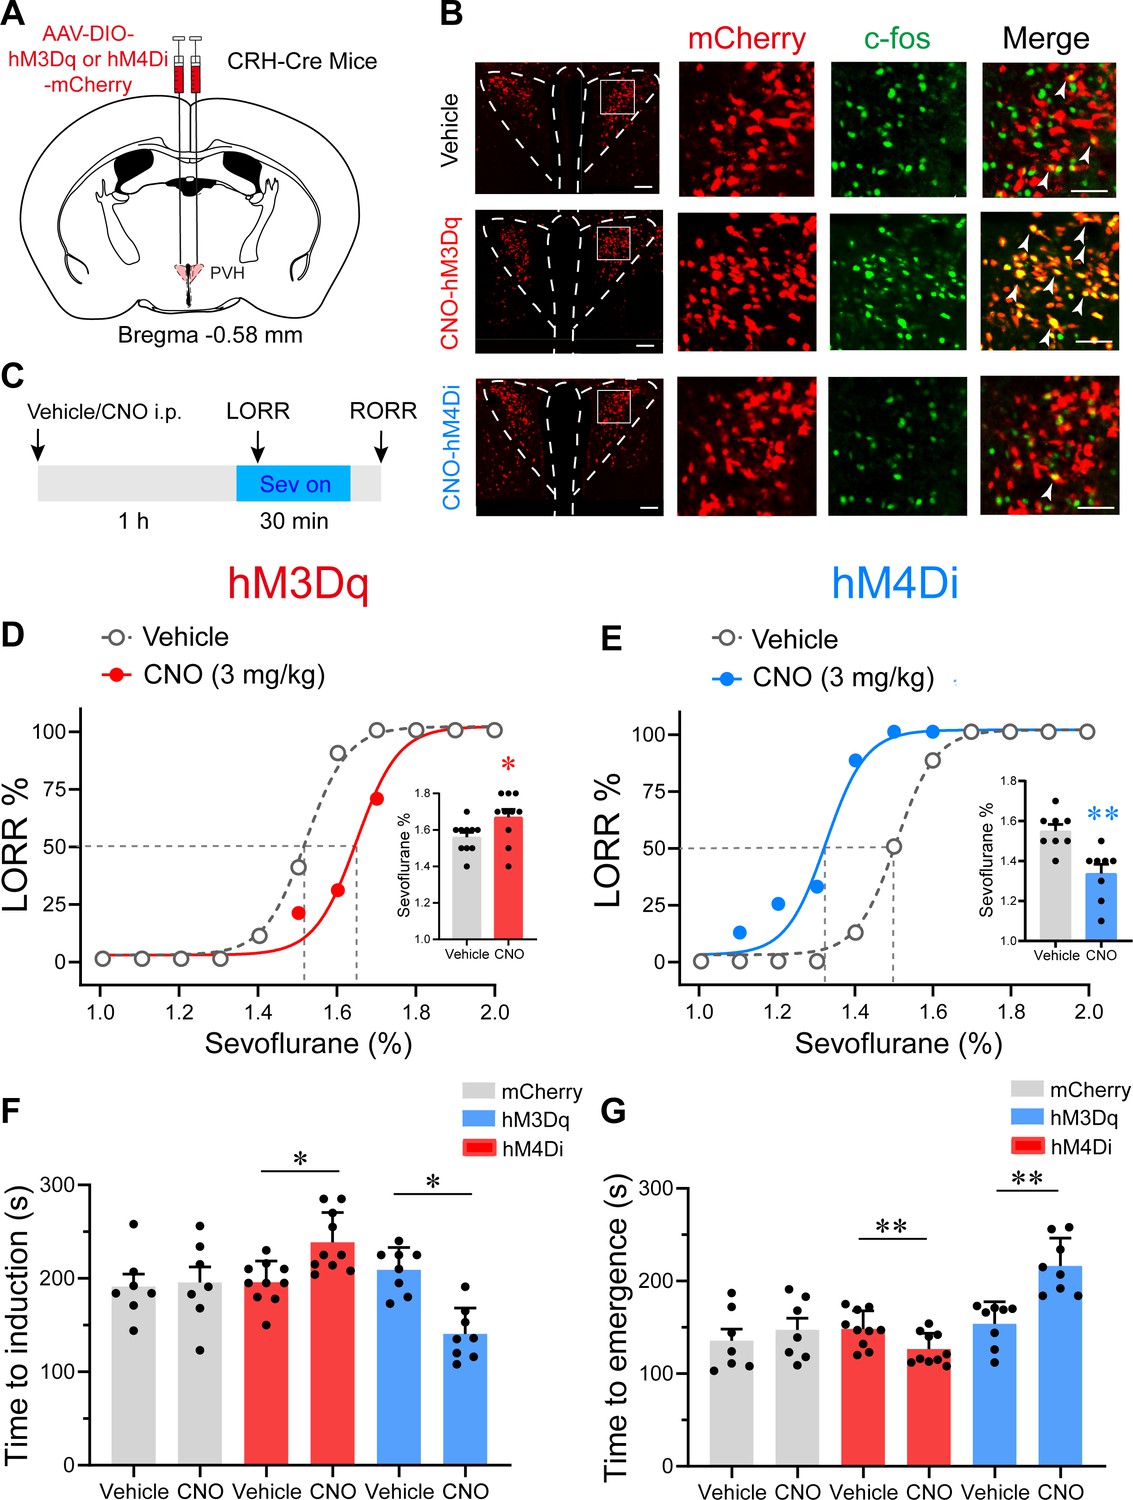
Chemogenetic modulation of PVHCRH neurons bidirectionally altered induction of and emergence from sevoflurane general anesthesia.
(A) Schematic of AAV-DIO-hM3Dq-mCherry or AAV-DIO-hM4Di-mCherry or AAV-DIO-mCherry injected into the paraventricular nucleus of the hypothalamus (PVH) of CRH-Cre mice. (B) Left: representative images of mCherry/c-fos immunofluorescence in CRH neurons after vehicle or clozapine-N-oxide (CNO) treatment; scale bars, 200 μm. Right: magnified images are shown; scale bar, 200 μm. Arrowheads indicate co-labeled neurons. (C) Timelines of sevoflurane anesthesia-related behavioral tests measuring induction time (loss of righting reflex, LORR) and emergence time (recovery of righting reflex, RORR). (D, E) Dose–response curves showing the percentages of mice exhibiting LORR in response to incremental sevoflurane concentrations for the vehicle and CNO groups. Inset: the sevoflurane concentrations at which each mouse exhibited LORR are shown (D, hM3Dq group, n = 10, paired t-test, p = 0.0411, t = 4.714, df = 9, 95% CI = 0.05 to 0.16; E, hM4Di group, n = 8, paired t-test, p = 0.0021, t = 9.375, df = 7, 95% CI = −0.266 to −0.1589). (F) Induction time with 2% sevoflurane exposure after intraperitoneal injections of vehicle or CNO for 1 hr (mCherry group, n = 7, paired t-test, p = 0.847, t = 0.2014, df = 6, 95% CI = −47.77 to 56.35; hM3Dq group, n = 10, paired t-test, p = 0.0498, t = 5.545, df = 7, 95% CI = 32.26 to 80.24; hM4Di group, n = 8, paired t-test, p = 0.0060, t = 4.573, df = 7, 95% CI = −104.1 to −33.14). (G) Emergence time with 2% sevoflurane exposure for 1 hr after intraperitoneal injections of vehicle or CNO (mCherry group, n = 7, paired t-test, p = 0.8298, t = 0.9286, df = 6, 95% CI = −19.15 to 42.58; hM3Dq group, n = 10, paired t-test, p = 0.0048, t = 4.057, df = 7, 95% CI = −43.72 to −11.53; hM4Di group, n = 8, paired t-test, p = 0.0057, t = 3.922, df = 7, 95% CI = 24.77 to 99.98). *p < 0.05, **p < 0.01.
-
Figure 4—source data 1
Original data for analysis displayed in Figure 4D-G.
- https://cdn.elifesciences.org/articles/90191/elife-90191-fig4-data1-v1.xlsx
-
Figure 4—source data 2
Mean value of EC50 for sevoflurane dose–response curves.
- https://cdn.elifesciences.org/articles/90191/elife-90191-fig4-data2-v1.docx
Figure 4—figure supplement 1
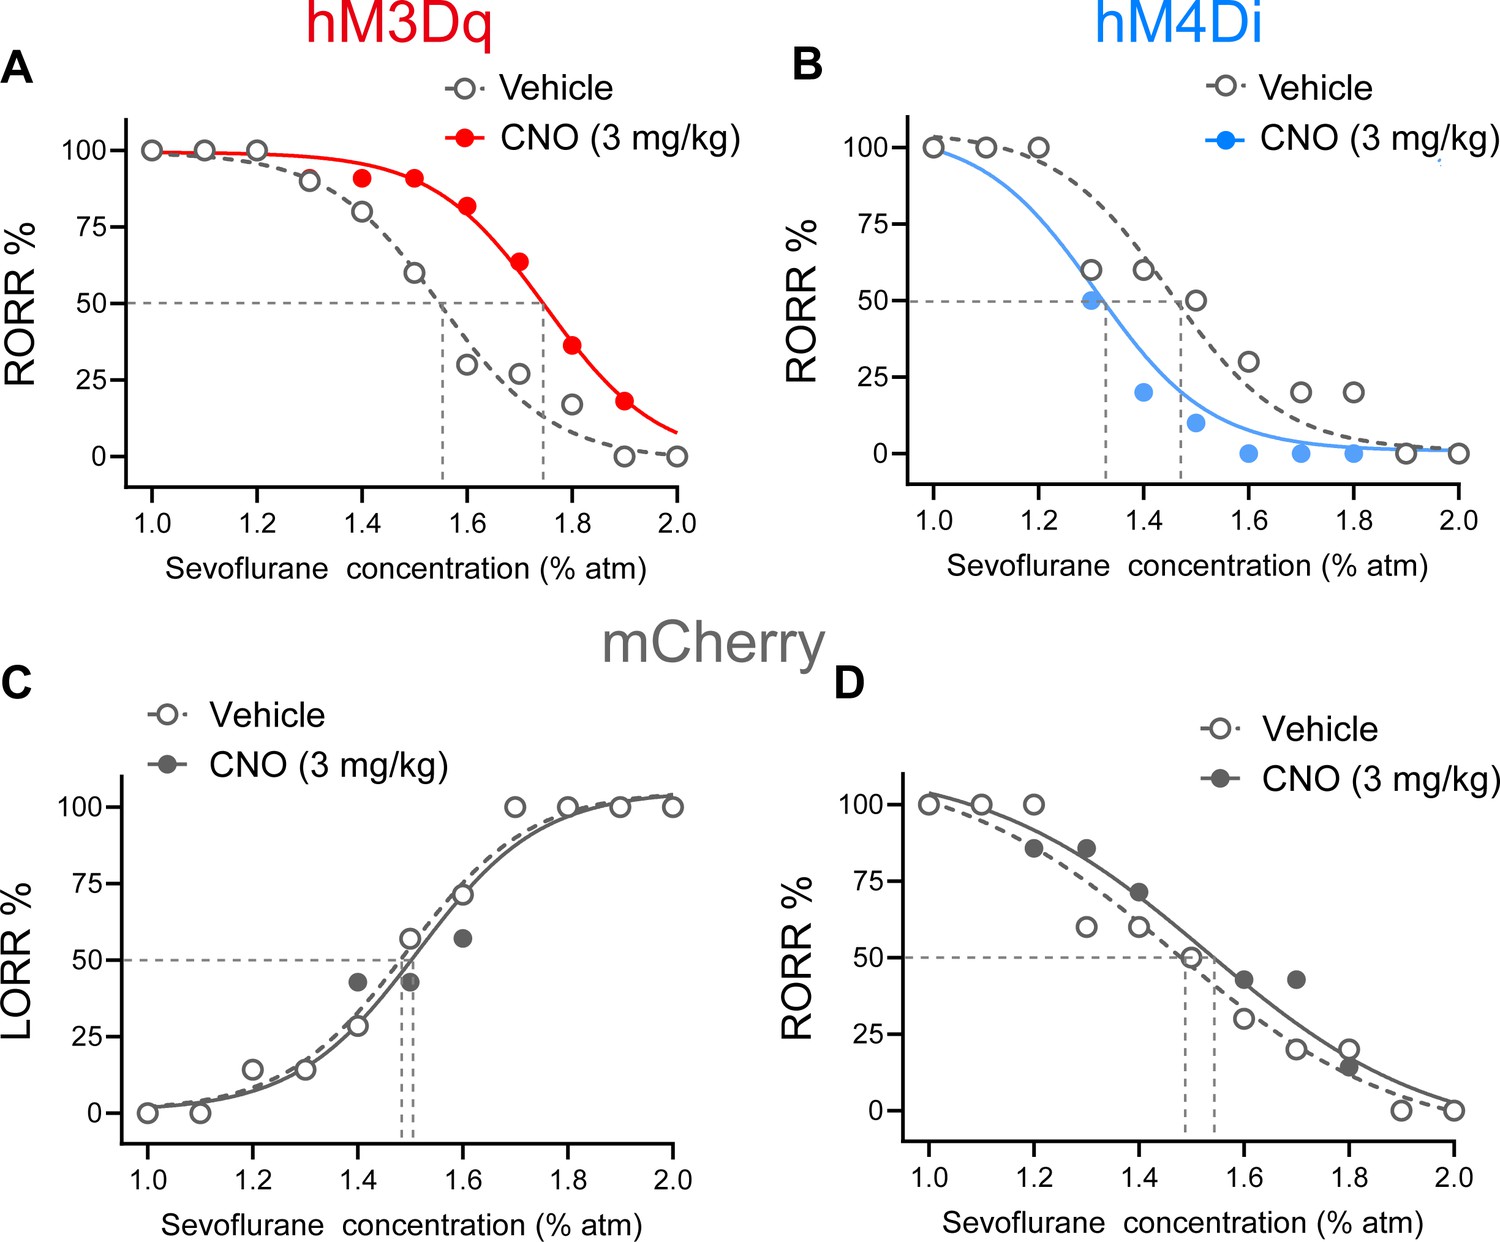
Dose–response curves showing the percentages of mice exhibiting LORR (C) or recovery of righting reflex (RORR) (A, B, D) in response to incremental or decreased sevoflurane concentrations for the PVHCRH neurons activation (A), inhibition (B), and control (C, D) groups.
CNO, clozapine-N-oxide; LORR, loss of righting reflex.
-
Figure 4—figure supplement 1—source data 1
Original data for analysis displayed in Figure 4—figure supplement 1.
- https://cdn.elifesciences.org/articles/90191/elife-90191-fig4-figsupp1-data1-v1.xlsx
Figure 4—figure supplement 2

Lesion of PVHCRH neurons facilitated induction of and delayed emergence from sevoflurane general anesthesia.
(A) Schematic of AAV-CAG-FLEX-taCasp3-TEVp injected into the paraventricular nucleus of the hypothalamus (PVH) of CRH-Cre mice. (B) Representative coronal sections containing PVH regions from CRH-Cre mice sham-injected (Vehicle) or injected with AAV-CAG-FLEX-taCasp3-TEVp into the PVH. Scale bars, 100 μm. Dose–response curves showing the percentages of mice exhibiting loss of righting reflex (LORR) (C) or recovery of righting reflex (RORR) (D) in response to incremental or decreasing sevoflurane concentrations for the vehicle and lesion groups. (E) Induction time with 2% sevoflurane exposure of vehicle or lesion groups (n = 8, unpaired t-test, p < 0.0001). (F) Emergence time with 2% sevoflurane exposure of vehicle or lesion groups (n = 8, unpaired t-test, p = 0.0004). **p < 0.01.
-
Figure 4—figure supplement 2—source data 1
Original data for analysis displayed in Figure 4—figure supplement 2C-F.
- https://cdn.elifesciences.org/articles/90191/elife-90191-fig4-figsupp2-data1-v1.xlsx
Figure 4—figure supplement 3
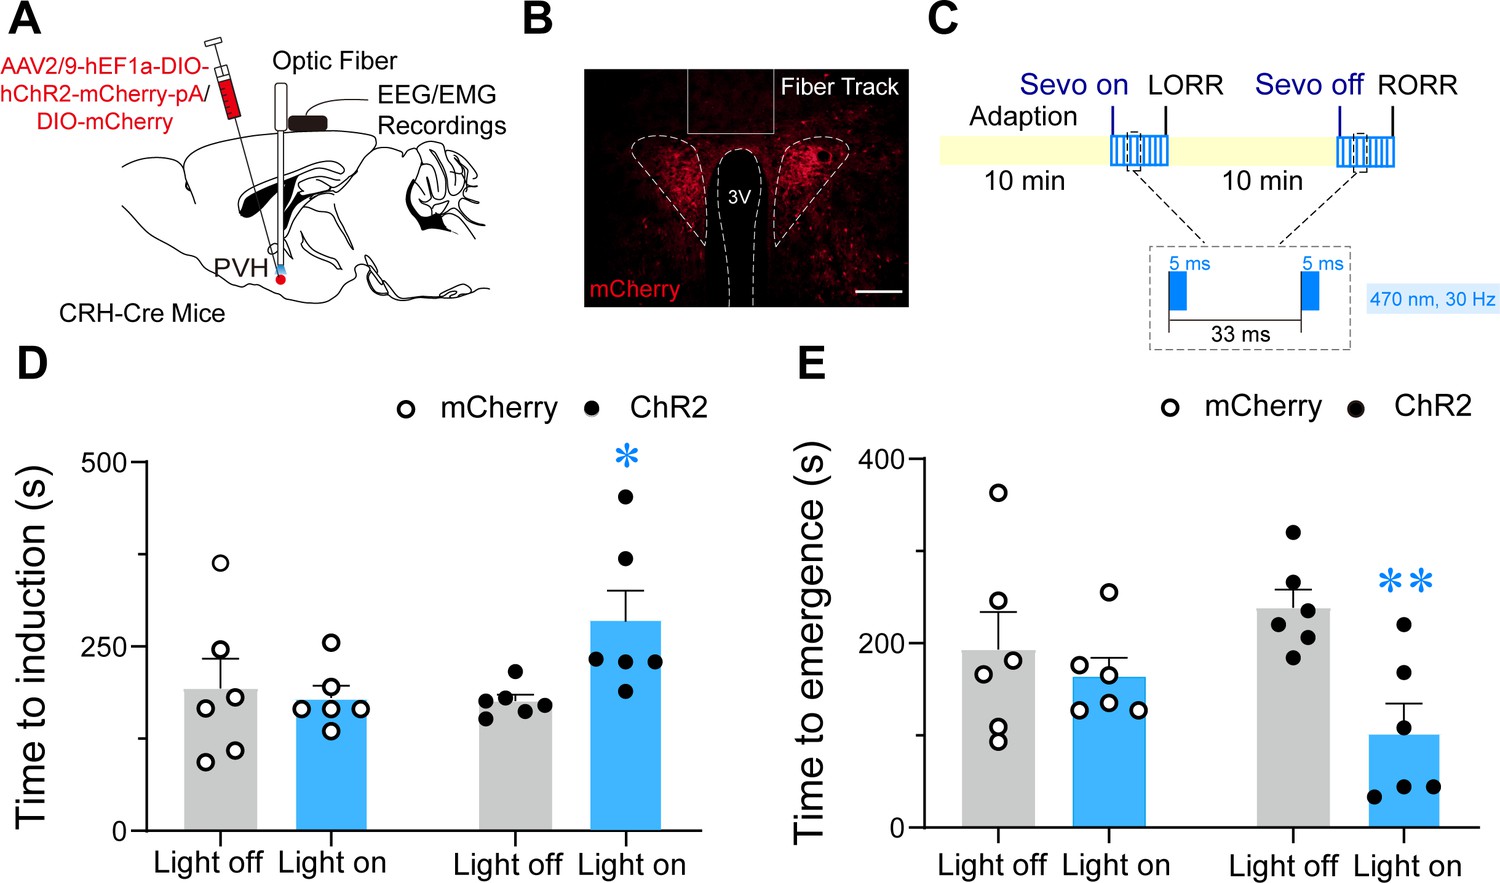
Optogenetic stimulation of PVHCRH neurons delayed induction and facilitated emergence from sevoflurane general anesthesia.
(A) Schematic of optogenetic stimulation of ChR2-expressing PVHCRH neurons with electroencephalogram (EEG)/electromyography (EMG) recordings. (B) Image of ChR2-expressing PVHCRH neurons (bottom, scale bar: 200 μm). (C) Protocol for optogenetic activation during sevoflurane GA. Optical activation of PVHCRH neurons shortened the induction time (D) and prolonged the emergence time from 2% sevoflurane GA (E), mCherry-light-on vs. ChR2-light-on, unpaired t-test; ChR2-light-on vs. ChR2-light-off, paired t-test. n = 6, *p < 0.05, **p < 0.01.
-
Figure 4—figure supplement 3—source data 1
Original data for analysis displayed in Figure 4—figure supplement 3D-E.
- https://cdn.elifesciences.org/articles/90191/elife-90191-fig4-figsupp3-data1-v1.xlsx
Figure 5
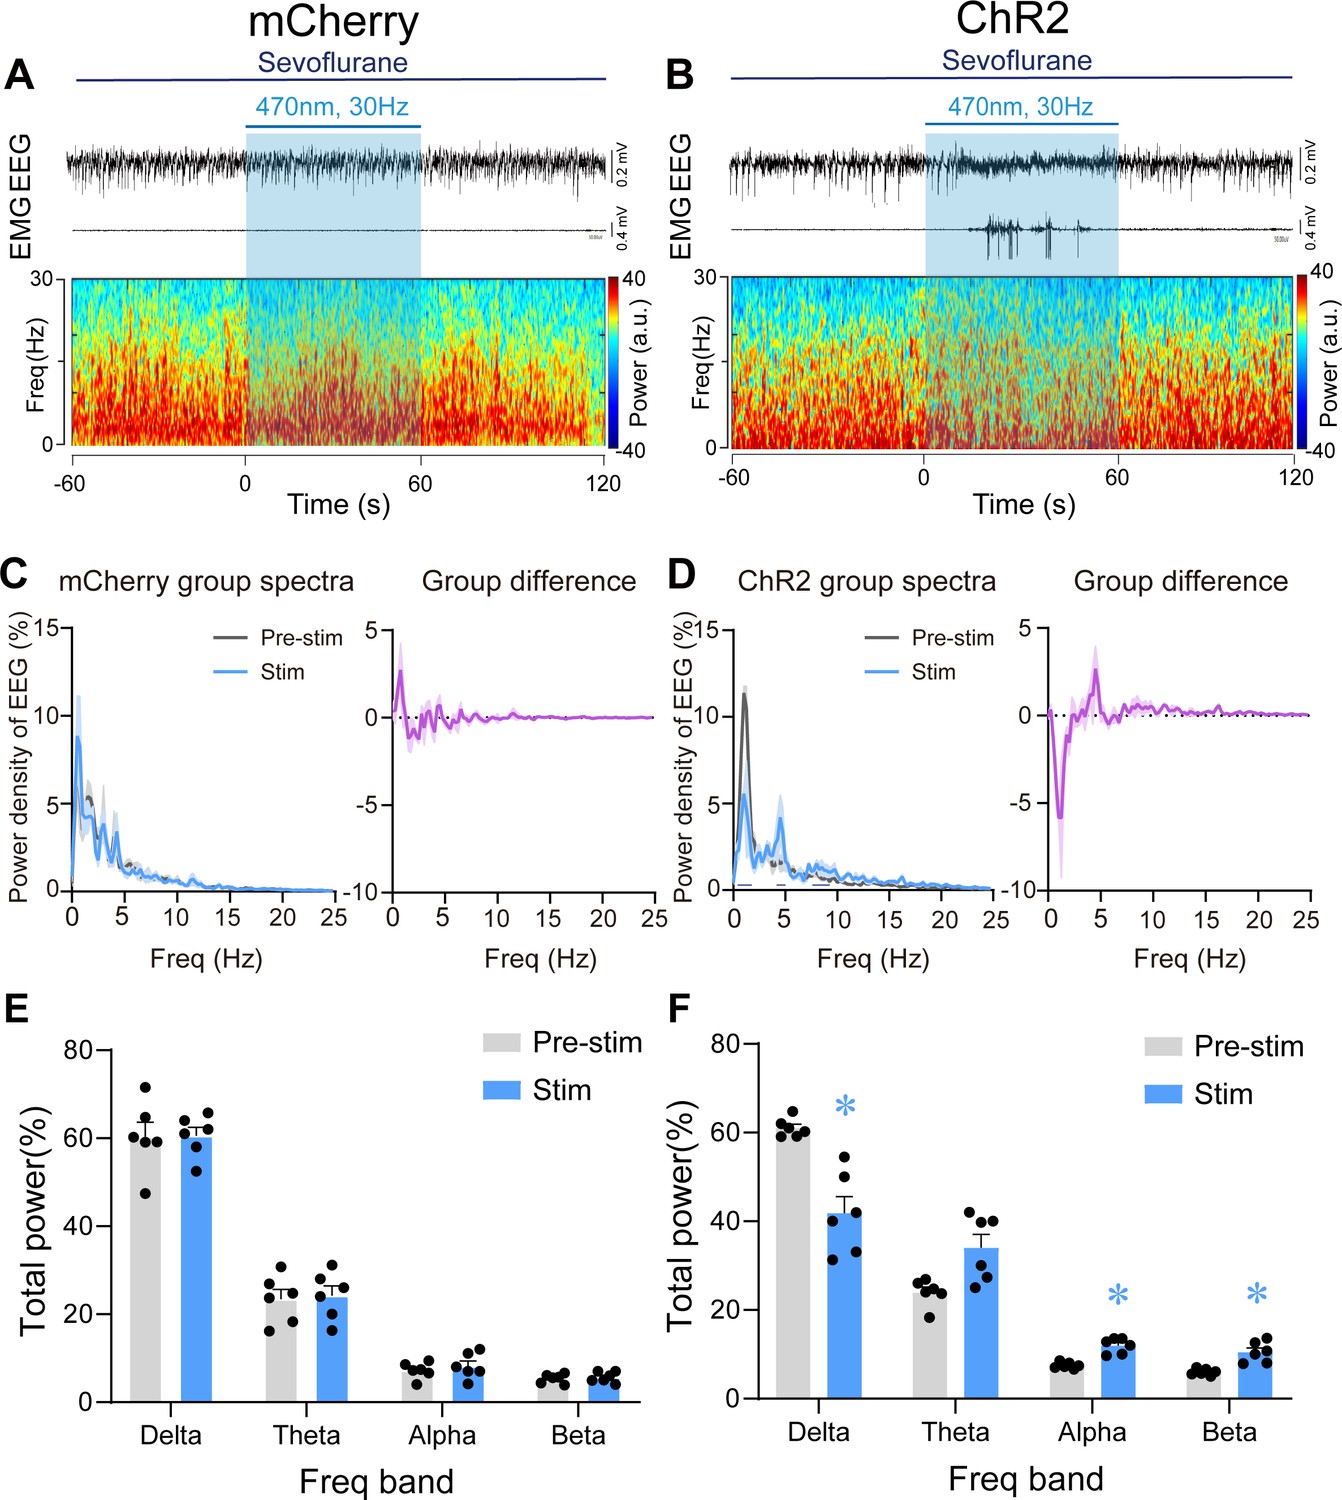
Optogenetic stimulation of PVHCRH neurons induced cortical activation and behavioral emergence during continuous steady-state sevoflurane general anesthesia.
Typical examples of electroencephalogram (EEG), electromyography (EMG), and EEG power spectral in a mouse injected with AAV-DIO-mCherry (A) or AAV-DIO-ChR2-mCherry (B) following acute photostimulation (30 Hz, 5 ms, 60 s) during continuous steady-state sevoflurane GA. Time 0 indicates the beginning of photostimulation. The blue shadow indicates the 60 s duration of blue light stimulation. Left: normalized group power spectral densities from PVHCRH-mCherry (C) or PVHCRH-ChR2 (D) mice with pre photostimulation (gray) and photostimulation (blue). Dark blue lines in D indicate the power band with significant difference. Right: differences between normalized group power spectral densities from PVHCRH-mCherry (C) or PVHCRH-ChR2 (D). Power percentage changes in cortical EEG before (gray) and during (blue) photostimulation at 30 Hz in PVHCRH-mCherry (E) or PVHCRH-ChR2 mice (F) during continuous steady-state sevoflurane GA (n = 6, two-way ANOVAs followed by Sidak’s test, *p < 0.05).
-
Figure 5—source data 1
Behavioral responses of CRH-Cre mice under sevoflurane steady-state general anesthesia during photostimulation.
- https://cdn.elifesciences.org/articles/90191/elife-90191-fig5-data1-v1.docx
-
Figure 5—source data 2
Original data for analysis displayed in Figure 5E-F.
- https://cdn.elifesciences.org/articles/90191/elife-90191-fig5-data2-v1.xlsx
Figure 6 with 1 supplement
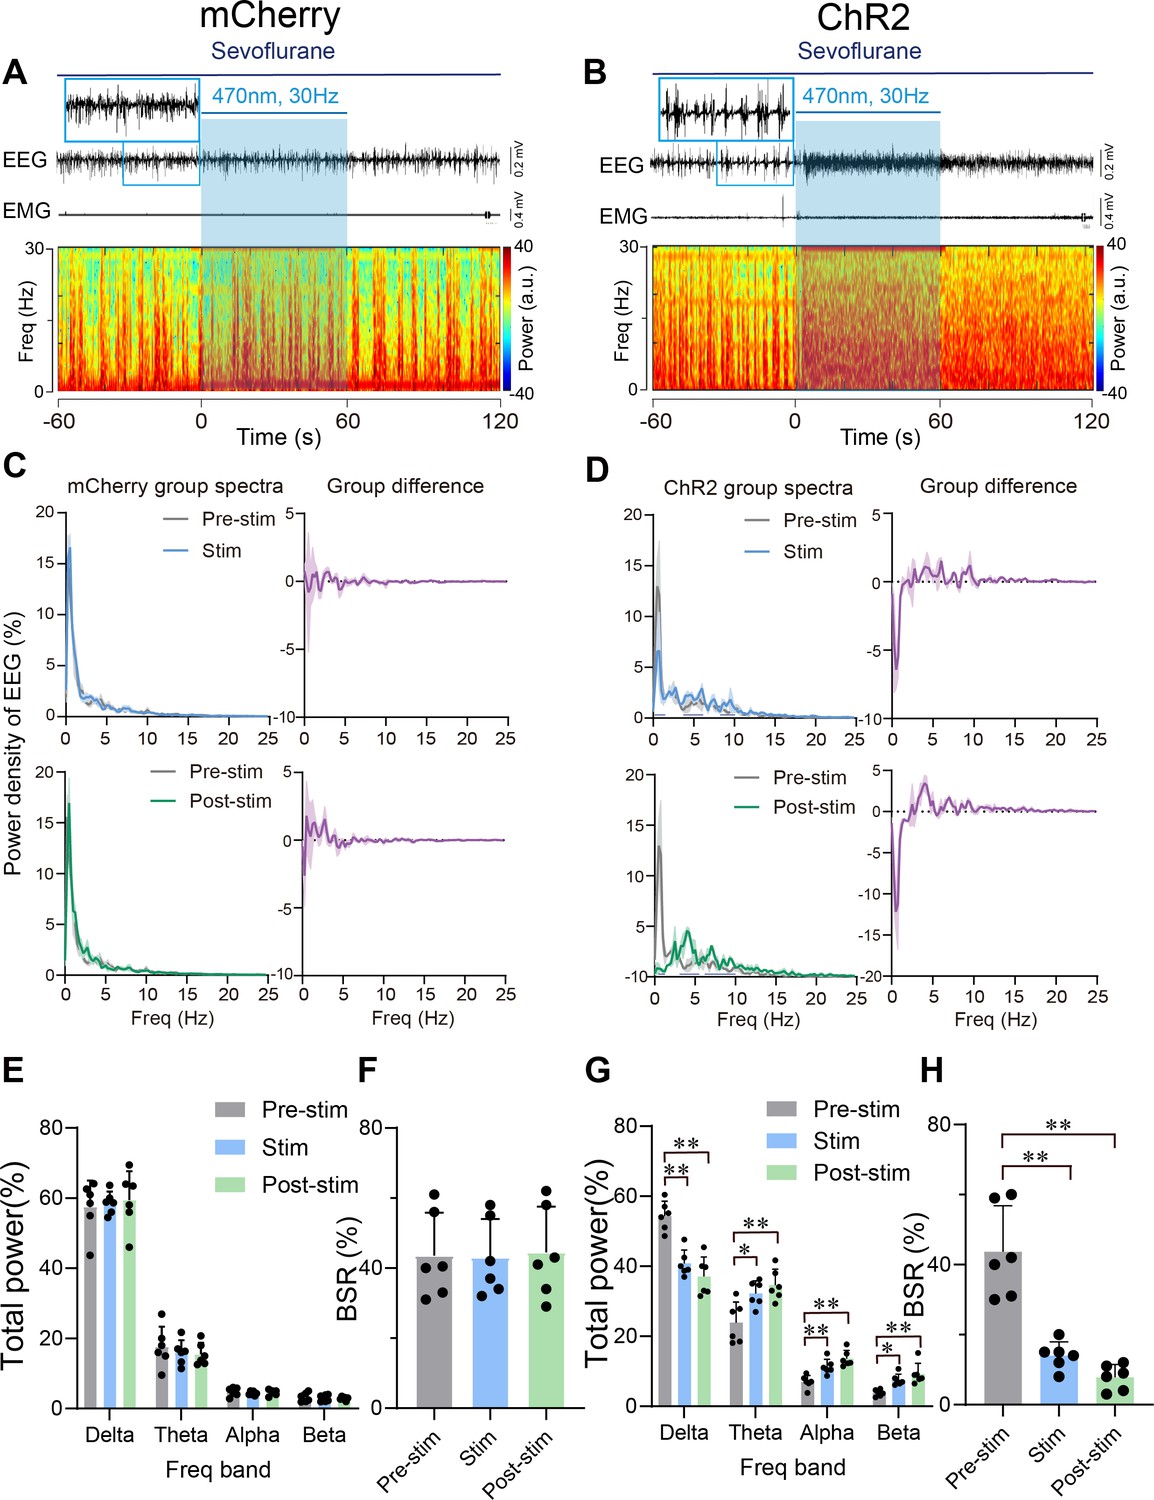
Optogenetic stimulation of PVHCRH neurons induced cortical activation during burst-suppression oscillations induced by deep sevoflurane general anesthesia.
Typical examples of electroencephalogram (EEG), electromyography (EMG), and EEG power spectral in a mouse injected with AAV-DIO-mCherry (A) or AAV-DIO-ChR2-mCherry (B) following acute photostimulation (30 Hz, 5 ms, 60 s) during burst-suppression oscillations. Time 0 indicates the beginning of photostimulation. The blue shadow indicates the 60 s duration of blue light stimulation. Top left: normalized group power spectral densities from PVHCRH-mCherry mice (C) and PVHCRH-ChR2 (D) with pre photostimulation (gray) and photostimulation (blue); top right: differences between normalized group power spectral densities from PVHCRH-mCherry mice (C) and PVHCRH-ChR2 mice (D). Bottom left: normalized group power spectral densities from PVHCRH-mCherry mice (C) and PVHCRH-ChR2 mice (D) with pre photostimulation (gray) and post photostimulation (green); bottom right: differences between normalized group power spectral densities from PVHCRH-mCherry mice (C) and PVHCRH-ChR2 mice (D). Dark blue lines in panel D indicate the power band with significant difference. Power percentage changes in cortical EEG before (gray), during (blue), and post (green) photostimulation in PVHCRH-mCherry (E) or PVHCRH-ChR2 (G) mice during burst-suppression oscillations. (F, H) BSR change before (gray), during (blue), and post (green) photostimulation in PVHCRH-mCherry (G) or PVHCRH-ChR2 (H) mice during burst-suppression oscillations (n = 6, two-way ANOVAs followed by Sidak’s test, *p < 0.05, **p < 0.01; Pre-stim vs. Stim, p < 0.01, df = 15, 95% CI = 17.36–41.97; Pre-stim vs. Post-stim, p < 0.01, df = 15, 95% CI = 23.53–48.14). Stim, stimulation; Freq, frequency.
-
Figure 6—source data 1
Original data for analysis displayed in Figure 6E-H.
- https://cdn.elifesciences.org/articles/90191/elife-90191-fig6-data1-v1.xlsx
Figure 6—figure supplement 1

Optogenetic stimulation of PVHCRH neurons induced cortical activation during burst-suppression oscillations induced by deep sevoflurane general anesthesia.
Typical examples of electroencephalogram (EEG), electromyography (EMG), and EEG power spectral in a mouse injected with AAV-DIO-mCherry (A) or AAV-DIO-ChR2-mCherry (B) following acute photostimulation (30 Hz, 5 ms, 60 s) during burst-suppression oscillations. Time 0 indicates the beginning of photostimulation. The blue shadow indicates first 20 s of the 60-s duration of blue light stimulation.
Figure 7 with 1 supplement
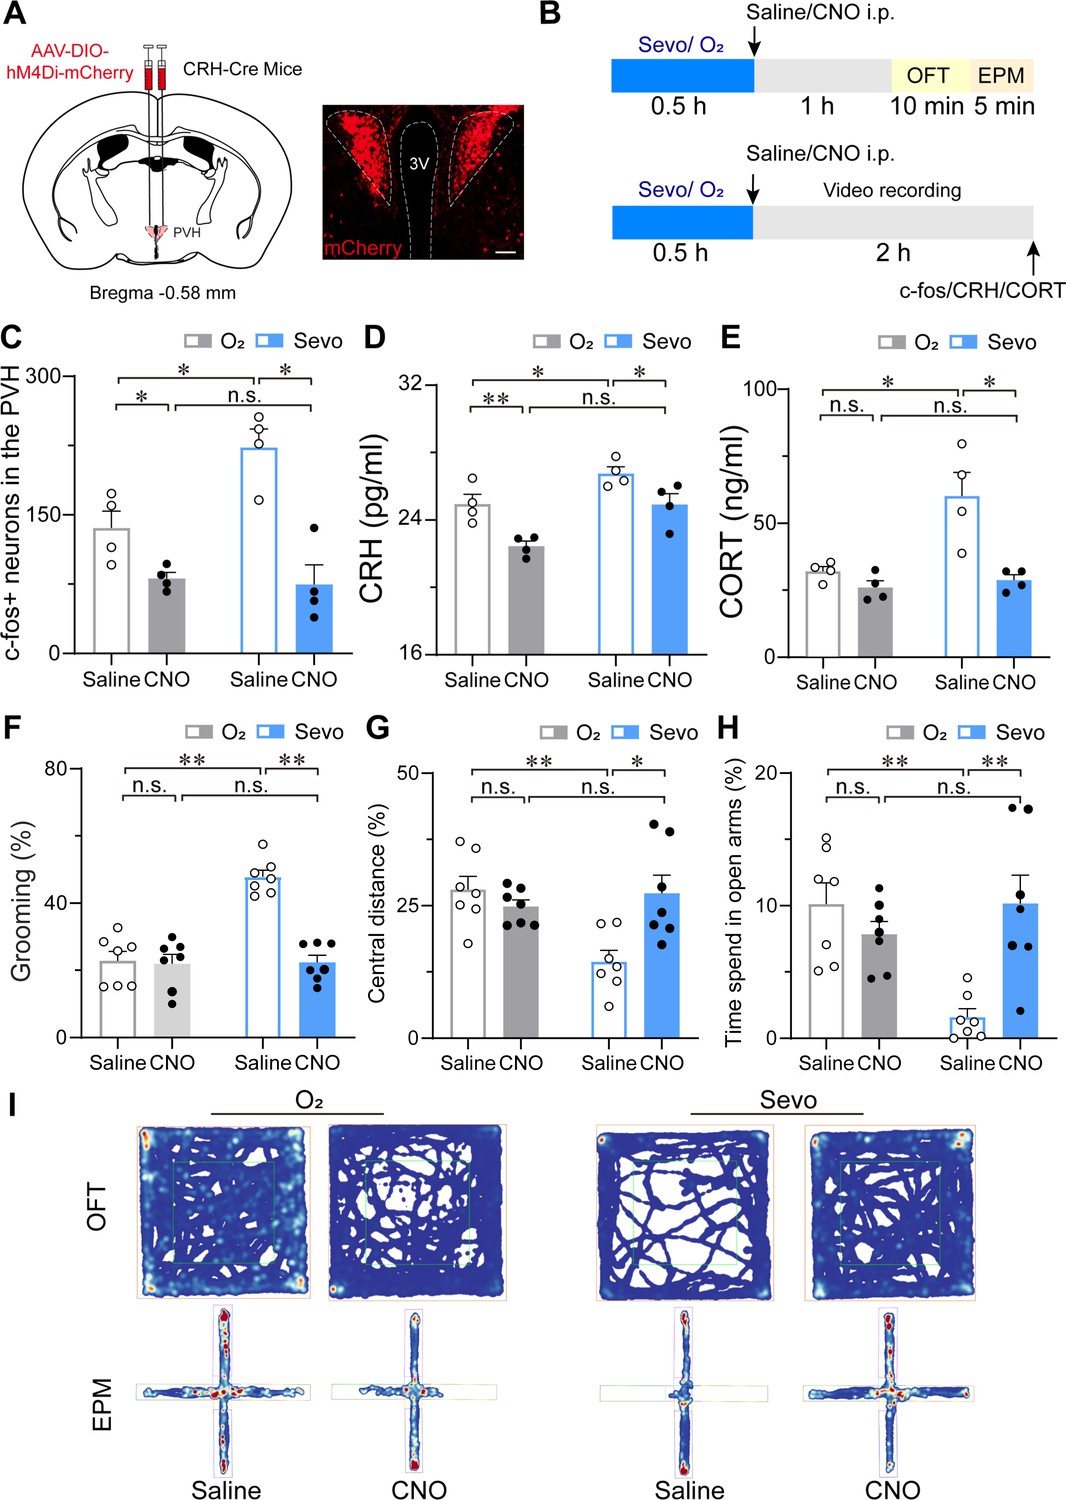
Chemogenetic inhibition of PVHCRH neurons alleviated the stress response after sevoflurane GA.
(A) Left: schematic of AAV-DIO-hM4Di-mCherry injected into the PVH of CRH-Cre mice. Right: representative image of mCherry immunofluorescence in the PVH. scale bar, 200 μm. (B) Experimental timeline of sacrificing mice for video recording, c-fos quantification, CRH, and CORT measurement or behavior testing (open field test [OFT] and elevated plus-maze [EPM]) after inhalation of sevoflurane or pure oxygen for 30 min. (C-H) Quantification of the number of c-fos-positive neurons in the PVH (C, n = 4, F(1, 12) = 14.62, saline: O2 vs. sevo, p = 0.0017, t = 3.523, df = 12, 95% CI = −164.6 to −9.424; clozapine-N-oxide (CNO): O2 vs. sevo, p = 0.7122, t = 0.2632, df = 12, 95% CI = −71.08 to 84.08), serum CRH (D, n = 4, F(1, 12) = 0.4513, saline: O2 vs. sevo, p = 0.0456, t = 2.604, df = 12, 95% CI = −3.585 to −0.03; CNO: O2 vs. sevo, p = 0.0077, t = 3.567, df = 12, 95% CI = −4.255 to −0.705) and CORT levels (E, n = 4, F(1, 12) = 5.691, saline: O2 vs. sevo, p = 0.0082, t = 3.608, df = 12, 95% CI = −42.27 to −7.799; CNO: saline: O2 vs. sevo, p = 0.9144, t = 0.3853, df = 12, 95% CI = −20.99 to 15.55), time percentage of self-grooming (F, n = 7, F(1, 24) = 24.61, saline: O2 vs. sevo, p < 0.001, t = 7.033, df = 24, 95% CI = −34.57 to −16.98; CNO: O2 vs. sevo, p = 0.9275, t = 0.3486, df = 24, 95% CI = −10.07 to 7.518), percentage of moving distances in the central areas of OFT (G, n = 7, F(1, 24) = 6.953, saline: O2 vs. sevo, p = 0.0018, t = 3.738, df = 24, 95% CI = 4.906 to 21.86; CNO: O2 vs. sevo, p > 0.9999, t = 0.007, df = 24, 95% CI = −8.799 to 8.747) and time percentage of staying in the open arms of the EPM (H, n = 7, F(1, 24) = 12.70, saline: O2 vs. sevo, p = 0.0017, t = 3.885, df = 24, 95% CI = 3.198 to 13.62; CNO: O2 vs. sevo, p = 0.3783, t = 1.289, df = 24, 95% CI = −8.972 to 2.717) following the protocol in (B). Statistical comparisons were conducted using two-way ANOVA followed by Sidak’s tests. *p < 0.05, **p < 0.01, n.s., no significant differences. (I) Representative heatmaps of OFT and EPM after inhalation of sevoflurane or pure oxygen and administration of saline or CNO.
-
Figure 7—source data 1
Original data for analysis displayed in Figure 7C-H.
- https://cdn.elifesciences.org/articles/90191/elife-90191-fig7-data1-v1.xlsx
Figure 7—figure supplement 1
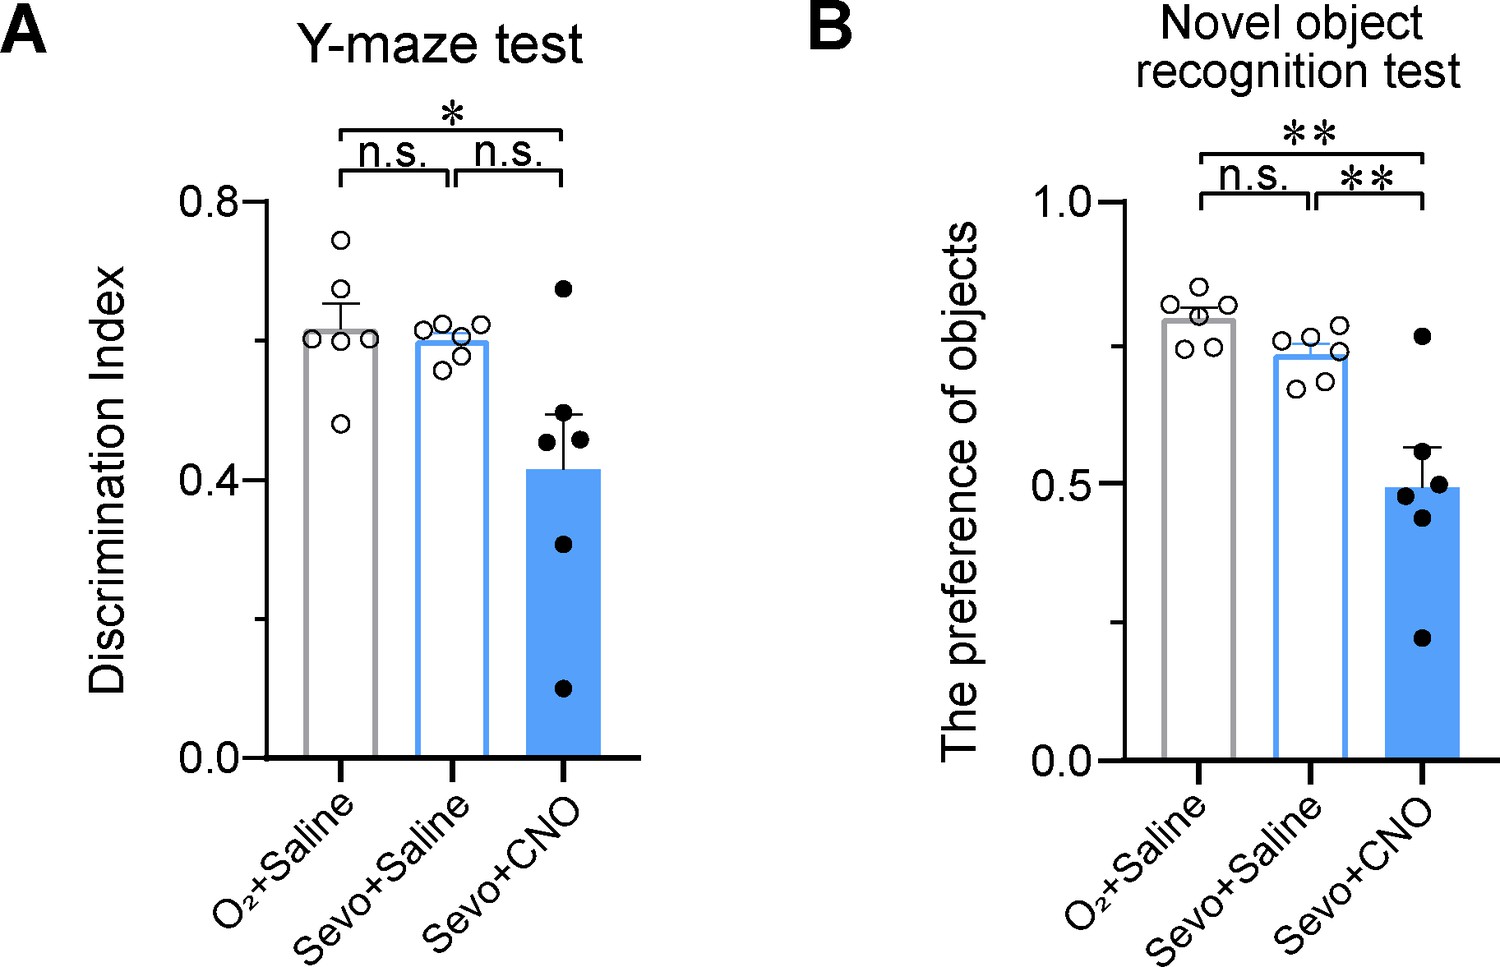
PVHCRH neurons involved in modulating sevoflurane-induced short-term memory impairment.
Y-maze (A) and novel object recognition (B) tests after inhalation of sevoflurane or pure oxygen and administration of saline or clozapine-N-oxide (CNO) (A, n = 6, saline: O2 vs. sevo, p = 0.9700, t = 0.4477, df = 15, 95% CI = −0.1691 to 0.2028; O2 (Saline) vs. sevo (CNO), p = 0.0324, t = 2.325, df = 15, 95% CI = 0.01628 to 0.3882; sevo: saline vs. CNO, p = 0.0507, t = 2.318, df = 15, 95% CI = −0.0005627 to 0.3714; F(2, 15) = 4.914, p = 0.0228) (B, n = 6, saline: O2 vs. sevo, p = 0.5653, t = 2.462, df = 15, 95% CI = −0.09701 to 0.2262; O2 (Saline) vs. sevo (CNO), p = 0.0006, t = 4.105, df = 15, 95% CI = 0.1416 to 0.4648; sevo: saline vs. CNO, p = 0.0043, t = 3.227, df = 15, 95% CI = − 0.07702 to 0.4002; F(2, 15) = 13.18, p = 0.0005). Statistical comparisons were conducted using one-way ANOVA followed by Sidak’s tests. *p < 0.05, **p < 0.01, n.s., no significant differences.
-
Figure 7—figure supplement 1—source data 1
Original data for analysis displayed in Figure 7—figure supplement 1.
- https://cdn.elifesciences.org/articles/90191/elife-90191-fig7-figsupp1-data1-v1.xlsx
Tables
Key resources table
| Reagent type (species) or resource | Designation | Source or reference | Identifiers | Additional information |
|---|---|---|---|---|
| Biological sample (Mus musculus) | CRH-Cre mice | South China Agricultural University/the Shanghai Model Organisms Center | Crh < Cre > B6(Cg)-Crhtm1(cre)Zjh/J | JAX #012704 |
| Biological sample (Mus musculus) | C57BL/6 mice | The Experimental Animal Management Department, Institute of Family Planning Science, Shanghai | C57BL/6J | JAX #000664 |
| Biological sample (Mus musculus) | CD-1 mice | The Experimental Animal Management Department, Institute of Family Planning Science, Shanghai | Crl:CD1(ICR) | |
| Antibody | Rabbit polyclonal anti-c-fos antibody | Abcam, USA | ab190289 | IF (1:8000) |
| Antibody | Donkey polyclonal anti-rabbit Alexa488 secondary antibody | Abcam, USA | ab150073 | IF (1:1000) |
| Antibody | Rabbit monoclonal anti-CRF antibody | Abcam, USA | ab272391 | IF (1:800) |
| Recombinant DNA reagent | AAV-EF1α-DIO-hM3D(Gq)-mCherry-WPRE | Brain VTA, China | Cat#.PT-0988 | 3.3 × 10¹² vector genomes (VG)/ml |
| Recombinant DNA reagent | AAV-EF1α-DIO-mCherry-WPRE-hGH pA | Brain VTA | Cat#.PT-0013 | 5.35 × 10¹² VG/ml |
| Recombinant DNA reagent | AAV2/9-hEF1α-DIO-hM4D(Gi)-mCherry-pA | Taitool Bioscience, China | S1060−1x2 | 3.3 × 10¹² VG/ml |
| Recombinant DNA reagent | AAV2/9-hSyn-DIO-jGCaMP7b-WPRE-pA | Taitool Bioscience, China | S0607-9 | 1.61 × 10¹³ VG/ml |
| Recombinant DNA reagent | AAV2/9-hEF1a-DIO-hChR2-mCherry-pA | Taitool Bioscience, China | S0199-9 | 1.61 × 10¹³ VG/ml |
| Recombinant DNA reagent | AAV2/9-hEF1a-DIO-mCherry-pA | Taitool Bioscience, China | S0506-9 | 1.61 × 10¹³ VG/ml |
| Recombinant DNA reagent | AAV-CAG-FLEX-taCasp3-TEVp | Brain VTA | PT-0206 | 5.88 × 10¹² VG/ml |
| Commercial assay or kit | Enzyme-linked immunosorbent assay (ELISA) kits | CUSABIO Technology, China | CSB-E14068m and CSB-E07969m | |
| Chemical compound, drug | Pentobarbital sodium | Protein Biotechnology Co., Ltd | CAS-57-33-0 | 45 mg/kg |
| Chemical compound, drug | Sevoflurane | Lunan BETTER Pharmaceutical Co., Ltd | H20233956 | 1.2%, 1.6%, or 2.0% |
| Chemical compound, drug | Clozapine-N-oxide | LKT, USA | C4759 | 3 mg/kg |
| Chemical compound, drug | Colchicine | MedChemExpress | CAS-64-86-8 | 20 μg in 500 nl saline |
| Software, algorithm | Spike2 | Cambridge, UK | Spike2 1.0 | CED |
| Software, algorithm | SleepSign | Kissei omtec, Japan | SleepSign 3.0 | |
| Software, algorithm | Power meter | Coherent, USA | PM 10 | |
| Software, algorithm | Automatic video tracking system | Shanghai Vanbi Intelligent Technology Co., Ltd | Tracking Master V3.0 | |
| Software, algorithm | GraphPad Prism | GraphPad Software, USA | GraphPad Prism 8.0 | |
| Sequence-based reagent | Crh-common | Beijing Tsingke Biotech Co., Ltd | PCR primers | CTT ACA CAT TTC GTC CTA GCC |
| Sequence-based reagent | Crh-wt | Beijing Tsingke Biotech Co., Ltd | PCR primers | CAC GAC CAG GCT GCG GCT AAC |
| sequence-based reagent | Crh-mutant | Beijing Tsingke Biotech Co., Ltd | PCR primers | CAA TGT ATC TTA TCA TGT CTG GAT CC |
Additional files
Download links
A two-part list of links to download the article, or parts of the article, in various formats.
Downloads (link to download the article as PDF)
Open citations (links to open the citations from this article in various online reference manager services)
Cite this article (links to download the citations from this article in formats compatible with various reference manager tools)
Hypothalamic corticotropin-releasing hormone neurons modulate sevoflurane anesthesia and the post-anesthesia stress responses
eLife 12:RP90191.
https://doi.org/10.7554/eLife.90191.4


