Auditory cortex anatomy reflects multilingual phonological experience
- Brain and Language Lab, Vienna Cognitive Science Hub, University of Vienna, Austria
- Department of Behavioral and Cognitive Biology, Faculty of Life Sciences, University of Vienna, Austria
- Department of Diagnostic Imaging, St Jude Children's Research Hospital, United States
- Brain and Language Lab, Department of Psychology, Faculty of Psychology and Educational Sciences, University of Geneva, Switzerland
- Department of Basic Neuroscience, University of Geneva, Switzerland
- Zurich Linguistics Centre, University of Zurich, Switzerland
- Aix Marseille University, CNRS, CRPN, France
- Experimental Psychology, University College London, United Kingdom
- Wellcome Trust Centre for Neuroimaging, University College London, United Kingdom
Figures
Figure 1
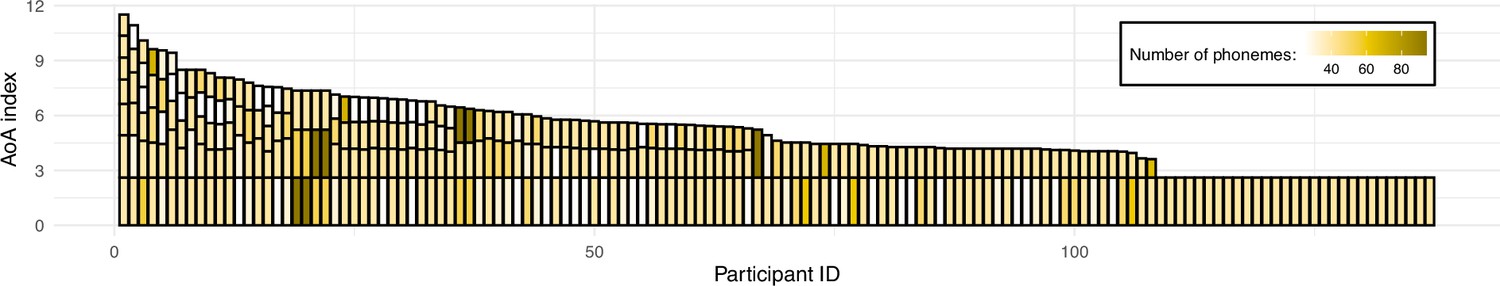
Illustration of the sample’s language experience.
Each bar represents a single participant’s overall language experience; the height of the stacked bars within each bar represents the age of onset(s) of acquisition (AoA) index for individual languages (the taller the bar, the earlier in life a given language was acquired). The color of each stacked bar refers to the number of phonemes in each language’s phonological inventory. For reference, English phonological inventory has 40 phonemes. Prior to plotting, data was sorted by the overall language experience based on a sum of AoA index for participants' individual languages; consequently, data of participants with most diverse language experience can be found on the left-hand side of the figure, and the right-hand side includes data from monolinguals (i.e. knowing only one language).
Figure 2
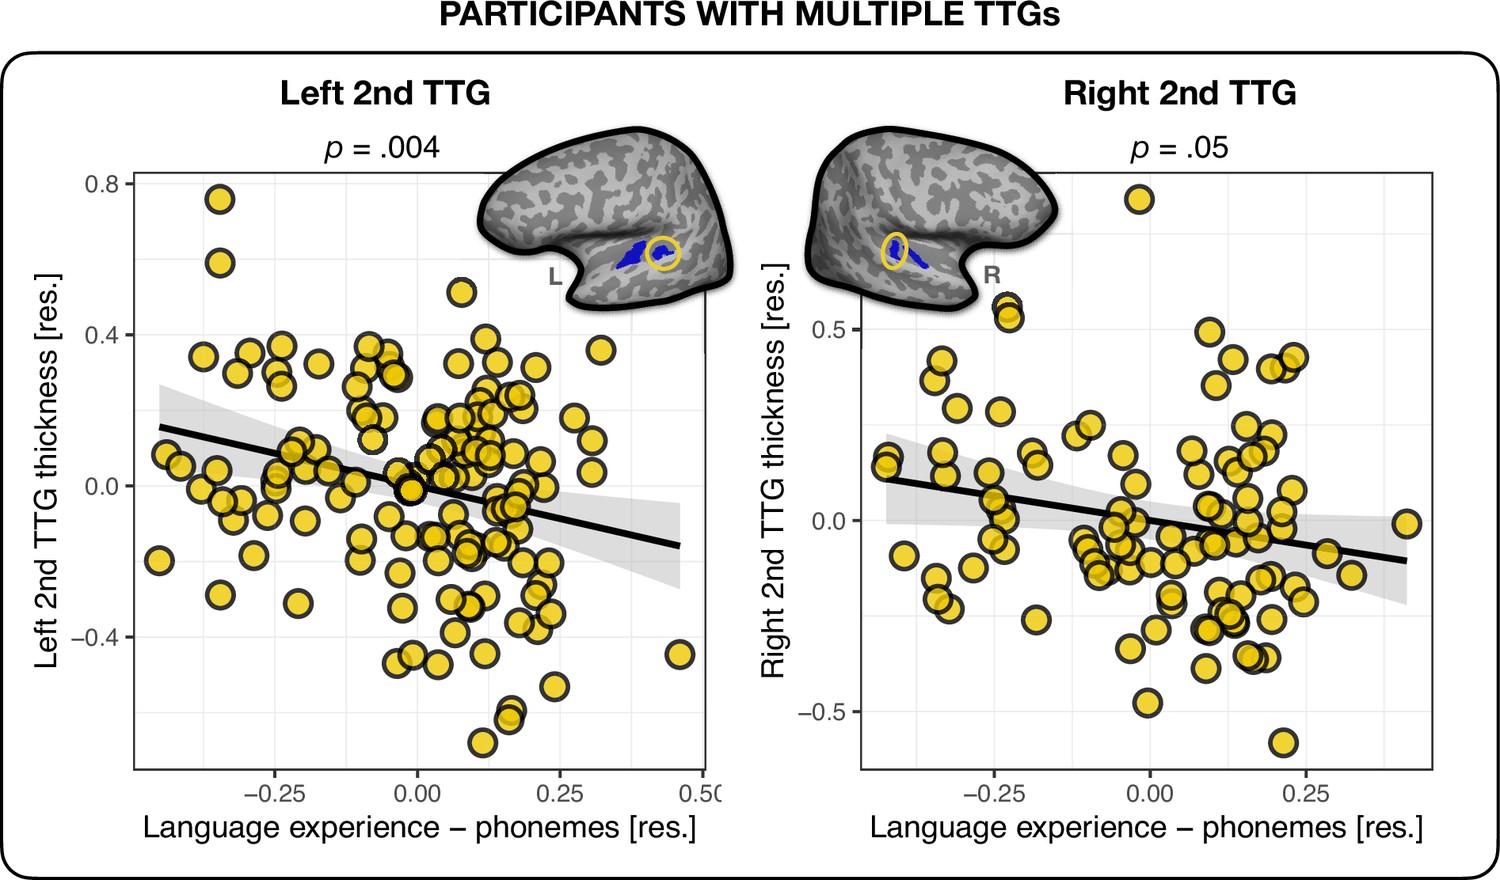
Multilingual language experience and thickness of the second transverse temporal gyrus (TTG).
Average thickness of the second TTG in the left (n = 130) and right (n = 96) hemisphere were negatively related to the multilingual language experience index weighted by their phoneme-level phonological distances. Plots show residuals, controlling for age, sex, and mean hemispheric thickness (β = – 0.35, t = – 2.96, p=0.004 and β = –0.26, t = – 1.98, p=0.05 for left and right hemisphere, respectively).
Figure 3
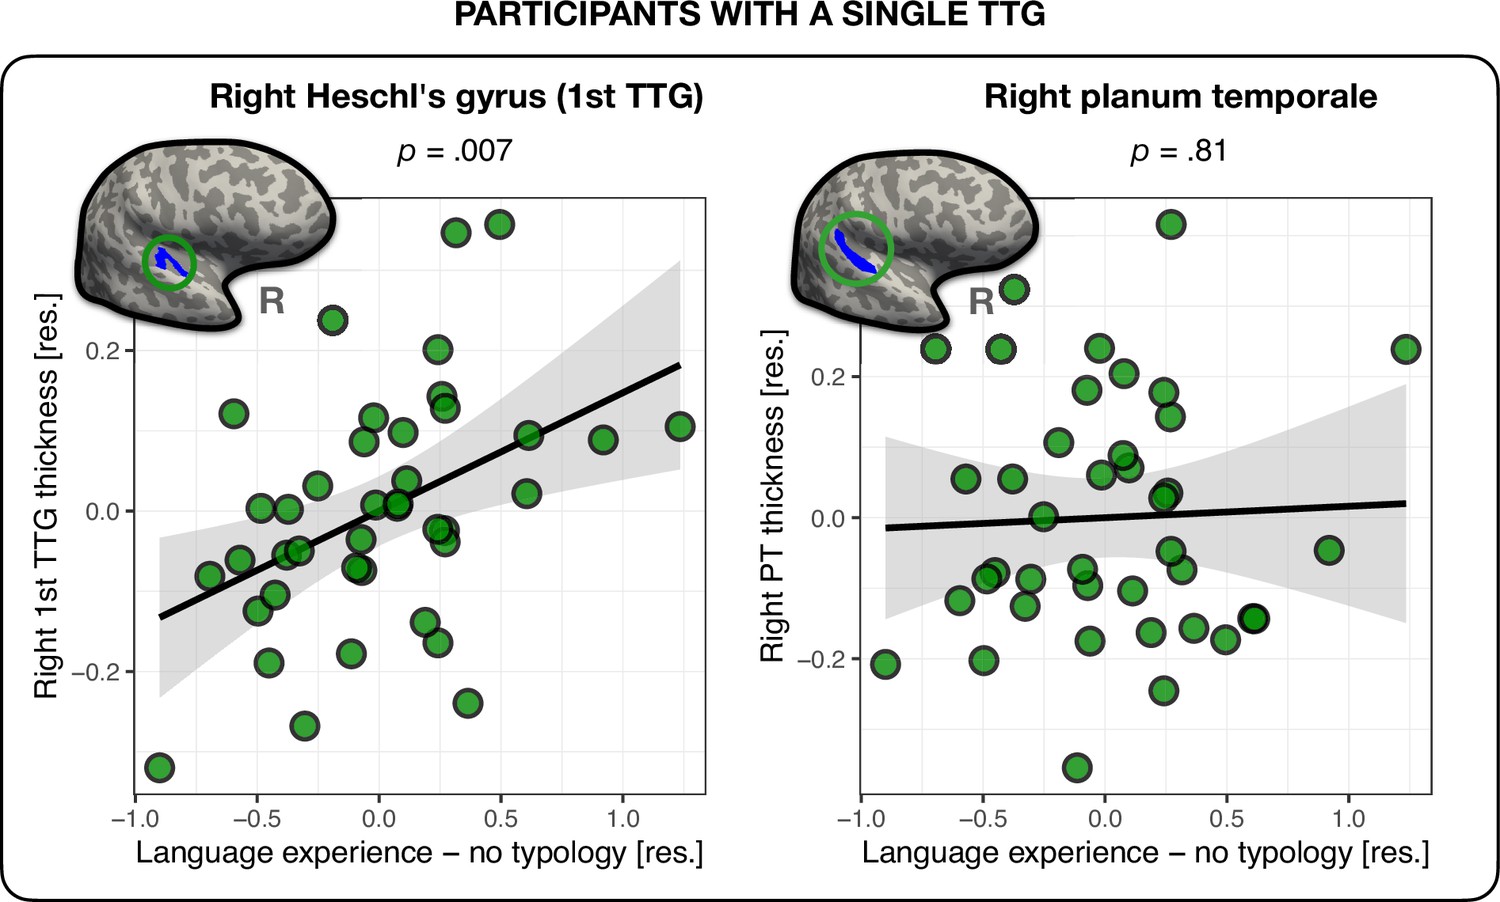
Thickness of the right first transverse temporal gyrus (TTG) and planum temporale (PT) in participants with a single TTG in the right hemisphere (n = 40).
Average thickness of Heschl’s gyrus (HG) in the right hemisphere was positively related to the amount of multilingual experience, irrespective of typological relations between languages (β = 0.15, t = 2.89, p=0.007) (left panel). The average thickness of the right PT was not related to language experience (β = 0.02, t = 2.43, p=0.81) (right panel). Plots show residuals, controlling for age, sex, and mean hemispheric thickness.
Figure 4
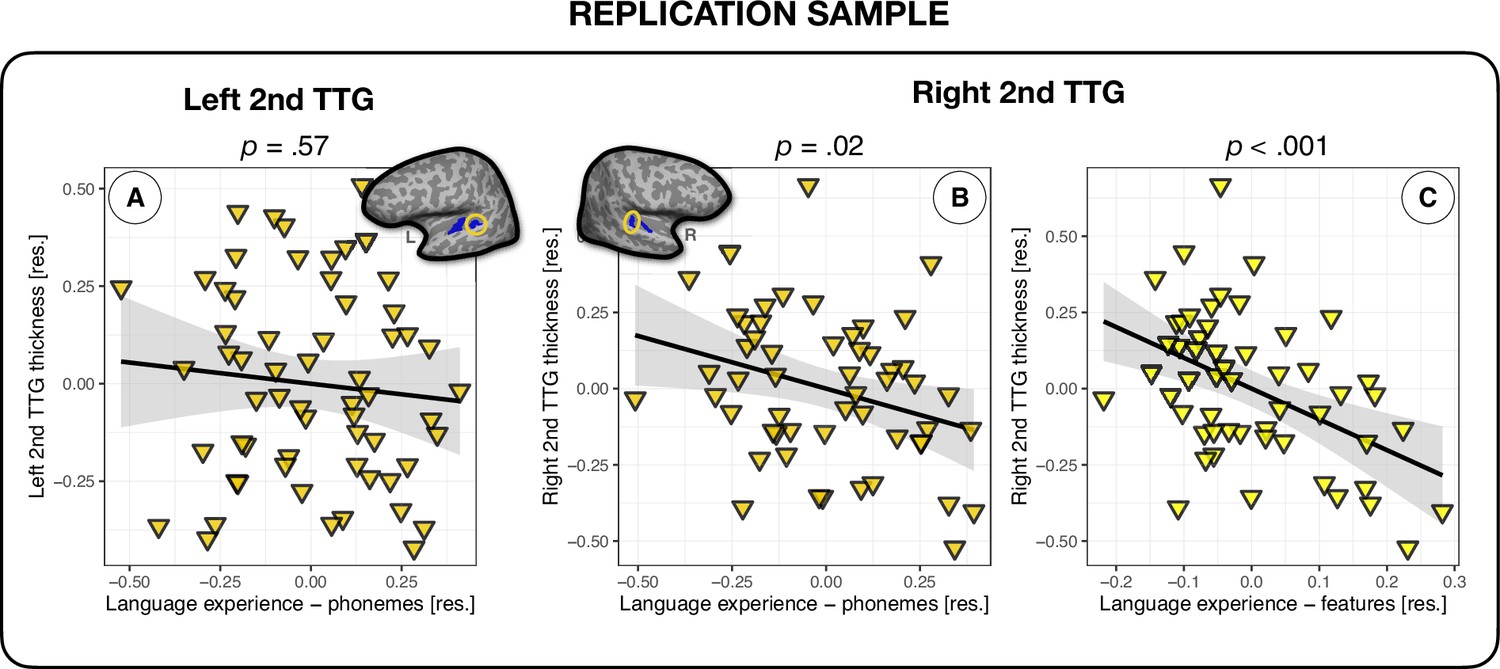
Multilingual language experience and thickness of the second transverse temporal gyrus (TTG) in an independent sample of participants.
(A) Average thickness of the left second TTG (n = 61) was not significantly related to the language experience index (β = – 0.09, t = – 0.58, p=0.57); average thickness of the right second TTG (n = 54) was significantly related to the language experience indices accounting for phoneme-level phonological overlaps between multilinguals' languages (β = – 0.38, t = – 2.48, p=0.02) (B) and feature-level information (β = – 1.02, t = – 3.77, p=0.0005) (C). The model including phonological feature-level information presented in panel (C) had the best fit to the average thickness data of the right second TTG.
Appendix 1—figure 1
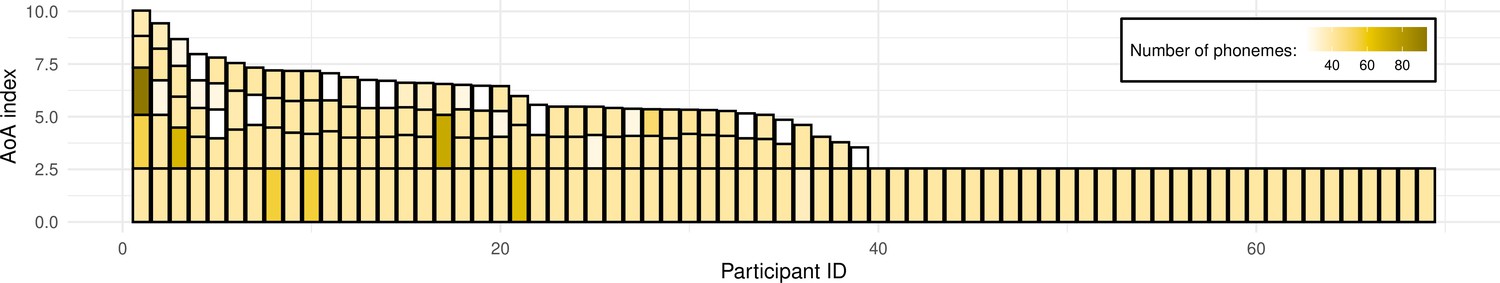
Illustration of the replication sample’s language experience.
As in Figure 1, each bar here represents a single participant’s overall language experience; the height of the stacked bars within each bar represents the age of onset(s) of acquisition (AoA) index for individual languages (the taller the bar, the earlier in life a given language was acquired). The color of each stacked bar refers to the number of phonemes in each language’s phonological inventory.
Appendix 1—figure 2
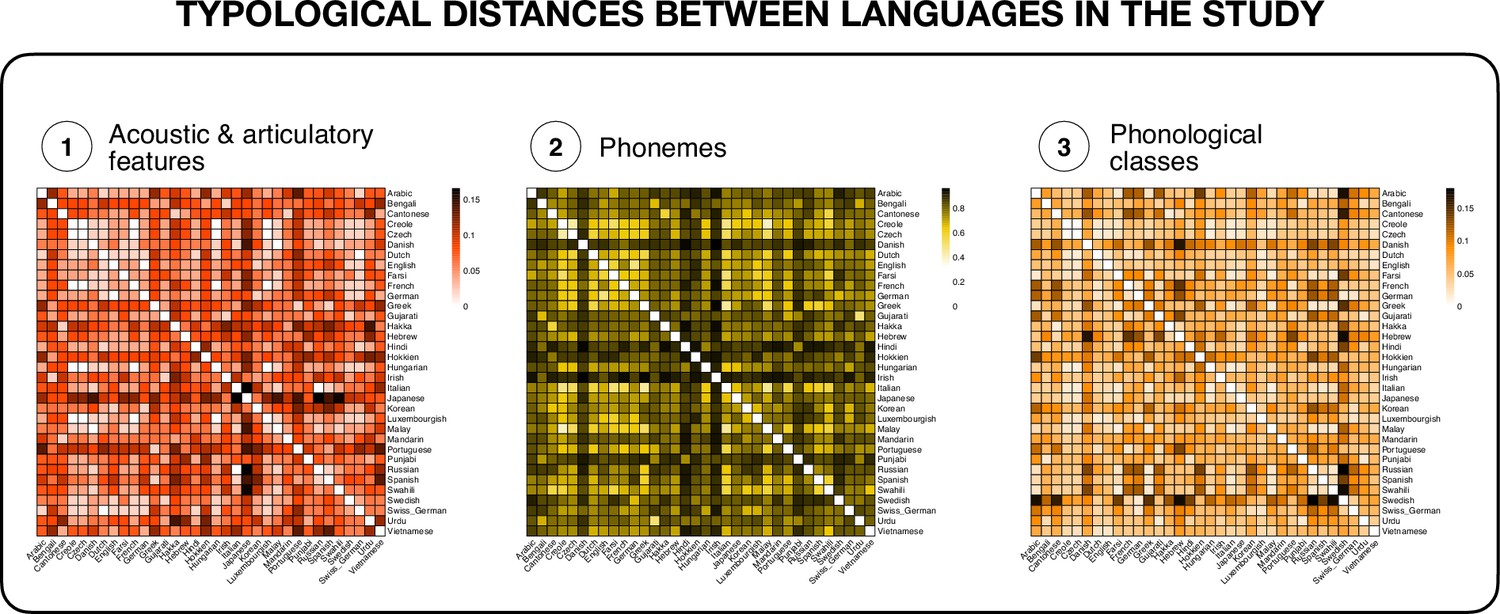
Similarity matrices of typological distances between all languages represented in the study (N = 36) based on: (1) distances in distinctive acoustic and articulatory features describing the phonemes of each language (e.g. ‘short’, ‘long’); (2) distances in sets of phonemes belonging to each language; and (3) distances based on counts of phonological classes that share certain features (e.g. ‘consonants’, ‘front rounded vowels’, ‘clicks’).
Data for individual languages were collected from the PHOIBLE database (Stanford Phonology Archive, 2019a) and open-source software (Dediu and Moisik, 2016). The figure was generated in R, with the package pheatmap (Kolde, 2019), version 1.0.12.
Appendix 1—figure 3
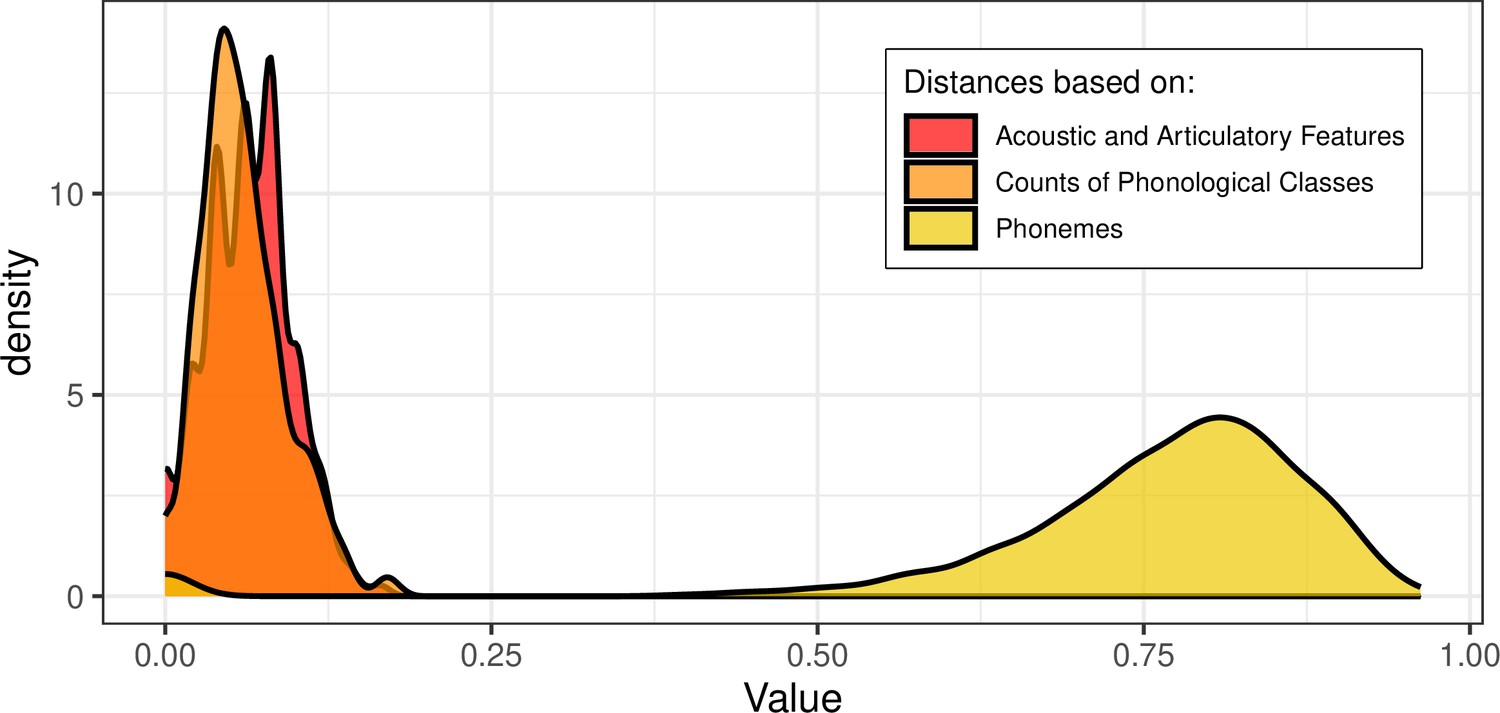
Distributions of the three distance measures used in the study based on: (1) distances in distinctive acoustic and articulatory features describing the phonemes of each language (in red); (2) distances in sets of phonemes belonging to each language (in yellow); and (3) distances based on counts of phonological classes (in orange).
Appendix 1—figure 4

Auditory regions of interest (ROIs) used in the analysis.
The ROIs are overlaid on an inflated surface in the native space of one of the participants.
Appendix 1—figure 5

Results of a whole-brain vertex-wise analysis, aimed at establishing relations between the language experience index and whole-brain cortical thickness.
Overlaid on the inflated surface of the fsaverage template brain is the thresholded at p<0.0001 (uncorrected) significance map from the conducted F-test showing a negative relationship between cortical thickness in the highlighted region and the degree of multilingual language experience.
Appendix 1—figure 6
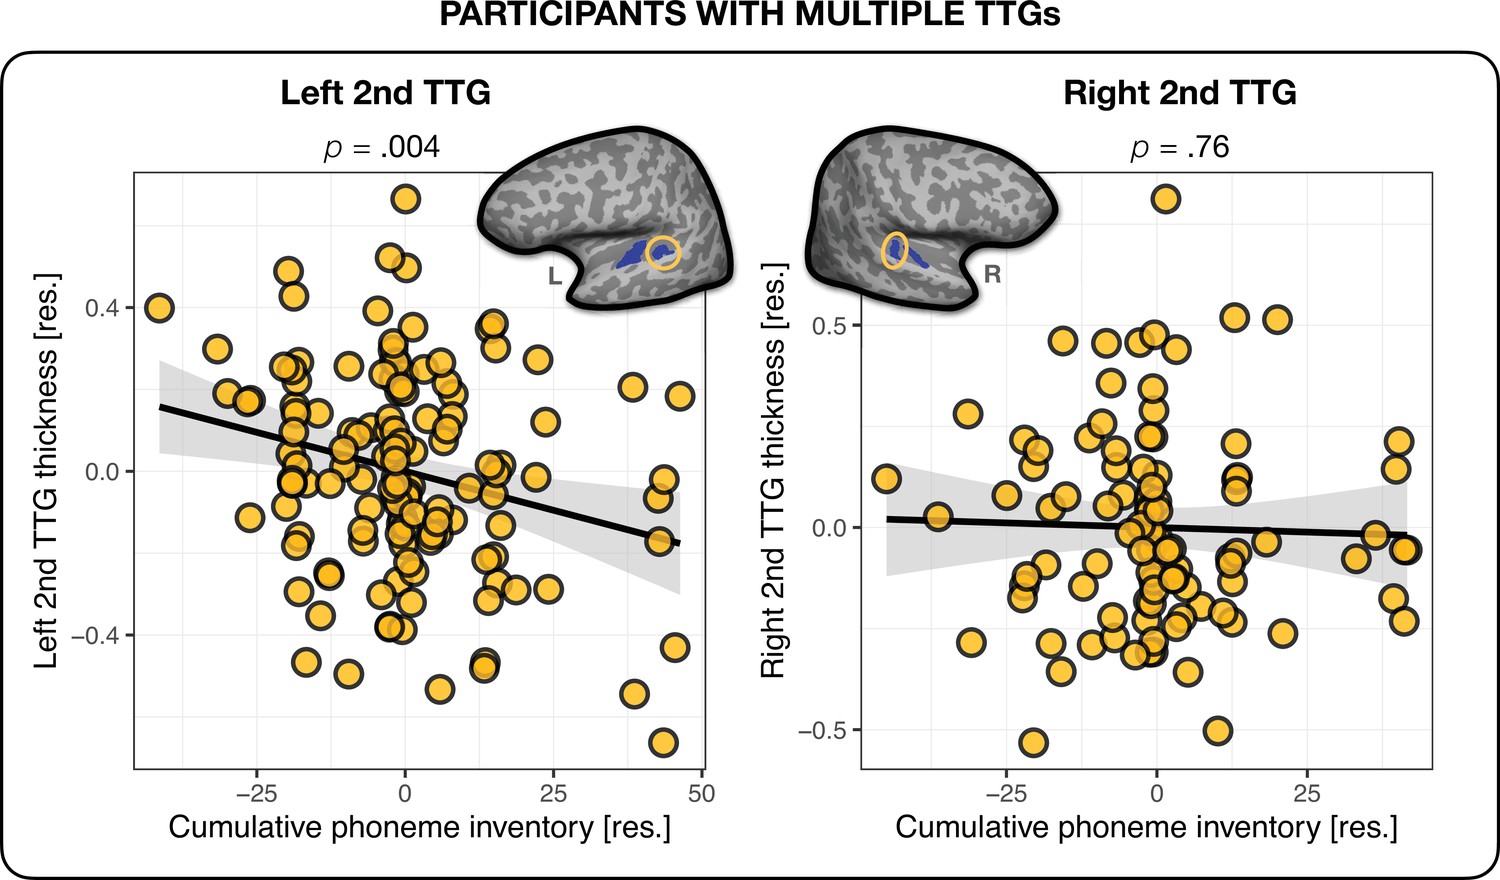
Cumulative phoneme inventory and thickness of the second transverse temporal gyrus (TTG).
Average thickness of the second TTG in the left and right hemisphere in relation to the number of unique phonemes each participant was exposed to across all their languages (the plotted values are residuals controlled for age, sex, mean hemispheric thickness, and the language experience index irrespective of typology).
Appendix 1—figure 7
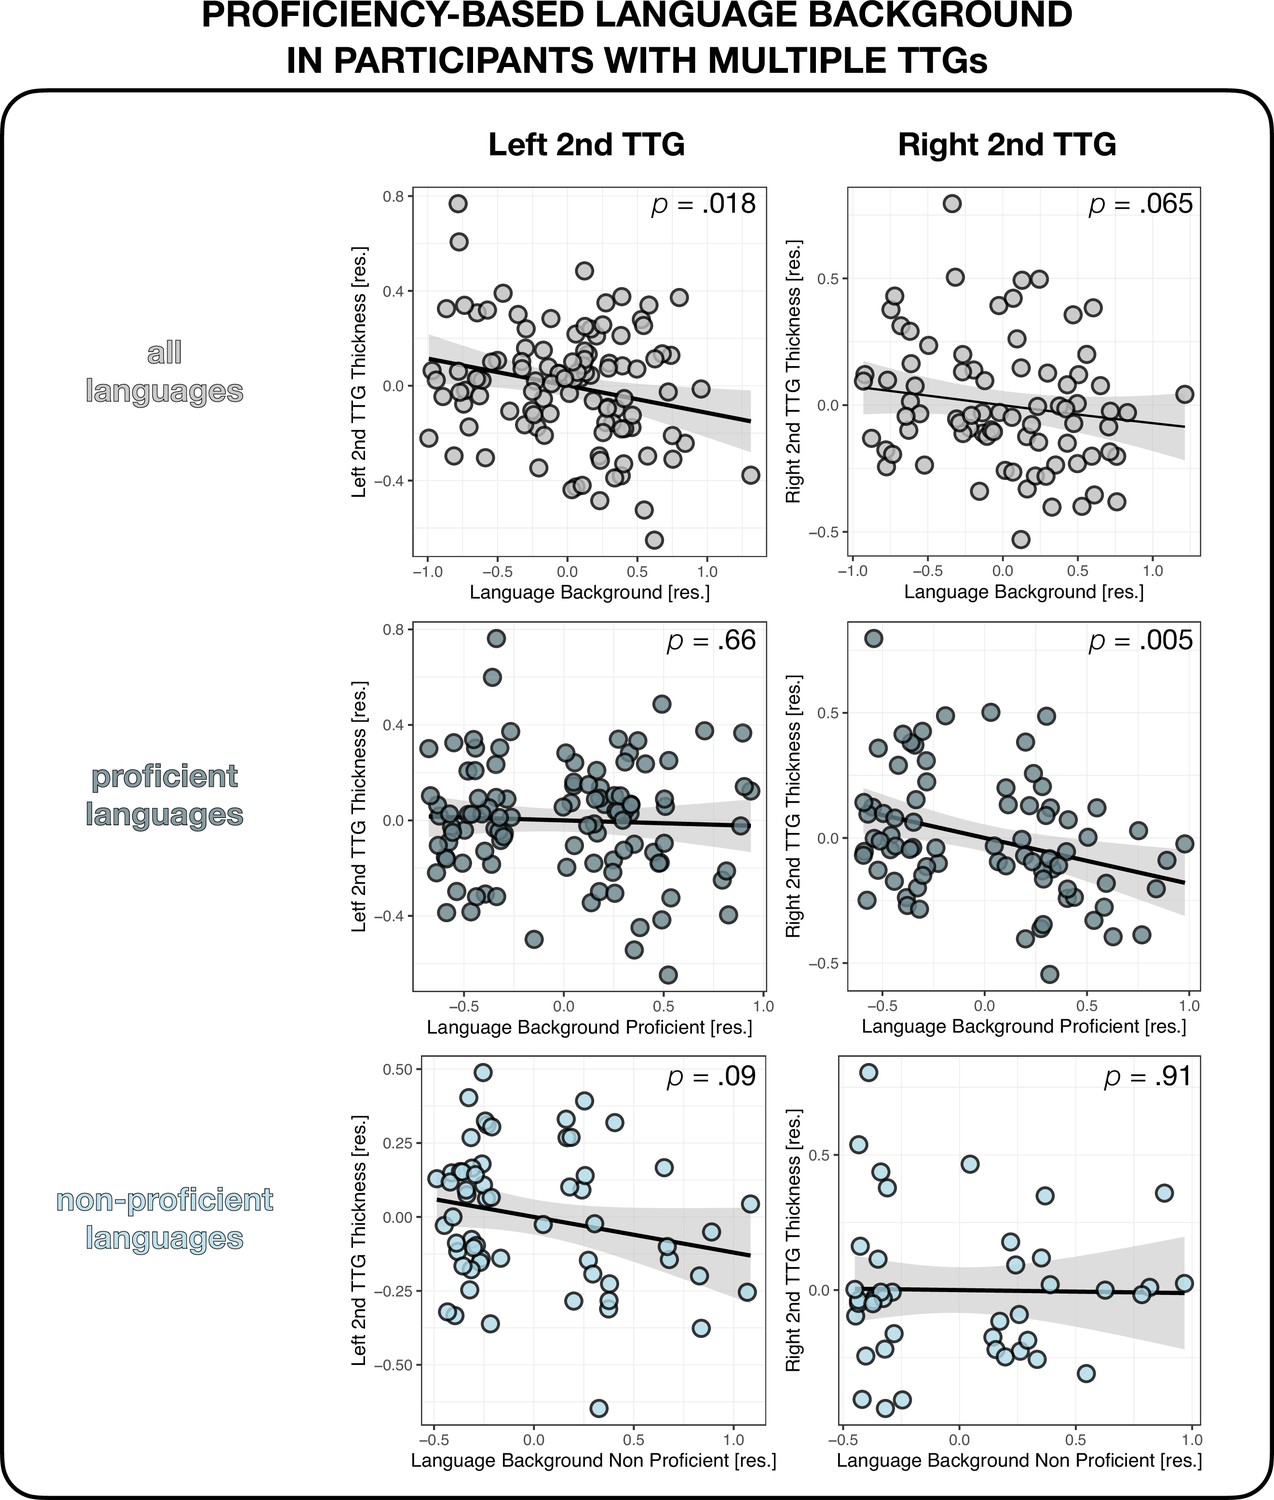
Multilingual proficiency and thickness of the second transverse temporal gyrus (TTG).
Average thickness of the second TTG in the left and right hemisphere as a function of language proficiency in all languages of each participant (top panel), only their proficient languages (middle panel), and only their non-proficient languages (bottom panel). Plots show residuals, controlling for age, sex, and mean hemispheric thickness.
Author response image 1

Tables
Table 1
Breakdown of participants by number of languages they spoke.
| Main sample | |||||||
|---|---|---|---|---|---|---|---|
| Number of languages | 1 | 2 | 3 | 4 | 5 | 6 | 7 |
| Number of participants | 29 | 40 | 36 | 18 | 10 | 2 | 1 |
| Replication sample | |||||||
| Number of languages | 1 | 2 | 3 | 4 | 5 | 6 | 7 |
| Number of participants | 30 | 4 | 16 | 14 | 5 | 0 | 0 |
Table 2
Pearson correlations between the three phonological distance measures.
| Features distances | Phoneme distances | Phonological classes distances | |
|---|---|---|---|
| Features distances | 1 | ||
| Phoneme distances | 0.42 | 1 | |
| Phonological classes distances | 0.24 | 0.51 | 1 |
Table 3
Overview of the performed analyses.
| Analysis | Regions(s) | Measures(s) | Motivation | Results |
|---|---|---|---|---|
| Language experience and auditory regions (section ‘Auditory cortex and language experience’) | Auditory regions segmented by FreeSurfer (anterior STG, posterior STG, anterior STS, posterior STS, HG, HS, PT, and PP) | Cortical volume, surface area, and thickness | Exploratory first step | Relationship between the average thickness of the PT (bilaterally) and language experience (p=0.01) |
| Language experience and TTG (section ‘Superior temporal plane and language experience’) | Transverse temporal gyri segmented by TASH | Cortical volume, surface area, and thickness and number of gyri | To elucidate above exploratory results | Relationship between the average thickness of the second TTG (bilaterally) and language experience (p=0.01) |
| Vertex-wise analysis (section ‘Superior temporal plane and language experience’) | Whole-brain | Cortical thickness | To confirm above exploratory results | Cluster of vertices negatively related to participants’ language experience at p<0.0001 (uncorrected), located in the superior aspect of the left STG, corresponding to the location of the second TTG |
| Effects of language proficiency (section ‘Superior temporal plane and language experience’) | Second TTG | Cortical thickness | To confirm the results obtained from AoA-based language experience index | Relationship between the average thickness of the second TTG (bilaterally) is confirmed using a different metric to calculate language experience (p=0.018 for left, and p=0.065 for right hemisphere) |
| Language typology and second TTG (section ‘Second transverse temporal gyrus and effects of language typology’) | Second TTG | Cortical thickness | To assess the effect of language typology within the identified region | Quantifying the distance between languages based on phoneme-level information explains the most variance in the average thickness of the bilateral second TTG |
| Language experience expressed as 'cumulative phoneme inventory' (section ‘Second transverse temporal gyrus and effects of language typology’) | Second TTG | Cortical thickness | To account for language experience in participants with different L1s | Relationship between the thickness of the left second TTG and the specific characteristics of languages at the phoneme-level of their phonological inventories (p=0.004) |
| Language experience in participants with a single TTG (section ‘Language experience in participants with a single TTG’) | Right HG (first TTG) and right PT | Cortical thickness | To assess the effect of language experience in participants without multiple TTGs | Positive relationship between the thickness of right HG and language experience (p=0.007); no relationship between the thickness of right PT and language experience (p=0.81) |
| Replication analysis (section ‘Replication analysis’) | Second TTG | Cortical thickness | To replicate the main result (analysis ‘Language experience and TTG’ and ’Language typology and second TTG’) in an independent sample | Relationship between the average thickness of the second TTG and language experience partially replicated (for left hemisphere, p=0.047) |
Table 4
Number of participants, their demographic and language experience characteristics displaying different overall shapes of the transverse temporal gyrus (TTG) (i.e. total number of identified gyri in the left and right hemisphere).
Last column lists whole sample’s descriptive statistics.
| Left | Right | Whole sample: | |||||||
|---|---|---|---|---|---|---|---|---|---|
| Total number of gyri: | 1 | 2 | 3 | 4 | 1 | 2 | 3 | 4 | |
| N | 6 | 78 | 47 | 5 | 40 | 78 | 18 | 0 | 136 |
| Male/female | 0/6 | 28/50 | 23/24 | 3/2 | 10/30 | 33/45 | 11/7 | – | 54/82 |
| Proportion male/proportion female | 0/0.07 | 0.61/0.51 | 0.29/0.42 | 0.05/0.02 | 0.18/0.37 | 0.61/0.55 | 0.20/0.09 | – | |
| Age (mean) | 42.95 | 35.95 | 36.29 | 28.48 | 35.12 | 36.49 | 36.63 | – | 36.11 |
| Language experience – no typology (mean) | 0.69 | 0.79 | 0.83 | 0.93 | 0.85 | 0.80 | 0.76 | – | 0.807 |
| Language experience – no typology (min) | 0.00 | 0.00 | 0.00 | 0.00 | 0.00 | 0.00 | 0.00 | – | 0.000 |
| Language experience – no typology (max) | 1.09 | 1.89 | 1.76 | 1.56 | 1.76 | 1.89 | 1.34 | – | 1.893 |
Table 5
Left and right second transverse temporal gyri (TTGs) and language experience.
Multiple regression model parameters (parameter estimates and standard errors, in brackets; p-values are listed according to the coding presented underneath the table) for the average cortical thickness values of the second TTG, as predicted by the four language experience indices: (1) the cumulative language experience measure not accounting for typology, and cumulative language experience weighted by overlaps between languages at the level of (2) acoustic/articulatory features, (3) phonemes, and (4) counts of phonological classes. Last two rows present model comparison results (additional variance explained and BF10 values). NB. All models including typological information were compared against the ‘No typology’ model.
| Left | Right | ||||||||
|---|---|---|---|---|---|---|---|---|---|
| Language experience models: | No typology | Features | Phonemes | Phonological classes | No typology | Features | Phonemes | Phonological classes | |
| (Intercept) | β | 0.00 | –0.01 | 0.00 | –0.01 | 0.01 | 0.01 | 0.01 | 0.01 |
| SE | (0.03) | (0.03) | (0.03) | (0.03) | (0.03) | (0.04) | (0.03) | (0.03) | |
| Language experience | β | –0.12** | –0.33 | –0.35** | –0.60* | –0.10+ | –0.25 | –0.26+ | –0.44 |
| SE | (0.05) | (0.23) | (0.12) | (0.29) | (0.05) | (0.27) | (0.13) | (0.33) | |
| Age | β | 0.00 | 0.00 | 0.00 | 0.00 | 0.00 | 0.00 | 0.00 | 0.00 |
| SE | (0.00) | (0.00) | (0.00) | (0.00) | (0.00) | (0.00) | (0.00) | (0.00) | |
| Mean thickness (left/right) | β | 1.40*** | 1.41*** | 1.37*** | 1.41*** | 0.94* | 0.99* | 0.92* | 0.99** |
| SE | (0.30) | (0.31) | (0.30) | (0.30) | (0.37) | (0.38) | (0.37) | (0.37) | |
| Sex | β | 0.00 | 0.01 | 0.00 | 0.01 | –0.01 | –0.01 | –0.01 | 0.00 |
| SE | (0.05) | (0.05) | (0.05) | (0.05) | (0.05) | (0.05) | (0.05) | (0.05) | |
| Num.Obs. | 130 | 130 | 130 | 130 | 96 | 96 | 96 | 96 | |
| R2 | 0.20 | 0.17 | 0.21 | 0.18 | 0.16 | 0.13 | 0.16 | 0.14 | |
| R2 Adj. | 0.17 | 0.14 | 0.18 | 0.16 | 0.12 | 0.09 | 0.12 | 0.10 | |
| AIC | 18.5 | 23.5 | 16.9 | 21.2 | 11.9 | 14.9 | 11.8 | 14.0 | |
| BIC | 35.7 | 40.7 | 34.1 | 38.4 | 27.3 | 30.3 | 27.2 | 29.4 | |
| Log.Lik. | –3.23 | –5.75 | –2.43 | –4.62 | 0.04 | –1.47 | 0.10 | –0.99 | |
| F | 7.80 | 6.32 | 8.29 | 6.98 | 4.30 | 3.46 | 4.33 | 3.72 | |
| RMSE | 0.25 | 0.25 | 0.25 | 0.25 | 0.24 | 0.25 | 0.24 | 0.24 | |
| ΔR2 Adjusted | – | –0.03 | 0.01 | –0.02 | – | –0.03 | 0.00 | –0.02 | |
| BF10 | – | 0.08 | 2.23 | 0.25 | – | 0.22 | 1.08 | 0.36 | |
-
.p<0.1, +p = 0.05, *p<0.05, **p<0.01, ***p<0.001.
Table 6
Thickness of left and right second transverse temporal gyri (TTGs) and language experience in an independent sample of participants.
Multiple regression model parameters (parameter estimates and standard errors, in brackets; p-values are listed according to the coding presented underneath the table) for the average cortical thickness of the second TTG, as predicted by the four language experience indices: (1) the cumulative language experience measure not accounting for typology, and cumulative language experience weighted by overlaps between languages at the level of (2) features, (3) phonemes, and (4) counts of phonological classes. The last two rows present model comparison results (additional variance explained and BF10 values). NB. All models including typological information were compared against the ‘No typology’ model.
| Left | Right | ||||||||
|---|---|---|---|---|---|---|---|---|---|
| Language experience models: | No typology | Features | Phonemes | Phonological classes | No typology | Features | Phonemes | Phonological classes | |
| (Intercept) | β | 1.00 | 1.12 | 0.99 | 1.24 | –1.85 | –2.20. | –2.09 | –1.21 |
| SE | (1.14) | (1.10) | (1.13) | (1.09) | (1.34) | (1.21) | (1.33) | (1.30) | |
| Language Experience | β | –0.03 | –0.09 | –0.09 | 0.32 | –0.13* | –1.02*** | –0.38* | –0.75 |
| SE | (0.06) | (0.28) | (0.15) | (0.49) | (0.06) | (0.27) | (0.15) | (0.49) | |
| Scanner | β | –0.08 | –0.09 | –0.08 | –0.09 | 0.10 | 0.09 | 0.11 | 0.09 |
| SE | (0.07) | (0.07) | (0.07) | (0.07) | (0.08) | (0.07) | (0.08) | (0.08) | |
| Age | β | 0.00 | 0.01 | 0.00 | 0.01 | 0.01* | 0.01** | 0.01* | 0.01* |
| SE | (0.00) | (0.00) | (0.00) | (0.00) | (0.00) | (0.00) | (0.00) | (0.00) | |
| Sex | β | 0.09 | 0.09 | 0.09 | 0.07 | 0.00 | 0.03 | 0.01 | –0.02 |
| SE | (0.07) | (0.07) | (0.07) | (0.07) | (0.07) | (0.06) | (0.07) | (0.07) | |
| Mean thickness (left/right) | β | 0.57 | 0.52 | 0.58 | 0.42 | 1.72** | 1.86*** | 1.81*** | 1.52** |
| SE | (0.44) | (0.42) | (0.44) | (0.42) | (0.52) | (0.46) | (0.51) | (0.50) | |
| Num.Obs. | 61 | 61 | 61 | 61 | 54 | 54 | 54 | 54 | |
| R2 | 0.092 | 0.089 | 0.092 | 0.094 | 0.225 | 0.350 | 0.253 | 0.196 | |
| R2 Adj. | 0.009 | 0.006 | 0.010 | 0.012 | 0.144 | 0.282 | 0.175 | 0.112 | |
| AIC | 13.9 | 14.1 | 13.8 | 13.7 | 7.6 | –1.9 | 5.6 | 9.5 | |
| BIC | 28.7 | 28.9 | 28.6 | 28.5 | 21.5 | 12.0 | 19.5 | 23.5 | |
| Log.Lik. | 0.047 | –0.046 | 0.077 | 0.130 | 3.205 | 7.947 | 4.196 | 2.229 | |
| F | 1.109 | 1.072 | 1.120 | 1.142 | 2.781 | 5.158 | 3.244 | 2.342 | |
| RMSE | 0.24 | 0.24 | 0.24 | 0.24 | 0.23 | 0.21 | 0.22 | 0.23 | |
| ΔR2 Adjusted | – | >–0.01 | <0.01 | <0.01 | – | 0.14 | 0.03 | –0.03 | |
| BF10 | – | 0.91 | 1.03 | 1.09 | – | 114.68 | 2.70 | 0.38 | |
-
.p<0.1, +p = 0.05, *p<0.05, **p<0.01, ***p<0.001.
Appendix 1—table 1
Languages spoken by each participant in the main and replication samples.
| Main sample | L1 | L2 | L3 | L4 | L5 | L6 | L7 | Number of languages |
|---|---|---|---|---|---|---|---|---|
| 1 | Czech | Russian | German | Korean | Vietnamese | French | English | 7 |
| 2 | Swiss_German | German | French | Greek | Italian | English | 6 | |
| 3 | German | Italian | English | French | Portuguese | Spanish | 6 | |
| 4 | English | French | German | Spanish | Mandarin | 5 | ||
| 5 | German | English | French | Dutch | Italian | 5 | ||
| 6 | English | French | German | Italian | Spanish | 5 | ||
| 7 | German | English | French | Spanish | Russian | 5 | ||
| 8 | English | German | Luxembourgish | French | Danish | 5 | ||
| 9 | English | German | French | Spanish | Italian | 5 | ||
| 10 | English | Italian | French | German | Spanish | 5 | ||
| 11 | Portuguese | English | Spanish | French | Italian | 5 | ||
| 12 | Hakka | Mandarin | Malay | English | Cantonese | 5 | ||
| 13 | English | French | Italian | Spanish | Mandarin | 5 | ||
| 14 | German | English | French | Japanese | 4 | |||
| 15 | English | French | German | Danish | 4 | |||
| 16 | German | English | French | Spanish | 4 | |||
| 17 | German | English | French | Italian | 4 | |||
| 18 | German | English | Italian | French | 4 | |||
| 19 | English | French | German | Italian | 4 | |||
| 20 | German | English | Greek | French | 4 | |||
| 21 | French | German | English | Spanish | 4 | |||
| 22 | Spanish | Hebrew | English | French | 4 | |||
| 23 | English | German | Spanish | French | 4 | |||
| 24 | German | English | French | Italian | 4 | |||
| 25 | Portuguese | English | French | Italian | 4 | |||
| 26 | Greek | English | French | Spanish | 4 | |||
| 27 | Greek | English | French | Spanish | 4 | |||
| 28 | Greek | English | Italian | Spanish | 4 | |||
| 29 | Hakka | English | Mandarin | German | 4 | |||
| 30 | Cantonese | English | Mandarin | Italian | 4 | |||
| 31 | Cantonese | English | Mandarin | French | 4 | |||
| 32 | German | English | Dutch | 3 | ||||
| 33 | English | Spanish | Portuguese | 3 | ||||
| 34 | English | French | Swedish | 3 | ||||
| 35 | English | Hindi | Portuguese | 3 | ||||
| 36 | German | English | French | 3 | ||||
| 37 | German | English | Dutch | 3 | ||||
| 38 | German | English | French | 3 | ||||
| 39 | German | English | Spanish | 3 | ||||
| 40 | Greek | English | French | 3 | ||||
| 41 | Greek | English | Spanish | 3 | ||||
| 42 | Greek | English | German | 3 | ||||
| 43 | Greek | English | German | 3 | ||||
| 44 | Greek | English | French | 3 | ||||
| 45 | Greek | English | French | 3 | ||||
| 46 | Greek | English | French | 3 | ||||
| 47 | Greek | English | French | 3 | ||||
| 48 | Greek | English | Italian | 3 | ||||
| 49 | Mandarin | Cantonese | English | 3 | ||||
| 50 | Cantonese | English | Mandarin | 3 | ||||
| 51 | Cantonese | Mandarin | English | 3 | ||||
| 52 | Cantonese | Mandarin | English | 3 | ||||
| 53 | English | French | Mandarin | 3 | ||||
| 54 | Cantonese | English | Mandarin | 3 | ||||
| 55 | English | Mandarin | German | 3 | ||||
| 56 | Cantonese | English | Mandarin | 3 | ||||
| 57 | English | French | Mandarin | 3 | ||||
| 58 | English | French | Mandarin | 3 | ||||
| 59 | English | German | Mandarin | 3 | ||||
| 60 | Bengali | Hindi | English | 3 | ||||
| 61 | Bengali | Hindi | English | 3 | ||||
| 62 | Hindi | English | Urdu | 3 | ||||
| 63 | Hindi | English | Urdu | 3 | ||||
| 64 | Bengali | English | Hindi | 3 | ||||
| 65 | Bengali | English | Hindi | 3 | ||||
| 66 | English | Spanish | French | 3 | ||||
| 67 | Farsi | English | Arabic | 3 | ||||
| 68 | English | German | 2 | |||||
| 69 | English | French | 2 | |||||
| 70 | Dutch | English | 2 | |||||
| 71 | English | Creole | 2 | |||||
| 72 | English | Irish | 2 | |||||
| 73 | German | English | 2 | |||||
| 74 | German | English | 2 | |||||
| 75 | German | English | 2 | |||||
| 76 | German | English | 2 | |||||
| 77 | English | German | 2 | |||||
| 78 | German | English | 2 | |||||
| 79 | Italian | English | 2 | |||||
| 80 | Hebrew | English | 2 | |||||
| 81 | English | Hebrew | 2 | |||||
| 82 | Spanish | English | 2 | |||||
| 83 | German | English | 2 | |||||
| 84 | German | English | 2 | |||||
| 85 | Greek | English | 2 | |||||
| 86 | Greek | English | 2 | |||||
| 87 | Greek | English | 2 | |||||
| 88 | Greek | English | 2 | |||||
| 89 | Greek | English | 2 | |||||
| 90 | Greek | English | 2 | |||||
| 91 | Greek | English | 2 | |||||
| 92 | Greek | English | 2 | |||||
| 93 | Mandarin | English | 2 | |||||
| 94 | Cantonese | English | 2 | |||||
| 95 | Cantonese | English | 2 | |||||
| 96 | English | Mandarin | 2 | |||||
| 97 | Mandarin | English | 2 | |||||
| 98 | Cantonese | English | 2 | |||||
| 99 | Mandarin | English | 2 | |||||
| 100 | Mandarin | English | 2 | |||||
| 101 | Mandarin | English | 2 | |||||
| 102 | Gujarati | English | 2 | |||||
| 103 | Gujarati | English | 2 | |||||
| 104 | Gujarati | English | 2 | |||||
| 105 | English | Hungarian | 2 | |||||
| 106 | English | French | 2 | |||||
| 107 | English | French | 2 | |||||
| 108 | English | 1 | ||||||
| 109 | English | 1 | ||||||
| 110 | English | 1 | ||||||
| 111 | English | 1 | ||||||
| 112 | English | 1 | ||||||
| 113 | English | 1 | ||||||
| 114 | English | 1 | ||||||
| 115 | English | 1 | ||||||
| 116 | English | 1 | ||||||
| 117 | English | 1 | ||||||
| 118 | English | 1 | ||||||
| 119 | English | 1 | ||||||
| 120 | English | 1 | ||||||
| 121 | English | 1 | ||||||
| 122 | English | 1 | ||||||
| 123 | English | 1 | ||||||
| 124 | English | 1 | ||||||
| 125 | English | 1 | ||||||
| 126 | English | 1 | ||||||
| 127 | English | 1 | ||||||
| 128 | English | 1 | ||||||
| 129 | English | 1 | ||||||
| 130 | English | 1 | ||||||
| 131 | English | 1 | ||||||
| 132 | English | 1 | ||||||
| 133 | English | 1 | ||||||
| 134 | English | 1 | ||||||
| 135 | English | 1 | ||||||
| 136 | English | 1 | ||||||
| Replication sample | L1 | L2 | L3 | L4 | L5 | L6 | L7 | Number of languages |
| 1 | German | English | French | Spanish | Italian | 5 | ||
| 2 | German | English | Italian | French | Arabic | 5 | ||
| 3 | Sindhi | English | Hindi | French | Russian | 5 | ||
| 4 | English | Irish | French | German | Italian | 5 | ||
| 5 | German | English | French | Italian | Spanish | 5 | ||
| 6 | English | French | German | Russian | 4 | |||
| 7 | German | English | Italian | French | 4 | |||
| 8 | German | English | French | Italian | 4 | |||
| 9 | English | French | German | Spanish | 4 | |||
| 10 | English | French | Spanish | German | 4 | |||
| 11 | Swiss_German | German | English | French | 4 | |||
| 12 | German | English | French | Spanish | 4 | |||
| 13 | German | English | French | Swahili | 4 | |||
| 14 | German | English | French | Swedish | 4 | |||
| 15 | German | English | French | Spanish | 4 | |||
| 16 | German | Portuguese | English | French | 4 | |||
| 17 | German | Dutch | English | French | 4 | |||
| 18 | Swiss_German | German | French | English | 4 | |||
| 19 | German | English | French | Spanish | 4 | |||
| 20 | Hungarian | English | French | 3 | ||||
| 21 | German | English | French | 3 | ||||
| 22 | English | German | Spanish | 3 | ||||
| 23 | Punjabi | English | French | 3 | ||||
| 24 | English | French | German | 3 | ||||
| 25 | English | French | German | 3 | ||||
| 26 | English | French | Italian | 3 | ||||
| 27 | English | French | Mandarin | 3 | ||||
| 28 | German | Italian | English | 3 | ||||
| 29 | German | English | Finnish | 3 | ||||
| 30 | German | English | French | 3 | ||||
| 31 | German | English | Spanish | 3 | ||||
| 32 | German | English | Dutch | 3 | ||||
| 33 | German | English | Dutch | 3 | ||||
| 34 | German | English | Spanish | 3 | ||||
| 35 | German | Russian | English | 3 | ||||
| 36 | Swahili | English | 2 | |||||
| 37 | English | Czech | 2 | |||||
| 38 | German | English | 2 | |||||
| 39 | English | Spanish | 2 | |||||
| 40 | English | 1 | ||||||
| 41 | English | 1 | ||||||
| 42 | English | 1 | ||||||
| 43 | English | 1 | ||||||
| 44 | English | 1 | ||||||
| 45 | English | 1 | ||||||
| 46 | English | 1 | ||||||
| 47 | English | 1 | ||||||
| 48 | English | 1 | ||||||
| 49 | English | 1 | ||||||
| 50 | English | 1 | ||||||
| 51 | English | 1 | ||||||
| 52 | English | 1 | ||||||
| 53 | English | 1 | ||||||
| 54 | English | 1 | ||||||
| 55 | English | 1 | ||||||
| 56 | English | 1 | ||||||
| 57 | English | 1 | ||||||
| 58 | English | 1 | ||||||
| 59 | English | 1 | ||||||
| 60 | English | 1 | ||||||
| 61 | English | 1 | ||||||
| 62 | English | 1 | ||||||
| 63 | English | 1 | ||||||
| 64 | English | 1 | ||||||
| 65 | English | 1 | ||||||
| 66 | English | 1 | ||||||
| 67 | English | 1 | ||||||
| 68 | English | 1 | ||||||
| 69 | English | 1 |
Appendix 1—table 2
Results of linear mixed models (parameter estimates and standard errors, in brackets; p-values are listed according to the coding presented underneath the table) testing the effect of language experience on the structure (volume, area, and average thickness) of the auditory regions: planum polare, Heschl’s gyrus, Heschl’s sulcus, planum temporale, anterior and posterior superior temporal gyrus, and anterior, middle, and posterior superior temporal sulcus (STG).
Anterior STG was used as the reference level.
| Volume | Area | Thickness | ||
|---|---|---|---|---|
| (Intercept) | β | 1711.89*** | 58.10*** | 0.58*** |
| SE | (35.28) | (11.85) | (0.02) | |
| Age | β | 1.01 | 0.07 | 0.00 |
| SE | (0.88) | (0.24) | (0.00) | |
| Sex | β | 0.63 | –7.41 | 0.02 |
| SE | (26.07) | (8.07) | (0.01) | |
| Whole-brain: volume/area/thickness | β | 0.00*** | 0.01*** | 0.77*** |
| SE | (0.00) | (0.00) | (0.09) | |
| Language experience | β | 41.50 | 7.45 | 0.03 |
| SE | (66.09) | (22.33) | (0.03) | |
| Posterior STG | β | –1548.51*** | –257.01*** | –0.34*** |
| SE | (46.38) | (15.85) | (0.02) | |
| Anterior STS | β | –2465.10*** | –190.57*** | –0.77*** |
| SE | (46.38) | (15.85) | (0.02) | |
| Middle STS | β | –688.17*** | 646.88*** | –1.01*** |
| SE | (46.38) | (15.85) | (0.02) | |
| Posterior STS | β | –185.92*** | 861.89*** | –1.01*** |
| SE | (46.38) | (15.85) | (0.02) | |
| PT | β | –2064.07*** | –163.35*** | –0.80*** |
| SE | (46.38) | (15.85) | (0.02) | |
| HG | β | –2886.10*** | –482.40*** | –0.78*** |
| SE | (46.38) | (15.85) | (0.02) | |
| HS | β | –3416.84*** | –552.82*** | –0.97*** |
| SE | (46.38) | (15.85) | (0.02) | |
| PP | β | –1870.15*** | –316.73*** | 0.19*** |
| SE | (46.38) | (15.85) | (0.02) | |
| Hemisphere | β | –478.00*** | –103.17*** | 0.02 |
| SE | (46.38) | (15.85) | (0.02) | |
| Language experience × posterior STG | β | –54.04 | –20.53 | –0.02 |
| SE | (90.37) | (30.88) | (0.05) | |
| Language experience × anterior STS | β | –104.26 | –28.61 | –0.01 |
| SE | (90.37) | (30.88) | (0.05) | |
| Language experience × middle STS | β | 23.56 | 28.91 | –0.02 |
| SE | (90.37) | (30.88) | (0.05) | |
| Language experience × posterior STS | β | 40.34 | 38.03 | –0.05 |
| SE | (90.37) | (30.88) | (0.05) | |
| Language experience × PT | β | –172.20. | –35.12 | –0.12* |
| SE | (90.37) | (30.88) | (0.05) | |
| Language experience × HG | β | –39.06 | –4.31 | –0.02 |
| SE | (90.37) | (30.88) | (0.05) | |
| Language experience × HS | β | –82.13 | –25.18 | –0.01 |
| SE | (90.37) | (30.88) | (0.05) | |
| Language experience × PP | β | –91.67 | –9.65 | –0.07 |
| SE | (90.37) | (30.88) | (0.05) | |
| Language experience × hemisphere | β | 41.88 | –17.55 | 0.02 |
| SE | (90.37) | (30.88) | (0.05) | |
| Posterior STG × hemisphere | β | 407.62*** | 99.63*** | 0.02 |
| SE | (65.60) | (22.42) | (0.03) | |
| Anterior STS × hemisphere | β | 371.93*** | 67.74** | –0.05 |
| SE | (65.60) | (22.42) | (0.03) | |
| Middle STS × hemisphere | β | 440.40*** | 43.39. | 0.11** |
| SE | (65.60) | (22.42) | (0.03) | |
| Posterior STS × hemisphere | β | 1186.10*** | 435.79*** | 0.01 |
| SE | (65.60) | (22.42) | (0.03) | |
| PT × hemisphere | β | 222.12*** | 7.78 | 0.04 |
| SE | (65.60) | (22.42) | (0.03) | |
| HG × hemisphere | β | 255.17*** | 19.78 | 0.09** |
| SE | (65.60) | (22.42) | (0.03) | |
| HS × hemisphere | β | 363.43*** | 23.36 | 0.16*** |
| SE | (65.60) | (22.42) | (0.03) | |
| PP × hemisphere | β | 486.42*** | 146.40*** | –0.15*** |
| SE | (65.60) | (22.42) | (0.03) | |
| Language experience × posterior STG × hemisphere | β | –36.81 | 32.36 | –0.02 |
| SE | (127.81) | (43.68) | (0.07) | |
| Language experience × anterior STS × hemisphere | β | 75.05 | 52.32 | 0.01 |
| SE | (127.81) | (43.68) | (0.07) | |
| Language experience × middle STS × hemisphere | β | 15.40 | 16.32 | 0.01 |
| SE | (127.81) | (43.68) | (0.07) | |
| Language experience × posterior STS × hemisphere | β | 50.84 | 52.48 | –0.03 |
| SE | (127.81) | (43.68) | (0.07) | |
| Language experience × PT × hemisphere | β | 31.46 | 33.64 | 0.03 |
| SE | (127.81) | (43.68) | (0.07) | |
| Language experience × HG × hemisphere | β | –71.22 | 8.23 | 0.00 |
| SE | (127.81) | (43.68) | (0.07) | |
| Language experience × HS × hemisphere | β | –13.56 | 24.11 | 0.02 |
| SE | (127.81) | (43.68) | (0.07) | |
| Language experience × PP × hemisphere | β | –37.13 | 13.98 | 0.02 |
| SE | (127.81) | (43.68) | (0.07) | |
| SD (Intercept id) | 91.84 | 24.92 | 0.06 | |
| SD (Observations) | 382.49 | 130.71 | 0.20 | |
| Num.Obs. | 2448 | 2448 | 2448 | |
| R2 Marg. | 0.904 | 0.937 | 0.793 | |
| R2 Cond. | 0.910 | 0.939 | 0.812 | |
| AIC | 35864.3 | 30661.7 | –580.1 | |
| BIC | 36102.2 | 30899.7 | –342.2 | |
| ICC | 0.1 | 0.0 | 0.1 | |
| RMSE | 374.14 | 128.27 | 0.19 |
-
STG: superior temporal gyrus, STS: superior temporal sulcus, PT: planum temporale, HG: Heschl’s gyrus, HS: Heschl’s sulcus, PP: planum polare.
-
p<0.1, +p = 0.05, *p<0.05, **p<0.01, ***p<0.001.
Appendix 1—table 3
Results of the linear mixed models testing the effect of language experience on the structure (volume, area, and average thickness) of the gyri in the superior temporal region: first, second, and third transverse temporal gyrus (TTG).
Anterior TTG was used as the reference level.
| Volume | Area | Thickness | ||
|---|---|---|---|---|
| (Intercept) | β | –86.44*** | –31.09*** | 0.05** |
| SE | (14.45) | (4.14) | (0.01) | |
| Language experience | β | –4.83 | 0.92 | –0.06* |
| SE | (32.25) | (9.24) | (0.03) | |
| Age | β | –1.33 | –0.30 | 0.00 |
| SE | (0.86) | (0.22) | (0.00) | |
| Sex | β | 14.78 | 2.72 | 0.01 |
| SE | (12.69) | (3.66) | (0.01) | |
| Whole-brain: volume/area/thickness | β | 0.00*** | 0.00*** | 0.98*** |
| SE | (0.00) | (0.00) | (0.16) | |
| Second gyrus | β | 351.19*** | 119.93*** | –0.13*** |
| SE | (17.05) | (4.89) | (0.01) | |
| Third gyrus | β | –169.80*** | –50.83*** | 0.01 |
| SE | (17.55) | (5.03) | (0.02) | |
| Hemisphere | β | 51.04*** | 19.58*** | –0.04** |
| SE | (14.42) | (4.13) | (0.01) | |
| Language experience × second gyrus | β | –30.18 | –14.89 | 0.09** |
| SE | (36.03) | (10.33) | (0.03) | |
| Language experience × third gyrus | β | –5.66 | 3.50 | –0.05 |
| SE | (36.88) | (10.57) | (0.03) | |
| Language experience × hemisphere | β | –27.16 | –7.25 | 0.00 |
| SE | (31.46) | (9.02) | (0.03) | |
| Second gyrus × hemisphere | β | 8.34 | 8.32. | –0.02 |
| SE | (17.01) | (4.88) | (0.01) | |
| Third gyrus × hemisphere | β | –18.79 | –6.34 | –0.01 |
| SE | (17.55) | (5.03) | (0.02) | |
| Language experience × second gyrus × hemisphere | β | –11.32 | –2.86 | –0.02 |
| SE | (36.04) | (10.34) | (0.03) | |
| Language experience × third gyrus × hemisphere | β | 30.25 | 11.01 | –0.03 |
| SE | (36.88) | (10.57) | (0.03) | |
| SD (Intercept id) | 0.01 | 0.00 | 0.07 | |
| SD (Observations) | 257.90 | 73.94 | 0.22 | |
| Num.Obs. | 567 | 567 | 567 | |
| R2 Marg. | 0.521 | 0.596 | 0.254 | |
| R2 Cond. | 0.521 | 0.324 | ||
| AIC | 7836.9 | 6455.5 | 66.9 | |
| BIC | 7910.7 | 6529.3 | 140.7 | |
| ICC | 0.0 | 0.1 | ||
| RMSE | 254.47 | 72.95 | 0.21 |
-
p<0.1, +p = 0.05, *p<0.05, **p<0.01, ***p<0.001.
Appendix 1—table 4
Left and right second transverse temporal gyri (TTGs) and cumulative phoneme inventory.
Multiple regression model parameters (parameter estimates and standard errors, in brackets; p-values are listed according to the coding presented underneath the table) for the average cortical thickness of the second TTG (left and right), as predicted by the ‘cumulative phoneme inventory’ index. For comparison, models with the cumulative language experience measure not accounting for typology, and cumulative language experience weighted by overlaps between languages at the level of phonemes are also reported. Last two rows present model comparison results (additional variance explained and BF10 and BF01 values are also reported).
| Left | Right | ||||||
|---|---|---|---|---|---|---|---|
| Language experience Models: | Cumulative phoneme inventory | Language experience | Language experience (phonemes) | Cumulative phoneme inventory | Language experience | Language experience (Phonemes) | |
| (Intercept) | β | 0.00 | 0.00 | 0.00 | 0.00 | 0.00 | 0.00 |
| SE | (0.02) | (0.02) | (0.02) | (0.03) | (0.03) | (0.03) | |
| Language experience | β | 0.05 | –0.12** | – | –0.08 | –0.10+ | – |
| SE | (0.07) | (0.05) | – | (0.09) | (0.05) | – | |
| Phonemes | β | 0.00** | – | – | 0.00 | – | – |
| SE | (0.00) | – | – | (0.00) | – | – | |
| Language experience (phonemes) | β | – | – | –0.35** | - | - | –0.26+ |
| SE | – | - | (0.12) | - | - | (0.13) | |
| Age | β | 0.00. | 0.00 | 0.00 | 0.00 | 0.00 | 0.00 |
| SE | (0.00) | (0.00) | (0.00) | (0.00) | (0.00) | (0.00) | |
| Mean thickness (left/right) | β | 1.43*** | 1.40*** | 1.37*** | 0.95* | 0.94* | 0.92* |
| SE | (0.29) | (0.30) | (0.30) | (0.37) | (0.37) | (0.37) | |
| Sex | β | 0.00 | 0.00 | 0.00 | 0.01 | 0.00 | 0.01 |
| SE | (0.02) | (0.02) | (0.02) | (0.03) | (0.03) | (0.03) | |
| Num.Obs. | 130 | 130 | 130 | 96 | 96 | 96 | |
| R2 | 0.251 | 0.200 | 0.210 | 0.160 | 0.159 | 0.160 | |
| R2 Adj. | 0.221 | 0.174 | 0.184 | 0.113 | 0.122 | 0.123 | |
| AIC | 11.9 | 18.5 | 16.9 | 13.8 | 11.9 | 11.8 | |
| BIC | 31.9 | 35.7 | 34.1 | 31.8 | 27.3 | 27.2 | |
| Log.Lik. | 1.062 | –3.232 | –2.430 | 0.085 | 0.036 | 0.101 | |
| F | 8.308 | 7.802 | 8.287 | 3.420 | 4.295 | 4.331 | |
| RMSE | 0.24 | 0.25 | 0.25 | 0.24 | 0.24 | 0.24 | |
| ΔR2 Adjusted | – | –0.04 | –0.03 | – | 0.01 | 0.01 | |
| BF10 | – | 0.15 | 0.34 | – | 9.33 | 9.96 | |
| BF01 | – | 6.43 | 2.88 | – | 0.11 | 0.10 | |
-
p<0.1, +p = 0.05, *p<0.05, **p<0.01, ***p<0.001.
Appendix 1—table 5
Right superior temporal plane (Heschl’s gyrus and planum temporale) and language experience in participants with one transverse temporal gyrus (TTG).
Multiple regression model parameters (parameter estimates and standard errors, in brackets; p-values are listed according to the coding presented underneath the table) for the average cortical thickness of the right Heschl’s gyrus, and the right planum temporale, as predicted by the four language experience indices: (1) the cumulative language experience measure not accounting for typology, and cumulative language experience weighted by overlaps between languages at the level of (2) phonemes, (3) acoustic/articulatory features, and (4) counts of phonological classes. Last two rows present model comparison results (additional variance explained and BF10 values). NB. All models including typological information were compared against the ‘No typology’ model.
| Right Heschl’s gyrus | Right planum temporale | ||||||||
|---|---|---|---|---|---|---|---|---|---|
| No typology | Features | Phonemes | Phonological classes | No typology | Features | Phonemes | Phonological classes | ||
| (Intercept) | β | –0.01 | –0.01 | –0.01 | –0.13* | 2.52*** | 2.52*** | 2.52*** | 2.50*** |
| SE | (0.03) | (0.03) | (0.03) | (0.06) | (0.03) | (0.03) | (0.03) | (0.07) | |
| Language experience indices | β | 0.15** | 0.48+ | 0.35* | 0.82* | 0.02 | 0.03 | 0.06 | 0.11 |
| SE | (0.05) | (0.24) | (0.15) | (0.32) | (0.07) | (0.30) | (0.19) | (0.41) | |
| Age | β | 0.00 | 0.00 | 0.00 | 0.00 | –0.00 | –0.00 | –0.00 | –0.00 |
| SE | (0.00) | (0.00) | (0.00) | (0.00) | (0.00) | (0.00) | (0.00) | (0.00) | |
| Sex | β | 0.05 | 0.03 | 0.05 | 0.04 | 0.06 | 0.05 | 0.06 | 0.06 |
| SE | (0.05) | (0.06) | (0.06) | (0.05) | (0.07) | (0.07) | (0.07) | (0.07) | |
| Mean Thickness (right) | β | 0.93** | 0.99** | 0.96** | 0.93** | 0.90* | 0.90* | 0.91* | 0.90* |
| SE | (0.30) | (0.31) | (0.30) | (0.30) | (0.38) | (0.39) | (0.38) | (0.38) | |
| Num.Obs. | 40 | 40 | 40 | 40 | 40 | 40 | 40 | 40 | |
| R2 | 0.42 | 0.36 | 0.38 | 0.40 | 0.23 | 0.23 | 0.23 | 0.23 | |
| R2 Adj. | 0.36 | 0.28 | 0.31 | 0.33 | 0.15 | 0.14 | 0.15 | 0.15 | |
| AIC | –36.6 | –32.4 | –34.0 | –34.9 | –15.6 | –15.5 | –15.6 | –15.6 | |
| BIC | –26.5 | –22.3 | –23.8 | –24.7 | –5.4 | –5.4 | –5.5 | –5.4 | |
| Log.Lik. | 24.30 | 22.19 | 22.99 | 23.43 | 13.79 | 13.76 | 13.81 | 13.79 | |
| RMSE | 0.13 | 0.14 | 0.14 | 0.13 | 0.17 | 0.17 | 0.17 | 0.17 | |
| ΔR2 Adjusted | – | –0.07 | –0.04 | –0.03 | – | >–0.01 | <0.01 | <0.01 | |
| BF10 | – | 0.12 | 0.27 | 0.42 | – | 0.97 | 1.02 | 1.01 | |
-
p<0.1, +p=0.05, *p<0.05, **p<0.01, ***p<0.001.
Author response table 1
| Model | Adjusted R2 | |
|---|---|---|
| left 2nd TTG | (1) No typology | 0.174 |
| (2) Phonemes | 0.184 | |
| (3) Features | 0.142 | |
| (4) Phonological classes | 0.156 | |
| (5) Lexical | 0.164 | |
| right 2nd TTG | (1) No typology | 0.122 |
| (2) Phonemes | 0.123 | |
| (3) Features | 0.094 | |
| (4) Phonological classes | 0.103 | |
| (5) Lexical | 0.116 |
Additional files
Download links
A two-part list of links to download the article, or parts of the article, in various formats.
Downloads (link to download the article as PDF)
Open citations (links to open the citations from this article in various online reference manager services)
Cite this article (links to download the citations from this article in formats compatible with various reference manager tools)
Auditory cortex anatomy reflects multilingual phonological experience
eLife 12:RP90269.
https://doi.org/10.7554/eLife.90269.3


