Cyclic muscle contractions reinforce the actomyosin motors and mediate the full elongation of C. elegans embryo
- Laboratoire de Physique de l’Ecole normale supérieure, ENS, Université PSL, CNRS, Sorbonne Université, Université Paris Cité, France
Figures
Figure 1
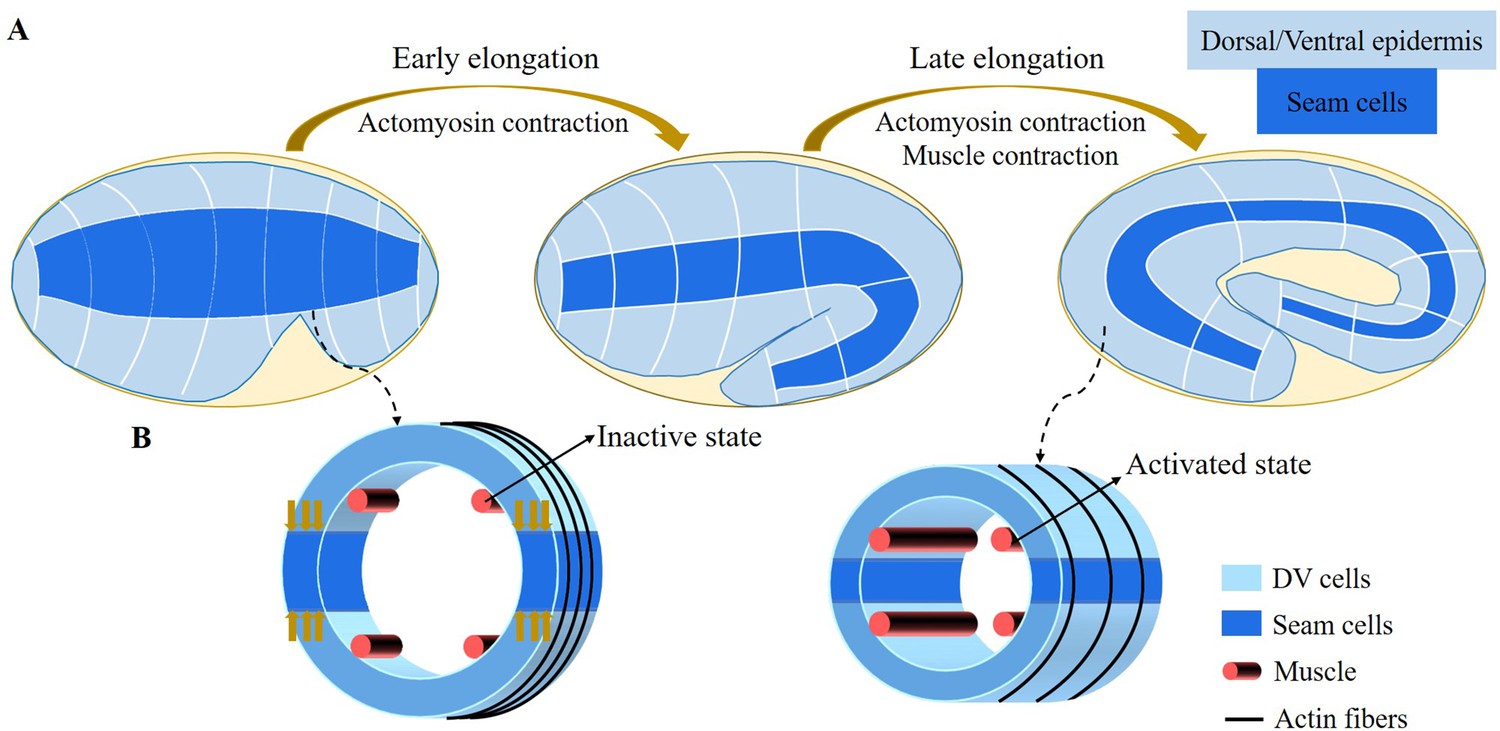
Schematic diagram of embryonic development of C. elegans.
(A) Overview of C. elegans embryonic development. Three epidermal cell types are found around the circumference: dorsal, ventral, and seam cells. (B) Schemes showing a C. elegans cross-section of the embryo. Small yellow arrows in the left image indicate the contraction force that occurred in the seam cell. Four muscle bands under the epidermis and actin bundles surround the outer epidermis.
Figure 2
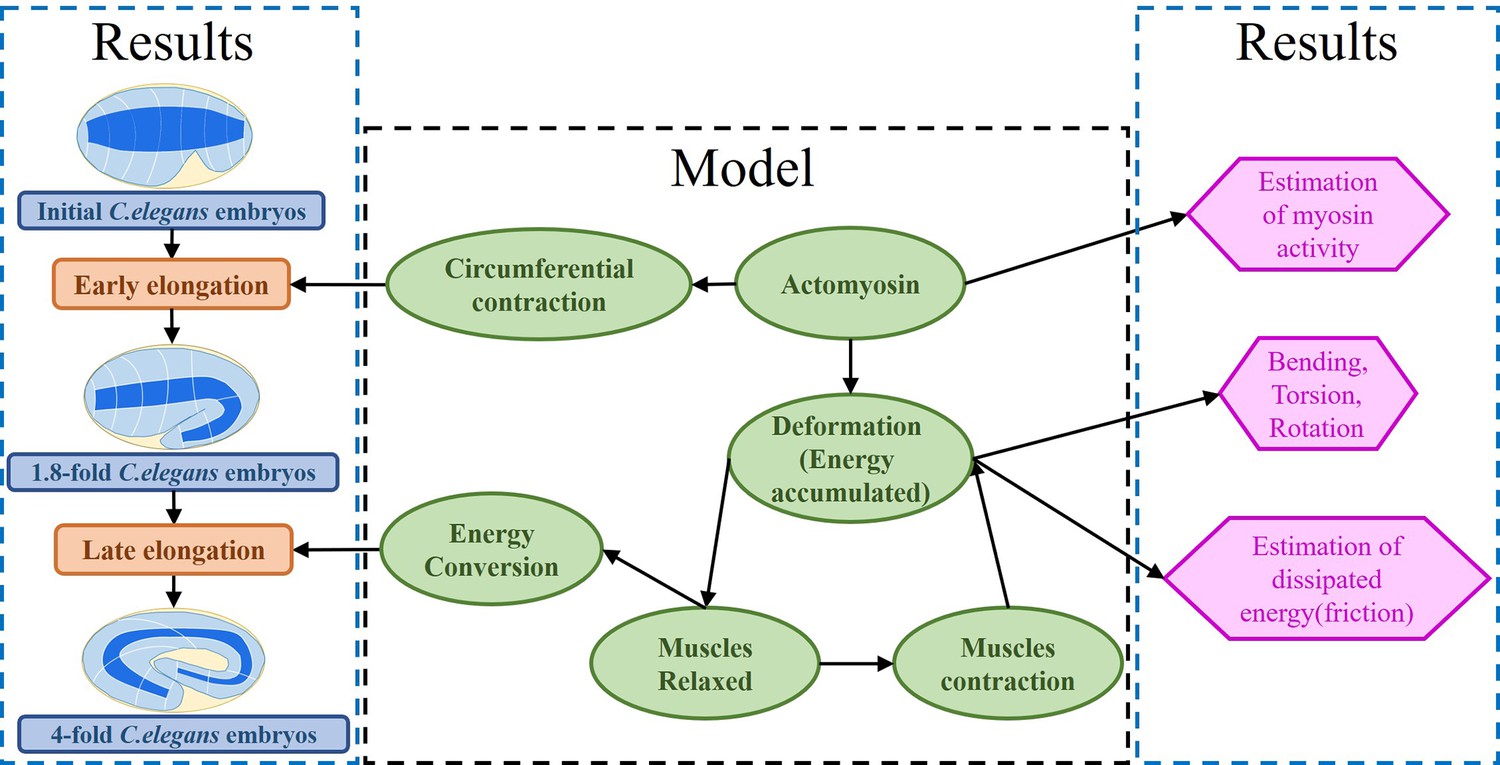
Architecture of the program.
The program reflects the framework of the research. On the one hand, the proposed model explains the early and late elongation of the C. elegans, on the other hand, the early myosin activity is estimated, the deformations (bending, twisting, rotation) occurring in the late period are recovered, and the estimation of the energy dissipated during muscle activity is achieved.
Figure 3
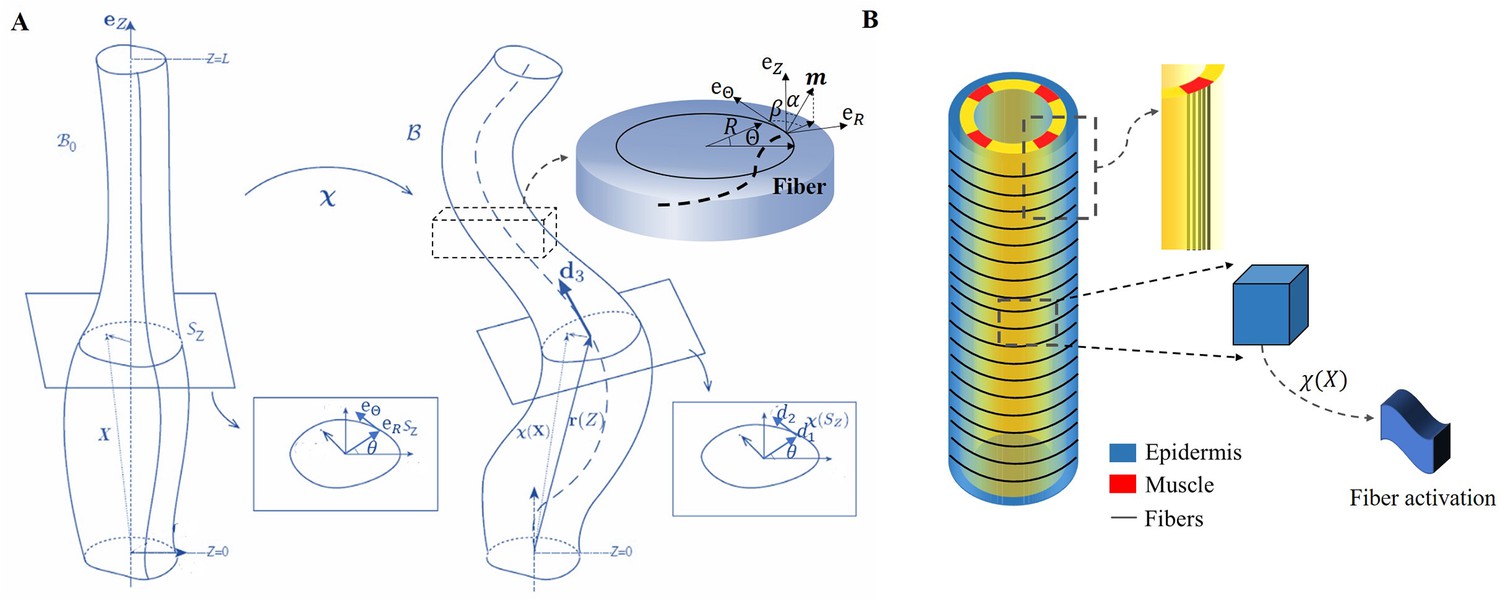
The model of C. elegans embryo.
(A) Cylindrical structure in the reference configuration (left) with a vertical centerline and its deformation in the current configuration (right). The deformed configuration is fully parameterized by the centerline (resulting from the distortion of the central axis) and the deformation of each cross-section. (B) Schematic representation of the body shape of the C. elegans embryo with the cortical epidermis and the four muscles. The fibers are embedded in the cortex. The blue part representing the epidermis shows the outer distribution of the actin organized in horizontal hoop bundles when the muscles are not activated. The yellow part includes the vertical red muscles, represented by axial fibers.
Figure 4
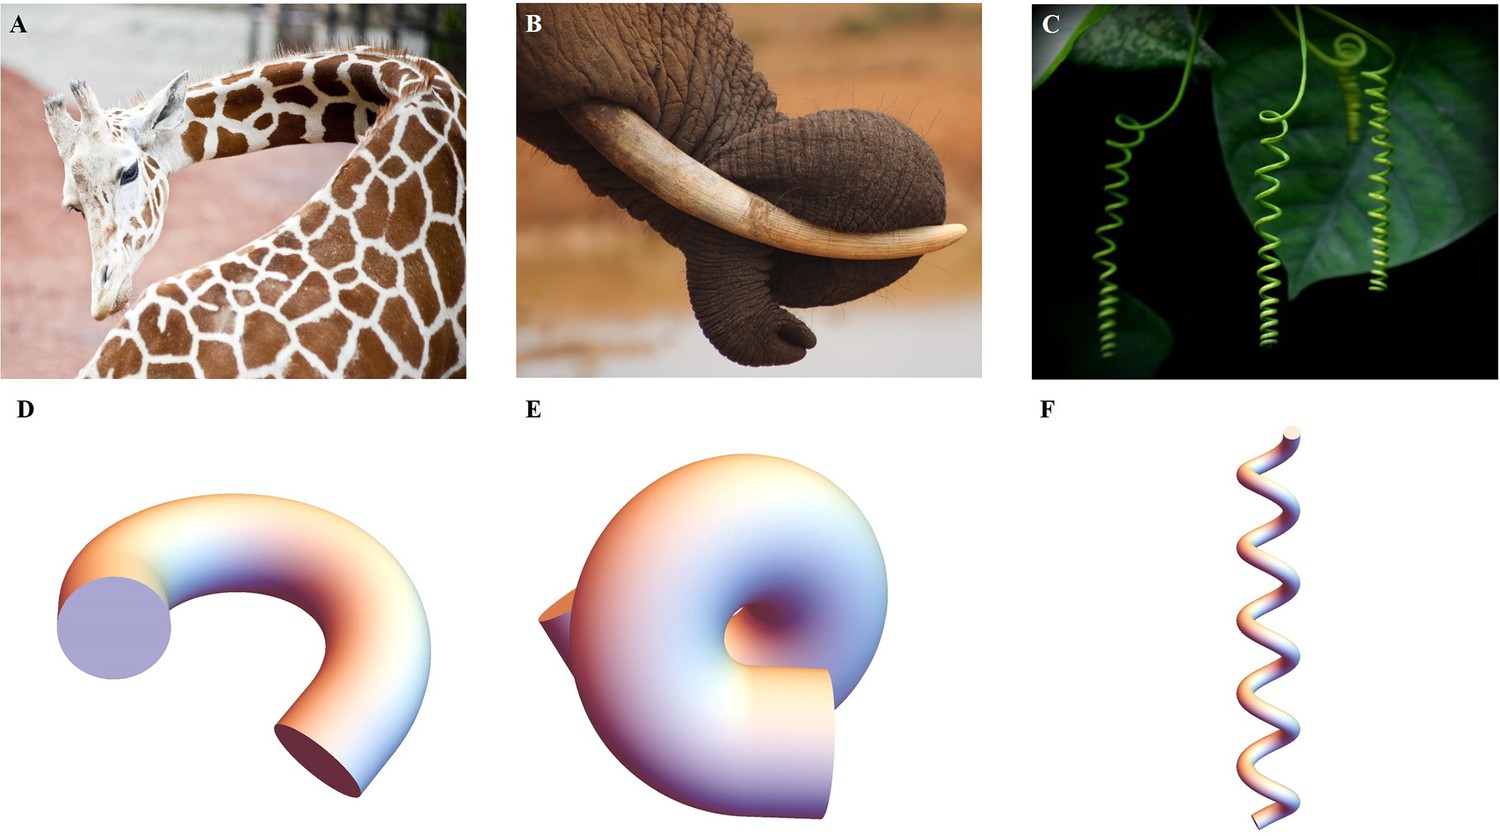
Extended application of the model.
(A) Bending of a giraffe’s neck. (B) Torsion of an elephant’s trunk. (B) Twisting of a plant vine. (D) to (F) Deformation configuration under different activations obtained by our simulations for bending and torsion of large rods, twisting, and torsion of thin rods.
Figure 5
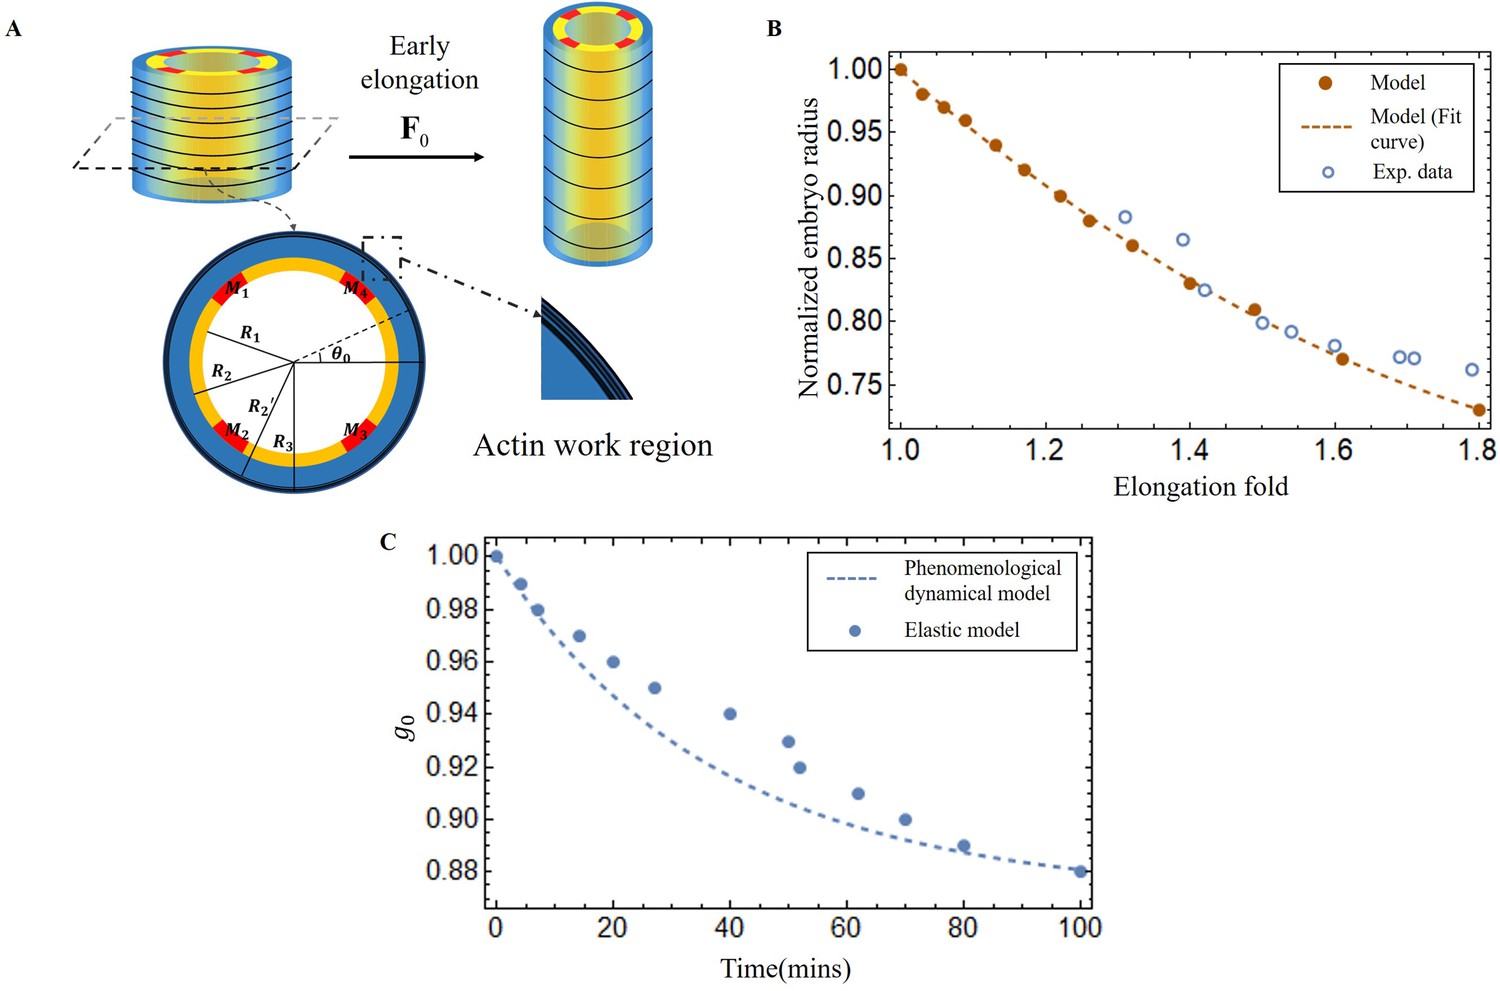
Early elongation model of C. elegans embryo and validation images of the model results.
(A) Schematic of early elongation and the cross-section of C. elegans. In the cross-section, the black circular part is the actin region (, with shear modulus ), the blue part is the epidermis layer ( with shear modulus ). The central or inner part () in white has shear modulus , except for the four muscles, the shear modulus of the four muscles is much larger than the inner part. All detailed data are given in Appendix 1—table 1 (B) Predictions of normalized embryo radius evolution during early elongation by the pre-strain model compared to experimental data from Vuong-Brender et al., 2017a. For the model, see Equation 20 in Appendix 2. (C) Blue dots: extraction of the parameter from Equation 30 and Equation 32 in Appendix 2. Blue dash line, see Equation 3.
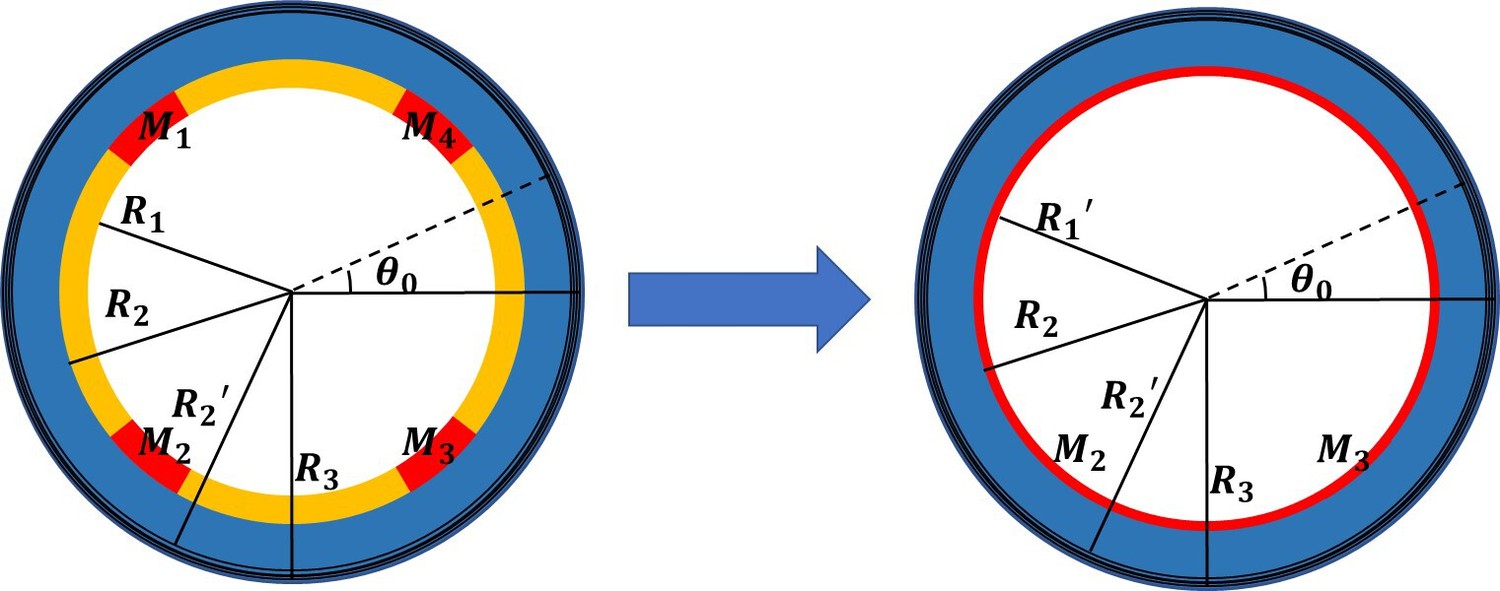
Figure 6
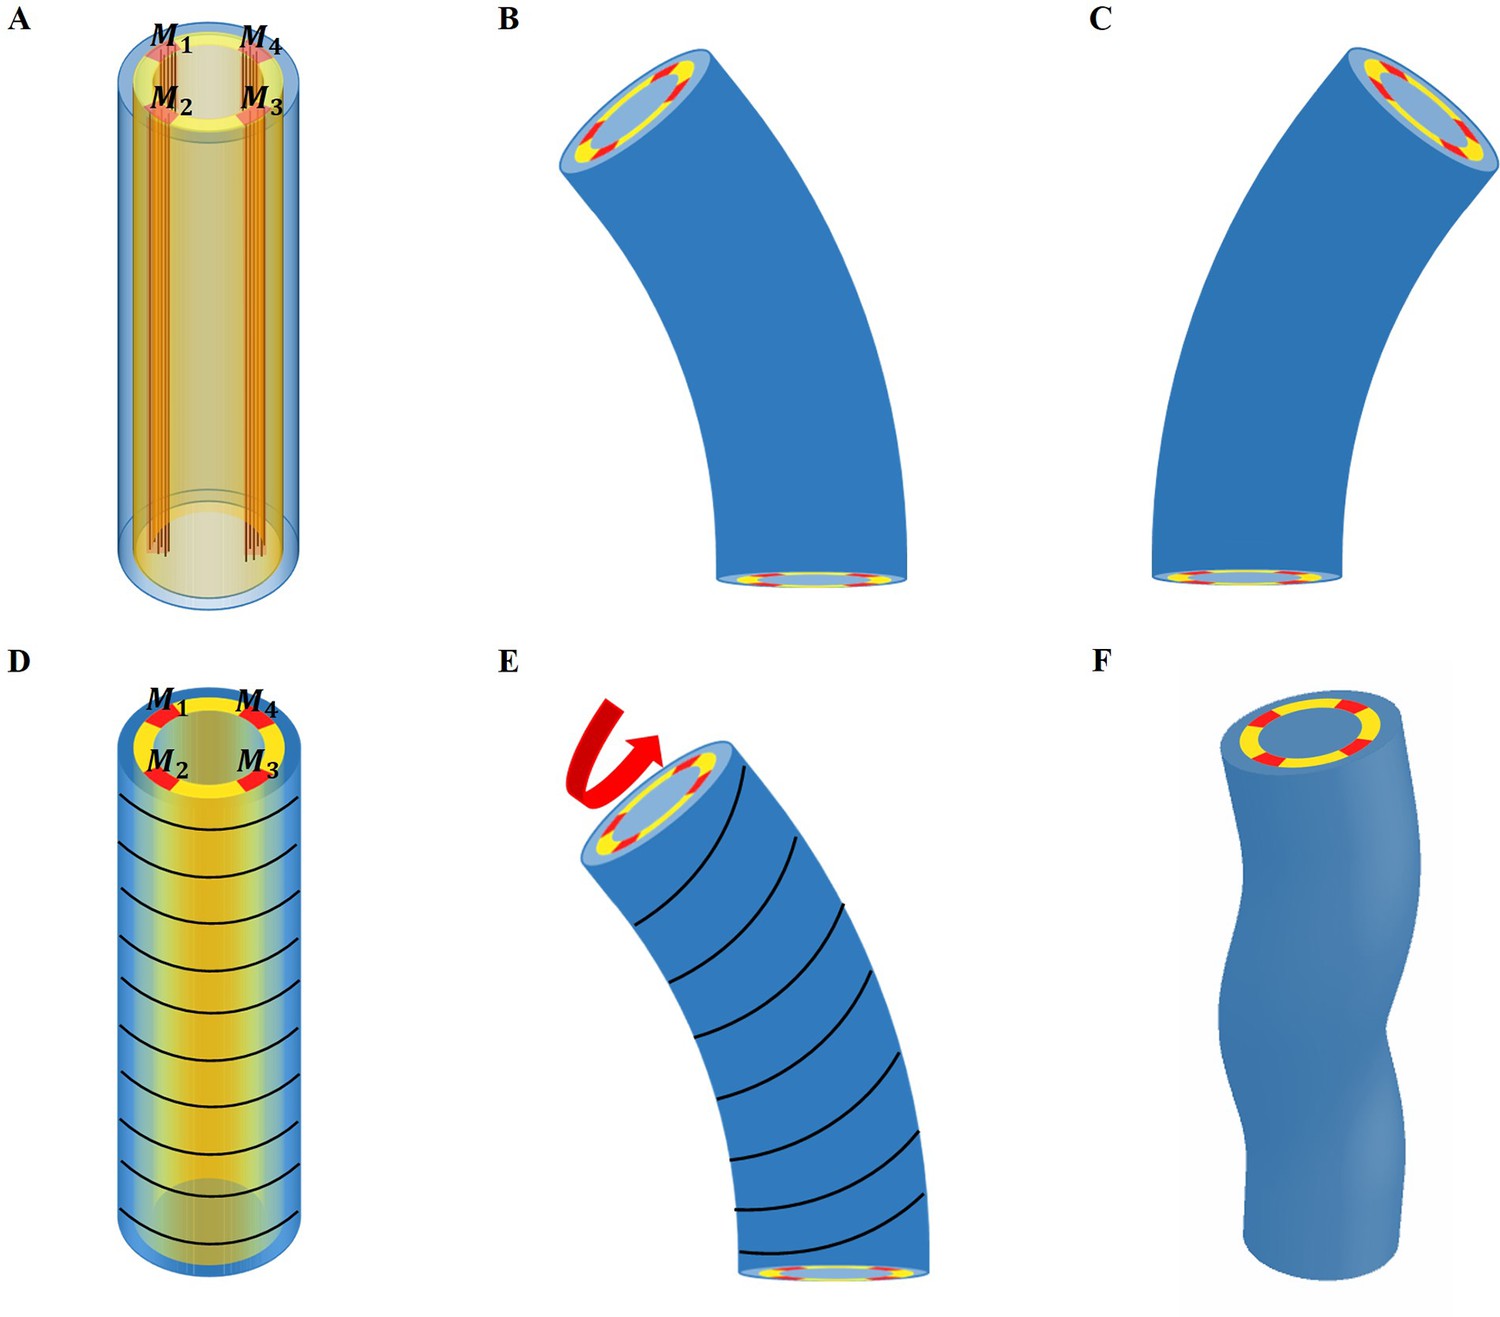
Schematic representation of the model deformation under activation.
(A) Schematic diagram of C. elegans muscle fibers and its cross-section, and it does not show the actin fibers. There are four muscle bands that exist in the yellow layer. However, the yellow region is not an actual tissue layer and it is only used to define the position of the muscles. (B) Deformation diagram, left side muscles and are activated. (C) Deformation diagram, right side muscles and are activated. (D) Schematic diagram of C. elegans actin fibers and cross-section. (E) Once the muscle is activated, the actin fiber orientation changes from the ‘loop’ to the ‘slope,’ resulting in torque. (F) Schematic diagram of torsional and bending deformation.
Figure 7
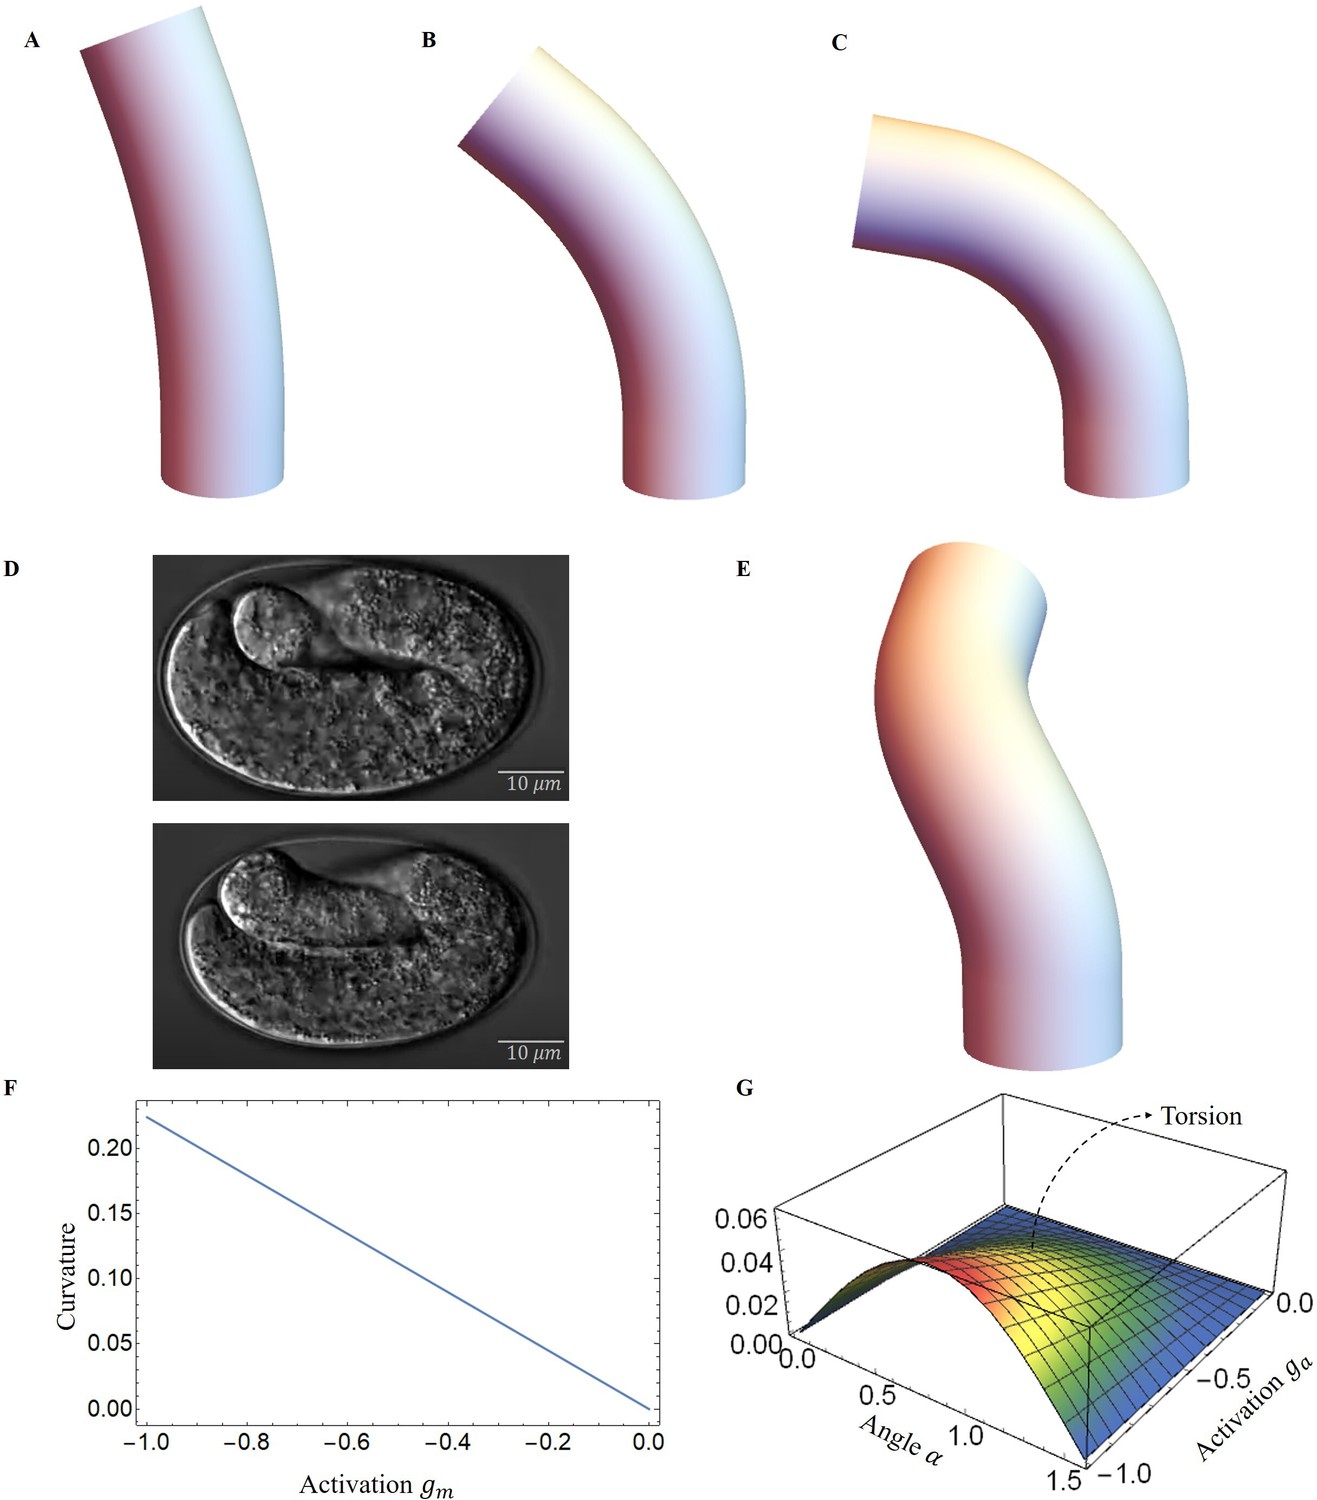
Deformed image of the model with activation changes.
Deformed configurations for different activation for muscles, (A) , , . (B) , , . (C) , , . (D) The graphs were captured from the Hymanlab, and the website: https://www.youtube.com/watch?v=M2ApXHhYbaw. The movie was acquired at a temperature of 20°C using DIC optics. (E) , , . (F) Curvature is plotted as a function of muscle activation. (G) Torsion is plotted as a function of the actin activation and angle of actin fibers.
Figure 8
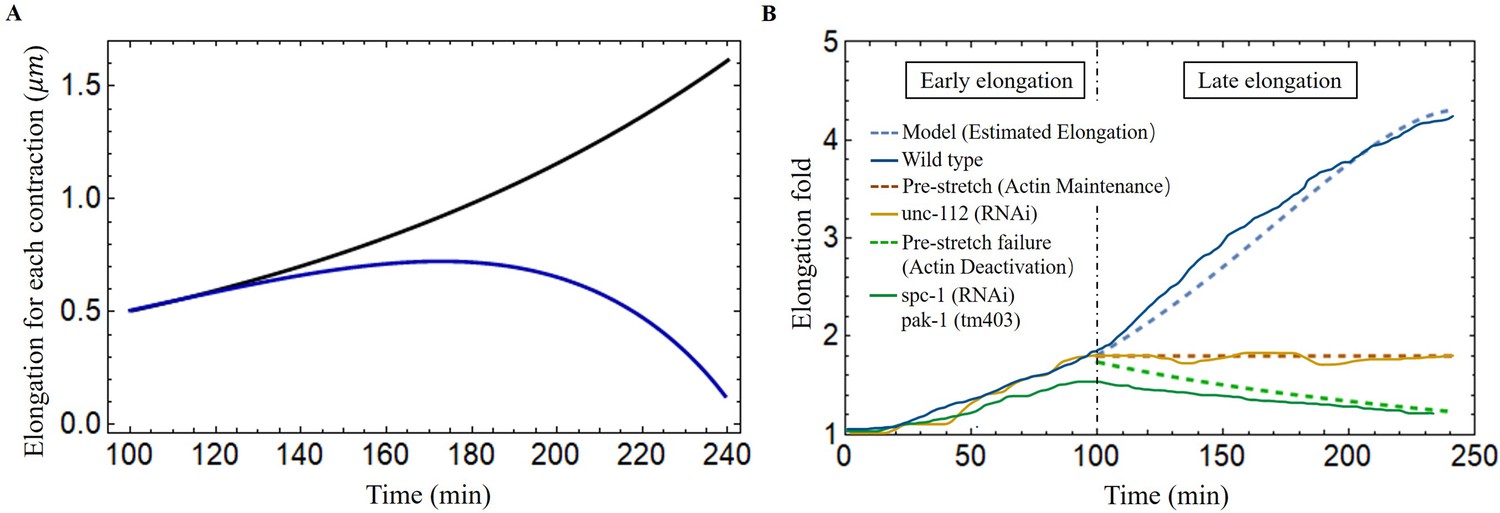
Late elongation predicted result for the C. elegans model.
(A) The elongation for each contraction varies with time. Black line: all energy converted to the elongation, blue line: partial energy converted to the elongation. The activation: , . (B) The model predicted results agree well with the experimental data of wild-type and different mutant C. elegans embryos (Lardennois et al., 2019). Activation of the wild-type model (blue dashed line): , . The activation of unc-112(RNAi) (brown dashed line): , . In the case of pre-stretch failure (green dashed line), decreases from 1.8.
Appendix 2—figure 1
Simplified cross-sectional model with four scattered muscle sections simplified to thin layers (, , , ).
Appendix 5—figure 1
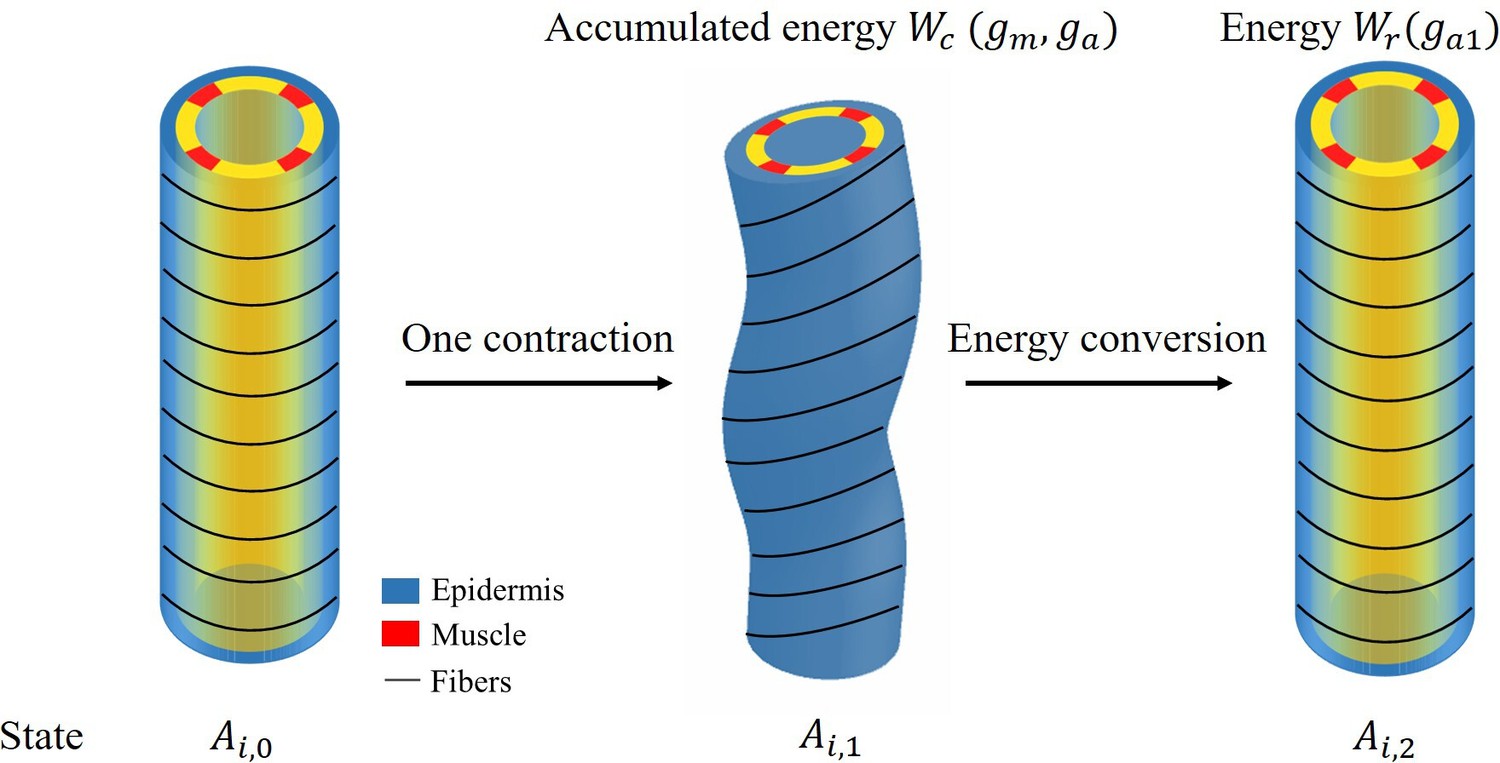
Schematic diagram of energy conversion.
Tables
Table 1
Adopted real size parameters of the C. elegans (Vuong-Brender et al., 2017a; Ben Amar et al., 2018).
| Initial | 1.8-fold | |
|---|---|---|
| Radius | 11.1 μm | 8.2 μm |
| Length | 50 μm | 90 μm |
Appendix 1—table 1
Parameters adopted in this work.
| Geometry parameters | Normalized radii* | =0.7 | =0.8 | =0.96 | =1 |
|---|---|---|---|---|---|
| The location of muscles† | |||||
| Material parameters (Shear modulus) ‡ | Actin part | ||||
| Epidermis part | |||||
| Muscles | |||||
| Soft inner part |
-
*
The radii are extracted or inferred from the Ben Amar et al., 2018; Lardennois et al., 2019.
-
†
The position and size of the muscles are inferred from the Moerman and Williams, 2006; Lardennois et al., 2019.
-
‡
The units of the shear modulus are the and is scaled by the epidermis one. It gives for the muscle, a value consistent with the muscle shear modulus proposed in Denham et al., 2018.
Additional files
Download links
A two-part list of links to download the article, or parts of the article, in various formats.
Downloads (link to download the article as PDF)
Open citations (links to open the citations from this article in various online reference manager services)
Cite this article (links to download the citations from this article in formats compatible with various reference manager tools)
Cyclic muscle contractions reinforce the actomyosin motors and mediate the full elongation of C. elegans embryo
eLife 12:RP90505.
https://doi.org/10.7554/eLife.90505.3


